Author Archives: rajani

Uncovering Communication Messages for Health Promotion: The Case of Arthritis

DOI: 10.31038/IJOT.2019215

Abstract

We introduce the science of Mind Genomics to the study of large sets of messages, specifically those found on the Internet and dealing with arthritis. Through experimental design, we create small sets of 25 test combinations, comprising 20 messages in different combinations of 2–5 elements. We use the experimental design to estimate the contribution of each message to interest. We then extend the estimated contributions to elements that were untested. This approach enables us to assess how 170 different messages about arthritis appeal to the general public, and reveals four new emergent mind-sets, responding to different types of messages. We then introduce a tool, the Person Viewpoint Identifier (PVI), allowing a medical professional to assign a new person to the appropriate mind-set, setting up a knowledge base for more effective messaging for health-promotion, and more person-compatible treatment.

Introduction

Arthritis causes persistent pain, distress, and disability [1, 2]. The symptoms of pain, disability, and depression appear to increase with age, and their prevalence may be underestimated [3]. Arthritis patients of all ages complain of five physical symptoms comprising pain, stiffness, fatigue, joint cracking, and swelling, respectively. These symptoms negatively affecting their decisions about performing functional routine activities, their mood and their well-being [4]. Arthritis is becoming more prevalent among the young as well. Younger arthritis patients complained about physical “slowing down” and cognitive and emotional changes [5]. Arthritis patients report psychological challenges such as depression, helplessness, and anxiety, conditions which significantly impacting their life quality [5, 6].

The power of arthritis, a long-term condition, affecting patients’ physical health status, patients’ mental well-being, and increasing public and private healthcare expenditures, makes it important to improve self-management of arthritis [7]. Yet, self-management is complex, requiring both medical knowledge and patient-centered knowledge [8]. Self-management of one’s illness requires patient trust in physicians [9]. What is emerging is the need for the patient to understand himself or herself at a deeper emotional and intellectual level. This knowledge will reveal what is important. The knowledge should create an empowered patient who is a partner together with the doctor through an ongoing process, effectively maintaining the mental and physical welfare of the individual [10].

Arthritis patients reported that physicians attributed their symptoms to age, and all-too-often made no recommendations to manage symptoms, actions which lead to patient frustration, uncertainty, and loss of trust in the physicians [4]. Loss of trust leads to lack of adherence [11]. Reports suggests that quite often, patients are not given the relevant and necessary information on support, resources, and ‘tips’ about how to self-manage their illness [5, 12]. Moreover, patient experiences, perceptions, and expectations in arthritis are not understandable [4, 13]. Insights from patients’ perspective is required but has been neglected [14].

The complicated nature of arthritis means that the patient must be ‘taught’ a variety of different types of information. Some of the factors in self-management of chronic illness may be related to lifestyle (e.g., diet, sleep). Other information may be related to activities, exercise programs, occupational therapy, and so forth. A literature search indicates that patients were unaware of advice on exercise or weight control, and did not access the available services in a productive manner [15, 16]. Furthermore, only half of the patients received physiotherapy, although many expected such physiotherapy to be easily available [17]. None of the patients were aware of occupational therapy and expected their care to be proactive rather than reactive [17].

Arthritis patients perceived arthritis as a low priority of health care systems and complained about the scarcity of specialists dealing with arthritis. They also expressed a need to talk for a longer time with physicians [16, 17]. Finally, patients expressed anxiety because they perceived a lack of good and understandable information by which they could make judgments [17]. Patients claimed that they need more information to allow them higher control resulting in self-management of their arthritis [9]. Patients wanted tailored information about the disease, advantages, disadvantages of treatment and medication without having to specifically request it [18–21]. This lack of information confirms findings of previous studies [22–24].

The Internet presents the largest publicly available source of messaging to arthritis sufferers. Our study tests what messages arthritis suffers find most compelling, and how to drive the right communication to the arthritis sufferer, based on mind-set. Appropriate messages, correctly targeted, may promote well-being and trust in physicians leading to higher self-management of illness.

This paper focuses on perceptions and expectations of arthritis patients, based upon reactions to messages about arthritis ‘scraped from the Internet. Understanding patient perception and expectations is imperative for health services. Such information promoted better communication messages and services. The result is that the patient receives the necessary information, and the health-care system empowers the patient to participate in the self-management of arthritis [17].

Asking Versus Experimenting

Asking questions of respondents about their preferences and beliefs has been a tradition in research since the field began in earnest in the 1950’s. A great deal of our knowledge of what people want in fast-moving goods and services including in health services and in medicine, has emerged from the analysis of often agonizing-detailed studies. Indeed, one might use the metaphor of ‘warehouses filled with data, ’ and not be very off the mark.

Two newer approaches have emerged to understand the rules of choice. The former, tracking behavior, is an increasingly large proportion of consumer research as of this writing (2019), with the field replete with good data, but also replete with consumer and legal reactions against the suggested invasion of privacy. Indeed, tracking people’s behavior and the ownership of such data is an increasingly contentious area world-wide, leading to many lawsuits, and in the case of Europe, leading to regulations about privacy.

The second new approach is experimentation, made very easy on the Internet. The notion is that one can understand the structure of consumer expectations and preferences through experiments. These experiments, motivated in part by the growth of the field called behavioral economics, suggests that we can learn a great deal by giving respondents concepts or vignettes and asking them to react to these concepts. By systematically varying the concepts (the test stimuli), and measuring the responses, it becomes possible to generate patterns, relating the responses to the antecedent stimuli.

Dealing with large numbers of messages through modeling and data imputation

One of the key issues for studying a large category of messaging, such as arthritis, is the richness of the information available. As electronic communication increases through the web, there emerges an extraordinarily large number of websites devoted to topics of general concern, and within those websites many messages. How does one run an experiment to understand which messages accord and which messages do not accord and finally when there can be upwards of 100 messages?

One simple way presents single messages to respondents, instructing them to rate the message, and of course rotating the order of the messages in order to reduce the fatigue and the boredom. The respondent may be instructed to rate only a subset of the messages.

The aforementioned approach, presenting single items, works when the messages tell a story, paint a word picture, and have ecological validity. In other words, testing single items, single ideas, works best when the messages make sense. The messages must comprise short stories within them. This requirement is met by many messages, but not met by messages which may be tag lines or messages which may be pictures support the general story but in themselves not relevant.

Moskowitz & Martin [25] presented the original science of Mind Genomics in a paper, where they introduced the notion of presenting a respondent with a set of systematically varied concepts, estimating the coefficients from models created after relating the elements or messages in the concept to the response, and then, most important, estimating the coefficients of elements untested by that respondent. In other words, the approach enabled the researcher to estimate the impact of a message, and use a form of numerical analysis, data imputation, to estimate the value or coefficient of untested elements. The reader is referred to that paper for full details. Below is a simplified explanation:

  1. Each of the test elements is profiled on a set of three non-evaluative bipolar scales (semantic differential scales)
  2. Each test element has a set of eight closest neighbors, defined by the Euclidean distance between the pairs of elements. The Euclidean distance is defined in the normal way, using the scales on which the elements were profiled
  3. Each respondent evaluates two sets of 20 elements, combined into 50 vignettes, according to an underlying experimental design.
  4. The ratings are transformed, so that a rating of 1–6 is transformed to 0, and a rating of 7–9 is transformed to 100. A small random number (<10–5) is added to the rating. This small number does not affect the results, but ensures that the regression analysis below ‘runs, ’ even in those situations where a respondent confines all ratings to 1–6 (transformed to 0), or the respondent confines all ratings to 7–9 (transformed 100.) The small random number ensures variation in the dependent variable, necessary for the regression not to ‘crash.’
  5. The ratings are deconstructed into the part-worth contribution of the 40 elements using OLS (ordinary least-squares) regression. The regression generates coefficients.
  6. At this first step, those elements not tested are assigned a value of 0. When an element was tested, its value is the coefficient estimated in Step 5.
  7. Starting from the first element to the element (including text and visual elements), the algorithm goes through the set of elements. The algorithm looks at each element, one element at a time. When the element had been tested by the respondent, then the element coefficient is unchanged. When the element had not been tested by the respondent, the element coefficient (starting with 0 at the beginning) is replaced by the average coefficient of the eight nearest elements defined in Step 2, above.
  8. The algorithm goes through the respondent’s data until it reaches a point when the coefficient of untested elements no longer materially changes (<.001 change). The process stops when all untested elements stop changing, and the coefficients have stabilized to their estimated values.
  9. The coefficients are then averaged.
  10. For each respondent, the process provides a conservative estimate of the coefficients of the elements, tested and untested.

The Arthritis Study

The objective of this study was to understand what specific messages from a set of 170, taken from web-pages, were most appealing to respondents in the general population of those defining themselves as suffering from arthritis. The messages were ‘scraped’ from sites featuring discussions of arthritis. The messages were taken from then-current websites, during the early years of the 21st century. The fact that the elements are more than a decade old is irrelevant to the study because the focus is on the types of messages which interest consumers. The web-sites are simply sources of messages, with such messages crafted by those who are involved with arthritis. The websites are transient, changed often, and thus simply a momentary embodiment of messages and pictures which the website owner believes will educate, convince, and even on occasion ‘sell’ a product.

Table 1 show 10 of the 11 websites that were ‘scraped’ to provide the set of 151 text elements and 19 visual elements. (The 11th website was simply text, and from a user-group.) The messages were slightly edited to make them shorter, and easier to read. Every effort was made to keep the original sense of the message

Table 1. The ten websites and a representative element from each website after the slight text editing

Website

Example of message ‘scraped’

1

http://www.arthritis.about.com/health/arthritis/

Contains a Glossary of terms used in rheumatic diseases

2

http://www.arthritis.com/

The path to a healthy lifestyle

3

http://www.arthritis.org

Ask our fitness and nutrition expert any questions you may have

4

http://www.arthritiscentral.com/

Ask our experts any question at the oldest & largest free Q&A service on the Internet

5

http://www.arthritissupport.com

Contains information about diagnosis and treatments

6

http://www.mediconsult.com

These guides will help you find information fast

7

http://www.mediconsult.com

Order free brochures or buy an exercise tape in the Arthritis Store

8

http://wwmerck.com/health/

We recommend that before you start any exercise program, it is important that your physician examines you to see which types of exercise would be best for you

9

www.drkoop.com

Arthritis Advocacy Priorities – Read about the issues

10

www.webmed.com

Browse through the latest books and newsletters

In order to estimate the coefficients of elements untested by each respondent, a small group of five respondents, none of whom would participate in the large study, profiled each of the 170 elements, text and pictures on eight bipolar scales. This exercise allowed us to identify the eight closest neighbors of each element, using the eight bipolar scales (profiling) as dimensions. The use of eight bipolar scales and the eight closest neighbors is simply happenstance, and not a deliberate conjunction of scales and distance.

Table 2 shows an example of pairs of elements which are most separated on three of the eight scales. For example, for the bipolar scale ‘beginner versus experienced, ’ the lowest rating on the bipolar scale (3.8) is ‘Your personalized program can help you learn how to make informed decisions about your treatment options.’ In contrast, on the same scale, the highest rating is 6.8. ‘We recommend that before you start any exercise program, it is important that your physician examines you to see which types of exercise would be best for you.’

Table 2. The highest and lowest text elements on three of the eight bipolar semantic scales. Each element was profiled on all eight scales.

1-Beginner Vs 9-Experienced

Your personalized program can help you learn how to make informed decisions about your treatment options

3.8

We recommend that before you start any exercise program, it is important that your physician examines you to see which types of exercise would be best for you

6.8

1-Less Vs 9-More Active


Find information on your daily calcium need to keep your bones healthy

3.7

Read our Questions and Answers about arthritis pain

7.8

1-Occasional Versus 9-Chronic

Print out your meal plan and follow it to a new you…recipes and a shopping list are included

4.2

Learn your pain medicine risk profile

7.8

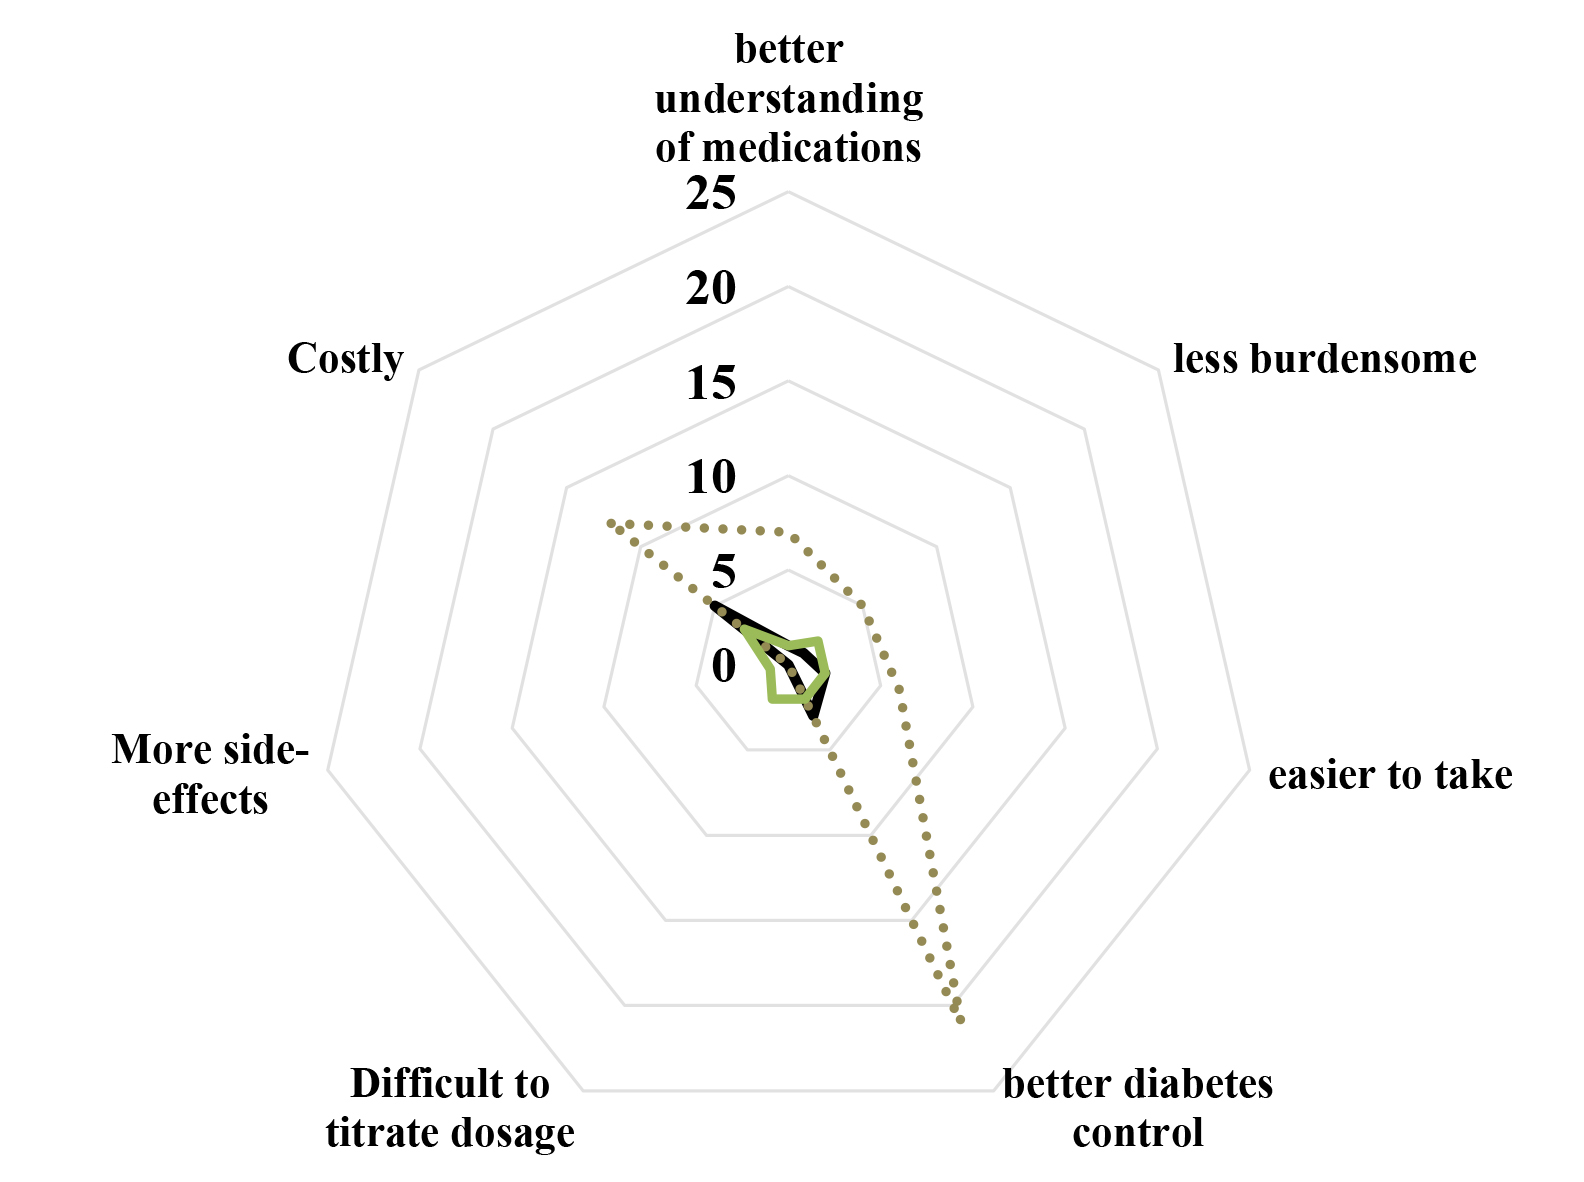
Although the up-front semantic profiling was done as a preparatory step to estimate the coefficients of untested elements, a second use of the semantic profiling quickly emerged. One could get a ‘sense’ of the nature of the various websites by plotting the distribution of scores for each website, on each bipolar scale. Figure 1 gives a sense of how the various websites focus on one tonality (beginner vs experienced) in their messaging.

Mind Genomics-007 IJOT Journal_F1

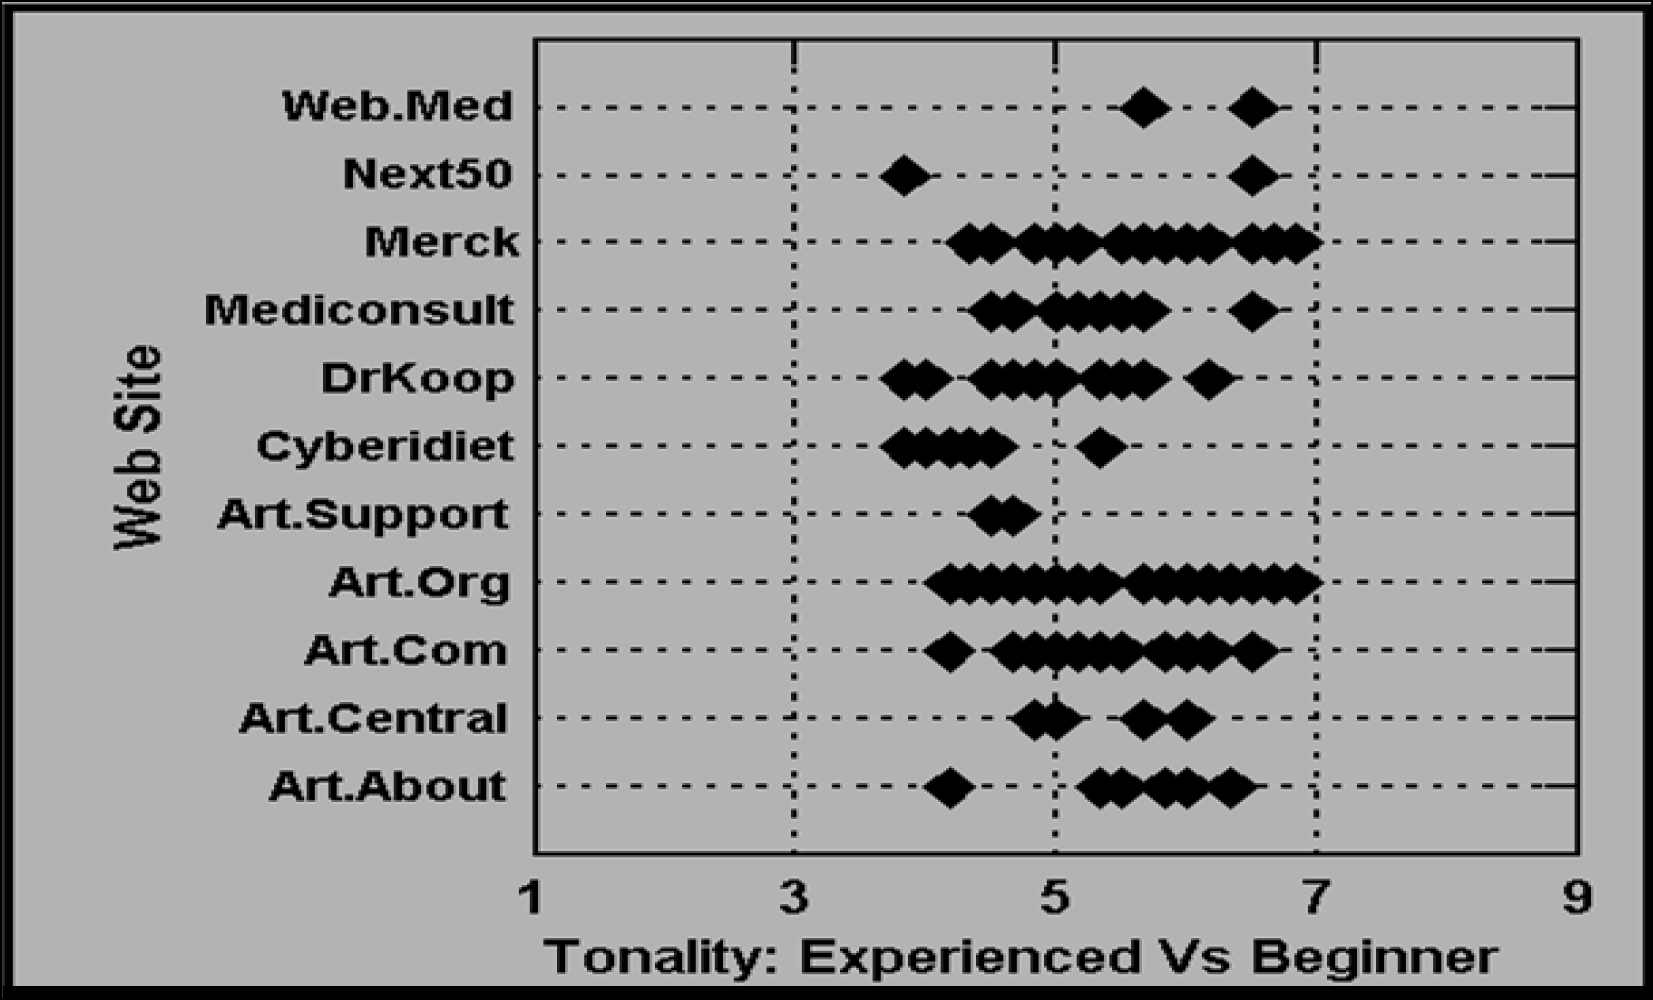
Figure 1. How the text elements score on the semantic differential scale of ‘for beginner vs for experienced’. Each website presents a variety of different messages

Measures

Silos, Elements and Experimentally Designed Vignettes

The elements were classified into silos, or groups of related elements. By related we mean that the elements in a group shared something in common, and if put together could contradict each other. The structure of silo and element is a bookkeeping tool, one which facilitates critical thinking. The act of putting elements into silos based upon meaning forces the researcher to think more deeply about the structure of the information that is being communicated. Table 3 presents two examples from each silo. The actual sorting of elements into silo is a subjective matter. From a statistical point of view, the assignment of elements to silos has only a minimal effect on the analysis of the results later, through OLS (ordinary least-squares) regression.

Table 3. The 10 silos, and examples of two elements from each silo

AD – Organization

AD01

A portion of all proceeds will benefit the Arthritis Foundation

AD – Organization

AD09

Fight for more research funding, insurance coverage for medications and the rights of people with arthritis

CM Communication

CM01

Read ‘A Day in My Life’…stories are submitted by Community Members, and are first-person accounts of what it is like to live with a disease or condition

CM Communication

CM22

The message board is a great way for you to exchange ideas, thoughts, and express yourself

EB

Self-manage

EB01

Manage your arthritis and improve your life

EB

Self-manage

EB11

Learn ways to prevent injury-related arthritis … prompt treatment can avert serious damage

EX

Experts

EX01

Ask our experts any question at the oldest & largest free Q&A service on the Internet

EX Experts

EX09

A site produced and supervised by Board Certified Rheumatologists, your specialists in Arthritis and Osteoporosis

GI General information

GI01

View our online checklist on how to monitor medication use for seniors

GI General

Information

GI27

Up to date research on the aches and pains of arthritis and the effective homeopathic medicines

NE

Nutrition

NE01

Eating a healthy, balanced diet is important for everyone, but particularly for people with arthritis

NE

Nutrition

NE17

Find information on your daily calcium need to keep your bones healthy

PR Privacy

PR01

Learn more about the new ‘Speaking of Pain’ program, and find out how you can request a free brochure

PR Privacy

PR12

We will never share your personal information with any external organization without your consent

RS Resource Info

RS01

Click here for comprehensive information about your health

RS Resource Info

RS17

The Manual of Medical Information transforms the language of the professionals’ version into commonly used English

SH ShoppingHH

SH01

Buy all your arthritis-care products here in the online store. Just click on a product link to browse hundreds of items

SH Shopping

SH06

Refill your prescriptions, find drug information and check drug interactions at the online pharmacy

WF Wellness Fitness

WF01

Take three or more health quizzes and enter to win a free tee-shirt

WF Wellness Fitness

WF18

Your personalized program can help you learn how to start and maintain a fitness program

Each respondent evaluated two sets of 25 vignettes each, with each set comprising 20 elements combined into the 25 vignettes. A vignette comprised 2–5 elements, combined according to an experimental design (see Table 4 for a schematic for one respondent, and concepts or vignettes 1–6 of 25 vignettes created by design for that respondent.)

Table 4. Schematic of concepts (vignettes) for a respondent. The vignettes are created from a randomized four silos out of the full set of silos and elements. A ‘0’ means that the silo is absent from the vignette. A 1–4 means that one of four elements from the silo is present in the vignette.

Category

A

B

C

D

Concept

1

0

3

1

3

Concept

2

4

0

3

1

Concept

3

1

4

0

3

Concept

4

1

1

4

0

Concept

5

2

1

1

4

Concept

6

1

2

1

1

We can think of the design as a ‘menu’ which ensures that only one element from a silo could appear in a single vignette. The 20 different elements per set come to at most 40 different elements seen by a respondent. By design, within a vignette the elements are statistically independent of each other. Generally, when two or more designs are combined, as in the current study, the respondent sees a set of elements which end up being statistically independent. Statistical independence will enable the ratings to be related to the presence/absence of the underlying elements forming the vignette. In turn, the numerical analysis, imputation of the value of missing elements, will be made possible by the computational algorithm specified above, specifically Steps 5–10.

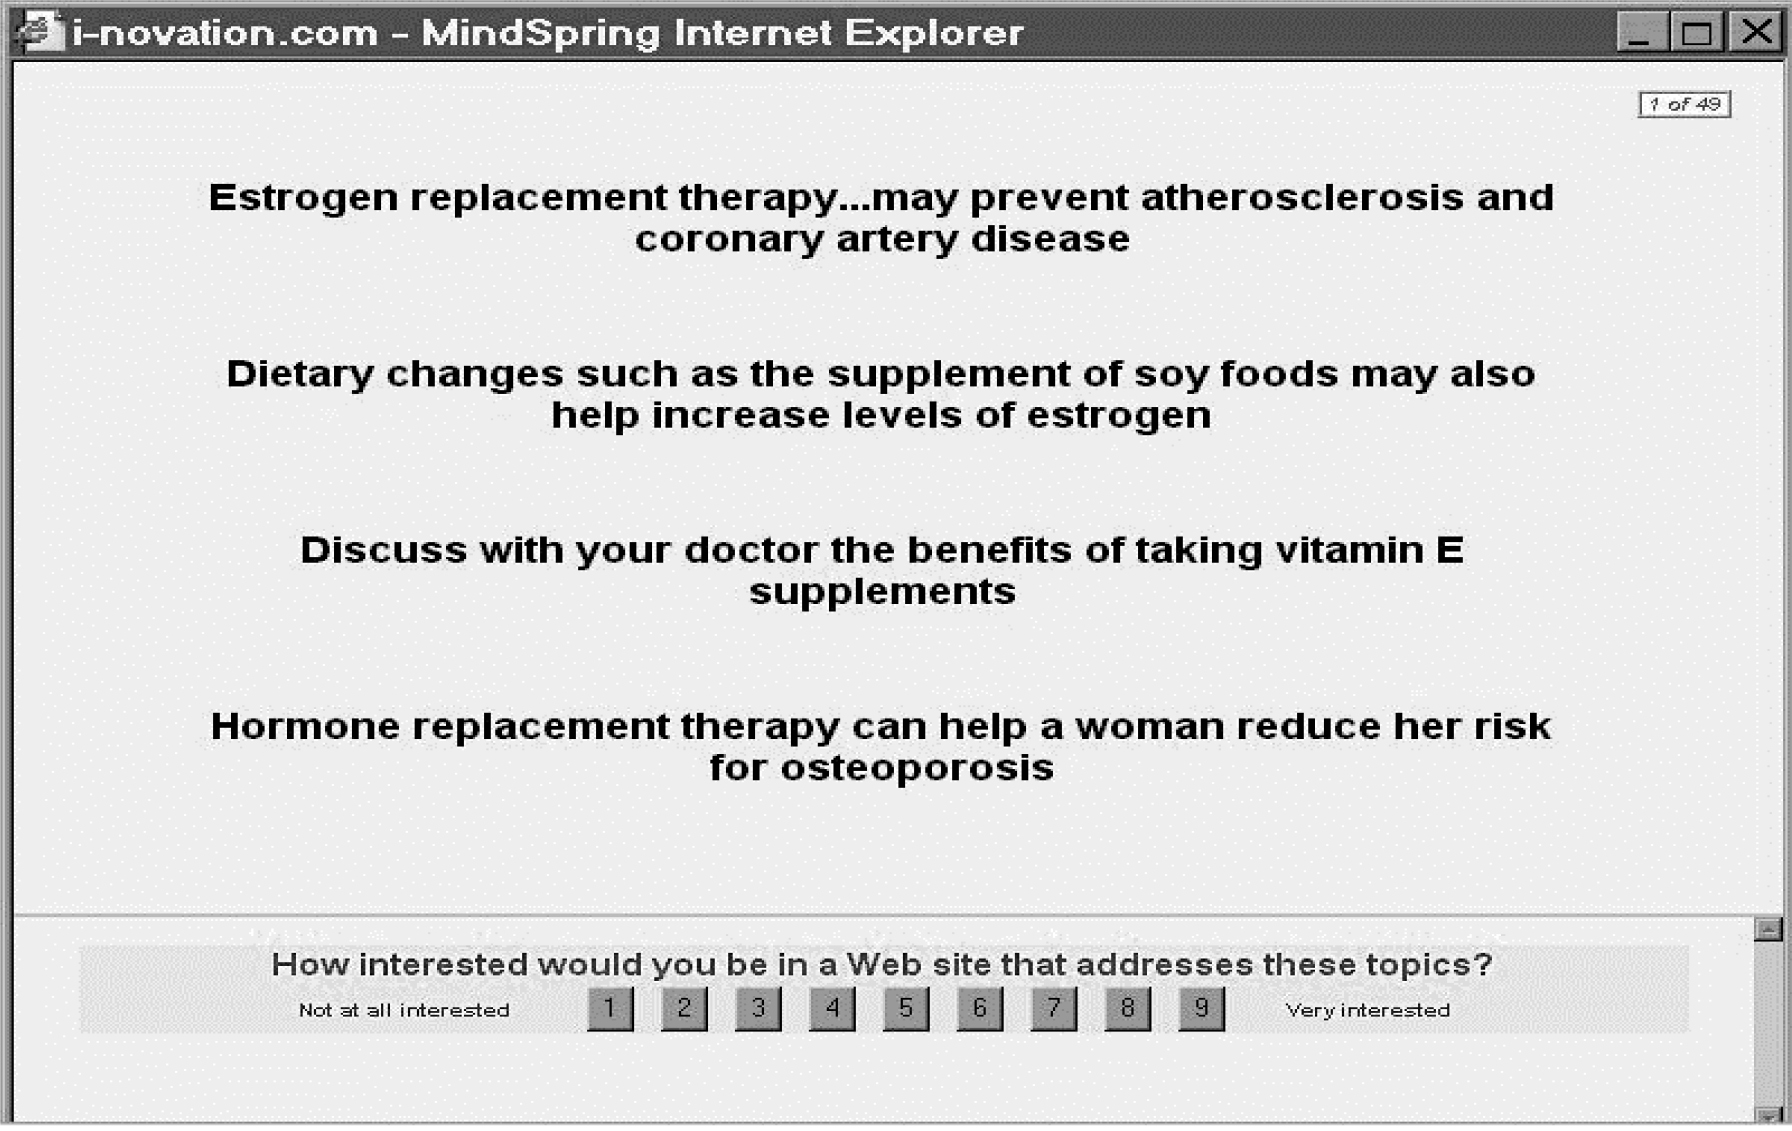
Two examples of vignette appear, respectively, in Figure 2 (all text), and in Figure 3 (one visual, the remaining elements are text.) The vignette is constructed ‘dynamically’ on the respondent’s computer, a process which makes the interview flow quickly, and is not onerous. The respondent need not wait for the transfer of screens from a host computer to the respondent’s computer.

Mind Genomics-007 IJOT Journal_F2

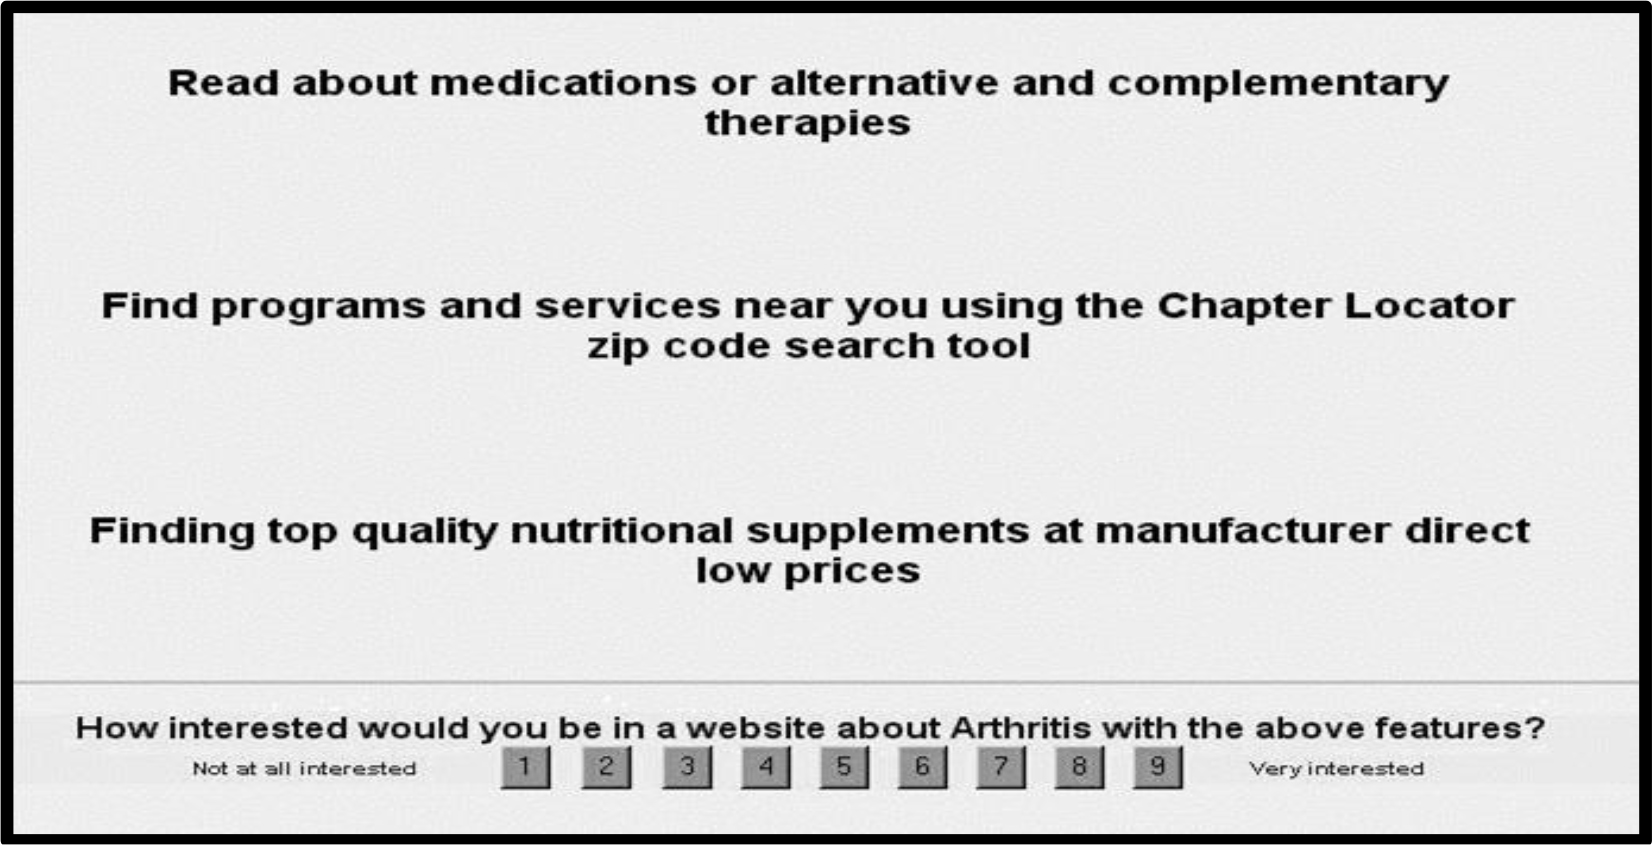
Figure 2. An example of a vignette comprising text only, with the rating scale at the bottom.

Mind Genomics-007 IJOT Journal_F3

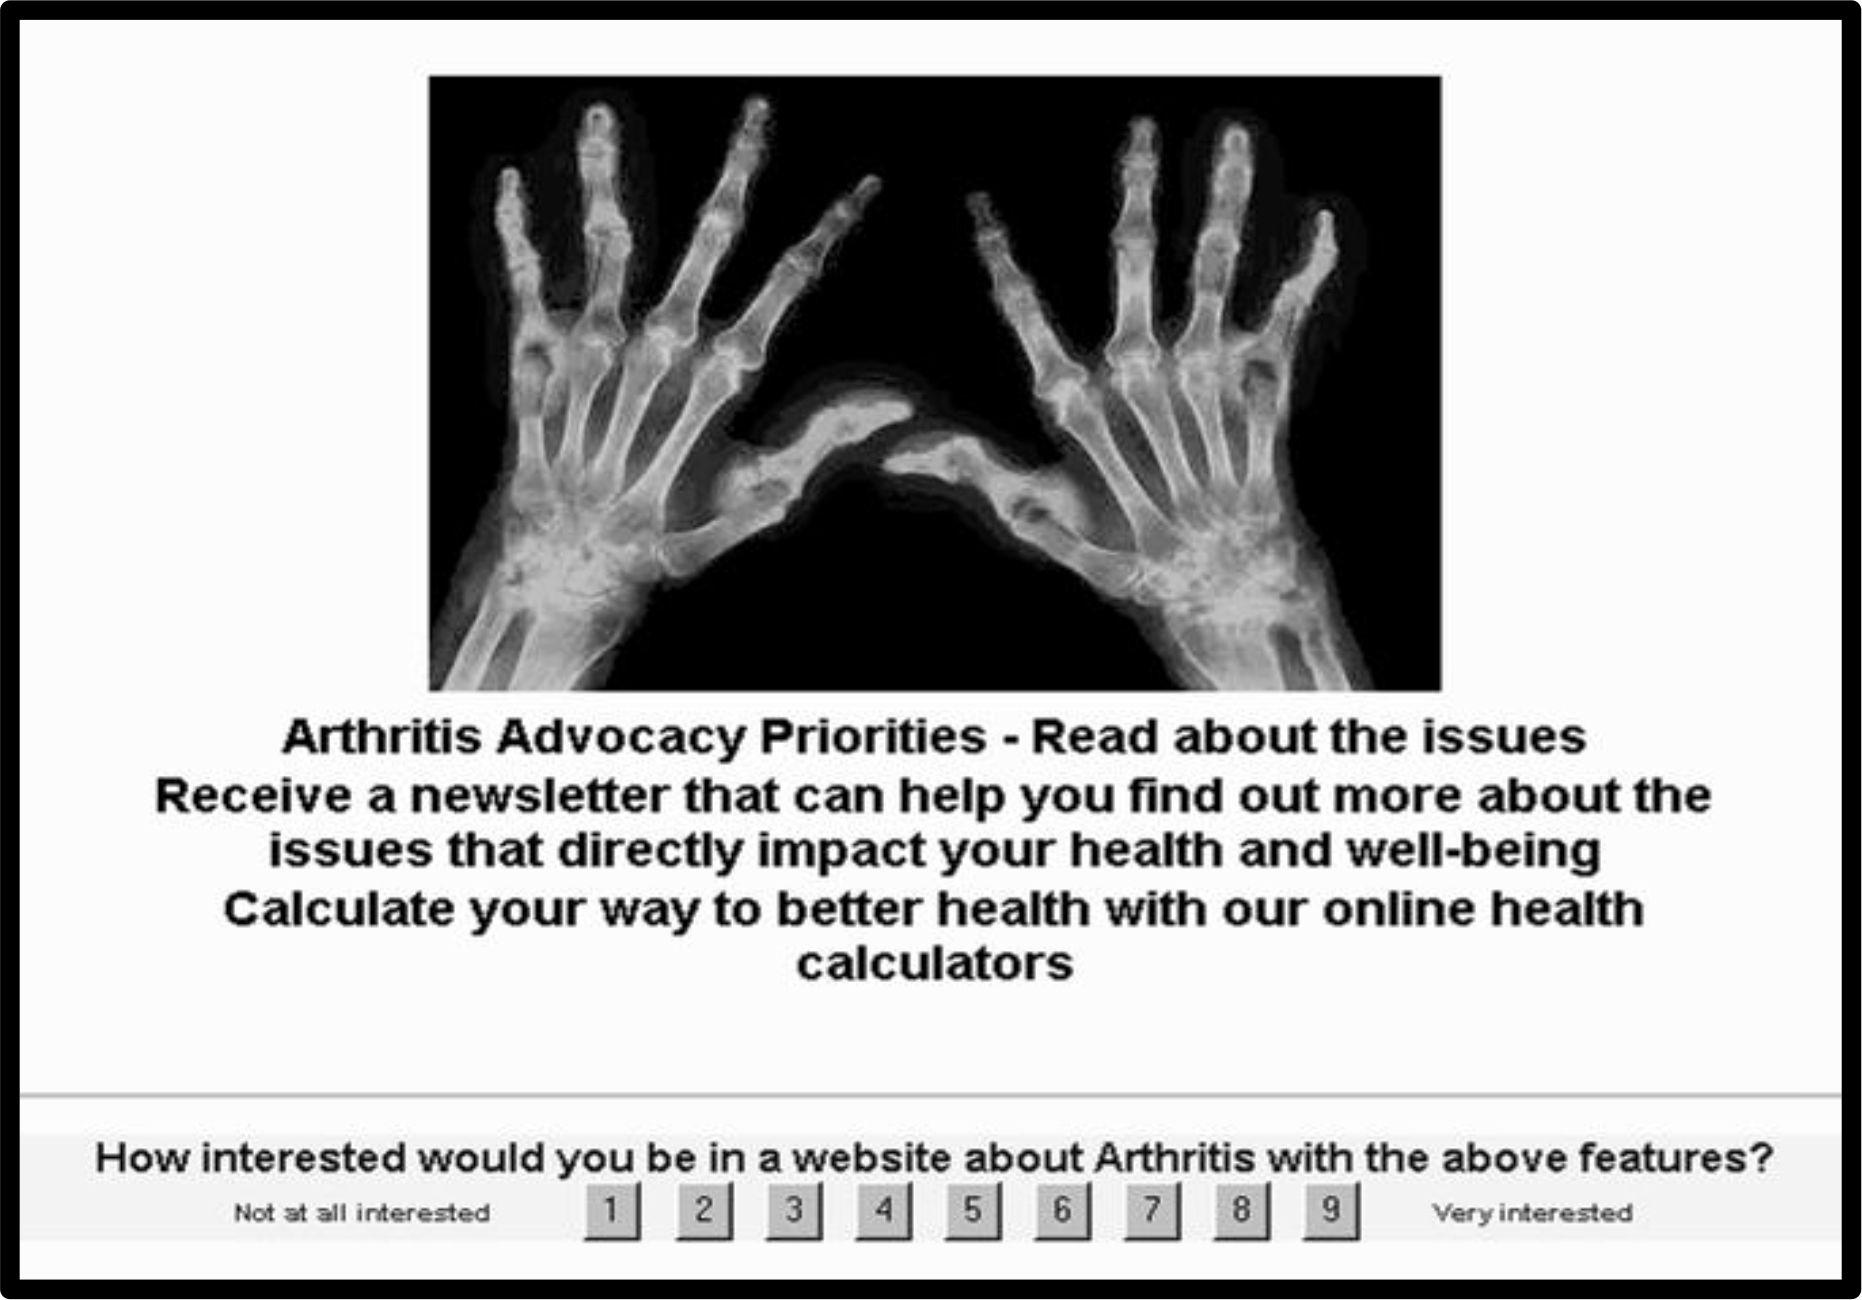
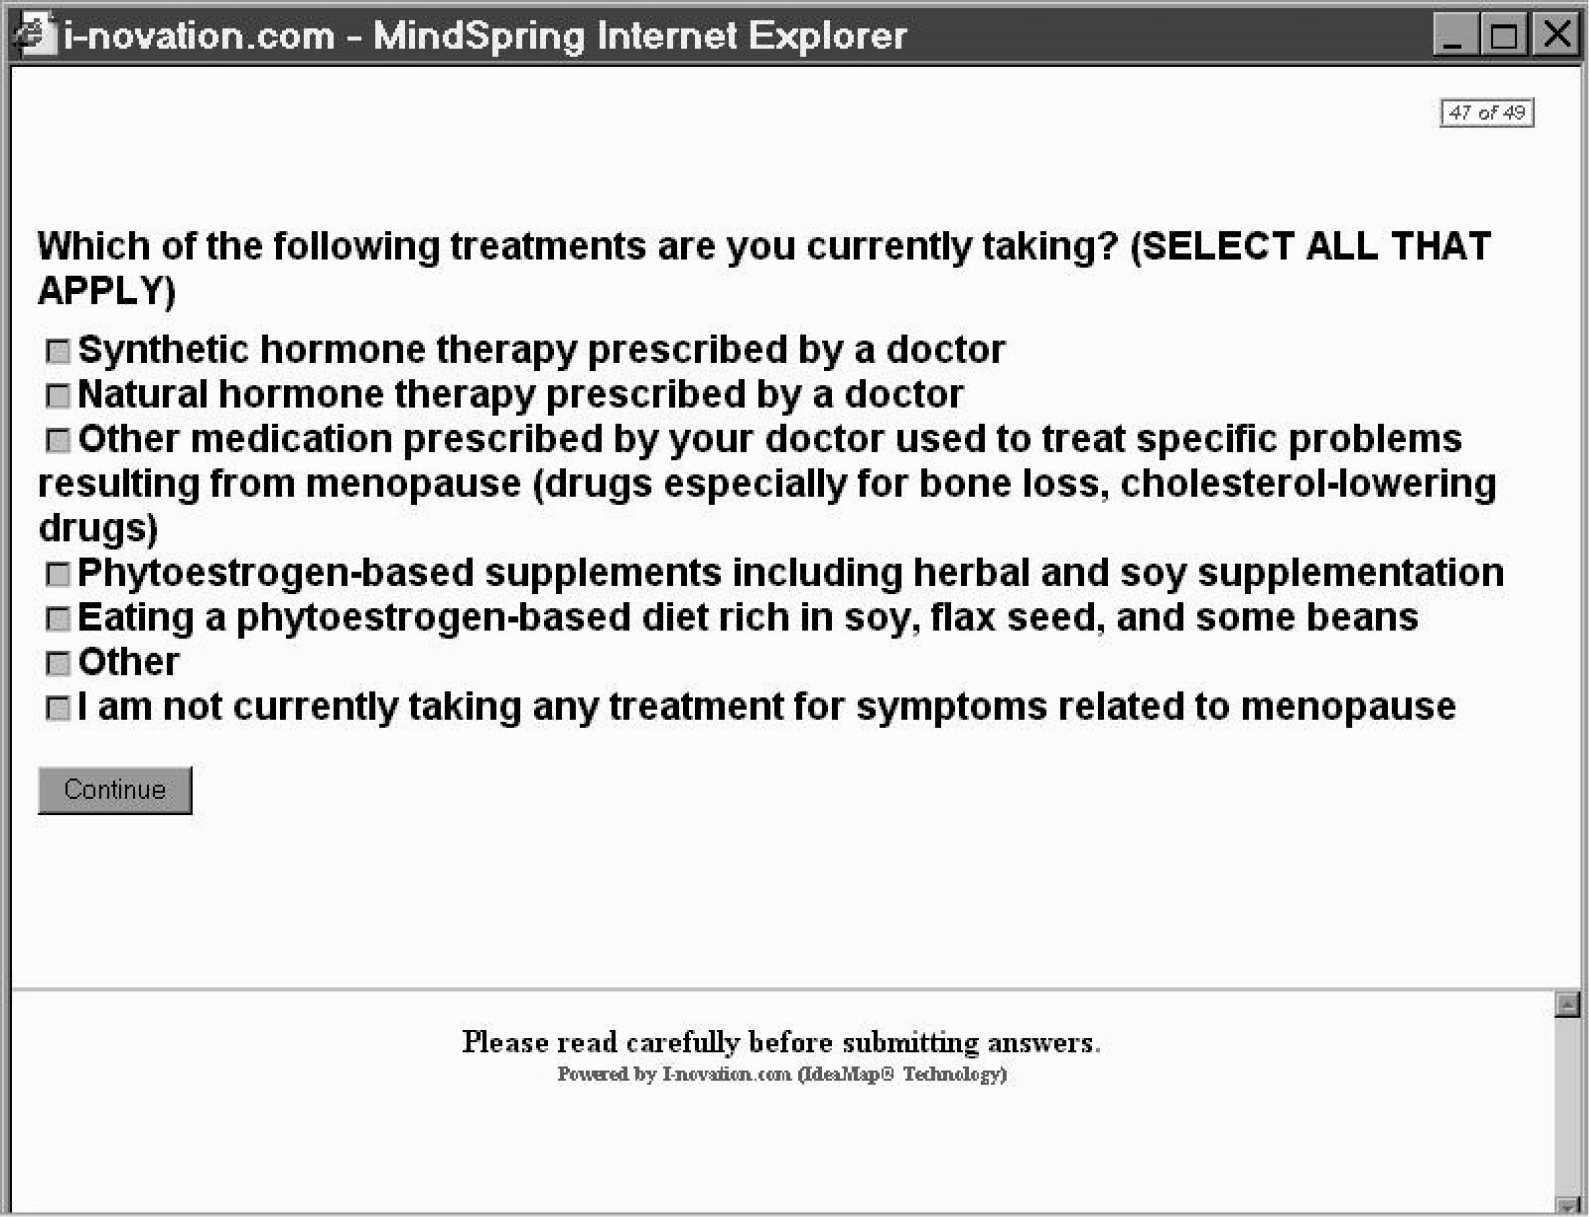
Figure 3. Example of a vignette, comprising picture, text, with the rating question at the bottom.

Procedure

Running the arthritis study on the Web

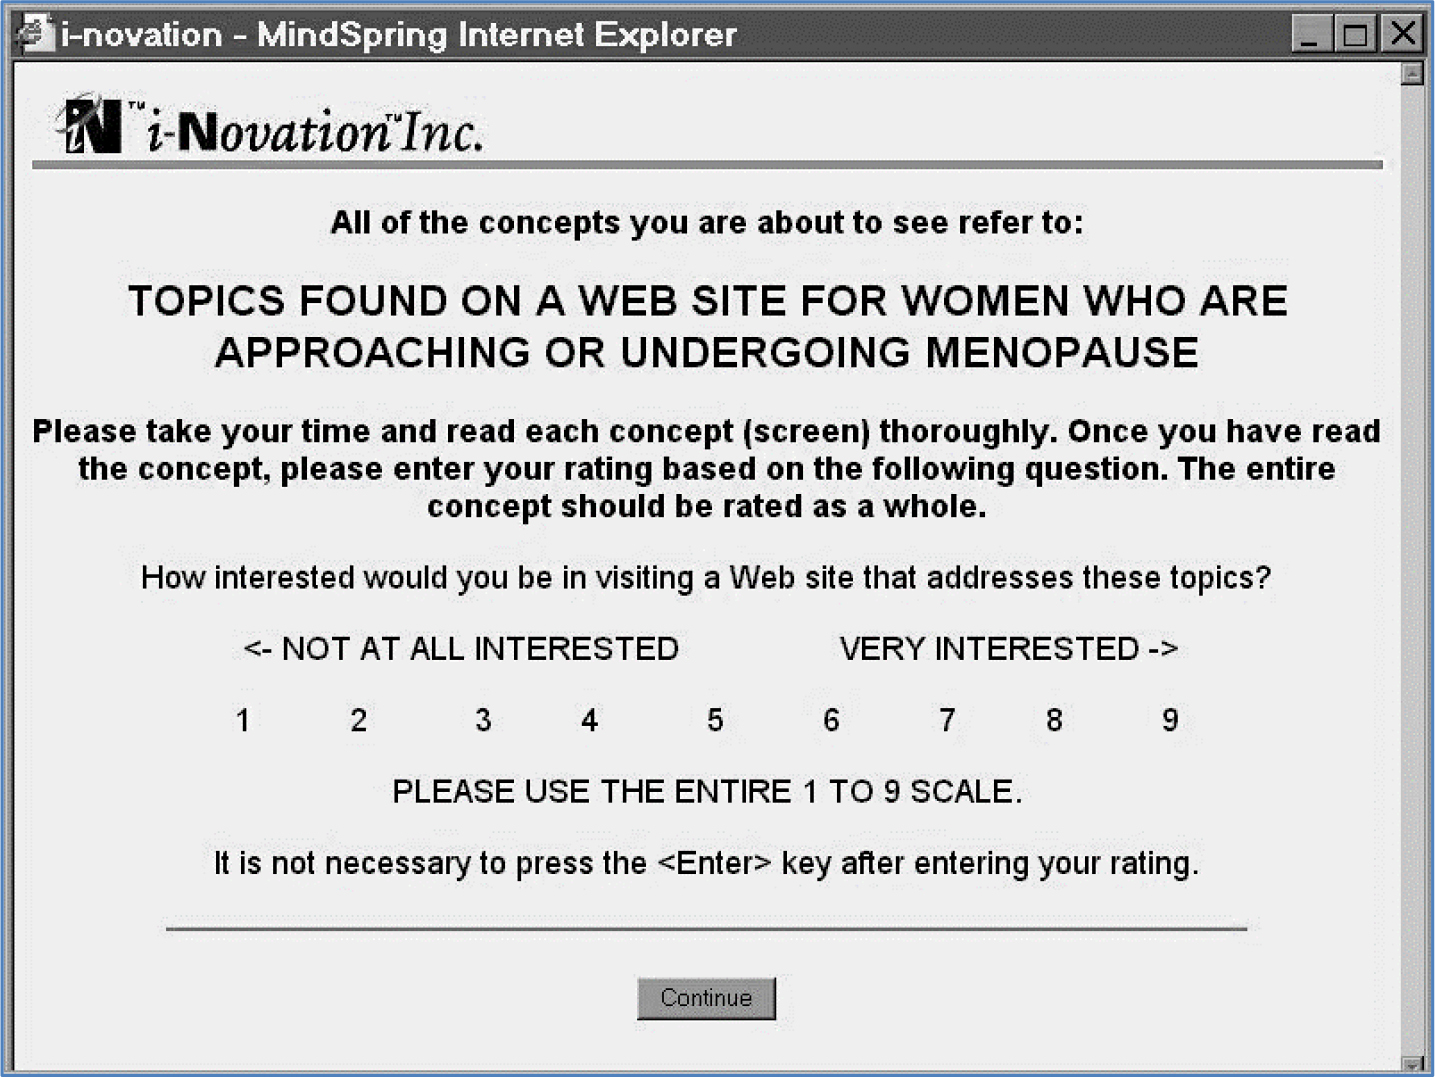
A great deal of consumer research has migrated to the Web, especially studies which do not involve the evaluation of several products in a short, sequential format, such as so-called ‘taste-testing.’ The Mind Genomics approach set up for this and related studies are perfectly adapted for the Web. Respondents who agree to participate first see an introductory screen (Figure 4), which tells them a little about the study, and what is expected of them. The less that one says about the purpose of the study, the better the study results, because it will be the elements, the specific messages, which drive the ratings.

Mind Genomics-007 IJOT Journal_F4

Figure 4. The orientation page for the arthritis study

Sample

The panel comprised 144 individuals who reported that they have arthritis, or arthritis-type pain. The respondents were recruited by a Canadian panel provider, Open Venue, Ltd., which specialized in the recruitment of respondents for these studies, and especially the recruitment of respondents who satisfied specific screening. Table 5 shows the distribution of the 144 respondents falling into the self-defined classification groupings.

Table 5. The distribution of the 144 respondents falling into self-defined classification groupings.


Total

Arthritis Med

Tylenol

Other Pain Reliever

Base size

144

26

63

83

Base – Column percent 

%

%

%

%

Health Status re Arthritis

Has Arthritis

80

96

79

76

Gender

Males

78

85

76

78

Females

22

15

24

22

Age

Under 35–54

52

50

60

54

55 and older

48

50

40

46

Usage

Arthritis Medication Users

18

100

17

17

Tylenol® Users

44

42

100

40

Other Pain Reliever Users

58

54

52

100

Information Source about arthritis

Doctor

89

96

86

89

Media

60

65

51

65

Web

51

38

44

54

Social Network

44

35

43

47

Print

56

54

48

53

Drugstore/Pharmacy

56

54

54

58

Results

How the elements ‘drive’ the response – the Mind Genomics model

Each respondent evaluated two independently created sets of 25 vignettes, or 50 vignettes in total. Each set of 25 vignettes comprised a unique set of combinations, structured so that the elements appeared an equal number of times against different backgrounds, and were by statistically independent of each other. The two foregoing features of Mind Genomics enables the data to be analyzed using standard, off-the-shelf statistical procedures, such as OLS (ordinary least-squares) regression.

The data matrix comprised 50 rows or cases. The independent variables were the eight elements, coded 0 when absent from a case, and coded 1 when present in a case. The dependent variable was the transformed rating, which took on the value 0 when the original rating was 1–6, and, in turn, took on the value 100 when the original rating was 7–9. The small random number added to the dependent variable ensured that the OLS regression would not crash.

The analysis generated an additive constant and eight coefficients, one for each element that the respondent tested. The values of the remaining coefficients, for elements not tested by the respondent, were estimated by the algorithm explicated above. The result was a ‘complete’ model for each respondent, comprising an additive constant, actual coefficients for tested elements, and estimated coefficients for untested elements. The coefficients emerging from the algorithm are conservative estimates of the true coefficients that would be obtained when the elements are directly tested. Thus, the results reported here can be considered as conservative. Any messages which score well, i.e., have very high positive coefficients, in fact, may be even more powerful messages than one might conclude from the data.

Table 6 suggests disappointing news. When we look at the data from the total panel of 144 respondents, we see an additive constant of 48, but very low coefficients. Respondents with arthritis are moderately interested in the messaging in general, but no message strongly drives interest. The answer may be in the subgroups that we can extract from knowing how the respondents describe themselves, but as we will see, the answer really emerges from the way the respondents think about the messages.

Table 6. Winning elements about arthritis from the total panel who are recruited to be arthritis sufferers.


Total Panel

(144)

Additive constant

48

NE14

We recommend that before you start any exercise program, it is important that your physician examines you to see which types of exercise would be best for you

5

GI11

Explore types of arthritis and treatments in the ‘Arthritis Answers’

4

NE11

We have great, healthy recipes, as well as information about vitamins, diet and medical conditions

4

The strongest performing element, across key groups of respondents

Table 7 shows the relevant parameters needed to interpret the results for total panel, key subgroups, and to-be-uncovered mind-sets. Even when looking at the self-defined subgroups, Table 7 shows that the strongest performing element for total panel does not perform particularly well when we look at the typical subgroups.

Table 7. How subgroups respond to the strongest performing element from the total panel (in bold italics). The table shows the subgroup, the base size, the additive constant from the model, and the estimated coefficient for the element (We recommend that…)

We recommend that before you start any exercise program, it is important that your physician examines you to see which types of exercise would be best for you http://www.merck.com/health/

Respondent subgroup

Base Size

Additive Constant

Element Coefficient

Total Sample

144

48

5

Gender – Males

112

51

6

Gander – Females

32

36

1

Age – 35–54

75

53

1

Age – 55 and older

69

42

9

Use – Arthritis Medication

26

50

0

Use – Tylenol®

63

49

4

Use – Other Pain Relievers

83

47

8

Information from – Doctor

128

49

6

Information from – Media

87

46

7

Information from – Web

74

53

7

Information from – Social Network

64

48

4

Information from – Print

80

50

3

Information from – Drugstore/Pharmacy

80

52

5

Condition – Has Arthritis

115

54

6

Mind-Set 1

41

69

-4

Mind-Set 2

32

53

-4

Mind-Set 3

25

39

10

Mind-Set 4

46

30

16

Base Size – Number of respondents falling into the group. At the end of the experiment, the respondent completed a short classification questionnaire, providing gender, age, and so forth. It is from this self-profiling classification that we obtain the subgroups. The mind-set segments emerge from the analysis, reflecting groups of individuals who respond similarly to the messages. Their results will be presented below. Some of the groupings are mutually exclusive, like gender, age, Mind-Sets. Others are not, such as the source of one’s information about arthritis.

Additive Constant The model can be expressed as: Binary Rating = k0 + k1(Element 1) + k2(Element 2) … k170(Element 170). The additive constant, k0, is the estimated value that a vignette would receive on a 0–100-point scale without any elements present in the vignette. Of course, all vignettes comprised 2–5 elements, so the additive constant is a computed value. We can consider the additive constant as a baseline, showing up the likelihood of being interested in the arthritis website in the absence of specific messaging.

We can interpret the constant as follows in terms of interest in the arthritis website:

Constant > 70 = very high interest, elements don’t have to do any work to drive interest
Constant > 40–70 = medium to high basic interest
Constant 30–40 = moderate basic interest
Constant 20–30 = low basic interest
Constant < 20 = virtually no basic interest, elements drive interest

Coefficient

The coefficient tells us the added expected incremental or decremental probability or proportion of respondents who would change their vote on the website from an original 1–6 (not interested) to the higher values 7–9 (interested.) The highest coefficient is +5, which should not necessarily surprise it when we look at the results from the total panel. People are different in what they like and dislike. The results from subgroups suggest some increased interest when we look at certain groups, such as those 55 and older. The real differences emergence when we divide the respondents by how they THINK, not by WHO they are. These differences manifest themselves in the Mind-Sets, especially Mind-Set 4. Below we will explain one way to discover these mind-sets.

We can interpret the coefficient as follows in terms of interest in the arthritis website:

Coefficient > 15 = Extremely strong driver of interest
Coefficient 10 to 15 = Very strong driver of interest
Coefficient 5 to 10 = oderate driver of interest
Coefficient 5 to –3 = Not relevant as a driver of interest
Coefficient -3 or lower = Begins to reduce interest, and should be avoided

Exploring user groups

The study with 151 text elements and 19 pictures (all scraped from websites), and the self-profiling classification generates an extraordinary amount of data. What becomes both interesting and frustrating is that the individual data points, comprising the respondent, the element, and the coefficient, are each interesting in and of themselves. That is, the data generated by Mind Genomics is cognitively ‘rich.’ It is not only the pattern of data points which is of interest, showing a generality of nature, but rather the performance of each data point, since that data point is a meaningful message.

In recognition of the need to simplify the ‘story’, the analysis here will show only a few highlights, but then move to the essence of the findings, newly emerging mind-sets.

When we plot the coefficients text elements using a scatterplot, we find that the patterns are quite similar when the groups are defined by the source of information (Figure 5), a little more diverse when we plot the data by the type of product one uses (Figure 6), and quite unrelated when we plot the data by the two age groups (under 55 versus 55 and older, Figure 7).

Mind Genomics-007 IJOT Journal_F5

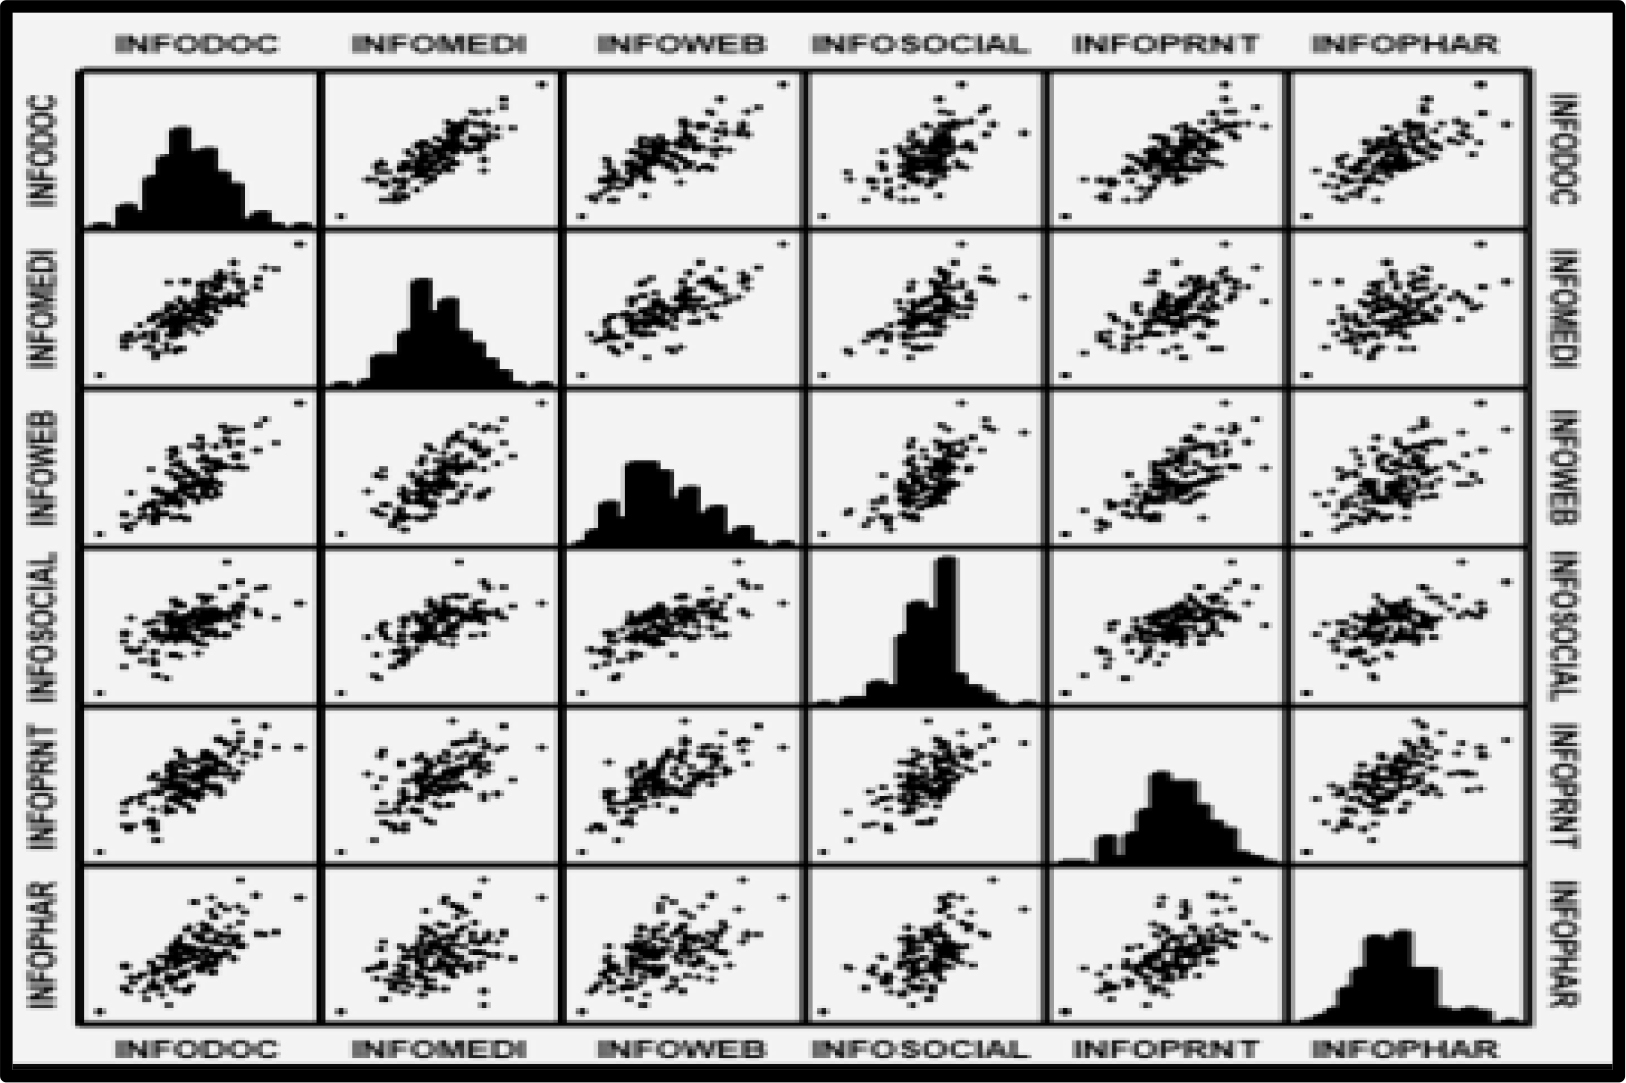
Figure 5. Coefficients of the text elements. The scatterplot shows the plot of the corresponding elements for each pair of subgroups, defined by the source of information used by the respondent. The scatterplots suggest linear relations between the sources of information, using the individual 170 coefficients as the data points.

Mind Genomics-007 IJOT Journal_F6

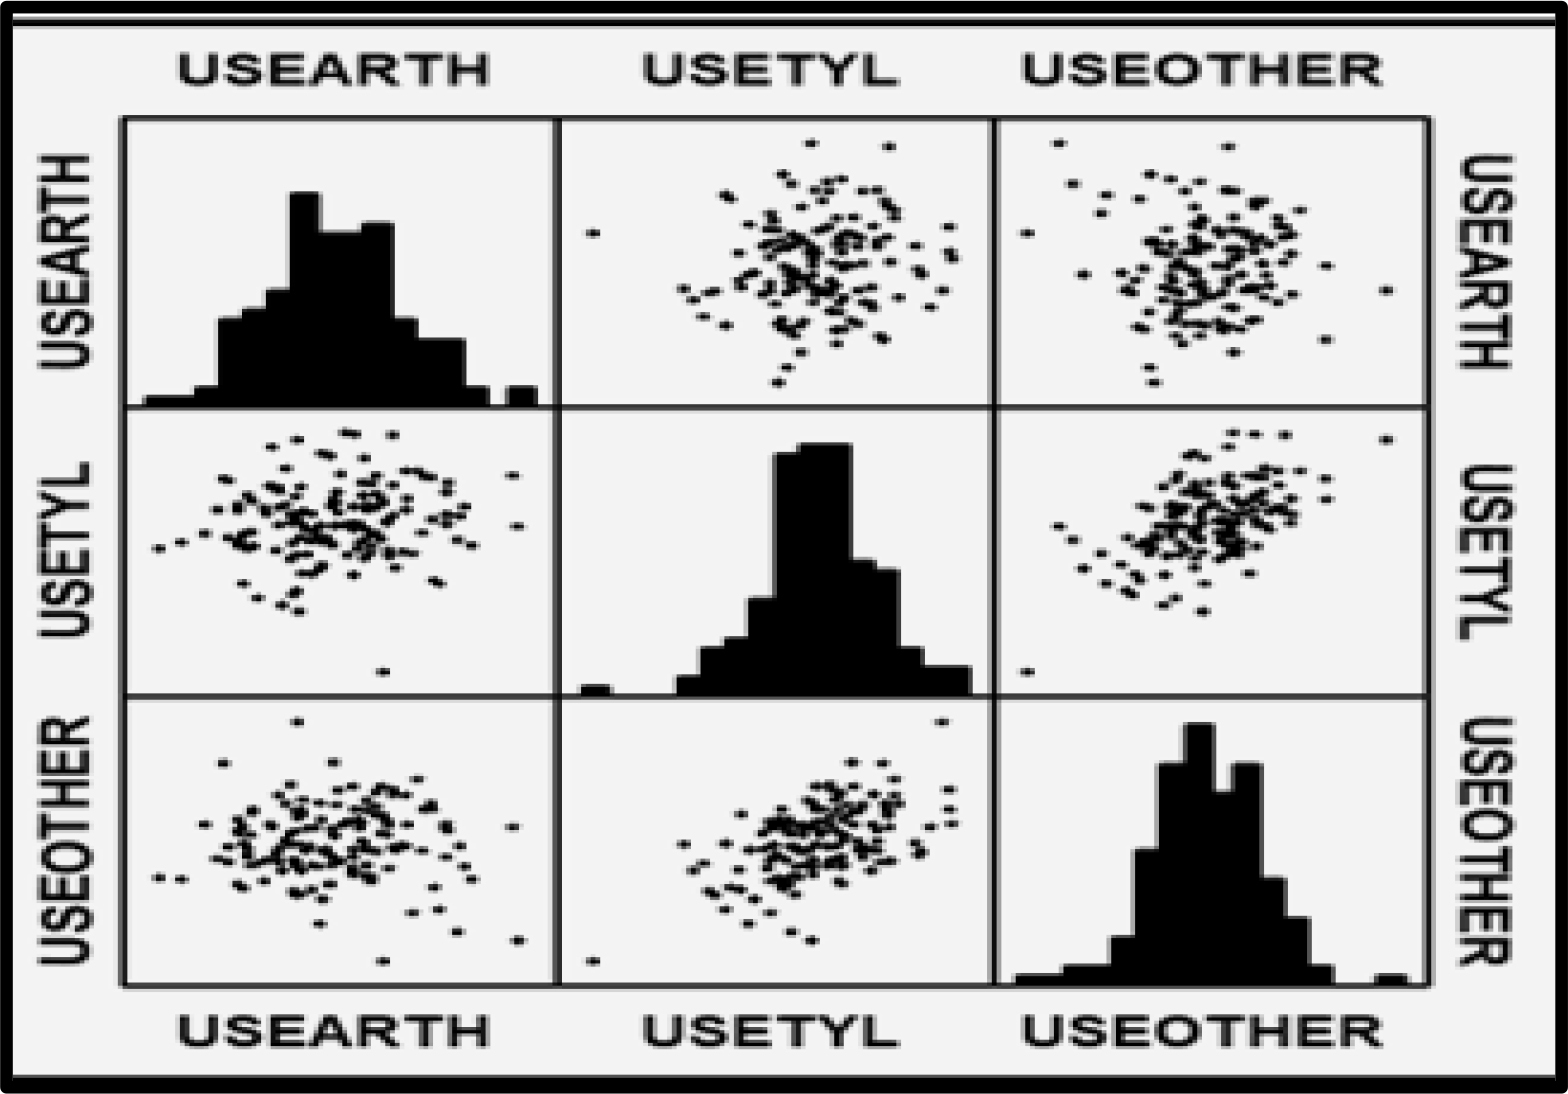
Figure 6. Coefficients of the text elements. The scatterplot shows the plot of the corresponding elements for each pair of subgroups, defined by the pain medicine used by the respondent. The pattern is noisy.

Mind Genomics-007 IJOT Journal_F7

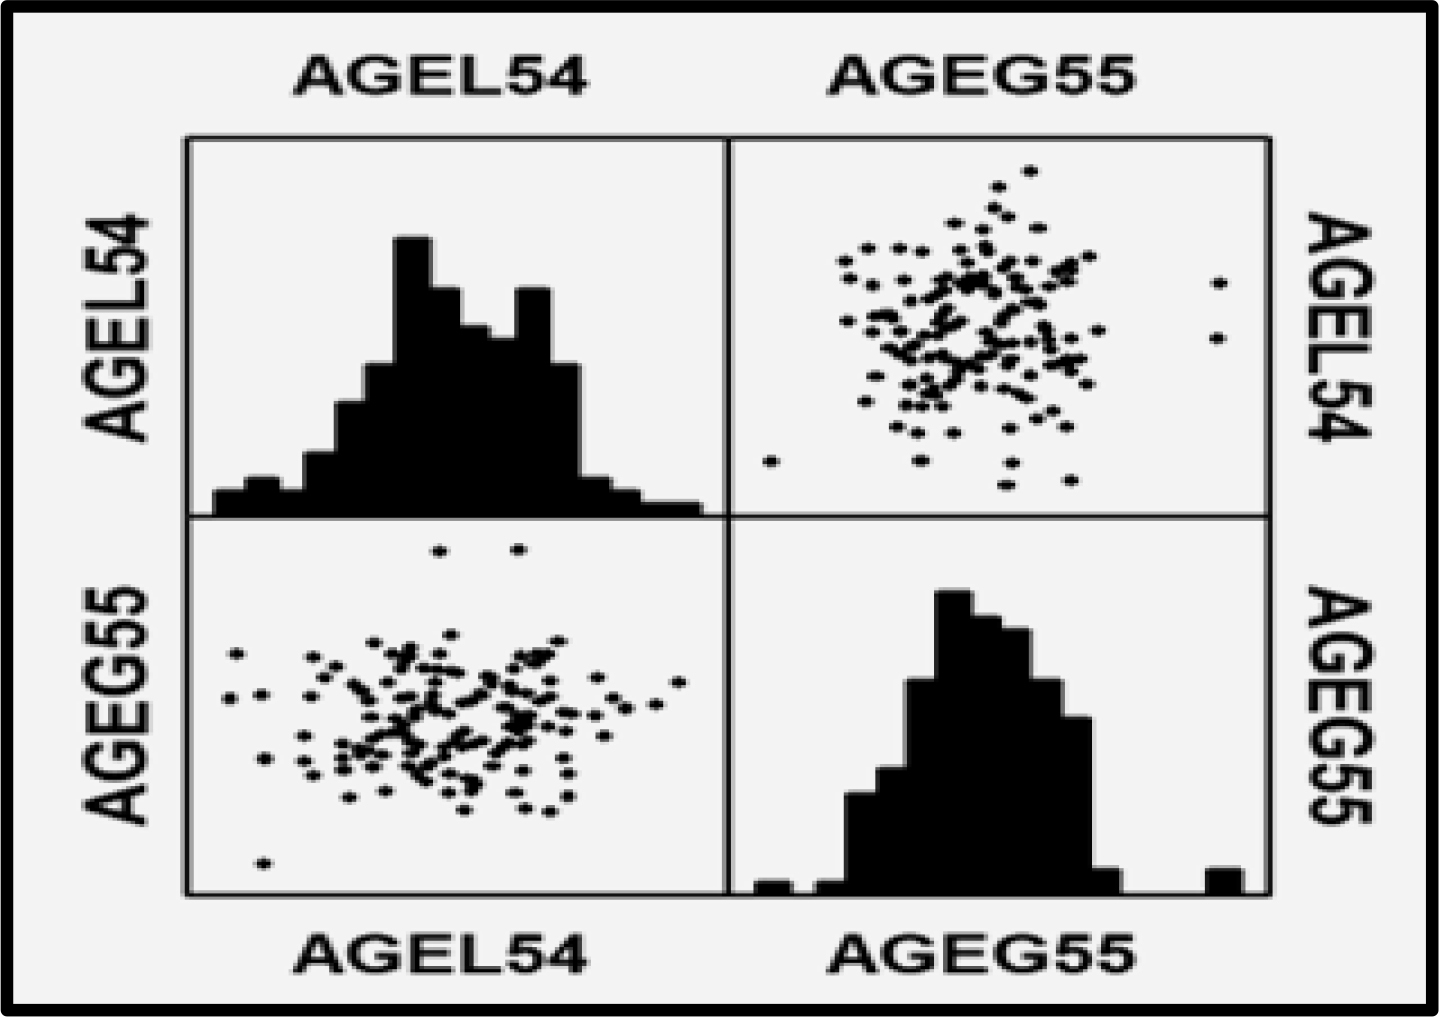
Figure 7. Coefficients of the text elements. The scatterplot shows the plot of the corresponding elements for each pair of subgroups, defined by the age of the respondent. There appears to be no relation between the patterns of coefficients generated by the younger respondents (age 54 or younger) versus the pattern generated by the older respondents (age 55 or older.)

The actual coefficients reveal that most elements are irrelevant in the mind of the respondents. That is, one can assemble dozens, even hundreds of elements, and assume that they all are effective because they appear in public on the Internet. Yet, the data suggest that they are not. Table 8 shows how one group, those who use arthritis medicines, are the ones who most strongly react to the messages. The respondents profiled themselves in terms of the medicines they took. The additive constants are virtually identical. When it comes to the coefficients, the only group of the three to show any real interest are those who take arthritis medicine. Furthermore, only six messages break through. The last line of Table 8 shows the one element appealing to other respondents. This element appeals only to uses of other medicines, besides arthritis medicine and Tylenol®, respectively. No messages appeal strongly to users of Tylenol®.

Table 8. Strong performing elements emerging from the division of respondents into the types of medicines they say they use for pain.

Elem

Text

Source

Arthritis Med

Use Tylenol®

Use Other

Additive constant

50

49

47

Use Arthritis Medicine

GI27

Up to date research on the aches and pains of arthritis and the effective homeopathic medicines

Art.About

14

-1

-5

AD2

Arthritis Advocacy Priorities – Read about the issues

DrKoop

14

2

2

AD6

Contact Congress – Quickly locate your legislators and send them a message

DrKoop

11

-2

-2

GI17

Living with arthritis – Coping strategies, hot and cold treatments, assistive devices, and more

Art.Com

11

0

-1

AD9

Fight for more research funding, insurance coverage for medications and the rights of people with arthritis

DrKoop

10

0

0

GI12

Find all your health and medical information here

Art.Com

10

-1

-5

Use Tylenol®

NE14

We recommend that before you start any exercise program, it is important that your physician examines you to see which types of exercise would be best for you

Merck

0

4

8

These results are startling. They suggest that most of the messages used in the websites simply do not communicate, or at least do not persuade, despite the effort expended to create a meaningful, effective website.

The four mind-sets defined by how they respond to messaging

Our foray into the analysis of data by subgroups suggest that there is at least one group of respondents who react strongly to some elements. These are the users of arthritis medicine, in Table 8. The results from the total, and the results from a detailed analysis of coefficients from other subgroups (not reported) suggest that the conventional breakouts of respondents, based on who they ARE, and what they DO, do not reveal many strong-performing elements.

Mind Genomics studies often reveal the hard-to-believe finding that for the total panel relatively few elements perform well. A more productive way to discover strong-performing elements emerges when we consider the population as comprising a set of mutually exclusive ‘mind-sets, ’ viz., ideas which travel together. A mind-set can be considered an allele of a gene.

The mind-sets are obtained by computation, specifically clustering the coefficients of the 144 respondents so that the clusters comprise groups of respondents with similar patterns of coefficients for the 151 text coefficients. The specific mechanics of the clustering comprise the well-accepted method of k-means clustering. The coefficients comprise a small number of groups (parsimony), whose pattern of strong performing coefficients tell a story (interpretability.) It is important to keep in mind that the clustering and the discovery of mind-sets begins with objective statistical criteria based on the clustering algorithm. The subject step in clustering comprises the selection of the number of clusters after viewing the data, and the naming of the clusters.

The clustering emerged with four different mind-sets.

Mind Set 1 – High additive constant (great basic interest), but no element really shows a high coefficient

Mind Set 2 – Medium constant (interested), but few elements appeal to them. The elements with high coefficients are those involving ‘general wellness.’

Mind Set 3 – Lower constant (moderately interested), but there are a fair number of strongly performing elements. These elements deal with maintaining a good lifestyle, and learning about their arthritis

Mind Set 4 – Lowest constant (moderately interested), but again, they show a fair number of strongly performing elements. They are looking for community and emotional support of others, e.g., through message boards.

Figure 8 shows the coefficients laid out for each mind-set segment, giving a sense of the appeal of the elements in each website to the respondents in each of the four mind-set segments. The messages provided by the websites appeal to respondents in Mind-Sets 3 and 4, respectively.

Mind Genomics-007 IJOT Journal_F8

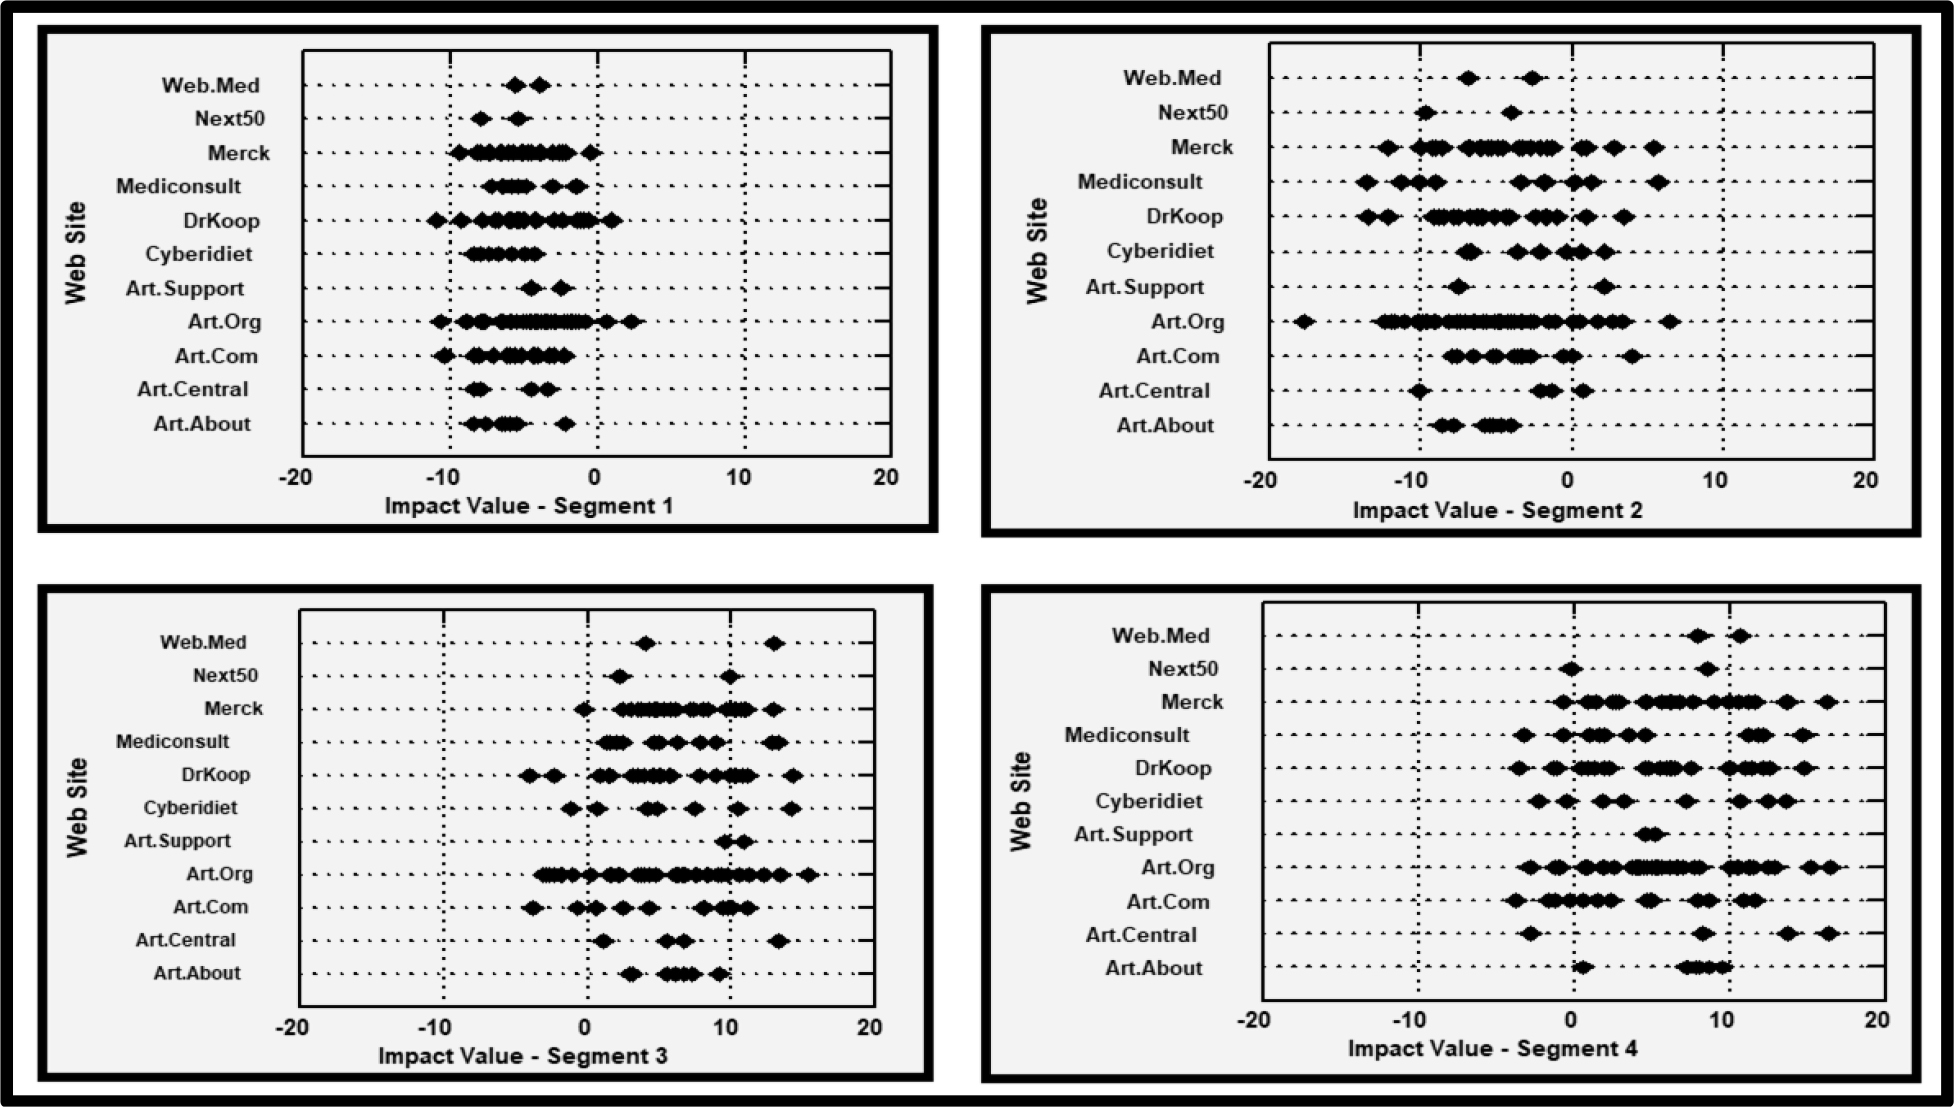
Figure 8. How the mind-set segments respondents to the messages from the different websites. Impact value = coefficient.

Table 9 shows the strongest performing elements for each mind-set, as well as the corresponding performance of the same element among the total panel, which includes the mind-set as one of four contributing groups. It is clear from Table 9 that for the Total Panel, virtually no element performs well, as we saw above in Table 7.

Mind Genomics-007 IJOT Journal_F9

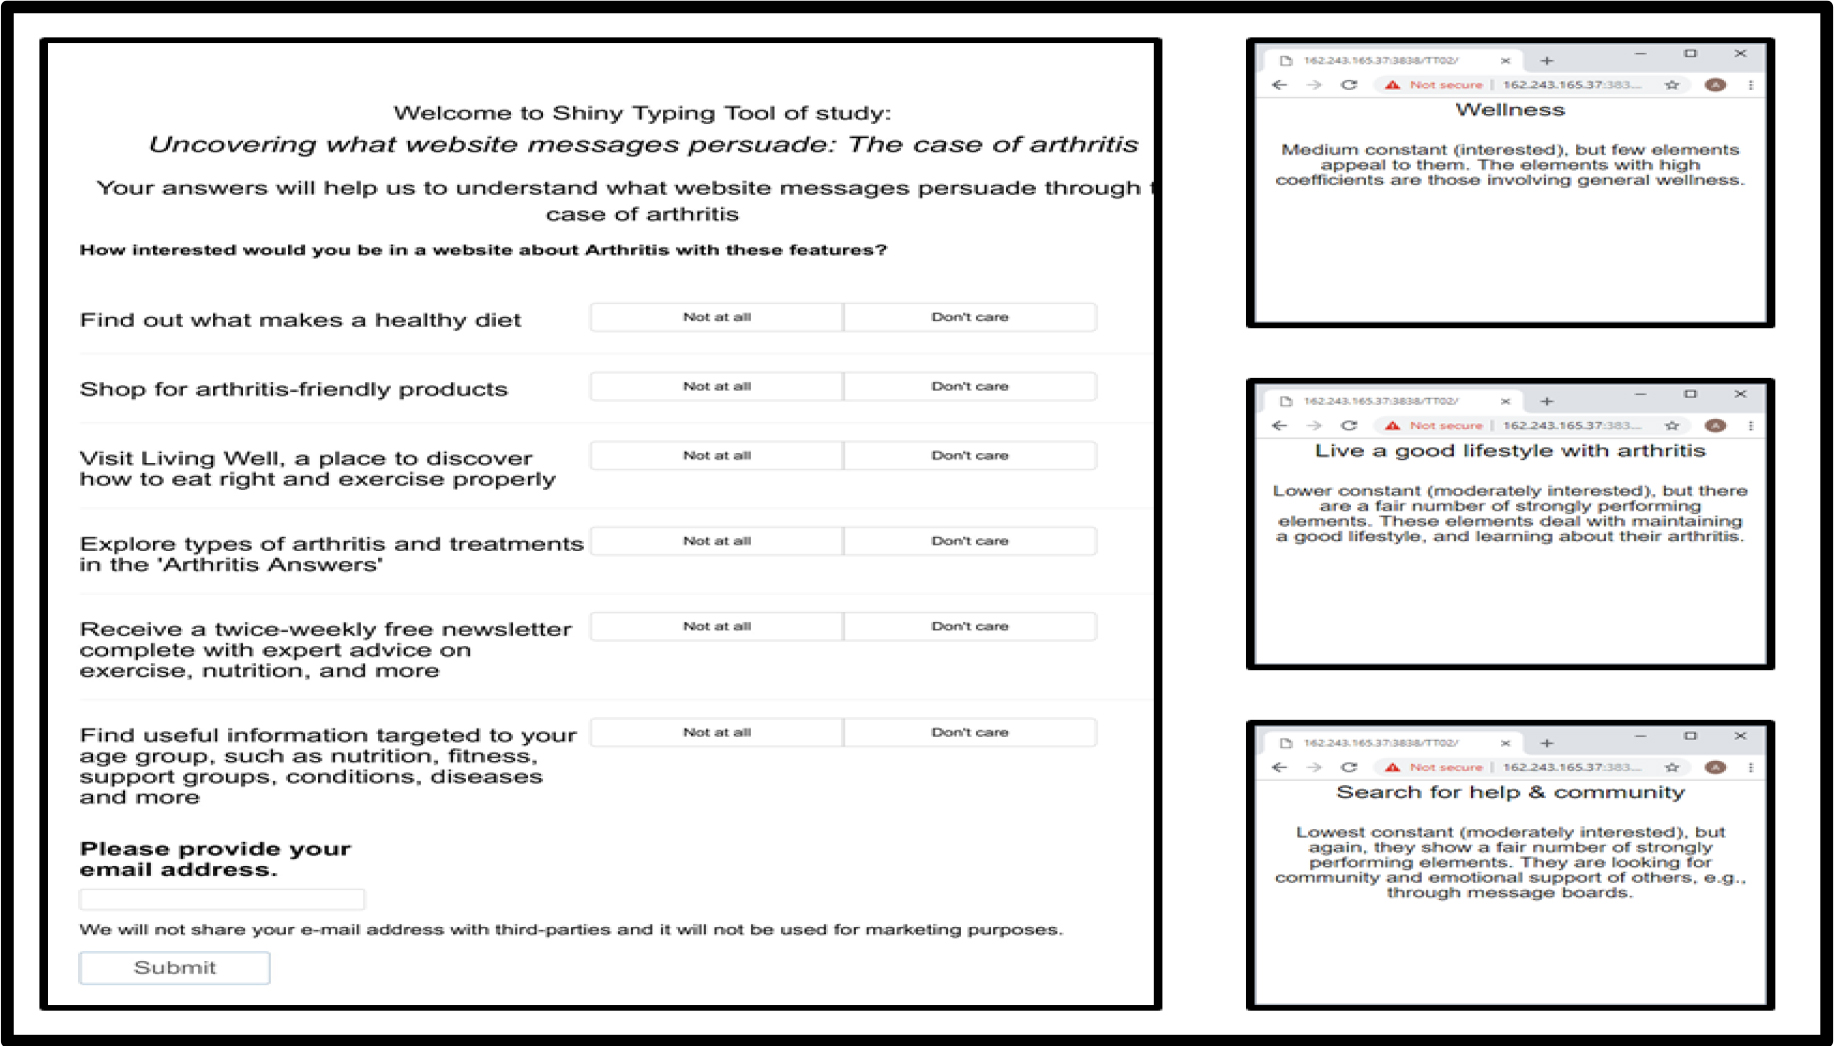
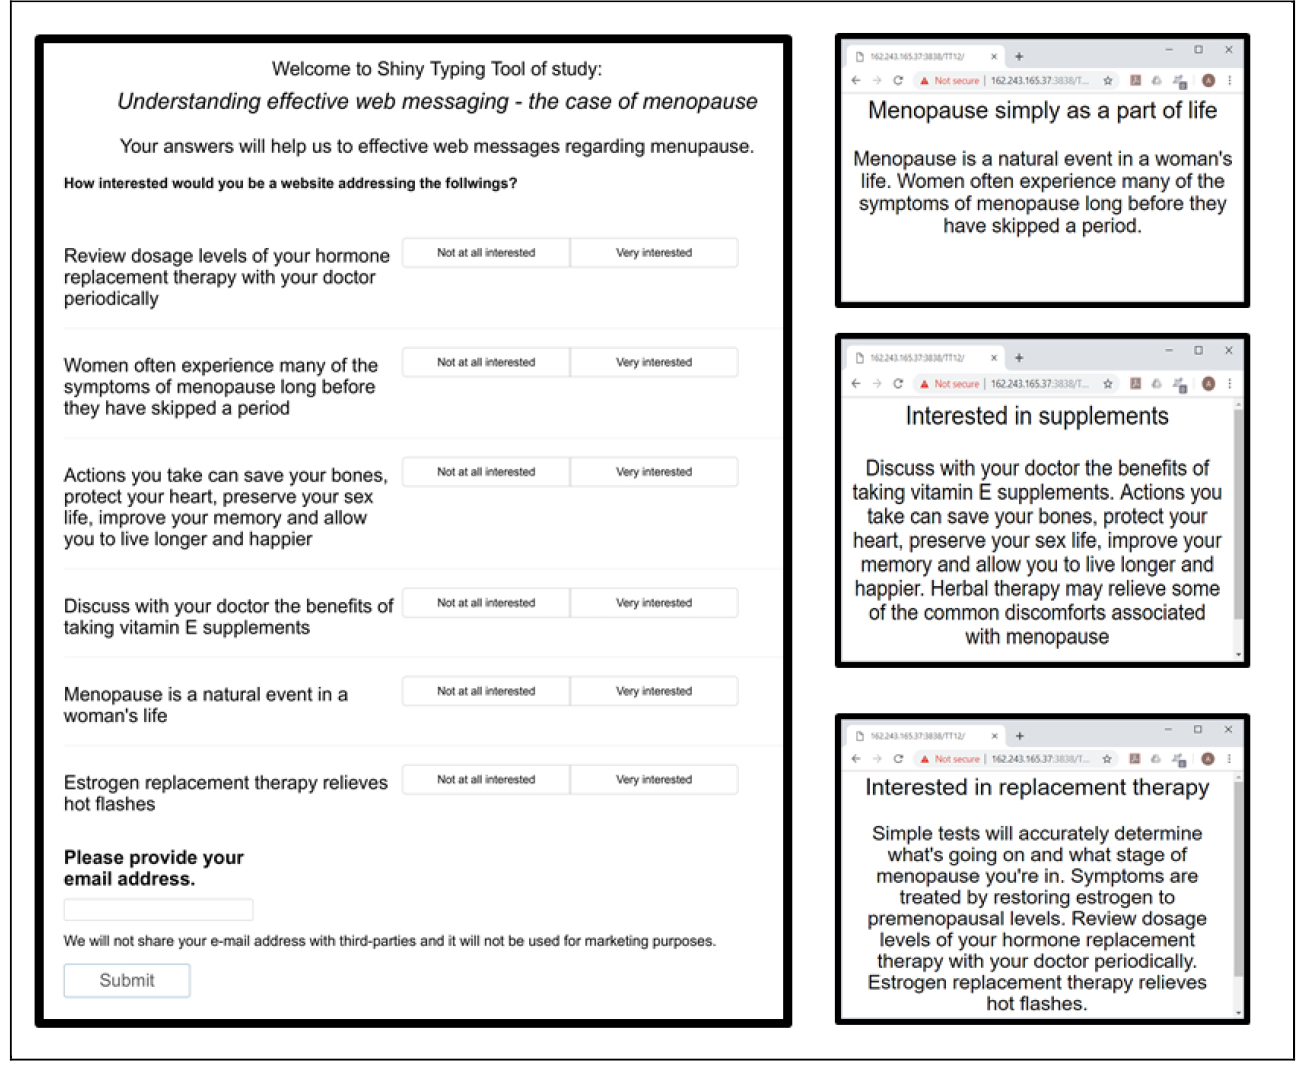
Figure 9. The PVI (Personal Viewpoint Identifier) for arthritis. The left section of the PVI shows the six questions and the two-point scale. The right section of the PVI shows the three feedback screens, corresponding to the three mind-sets (Mind-Set 1 & 2, Mind-Set 3, Mind-Set 4.)

Table 9. Strongest performing elements for the four mind-set segments

Text

Source

Total

Mind Set


Additive Constant


Mind-Set 1 – Not responsive (Additive Constant=69)


 48

69

PR01

Learn more about the new ‘Speaking of Pain’ program, and find out how you can request a free brochure

Art.Org

3

2


Mind-Set 2 – Wellness (Additive Constant=53)


 48

 53

EX03

Disease Center – Check here when you have questions about a medical condition

Art.Org

1

6

NE08

Visit Living Well, a place to discover how to eat right and exercise properly

Mediconsult

1

6

NE06

Find out what makes a healthy diet

Merck

3

5


Mind-Set 3 – Live a good lifestyle with arthritis
(Additive Constant=39)


48

39

GI14

Find useful information targeted to your age group, such as nutrition, fitness, support groups, conditions, diseases and more

Art.Org

3

15

CM11

Receive a twice-weekly free newsletter complete with expert advice on exercise, nutrition, and more

DrKoop

1

14

RS04

Search the Internet and our database for healthcare websites, hospitals and support

Cyberidiet

1

14

PR04

Our site follows the On-line Privacy Guidelines and the Guidelines on ‘Ethical Business Practice’

Art.Org

0

13

EX07

Our disease topics have expanded information about living with diseases, finding support, the latest news and more

Art.Central

0

13

EX04

Read medical minutes and ask questions about your health

Mediconsult

2

13

GI23

Read about the types of arthritis and treatments in the ‘Arthritis Answers’

Web.Med

3

13

NE06

Find out what makes a healthy diet

Merck

3

13

PR10

We have very strict policies and procedures designed to protect the privacy of our visitors

Mediconsult

0

13

GI21

Read about different types of arthritis and treatments

Art.Org

2

12

EB03

Visit Living Well…a place to discover how to strengthen your emotional health while living with a chronic condition

Art.Org

2

12

GI25

Tips for managing arthritis…bite-sized chunks of information with links to longer articles

Art.Org

2

11

NE11

We have great, healthy recipes, as well as information about vitamins, diet and medical conditions

Art.Org

4

11

RS13

Our new Caregiver Center can help with information and support for both givers and receivers of care

DrKoop

1

11

PR08

We have established practices and procedures to ensure that our privacy policies are effectively implemented

Art.Com

-1

11

PR09

We have engaged outside independent audits of our policies and practices

Art.Com

1

11

RS01

Click here for comprehensive information about your health

Merck

1

11

GI13

Find out how to protect yourself from bone loss

Merck

1

11

GI06

An archive of feature articles about all aspects of arthritis

Art.Support

0

11

AD09

Fight for more research funding, insurance coverage for medications and the rights of people with arthritis

DrKoop

2

11

NE12

Staying active is important for people with arthritis

Merck

0

11

PR07

We do not sell any personal information about our visitors, including e-mail addresses

Art.Org

0

11


Mind-Set 4 – Search for help & community
(Additive Constant = 30)


48

30

SH03

Shop for arthritis-friendly products

Art.Org

1

16

GI11

Explore types of arthritis and treatments in the ‘Arthritis Answers’

Art.Central

4

16

NE14

We recommend that before you start any exercise program, it is important that your physician examines you to see which types of exercise would be best for you

Merck

5

16

CM22

The message board is a great way for you to exchange ideas, thoughts, and express yourself

Art.Org

-2

15

GI01

View our online checklist on how to monitor medication use for seniors

DrKoop

-2

15

WF10

These guides will help you find information fast

Mediconsult

1

15

RS17

The Manual of Medical Information transforms the language of the professionals’ version into commonly used English

Merck

3

14

EB04

Welcome to the message boards – a place for you to connect with others, where new relationships and ideas can be formed and shared

Art.Central

0

14

SH01

Buy all your arthritis-care products here in the online store. Just click on a product link to browse hundreds of items

Cyberidiet

1

14

WF07

Give us your feedback about our site

Merck

2

14

CM20

The discussion group message board is moderated daily by a professional

Art.Org

3

13

WF18

Your personalized program can help you learn how to start and maintain a fitness program

DrKoop

1

13

WF13

Your personalized program can help you learn how to eat healthier foods

Cyberidiet

1

12

GI08

Read about arthritis lifestyle information – aquatics programs, exercise programs and other movement ideas

Art.Org

-1

12

EB01

Manage your arthritis and improve your life

Art.Org

1

12

SH06

Refill your prescriptions, find drug information and check drug interactions at the online pharmacy

DrKoop

0

12

GI04

A nationwide network of more than 2,000 diagnostic, surgical, and rehabilitation centers for the most up-to-date arthritis treatments

Mediconsult

0

12

SH04

You can fill prescriptions online

Mediconsult

0

12

EB06

The path to a healthy lifestyle

Art.Com

1

12

NE05

Print out your meal plan and follow it to a new you…recipes and a shopping list are included

Merck

1

12

WF12

Services for you…helpful tools and contact information

Merck

-1

12

CM18

Stop by the message boards and find others who share your interests and concerns

Art.Org

1

11

AD08

Enter a race or walk to raise funds needed for programs and research

DrKoop

0

11

EX02

Ask our fitness and nutrition expert any questions you may have

Art.Org

0

11

SH02

Order free brochures or buy an exercise tape in the Arthritis Store

Mediconsult

3

11

WF01

Take three or more health quizzes and enter to win a free tee-shirt

Merck

2

11

RS08

Sort through our Health Library Index – See a complete list of all arthritis articles

Art.Org

0

11

CM07

Be a smart reader! Anyone can visit and post messages on our boards

DrKoop

1

11

EX06

Minor Medical Directory – Click here for information about everyday health concerns

Art.Com

1

11

WF15

Your personalized program can help you learn how to make informed decisions about your treatment options

Cyberidiet

2

11

GI23

Read about the types of arthritis and treatments in the ‘Arthritis Answers’

Web.Med

3

11

GI18

Looking for something specific or just want to browse? See the list of all articles in the Health Library

Art.Org

2

11

GI03

Taking Safety Measures…If you are at risk for osteoporosis, learn how to prevent falls and back injury

Merck

1

11

The strong performance of the elements is mirrored in the strong performance of some of the visuals. Table 10 lists the strong performing visuals. Only Mind-Set 3 and 4 respond strongly to the visuals, responding to different visuals. What appeals to one mind-set may be irrelevant to the other mind-set, and certainly irrelevant to Mind-Sets 1 and 2.

Table 10. Response of the four mind-sets to strongly visuals. The table shows only those elements whose coefficients were 10 or higher, denoting a strong positive response to the visual.

Total

Mind-Set1

Mind-Set2

Mind-Set3

Mind-Set4

Mind-Set 1 – Not responsive

Mind-Set 2 – Wellness

Mind-Set 3 – Live a good lifestyle with arthritis

Women wrapped in towel, holding pills

-1

-7

1

11

-2

Four women exercising on mats

0

-6

-6

11

4

Grandparents, with grandchild in middle

0

-6

-8

10

5

Two doctors standing reviewing X rays

1

-8

4

10

4

Mind-Set 4 – Search for help & community

X rays of hands, showing ‘hot spots’

-1

-12

-14

2

15

Two hands holding each other

-1

-7

-15

0

13

Two doctors seated, reviewing X rays

1

-6

-9

2

12

Back of women with spinal cord highlighted

-1

-7

-12

0

11

Mature couple, wife looking at husband

1

-8

-8

8

10

Table 11 shows the composition of the four mind-sets, which are not quite equally distributed. It should become clear that to discover these mind-sets in the population will not be easy. The mind-sets appear to be distributed so that the four mind-sets are distributed approximately equally in each self-defined subgroup.

Table 11. Composition of the four mind-sets


Total

Mind-Set 1

Mind-Set2

Mind-Set3

Mind-Set4

Base size:

144

41

32

25

46


%

%

%

%

%

Total sample

100

100

100

100

100

Gender-Males

78

76

75

76

72

Gender-Females

22

24

25

24

28

Age-35–54

52

56

56

60

41

Age-55 and older

48

44

44

40

59

Use-Other Pain Reliever

58

59

47

64

61

Use-Tylenol

44

37

66

36

39

Arthritis Medication

18

5

13

40

22

Information from Doctor

89

85

81

88

98

Information from Media

60

71

53

60

57

Information from Print

56

56

50

68

52

Information from Drugstore/Pharmacy

56

46

69

56

54

Information from Web

51

66

47

44

46

Information from Social Network

44

46

41

48

43

Has Arthritis

80

85

69

80

83

Merging Mind-Sets 1 & 2, and finding the mind-sets in the general population for health promotion

This final section of the analysis focuses on the creation of a system to assign ‘new individuals’ to one of the mind-sets. As a preliminary step, we will combine Mind-Sets 1 and 2 into one mind-set, because neither mind-set seems to respond strongly to elements. This action, combining mind-sets, leaves us with Mind-Set (1 + 2), Mind-Set 3, and Mind-Set 4.

The messages and their corresponding coefficients work at this moment on the obtained data. In order to expand this knowledge on a wider population, modelling is needed in which we use the existing data (e.g. the coefficients of each element along with the segment membership) and create an ‘assignment model, ’ which we call the PVI (personal viewpoint analyzer.) The PVI can later be used to assign segment membership to new individuals.

Our first job is to make the assignment model easy to administer and analyze. Easy means making the assignment model, the PVI, short. In order to make the study shorter, we need to decrease the number of questions. The decrease in the number of questions is accomplished by selecting the most discriminating elements, e.g. those which show the highest deviation between the segments. This process identifies six text elements out of the 151 tested. These six elements end us as the base of the online personal viewpoint identification tool (PVI). As noted above, during the PVI development we merged the first two mind-sets in order to filter out respondents with low interest towards the elements.

The PVI instructs the to-be-typed participants to read the elements and rate each of them based on two-point scale. The six rating-questions and scale endpoints are similar to those used in the main study in order to keep consistency as much as possible. Participants are instructed to provide their e-mail address, which simply serves as an example in this case. Any other identification data can be used depending on the needs of the group authorizing the typing. The typing immediately leads to a web-site with the proper message for the respondent who is typing, based upon the respondent’s assigned mind-set.

As soon as the participants answered all questions and indicated their e-mail addresses, the PVI computes the most probable segment membership of the given respondent. The PVI stores the answers and e-mail address, which are suitable to get an overview of the participants or the ratio of the segments in the population. Participants are thanked for their participation by a thank you message which also presents their most probable segment membership. The thank you screen indicates the name of the segment the given participant belongs to along with a short description of the segment in order to give detailed information about the segment. By clicking on the refresh button of the browser, a new PVI test starts. Figure 9 shows the PVI tool for arthritis. The PVI is available on the following link: http://162.243.165.37:3838/TT02/

Discussion and Conclusion

This study revealed the patient perspective regarding effective communication messaging in arthritis. The communication messaging to promote self-management of arthritis suggest either three or four mindset-segments, depending upon how one considers mind-sets which do not ‘tell a clear story.’ This study illustrated how a medical professional may rapidly assign a person showing up in the clinic into the most likely, appropriate mind-set segment, and in turn know ahead-of-time the type of messages and treatment to which this specific new patient will respond.

People in the first mindset are not responsive to any communication. People in the second mind-set positively respond to communication messaging that target higher general wellness. These two mind-sets can be combined because there is little to strongly attract them. People in the third mind-set segment positively respond to communication messaging which emphasize a good lifestyle allowing time with family and becoming more health literate regarding Arthritis. People in the fourth mind-set segment respond positively to messaging which focus on relationships, emotional support and community.

 The ability of a medical professional to easily tailor communication messaging to an individual by mind-set segment, echoes advanced health policies of personalized medicine. Tailored communication may make a vast difference in creating patient-physician collaboration, higher health literacy, higher engagement, and better choices in a shorter process to self-management of Arthritis [26].

References

  1. Hawker GA, Stewart L, French MR, Cibere J, Jordan JM, et al. (2008) Understanding the pain experience in hip and knee osteoarthritis—an OARSI/OMERACT initiative. Osteoarthritis Cartilage 16: 415–422. [crossref]
  2. Woolhead G, Gooberman-Hill R, Dieppe P, Hawker G (2010) Night pain in hip and knee osteoarthritis: a focus group study. Arthritis Care Res (Hoboken) 62: 944–949. [crossref]
  3. Rosemann T, Wensing M, Joest K, Backenstrass M, Mahler C, et al. (2006) Problems and needs for improving primary care of osteoarthritis patients; the views of patients, general practitioners and practice nurses. BMC Musculoskelet Disord 7: 48.
  4. Gignac MA, Davis AM, Hawker G, Wright JG, Mahomed N, et al. (2006) “What do you expect? You’re just getting older”: a comparison of perceived osteoarthritis-related and aging-related health experiences in middle- and older-age adults. Arthritis Rheum 55: 905–912.
  5. Zuidema RM, Repping-Wuts H, Evers AWM, Van Gaal BGI, Van Achterberg T, et al. (2015) What do we know about rheumatoid arthritis patients’ support needs for self-management? A scoping review. International journal of nursing studies 52: 1617–1624.
  6. Boers M, Dijkmans B, Gabriel S, Maradit-Kremers H, O’Dell J, et al. (2004) Making an impact on mortality in rheumatoid arthritis: targeting cardiovascular comorbidity. Arthritis Rheum 50: 1734–1739.
  7. Kennedy A, Rogers A, Bower P (2007) Support for self care for patients with chronic disease. British Medical Journal 335: 968–970.
  8. van Houtum L, Rijken M, Heijmans M, Groenewegen P (2013) Self-management support needs of patients with chronic illness: do needs for support differ according to the course of illness? Patient Educ Couns 93: 626–632.
  9. Gabay G (2015) Perceived control over health, communication and patient–physician trust. Patient education and counseling 98: 1550–1557.
  10. Gabay G, Moskowitz HR, Silcher M, Galanter E (2017) The New Novum Organum: Policy, Perceptions and Emotions in Healthcare. Pardes-Ann Harbor Academic Publishing.
  11. Gabay G (2016) Exploring perceived control and self-rated health in re-admissions among younger adults: A retrospective study. Patient education and counseling 99: 800–806.
  12. Wilcox S, Der Ananian C, Abbott J, Vrazel J, Ramsey C, et al. (2006) Perceived exercise barriers, enablers, and benefits among exercising and non-exercising adults with arthritis: results from a qualitative study. Arthritis Rheum 55: 616–627.
  13. Parsons GE, Godfrey H, Jester RF (2009) Living with severe osteoarthritis while awaiting hip and knee joint surgery. Musculoskelet Care 7: 121–135.
  14. Browne K, Roseman D, Shaller D, Edgman-Levitan S (2010) Analysis and Commentary: Measuring patient experience as a strategy for improving primary care. Health Affairs 29: 921–925.
  15. Law RJ, Breslin A, Oliver EJ, Mawn L, Markland DA, et al. (2010) Perceptions of the effects of exercise on joint health in rheumatoid arthritis patients. Rheumatology (Oxford) 49: 2444–2451.
  16. John H, Hale ED, Treharne GJ, Carroll D, Kitas GD (2009) ‘Extra information a bit further down the line’: rheumatoid arthritis patients’ perceptions of developing educational material about the cardiovascular disease risk. Musculoskelet Care 7: 272–287.
  17. Mann C, Gooberman-Hill R (2011) Health care provision for osteoarthritis: concordance between what patients would like and what health professionals think they should have. Arthritis care & research, 63: 963–972.
  18. Ahlmen, M, Nordenskiold U, Archenholtz B, Thyberg I, Ronnqvist R, et al. (2005) Rheumatology outcomes: the patient’s perspective. A multicentre focus group interview study of Swedish rheumatoid arthritis patients. Rheumatology (Oxford) 44: 105–110.
  19. Makelainen P, Vehvila¨inen-Julkunen K, Pietila¨ A (2009) Rheumatoid arthritis patient education: RA patients’ experience. Journal of Clinical Nursing 18: 2058–2065.
  20. Kristiansen TM, Primdahl J, Antoft R, Horslev-Petersen K (2012) Everyday life with rheumatoid arthritis and implications for patient education and clinical practice: a focus group study. Musculoskelet Care 10: 29–38.
  21. Ward V, Hill J, Hale C, Bird H, Quinn H, et al. (2007) Patient priorities of care in rheumatology outpatient clinics: a qualitative study. Musculoskelet Care 5: 216–228.
  22. Pier CS, Shandley KA, Fischer JL, Burstein F, Nelson MR, et al. (2008) Identifying the health and mental health information needs of people with coronary heart disease, with and without depression. Med J Aust 188: 142–144.
  23. Reed M, Harrington R, Duggan A, Wood VA (2010) Meeting stroke survivors’ perceived needs: a qualitative study of a community-based exercise and education scheme. Clinical Rehabilitation 24: 16–25.
  24. Taylor DM, Cameron JI, Walsh L, McEwen S, Kagan A, et al. (2009) Exploring the feasibility of videoconference delivery of a self-management program to rural participants with stroke. Telemed. e-Health 15: 646–654.
  25. Moskowitz HR, Martin D (1993) How computer aided design and presentation of concepts speeds up the product development process. In Esomar Marketing Research Congress: 405.
  26. Chilton F, Collett RA (2008) Treatment choices, preferences and decision-making by patients with rheumatoid arthritis. Musculoskelet Care 6: 1–14.
  27. Ryan S, Hassell A, Dawes P, Kendall S (2003) Perceptions of control in patients with rheumatoid arthritis. Nurs Times 99: 36–38. [crossref]
  28. Kennedy A, Rogers A, Bowen R, Lee V, Blakeman T, et al. (2014) Implementing, embedding and integrating self-management support tools for people with long-term conditions in primary care nursing: a qualitative study. International Journal of Nursing Studies 51: 1103–1113.

Understanding Effective Web Messaging – The Case of Menopause

DOI: 10.31038/IGOJ.2019222

Abstract

We present a study of messages ‘scraped’ from websites dealing with the topic of menopause. Through Mind Genomics it becomes straightforward to identify how each element drives interest. We show how to estimate the impact of untested elements. We finish with the demonstration that there are at least three dramatically different mind-sets, responding to different messages, along with a very large group of people who are indifferent to most messages. The different mind-sets can be identified by an easy-to-use and short Personal Viewpoint Identifier (PVI). The PVI provides the communicator with the opportunity to tailor the messages so that the correct message can be sent to each woman.

Keywords

Communication; Menopause; Messaging; Mindset-segmentation; Health-Marketing; Well-Being

Introduction

At the time of this writing, menopause remains a fact of life for women age 40 or older. The concern is not medical, but rather involves medical concerns. The focus of society on staying young and fit, coupled with the inevitable body changes which occur before and during menopause, causes, in its wake, a great deal of anxiety. The anxiety is manifested by the proliferation of websites dealing with menopause.

Attitudes towards menopause and health promotion

Menopause manifests itself in many ways. Symptoms of menopause include cardiac trouble, lack of drive, urological symptoms, sexual disturbances, vaginal dryness, joint and muscle symptoms, drop in performance, hot flashes, depression and agitation [1]. Some symptoms of menopause have been reported to be extremely common. Hot flushes and night sweats affect about 70% of European and American women and are the most common symptoms reported during menopause. These are not the only symptoms, and indeed the manifesting symptoms vary. Differences in symptoms are attributed to diet, body mass index, exercise and mood, as well as to attitudes towards menopause [2, 3].

 There is more to menopause than the physical symptoms. There is the way the woman responds to the entire gestalt, including aging and the virtually impossible to ‘cure’ menopause. An attitude towards menopause is one’s opinion or general feelings about the menopause’ [4, 5]. The reported literature does not present a clear picture of how attitudes co-vary with, and drive responses to menopause. One’s menopause may be perceived as a medical condition or as a natural phenomenon with positive or negative social changes attributed to this transition [6].

Previous studies reported significant associations between attitudes and symptoms of menopause [4, 7]. The data suggested that the negativity of one’s attitude, the higher the symptoms frequency (i.e., such as irritability, sleeplessness, and headaches; [4]). A few cross-sectional studies reported no significant relationship between menopausal attitude and the severity of symptoms [8]. Furthermore, women with more negative attitudes prior to menopause report a higher frequency of hot flush reporting later on [4].Younger women and pre-menopausal women reported the most negative attitudes towards menopause.

Interventions to change cognitions regarding menopause may improve attitudes, and significantly reduce the perceived severity of physiological, psychological and social symptoms. Social support and education are associated with more positive attitudes. In contrast, depression is associated with both negative attitudes and menopausal symptoms [4]. The most frequent and bothersome symptoms reported are psychological and physical symptoms such as irritability, tiredness, depressed feelings, memory problems and aches and pains [4].

Understanding the specific attitudes towards pre-menopause and menopause might enable clinicians to affect the person’s cognition of the entire trajectory of menopause, and if properly done, perhaps reduce the person’s negative attitudes towards menopause.  Reducing negative attitudes may reduce the perceived frequency and severity of symptoms, with the benefit to promote health and quality of life during menopause. This study focuses on attitudes towards menopause within the English-speaking culture, and specifically on the responses to messages about menopause that are found on the Internet, on web pages. This study, in English, represents a first attempt to understand the response to web-based messages. Researchers have recognized that a full understanding of menopause must encompass data from several culture, so one can consider this project a first step, albeit a wide-ranging first step [1, 4, 9].

From other research both in consumer groups and across medical issues, there continues to emerge the realization that people are not alike. Marketers, of course, have known this for a half century or more, and have offered different products in the same category to satisfy these different groups, so-called consumer segments.

How then does the marketer uncover the messages which attract people when they read websites? The marketers know that they must have a clear ‘call to action, ’ but how does one move the reader to take action? Marketers believe that people in so-called segments respond to the same messages, and therefore the holy grail of marketing is to discover those segments. Methods such as geo-demographic analysis (WHO the person IS), or behavior analysis (WHAT does the person SEARCH for) are today’s favorites. The former is known as psychographic analysis, assuming that people who have the same attitudes towards a topic will, of course, react to the same messages. The latter is known as behavioral segmentation. Behavioral segmentation has become increasing popular as the Internet has grown. The Internet, allowing the marketer to understand the topics for which a person searches, the websites that the person reaches, and the path of navigating through the website and onwards to other websites. In other words, to the marketer, the answer ‘must be in there, ’ simply because the website seems to encapsulate wants, actions, and thus should yield motives through deeper analysis. Whether or not the deeper analyses actually provide a sense of ‘motives’ remains a question.

About three decades ago, author Moskowitz suggested a different approach, indeed one pre-dating the behavioral segmentation. The ingoing assumption of the approach, later to be named Mind Genomics [10, 11] was that the understanding of motivation might be more rapidly achieved through small experiments. These experiments present the respondent with combinations of messages of different types, all from the same topic area (e.g., menopause for the current paper.) The respondent’s task is to rate the combination as a single offering. There is no way that the respondent can understand the underlying structure by which the messages or elements are combined. Thus, the respondent must react at almost an intuitive, ‘gut level.’ The statistical procedures within Mind Genomics deconstruct the response to these tested combinations, the vignettes, showing the contribution of each element or message to driving the response.

Mind Genomics applied to the problem of messaging in websites, has the potential to easily and quickly reveal messages which motivate the total panel, as well as the nature new, unexpected groups of ideas, mind-sets, and the groups of people to whom these groups of ideas appeal, as well as groups of people to whom the ideas fail to appeal, and may even repel. These mind-sets allow the marketer to better understand the respondent, and to improve the cogency of the message in the website. In this study we focus on messaging for menopause.

Method

The basic steps in our study of menopause using Mind Genomics begin with an analysis of what is being featured by ‘scraping’ the websites and end up with segmentation results to shown different mind-sets.

  1. Create raw materials: The elements comprise both text phrases ‘scraped’ from websites dealing with menopause, as well as relevant pictures from the same set of websites. The websites are over a decade old; none of the specific material can be considered current. The fact that the material is not current is not relevant. As we will see, it is the nature of the messages which teach us a lot, as well as the discovery that most of the messages do not drive interest in the website, despite that the messages are about the topic, menopause. No, everything works, as we will soon demonstrate.
  2. Select a workable number of elements, and, when necessary for clarity, edit the elements but keep their tonality: The elements include text elements as well as visual elements. In most cases the elements require a slight amount of editing to make sure that they can ‘stand alone, ’ or be combined in messages with other elements.
  3. Classify the elements: Mind Genomics requires that we place the elements into mutually compatible groups, and assign each element or message to one of the groups (silos.) The silos will be irrelevant for the analysis but will ensure that mutually contradictory elements never appear together. In a sense we can consider the classification task as akin to ‘bookkeeping.’ Table 1 presents the different elements, classified into silos.
  4. Dimensionalize the elements: The objective here is to locate each element in a set of five dimensions, these dimensions being relevant to the elements. A small group of six individuals profiled each element on every one of the five dimensions. From the five-dimensional profile of each element, the Mind Genomics algorithm calculated the eight ‘nearest neighbors’ in the five-dimensional space. The distance between each pair of elements was defined as the Euclidean distance computed in five dimensions.
  5. Invite panelists to participate, working with a company which specializes in internet-based studies: There are many of these panel providers world-wide. The respondents for this study were members of a panel provider specializing in internet-based studies (Open View, Inc. in Toronto, CA.) The panel provider sent out invitations which told the female respondents about a study, and the chance to win a sweepstakes prize. Those respondents who were members of the Open View panel and agreed to participate were led to the welcome page, shown in Figure 1.
  6. Create the test vignettes (combinations of elements.): A test vignette comprised 25 combinations of elements. The Mind Genomics algorithm selected five silos, and four elements from each silo. The elements were combined into 25 vignettes, with the property that each vignette contained 2–4 elements, with a vignette comprising no more than one element from a silo, but often no element from the silo. The frequency of selection of each element was equal across all the respondents, although each respondent sampled only a small set (20 elements) of the much larger total. The Mind Genomics system ensured that the 20 elements in a design end up as statistically independent of each other, allowing later analysis by OLS (ordinary least-squares) regression. Figure 2 shows an example of a vignette
  7. Design of the vignettes: Each experimental design selected a set of five silos, and a random four elements from each silo. From the selection of the 20 elements, the experimental design constructed 25 combinations with the property that the elements were statistically independent of each other. This was done twice, so each respondent ended up evaluating up to 40 different elements, arranged in a total of 50 combinations. Figure 2 shows an example of one of the combinations created by the design.
  8. Respondent instruction: The respondent was instructed to read the vignette, who participated evaluated two sets of 25 vignettes each (50 vignettes in total), created according to a basic experimental design which was permuted [12]. Each respondent thus evaluated two unique sets of 25 vignettes each with the vignettes randomized.
  9. Self-profiling classification: At the end of the experiment, approximately 15 minutes after the start, the respondent completed an additional classification questionnaire, which generated information about WHO the respondent is (age, market), MENOPAUSE-RELATED information, and other relevant information. Figure 3 shows one of the screens, which obtains information on the treatments that the respondent is using to treat menopause symptoms.
  10. Transform the ratings to a binary scale to prepare for regression: One of the foundations of Mind Genomics is the creation of equations relating the presence/absence of the elements in the vignettes to the rating. The respondents assigned each of 50 vignettes a rating from 1 (not interested) to 9 (interested.) Most managers have a difficult time understanding the meaning of a 9-Point Likert Scale. Some managers want the scale to be labelled at every point to understand the scale. A more productive way to ensure understanding bifurcates the scale, so that ratings of 1–6 are assigned the value ‘0’ and the ratings of 7–9 are assigned the value of ‘100.’ The final preparatory action is to add a small random number (<10–5) to each transformed value, so that the new dependent variables are not exactly 0 or 100, but slight variations. The small random number does not materially affect the regression analysis but ensures that the regression model ‘works.’
  11. Create the model by regression: The underlying experimental design ensures that the 40 elements combined into the set of 50 vignettes are statistically independent of each other. The statistical independence allows the researcher to apply OLS (ordinary least squares regression). The equation is:

    Binary Rating = k0 + k1(Element A1) + k2(Element A2) …. K50(Element J4)

    The equation shows that the binary rating can be expressed as an additive constant (k0) and the weight contribution of the 40 elements, with sets of four drawn from a single silo or category. The Mind Genomics algorithm ensures that each element in the study appears an equal number of times. The vignettes comprise a minimum of two elements, and a maximum of five elements.

  12. Estimate the coefficient of each untested elements for each respondent: In many of these studies, the desire is to create a complete model for respondent. The realities of times, however, especially with internet-based interviews, militates against large number of respondents spending as much as an hour or two on the internet. A more efficient way is to estimate the coefficients of untested elements. The approach is to profile each of the elements on a set of five semantic scales. The semantic scales allow us to define the distance between every pair of elements, using the standard Euclidean distance measure, albeit in five dimensions. Following this line of thought, we define the eight closest neighbors of every element, based on the Euclidean distances. For each respondent, we have those elements that we tested, and have coefficients. We put these into an order which is defined by their code number (the silo and the element in the silo.) We then proceed to estimate the coefficients of untested elements. We never change the coefficients of tested elements for a respondent. For the untested elements, we put in the starting value 0. We then begin from the first element. When the first element had been tested, we skip to the next element, the second element. When that element was not tested, we replace its value (starting with 0) with the average coefficient of the eight ‘closest neighbors.’ We proceed to the third element, and so forth. We continue this process, going back to the first element. We stop when the value of each untested coefficient stops changing. ‘Stops changing’ is defined as the magnitude of change being less than 0.01 in either direction when it comes time for the coefficient of the untested element to be re-estimated. The process is fast, and quite conservative. It underestimates the coefficients of untested elements, but still shows differences among the elements.

Mind Genomics-006_IGOJ Journal_F1

Figure 1. Welcome page for the menopause study.

Mind Genomics-006_IGOJ Journal_F2

Figure 2. Example of a vignette created by the Mind Genomics system.

Mind Genomics-006_IGOJ Journal_F3

Figure 3. One of the screens for the self-profiling questionnaire, completed after the respondent completed the evaluation of the 50 experimentally varied vignettes. This screen deals with the treatments that the respondent is using to treat symptoms of menopause.

Table 1. The elements classified into silos

Silo FA – Facts about menopause

FA01

Menopause is a natural event in a woman’s life

FA02

Smokers go through menopause two to three years earlier than their non-smoking peers

FA03

Menopause is established when menses have not occurred for a year

FA04

A hot flash lasts from 30 seconds to 5 minutes and may be followed by chills

FA05

Every woman is different

Silo GI – General Information

GI01

Sunburn will aggravate your hot flashes because burnt skin cannot regulate heat as effectively

GI02

Learn more about the effects of menopause on your health

GI03

Symptoms may last from a couple of years to eight years or more

GI04

Devoted to providing women with updated information

GI05

Several excellent reference books are for sale online

GI06

Early physical symptoms include hot flashes, night sweats and sleeplessness

GI07

Emotional problems at menopause include mood swings, crying spells and irritability

GI08

The average age at which menopause occurs is about 50 years

GI09

Estrogen replacement therapy can help prevent osteoporosis

GI10

Estrogen replacement therapy can help prevent atherosclerosis and coronary artery disease

GI11

Side effects of estrogen replacement therapy include nausea, breast discomfort, headache, and mood changes

GI12

Menopause may be natural, artificial, or premature

GI13

Estrogen replacement therapy…may prevent atherosclerosis and coronary artery disease

GI14

Estrogen may be given as a tablet or as a skin patch (transdermal estrogen)

GI15

Simple tests will accurately determine what’s going on and what stage of menopause you’re in

GI16

Progesterone is taken with estrogen to reduce the risk of endometrial cancer

GI17

Commonly, estrogen and progesterone are taken everyday

GI18

Don’t expect changes overnight

GI19

Hooking up with women in a menopause support group can really help

GI20

Women often experience many of the symptoms of menopause long before they have skipped a period

GI21

Experiencing hot flashes or insomnia can occur ten years before the last menstrual period

GI22

Menopause support groups can help

GI23

Mood swings can often accompany menopause

GI24

Share your experience with other women

Silo LC – Life changes to ameliorate symptoms and to feel healthier

LC01

If you smoke, cut down or quit

LC02

Avoid “trigger” foods such as caffeine, alcohol, spicy food, and sugar

LC03

Substitute coffee or regular tea for herbal teas

LC04

Exercise to improve your circulation

LC05

Reduce your exposure to the sun

LC06

Avoiding caffeine and alcohol can ease menopausal symptoms

LC07

Eating more fruits, vegetable and grain products while avoiding red meat and fat is even more important during menopause

LC08

Monitoring intake of fat, calcium, and vitamins can help treat problems associated with menopause

LC09

Dietary changes such as the supplement of soy foods may also help increase levels of estrogen

LC10

Actions you take can save your bones, protect your heart, preserve your sex life, improve your memory and allow you to live longer and happier

LC11

Getting enough calcium is important

LC12

A healthier lifestyle has to become a lifelong habit

LC13

Avoid spicy foods, alcohol and caffeine

LC14

With proper care and attention, we can all reach what Margaret Mead called a state of “post menopausal zest”

LC15

Menopause is a time for reassessment of our lives and health habits

LC16

Make as many healthy lifestyle changes as you can

LC17

Tell your friends and family what’s going on

Silo MP – Medical practice considerations

MP01

Discuss with your doctor the benefits of taking vitamin E supplements

MP02

Visit your gynecologist annually or semiannually

MP03

Ask questions and express your concerns

MP04

Review your health status with your doctor regularly

MP05

Discuss treatment side effects with your doctor

MP06

Prevent osteoporosis after menopause

MP07

Always consult your own doctor about any opinions or recommendations

MP08

Talk to your doctor to see what is right for you

MP09

Learning about all of the options will help you and your doctor make the best decisions for your care

MP10

Talk with your doctor about other methods or dosages

MP11

Inform your doctor of any personal and family medical changes

MP12

Have an annual physical examination, along with a pelvic exam, Pap smear and breast exam

MP13

Receive a yearly mammogram (breast x-ray)

MP14

Perform a breast self-exam each month

MP15

Report any abnormal vaginal bleeding

MP16

Have a yearly endometrial biopsy

MP17

Check blood pressure as often as your doctor suggests

MP18

Check your cholesterol before you start therapy

MP19

Ask for the lowest dose of estrogen to control symptoms

MP20

Review dosage levels of your hormone replacement therapy with your doctor periodically

MP21

Talk with your doctor about the risks and benefits of each type of treatment

MP22

Weigh the risks and benefits of hormone replacement therapy carefully with your doctor

MP23

Estrogen supplements are best known for preventing and treating osteoporosis

MP24

It’s important to have a complete medical history and physical examination taken

MP25

Never be afraid to ask your doctor questions!

Silo NR – Natural products and practices

NR01

Soy products contain high levels of plant estrogens (phytoestrogens)

NR02

Natural hormones are produced from plants and come in cream or pill form

NR03

Learn about natural therapies and hormone preparations

NR04

Naturopathic medicine uses herbs

NR05

Naturopathic medicine uses acupuncture

NR06

Many natural treatments are available

NR07

Homeopathic medicines can be helpful

NR08

Only very low doses of a natural estrogen are needed to prevent hot flashes and osteoporosis

NR09

Soy supplements are being marketed to women as hot flash cure-alls

NR10

Trying herbs on your own can be risky

NR11

Many women find natural and herbal remedies to be helpful

NR12

The most popular remedy to relieve symptoms associated with menopause is soy supplementation

NR13

Many remedies are available for hot flashes

Silo SR – Alleviating symptoms by specific products

SR01

Reduce the undesirable symptoms of menopause

SR02

Menopause symptoms can be treated by hormone replacement therapy

SR03

Know how to manage the symptoms…have a plan to stay healthy in the years ahead

SR04

Herbs can help some of the symptoms of menopause

SR05

Vitamins in higher than usual doses can help some of the symptoms of menopause

SR06

Herbal therapy may relieve some of the common discomforts associated with menopause

SR07

Herbs can alleviate some of the symptoms in some women

SR08

Soy isoflavones may help alleviate the symptoms of menopause

SR09

Regular physical exercise will help prevent or relieve many of the common discomforts of menopause

SR10

Symptoms are treated by restoring estrogen to premenopausal levels

SR11

The primary goals of estrogen replacement therapy are: relief of symptoms such as hot flashes, vaginal dryness, and urinary problems

SR12

Estrogen replacement therapy relieves hot flashes

SR13

Exercise can be beneficial for symptom relief

Silo TT – Hormonal, herbal, nutritional remedies

TT01

Talk to your doctor about whether you should receive postmenopausal hormone therapy

TT02

Consider taking a combination therapy that uses estrogen and progestin

TT03

Be alert for side effects from any treatment, including hormone therapy

TT04

Hormone therapy lowers cholesterol

TT05

Women are seeking herbal and nutritional therapies to ease hot flashes and other symptoms of menopause

TT06

Many herbal remedies may help ease some discomforts

TT07

Doctors feel comfortable recommending herbal or nutritional therapies for symptoms of menopause

TT08

Hormone replacement therapy has significant benefits in reducing the rapid bone loss that accompanies menopause

TT09

Hormone replacement therapy can help a woman reduce her risk for osteoporosis

TT10

Talk to your doctor about all the available options…decide which is best for you

TT11

Hormone replacement therapy helps preserve bone health

TT12

Traditional treatments…hormone replacement therapy…it all depends on YOU

TT13

A woman and her doctor must weigh the benefits against the risks before deciding whether to use estrogen replacement therapy

TT14

Find the right hormone combination for you

TT15

Estrogen replacement therapy may be appropriate for you

TT16

Many women feel better with estrogen treatment

TT17

Reassess your estrogen replacement therapy periodically

Silo VI – Visual

VI01

mindbody.gif

VI02

woman on the move.jpg

VI03

woman eating salad.jpg

VI04

woman with daughters.jpg

VI05

couple walking in woods.jpg

VI06

women jogging.jpg

VI07

woman at breakfast table.jpg

VI08

woman outdoors.jpg

The 552 respondents who participated generated results shown in Table 2. The table shows only a portion of the elements, those which generated a coefficient of 6 or higher, or a negative coefficient. The additive constant for interest in the web is 56, meaning that the conditional probability is over 50% that this targeted audience will be interested in the website on menopause. The surprise, however, is that only a few of the elements perform well, and none perform with a coefficient of 8 or higher. We conclude from Table 2 that either the “typical respondent” is scarcely interested, or that we have different groups of respondents, and that there is no single element which performs very well across all subgroups of respondents. It is a tribute to the web developers that no element ended up with a strongly negative coefficient, however.

Mind-Sets – the clue to more effective messaging

The foregoing results for Total Panel (Table 2) and for relevant subgroups (Table 3) suggest that the conventional way of dividing respondents does not uncover very strong messages, with ‘very strong’ operationally defined here as a coefficient higher than 10.51 (rounding up to 11) or higher. There are NO elements which score 11 or higher, either for total panel or for the self-defined subgroups based upon the self-profiling classification.

Table 2 . The strong performing elements, defined as having a coefficient above 6. The results come from the Total Panel of 552 respondents.

Additive constant for the total panel of 552 respondents

56

MP1

Discuss with your doctor the benefits of taking vitamin E supplements

7

GI15

Simple tests will accurately determine what’s going on and what stage of menopause you’re in

7

LC10

Actions you take can save your bones, protect your heart, preserve your sex life, improve your memory and allow you to live longer and happier

7

NR11

Many women find natural and herbal remedies to be helpful

6

GI6

Early physical symptoms include hot flashes, night sweats and sleeplessness

6

TT5

Women are seeking herbal and nutritional therapies to ease hot flashes and other symptoms of menopause

6

SR6

Herbal therapy may relieve some of the common discomforts associated with menopause

6

TT10

Talk to your doctor about all the available options…decide which is best for you

6

GI4

Devoted to providing women with updated information

6

NR10

Trying herbs on your own can be risky

6

GI19

Hooking up with women in a menopause support group can really help

–1

Strong performing elements by key subgroup
We can sort the data into the different groups based on a variety of characteristics. Table 3 shows the strong performing elements for the different ages, self-reported progress toward menopause, and respondents who have various symptoms. Only elements performing well in at least one subgroup are shown. To avoid a ‘wall of numbers’ we have operationally defined the value of 8 as the low value of the coefficient that we will accept.

Table 3. Strong performing elements for different subgroups, defined by age, stage of menopause, and symptoms reported

Mind Genomics-006_IGOJ Journal_F5

The answer to strong performing elements may lie in another way of thinking about respondents, not so much as people, but as a storage bin for a mind-set. In turn, a mind-set comprises a group of related ideas. The respondent is merely a protoplasmic-vehicle which holds these related ideas, and through testing allows these mind-sets to emerge. It is not the people, but the set of ideas which is the real essence of the mind-set: The foregoing distinction between the ideas and the people who hold these ideas, two different entities, emblemizes the difference between the way one thinks in general (measure the people, count the different opinions, tabulate), and the way one thinks with Mind Genomics (identify the mind-sets, and determine the distribution of these mind-sets in different populations.)

Uncovering mind-sets occurs through the statistical procedure of clustering. Each respondent generates a set of coefficients, one coefficient for each element, along with an additive constant. The set of coefficients emerge from measuring the coefficients of elements tested by the respondent, and then imputing the values for elements untested by the respondent. The imputation was described above in the section on estimating the coefficients of untested elements.

Clustering attempts to separate the elements, i.e., the respondents, into different, non-overlapping groups. The mathematics is based upon the minimization of distances between respondents within a cluster, and then maximizing the differences between the centroids of different clusters. Each respondent generated one coefficient per element, whether that coefficient was from an actually-tested element, or whose value was imputed for the respondent because the respondent did not actually test the element since the element never appeared in any of the respondent’s 50 vignettes.

The actual clustering algorithm is called k-means clustering. The clustering program used by Mind Genomics can be considered as a heuristic to divide a population of objects (here people) in a smaller, non-overlapping set of groups, segments, or in our terminology, ‘mind-sets.’

The specific algorithm is one of a family of related algorithms. We define the distance between two people as the value (1-Pearson R, Pearson Correlation.) We compute the Pearson correlation between the coefficients of two people, and then define the distance between those people as the value 1-R. When the Pearson correlation is 1.0, the distance is 0 (1 – 1 = 0.) A Pearson correlation of +1.0 means that the two sets of coefficients are perfectly aligned. It makes sense that the distance should be 0. In contrast, when the Pearson correlation is -1, the distance is 2.0 (1 – – 1 =2.) The negative correlation means that the two sets of coefficients travel in opposite directions. The respondents are most different from each other, and thus are separated by the greatest distance.

When we cluster the respondents to uncover mind-sets, we do so with at least two objectives:

  1. Parsimony. The fewer the number of mind-sets emerging from the study, the better the segmentation in terms of mathematical ‘elegance.’ Furthermore, it is important to minimize the number of segments in order to make the application easier. The fewer the number of segments or mind-sets, the easier it will be to create separate strategies to communicate with these mind-sets.
  2. Interpretability. Opposing the objective of parsimony is the objective is having the mind-sets very focused, very single-minded. The greater the number of mind-sets, the more likely it will be that the emergent mind-sets will be single-minded, albeit of smaller size.

The analysis of these data suggests that four segments, four emergent mind-sets, represent a good compromise. Table 4 shows the strongest performing elements from each segment. By strong performing we operationally define coefficients of 11 or higher as ‘strong’ performing. There is no hard and fast rule about what is ‘strong, ’ but when we work with large numbers of elements with imputation of values for untested elements, the likelihood of having elements of 11 or higher from the total panel is low. We can feel comfortable with this value of 11 as a signal of a relevant element.

Table 4. The four mind-sets for menopause. The elements are those which perform strongly for each mind-set. The number on the right is the coefficient.

Strong performing elements for each mind-set

Coeff

Mind-Set 1, n=153, Additive constant =74, Highly interested in a menopause- oriented website, but no elements move them beyond their basic high interest

Mind-Set 2, n=141, Additive constant = 53, Menopause simply as a part of life

FA1

Menopause is a natural event in a woman’s life

11

VI7

woman at breakfast table.jpg

11

GI20

Women often experience many of the symptoms of menopause long before they have skipped a period

11

Mind-Set 3, n=141, Additive constant = 45, Takes supplements

MP1

Discuss with your doctor the benefits of taking vitamin E supplements

15

LC10

Actions you take can save your bones, protect your heart, preserve your sex life, improve your memory and allow you to live longer and happier

15

SR6

Herbal therapy may relieve some of the common discomforts associated with menopause

14

NR10

Trying herbs on your own can be risky

13

NR1

Soy products contain high levels of plant estrogens (phytoestrogens)

13

GI4

Devoted to providing women with updated information

12

SR4

Herbs can help some of the symptoms of menopause

12

NR12

The most popular remedy to relieve symptoms associated with menopause is soy supplementation

12

GI15

Simple tests will accurately determine what’s going on and what stage of menopause you’re in

12

MP7

Always consult your own doctor about any opinions or recommendations

12

MP8

Talk to your doctor to see what is right for you

12

SR3

Know how to manage the symptoms…have a plan to stay healthy in the years ahead

12

MP9

Learning about all of the options will help you and your doctor make the best decisions for your care

12

SR13

Exercise can be beneficial for symptom relief

12

MP10

Talk with your doctor about other methods or dosages

12

TT5

Women are seeking herbal and nutritional therapies to ease hot flashes and other symptoms of menopause

11

TT10

Talk to your doctor about all the available options…decide which is best for you

11

TT7

Doctors feel comfortable recommending herbal or nutritional therapies for symptoms of menopause

11

GI2

Learn more about the effects of menopause on your health

11

TT12

Traditional treatments…hormone replacement therapy…it all depends on YOU

11

Mind-Set 4, n=117, Additive constant = 48, Takes replacement therapy

GI15

Simple tests will accurately determine what’s going on and what stage of menopause you’re in

20

SR10

Symptoms are treated by restoring estrogen to premenopausal levels

19

MP20

Review dosage levels of your hormone replacement therapy with your doctor periodically

19

SR12

Estrogen replacement therapy relieves hot flashes

19

TT16

Many women feel better with estrogen treatment

18

SR2

Menopause symptoms can be treated by hormone replacement therapy

18

MP19

Ask for the lowest dose of estrogen to control symptoms

18

SR11

The primary goals of estrogen replacement therapy are: relief of symptoms such as hot flashes, vaginal dryness, and urinary problems

18

TT2

Consider taking a combination therapy that uses estrogen and progestin

18

TT1

Talk to your doctor about whether you should receive postmenopausal hormone therapy

18

MP24

It’s important to have a complete medical history and physical examination taken

17

MP22

Weigh the risks and benefits of hormone replacement therapy carefully with your doctor

17

TT3

Be alert for side effects from any treatment, including hormone therapy

17

LC8

Monitoring intake of fat, calcium, and vitamins can help treat problems associated with menopause

17

TT17

Reassess your estrogen replacement therapy periodically

17

TT9

Hormone replacement therapy can help a woman reduce her risk for osteoporosis

17

SR1

Reduce the undesirable symptoms of menopause

16

MP23

Estrogen supplements are best known for preventing and treating osteoporosis

16

GI13

Estrogen replacement therapy…may prevent atherosclerosis and coronary artery disease

16

MP6

Prevent osteoporosis after menopause

16

TT15

Estrogen replacement therapy may be appropriate for you

16

TT8

Hormone replacement therapy has significant benefits in reducing the rapid bone loss that accompanies menopause

16

MP5

Discuss treatment side effects with your doctor

15

MP13

Receive a yearly mammogram (breast x-ray)

15

LC6

Avoiding caffeine and alcohol can ease menopausal symptoms

15

GI17

Commonly, estrogen and progesterone are taken everyday

15

GI11

Side effects of estrogen replacement therapy include nausea, breast discomfort, headache, and mood changes

14

LC10

Actions you take can save your bones, protect your heart, preserve your sex life, improve your memory and allow you to live longer and happier

13

MP10

Talk with your doctor about other methods or dosages

13

TT14

Find the right hormone combination for you

13

GI14

Estrogen may be given as a tablet or as a skin patch (transdermal estrogen)

13

SR13

Exercise can be beneficial for symptom relief

12

NR13

Many remedies are available for hot flashes

12

LC7

Eating more fruits, vegetable and grain products while avoiding red meat and fat is even more important during menopause

12

LC11

Getting enough calcium is important

12

TT11

Hormone replacement therapy helps preserve bone health

12

GI10

Estrogen replacement therapy can help prevent atherosclerosis and coronary artery disease

12

MP16

Have a yearly endometrial biopsy

12

MP1

Discuss with your doctor the benefits of taking vitamin E supplements

11

NR1

Soy products contain high levels of plant estrogens (phytoestrogens)

11

SR3

Know how to manage the symptoms…have a plan to stay healthy in the years ahead

11

LC9

Dietary changes such as the supplement of soy foods may also help increase levels of estrogen

11

MP21

Talk with your doctor about the risks and benefits of each type of treatment

11

MP12

Have an annual physical examination, along with a pelvic exam, Pap smear and breast exam

11

MP15

Report any abnormal vaginal bleeding

11

MP18

Check your cholesterol before you start therapy

11

MP14

Perform a breast self-exam each month

11

GI16

Progesterone is taken with estrogen to reduce the risk of endometrial cancer

11

The four segments are:

  1. Mind-Set 1, n=153, Additive constant =74, No elements are strong
  2. Mind-Set 2, n=141, Additive constant = 53, Menopause simply as a part of life
  3. Mind-Set 3, n=141, Additive constant = 45, Takes supplements
  4. Mind-Set 4, n=117, Additive constant = 48, Takes replacement therapy

Quite often in these studies there are mind-sets which do not respondent strongly to any individual elements. That does not mean that the mind-set is indifferent. For our 552 respondents, the first emergent mind-set comprises 153 individuals who at a basic level are very interested in a menopause website (additive constant = 74), but no element strongly moves their basic interest beyond that very

Finding these segments in the population

It is clear from the results in Table 4 that the respondents in the mind-sets are far more likely to have a positive feeling to messages tuned to their particular mind-set. The world of modest-only performance is not a condemnation of those who create content, but rather a reflection of a bland world of messaging which conceals within it treasures. Although Mind-Set 1 has no elements to which it responds strongly, and although Mind-Set 2 has only three elements to which it responds strongly, Mind-Sets 3 and 4, respectively, respond in a remarkably strong way to selected messages, and indeed to quite a number of these messages. It will be those mind-sets who will respond to the appropriate messages.

The next questions which naturally arises is how does one discover these mind-sets in the population at large? We cannot force respondents to participate in a 30-minute test to determine the pattern of their responses. Rather, we must search for better ways. One might look at the other patterns of behavior and attitude self-reported by the respondents, shown in the Appendix to this paper. The patterns are quite similar across respondents in the four mind-sets, suggesting that any attempt to isolate the respondents by their self-reported responses, especially WHO THEY ARE, and WHAT THEY DO, is likely to fail.

A separate approach, pioneered by author Gere creates a small set of questions, based upon the patterns of coefficients the three mind-sets (Mind-Set 1&2 combined, Mind-Set 3, Mind-Set 4, respectively.) The coefficients are selected so that their patterns maximally differentiate among pairs of mind-set segments. The result is an efficient set of six elements, based upon the elements, the elements phrased as questions to be answer by either NO or YES, or some similar binary response. A respondent is presented with the six questions. The pattern of responses dictates the assignment to the segment membership. The output can be either a short report to the respondent doing the typing, a record for one’s medical record, or even the re-direction of the respondent to the appropriate web-site. Figure 4 shows the PVI (personal viewpoint identifier), and the three different response screens, the appropriate response screen either given back to the respondent and/or placed into the respondent’s medical records. The linking to the typing tool is the following (as of February, 2019.) http://162.243.165.37:3838/TT12/

Mind Genomics-006_IGOJ Journal_F4

Figure 4. Personal Viewpoint Identifier (Left Panel), and the feedback screens (Right Panel)

Discussion and Conclusion

This study examines attitudes towards menopause within one culture. Attitudes towards menopause change by mindset-segment we uncovered in this study. Women in one major mindset-segment perceive menopause as part of life (original mind-sets 1 and 2). Women in the second major mindset-segment (original mind-set 3) perceive menopause as uncomfortable and take supplements to ease symptoms while reducing risk of taking hormone replacements. Women in the third mindset-segment (original mind-set 4) perceive menopause as a sign of old age and although they are aware of risks associates with hormone replacement, they take those to overcome the symptoms.

Echoing previous studies, menopause is indeed perceived sometimes as a medical condition and other times as a natural phenomenon with positive or negative physical and subsequent social changes attributed to this biological transition [6]. Our mindset-segments suggest a major mindset-segment of people who are aware of risks and take supplements rather than hormone therapy. Our psychographic mindset-segmentation contradicts previous findings that there exists a strong link between attitudes towards menopause and geode-demographic variables such as age, education, and social support [4]. The linkage is better conceptualized as mind-sets. It’s more likely related to knowing HOW A PERSON THINKS ABOUT THE SPECIFIC TOPIC OF MENOPAUSE. Knowing mind-sets and tailoring messages to mind-sets (revealed for the individual through the PVI (personal viewpoint identifier) should dramatically increase the effectiveness of messages, and increase well-being and quality of life during menopause.

Acknowledgement

Attila Gere thanks the support of Premium Postdoctoral Researcher Program of Hungarian Academy of Sciences.

Appendix – Distribution of the four mind-sets of for menopause

Merged in the PVI

Total

Mind-Set 1

Mind- Set 2

Mind- Set 3

Mind- Set 4

High Interest

Menopause Ordinary

Takes Supplements

Estrogen Therapy

Base size

552

153

141

141

117

Percent

%

%

%

%

%

Which of the following best describes your age?

Under 40

3

3

2

3

5

40–44

35

39

33

33

33

45–49

36

34

35

35

39

50–55

26

24

29

30

22

Over 55

0

0

0

0

0

Which of the following best describes the stage of menopause that you are in?

Pre-menopause – the time of life before menopause

24

25

23

30

16

Peri-menopause- the 6 years or so prior to menopause when one begins to experience the effects of approaching menopause

41

41

45

35

43

Menopause- the end point after 12 consecutive months without a menstrual period

17

18

16

14

23

Post-menopause- the period of time after menopause

18

16

16

21

18

Which of the following menopausal symptoms have you experienced? (ALL THAT APPLY)

Hot flashes

66

68

68

57

70

Night sweats or insomnia

66

61

70

65

70

Anxiety/nervousness

61

61

59

61

62

Sudden changes of mood

59

57

63

56

62

Depression

56

51

59

58

56

Decreased sex drive

52

48

55

47

58

Vaginal dryness or itching

45

48

48

41

43

Urinary symptoms including increased frequency

41

39

43

36

46

Irregular bleeding

36

33

35

42

35

Painful intercourse

18

18

18

18

21

So far I have not experienced any menopausal symptoms

9

11

5

12

6

Other

5

2

6

8

6

Which ONE of the following menopausal symptoms have you experienced MOST often

Hot flashes

19

18

20

16

23

Night sweats or insomnia

19

22

16

21

18

Irregular periods

13

11

12

10

18

Decreased sex drive

10

10

16

6

9

So far I have not experienced any menopausal symptoms

9

12

4

13

6

Anxiety/nervousness

7

5

10

5

7

Depression

7

5

7

11

7

Sudden changes of mood

7

7

6

9

5

Vaginal dryness or itching

5

6

5

6

4

Urinary symptoms including increased frequency

4

6

4

3

2

Painful intercourse

1

1

1

1

2

Other

0

0

0

1

0

Which of the following issues associated with menopause are you concerned about? (T ALL THAT APPLY)

Osteoporosis or thinning of the bones

59

55

59

60

65

Weight gain

58

63

57

57

55

Getting enough calcium

49

56

49

45

44

Risks associated with hormone replacement therapy

48

53

45

48

46

Hormone replacement therapy

47

53

38

48

46

Atherosclerosis and coronary artery disease

45

50

35

46

48

Natural or alternative therapies

44

45

49

43

38

Cancer

42

47

34

44

44

Diet

24

27

23

25

18

Which ONE of the following issues associated with menopause are you MOST concerned about?

Osteoporosis or thinning of the bones

21

22

21

21

20

Weight gain

16

13

17

18

15

Cancer

15

17

11

14

17

Risks associated with hormone replacement therapy

14

10

16

14

16

Atherosclerosis and coronary artery disease

12

12

8

12

15

Natural or alternative therapies

12

9

18

11

8

Hormone replacement therapy

6

10

2

6

6

Getting enough Calcium

5

7

6

4

3

Diet

1

0

1

0

1

Which of the following treatments are you currently taking? (ALL THAT APPLY)

I am not currently taking any treatment for symptoms related to menopause

67

66

72

65

67

Synthetic hormone therapy prescribed by a doctor

20

20

18

18

23

Other medication prescribed by your doctor used to treat specific problems resulting from menopause (drugs especially for bone loss, cholesterol-lowering drugs)

7

7

5

10

7

Phytoestrogen-based supplements including herbal and soy supplementation

6

7

4

10

3

Natural hormone therapy prescribed by a doctor

3

3

2

3

4

Eating a phytoestrogen-based diet rich in soy, flax seed, and some beans

3

1

2

5

3

Other

3

2

3

4

1

From which of the following sources do you obtain health related information? (ALL THAT APPLY)

Doctor

77

78

78

69

84

Web sites/Internet

73

70

77

74

70

Magazines

52

55

50

52

50

Books

47

46

38

58

47

Friends/Relatives

43

40

48

43

44

Drug store/pharmacy

37

37

37

30

47

TV

35

33

32

41

35

Newspapers

23

25

23

23

20

Other

7

5

6

9

9

References

  1. Kowalcek I, Rotte D, Banz C, Diedrich K (2005) Women’s attitude and perceptions towards menopause in different cultures. Cross-cultural and intra-cultural comparison of pre-menopausal and post-menopausal women in Germany and in Papua New Guinea. Maturitas 51: 227–235. [crossref]
  2. Green R, Santoro N (2009) Menopausal symptoms and ethnicity: the Study of Women’s Health Across the Nation. Womens Health (Lond) 5: 127–133. [crossref]
  3. Santoro NF, Green R (2009) Menopausal symptoms and ethnicity: lessons from the Study of Women’s Health Across the Nation. Menopausal Med 17: 6–8.
  4. Ayers B, Forshaw M, Hunter MS (2010) The impact of attitudes towards the menopause on women’s symptom experience: a systematic review. Maturitas 65: 28–36. [crossref]
  5. Andrikoula M, Prelevic G (2009) Menopausal hot flushes revisited. Climacteric 12: 3–15. [crossref]
  6. Avis NE, Crawford S (2008) Cultural differences in symptoms and attitudes toward menopause. Menopause Manage 17: 8–13.
  7. Hunter MS, Gupta P, Papitsch-Clarke A, Sturdee D (2009) Mid-aged Health in Women from the Indian Subcontinent (MAHWIS): a quantitative and qualitative stud of experience of menopause in UK Asian women, compared to UK Caucasians and women living in Delhi. Climacteric 12: 26–37.
  8. Akkuzu G, Orsal O, Kecialan R (2009) Women’s attitudes towards menopause and influencing factors. Turkiya klinikleri J Med Sci 66–74.
  9. Melby MK, Lock M, Kaufert P (2005) Culture and symptom reporting at menopause. Hum Reprod Update 11: 495–512. [crossref]
  10. Moskowitz HR (2012) ‘Mind genomics’: the experimental, inductive science of the ordinary, and its application to aspects of food and feeding. Physiol Behav 107: 606–613. [crossref]
  11. Moskowitz HR, Gofman A, Beckley J, Ashman H (2006) Founding a new science: Mind genomics. Journal of sensory studies 21: 266–307.
  12. Gofman A, Moskowitz H (2010) Isomorphic permuted experimental designs and their application in conjoint analysis. Journal of Sensory Studies 25: 127–145.
  13. Gabay G, Moskowitz HR, Silcher M, Galanter E (2017) New Novum Organum: Policy, perceptions and emotions in health, Pardes-Ann Harbor Academic Press.

The Need for Fixed Dose Combination (FDC) for the Management of Type 2 Diabetes in Mauritius

DOI: 10.31038/EDMJ.2019331

Abstract

The State health services of Mauritius are provided free to all 1.27 million inhabitants of the island. Despite so, successive surveys by the Ministry of Health and Quality of Life have shown that diabetes remains a major public health threat to Mauritians. With 24% of the adult population affected by (type 2 diabetes) T2D, our island is ranked amongst those countries with highest diabetes-related mortality, which emphasizes the need for educating the population proper self-management of the disease. It is also evident that poor treatment adherence looms large. Patients with T2D under conventional treatment often require multiple medications to achieve glycaemic control. This induces a significant pill burden when coupled with co-morbid conditions associated to diabetes and deters adherence to treatment. Public health institutions in Mauritius support the usage of loose pills for diabetes treatment as opposed to private institutions who promote the adoption of Fixed Dose Combination (FDC) therapy as a means to improve treatment efficacy. A scaled-study was conducted to explore the efficiency and patients’ perspectives on FDC in the management of T2D. 65 patients from the Diabetes and Vascular Health Centre were grouped according to their treatment regimen: FDC from start; switched to FDC from loose pills; reverted to loose pills after trying FDC and loose pills treatment. Patients were interviewed and their clinical parameters recorded. Results showed that 67.7 % of patients were taking more than 7 pills a day to achieve glycaemic control, with only 30.8 % being made aware of possible FDC options by their healthcare practitioner. 96.3% patients who were on loose pills expressed their willingness to shift to FDC if made available in public institutions. Overall glycaemic control was better managed among the FDC group. Our findings concluded that the loose pill regime was indeed problematic for diabetics to achieve optimal glycaemic control. FDC could be pivotal in improving their health outcomes, barriers such as communication of treatment availabilities, financial constraints, shared decision-making and self-management training also need to be addressed.

Keywords

Fixed dose combination (FDC), type 2 diabetes mellitus (T2DM), glycaemic control, diabetes management, conventional treatment, pill burden

Introduction

Diabetes is one of many leading chronic diseases plaguing countries around the world. Commonly considered as a complex heterogenous disease that is associated to the onset of a number of life-threatening secondary complications such as cataract, chronic renal failure, cardiovascular diseases and neurovascular-related amputations- this disease has catastrophic impacts on the quality of life of individuals with uncontrolled diabetes [1]. According to the International Diabetes Federation (IDF), 425 million people suffer from diabetes worldwide. The island of Mauritius is ranked highest in the region of South East Asia with an estimated 1 in every 4 Mauritian adults diagnosed with diabetes, representing a staggering prevalence rate of 24% [2]. Despite being preventable, type 2 diabetes mellitus (T2DM) accounts for the vast majority of cases. The numerous pathways altered by the onset of T2DM partly justifies the multiple therapeutic agents required over time for to achieve glycaemic control. Indicators such as Fasting Blood Sugar (FBS) levels capped at 7.8mmol/L and glycosylated haemoglobin levels (HbA1C) of less than 7.0% are representative of effective treatment and proper glycaemic control [3]. The natural history of T2DM, being a progressive condition, precipitates a shift towards an intensification of medications with time to alleviate the pancreatic stress induced to sustain a normal glycaemic index; as well as other co-morbidities leading to the initiation of polytherapy thereby increasing the complexity of medication [4]. Multifactorial medications for diabetes and related co-morbid conditions can involve up to 10 tablets or more per day, ultimately leading to pill burden over time [5].

Despite T2DM being a progressive disease, patients can still live long, high quality lives by properly managing the disease. At the root, core management of T2DM includes healthy diet, exercise regimen and correct use of medications as prescribed by a physician. However, extent of adherence to treatment has a profound effect on glycaemic control. Behaviours related to treatment adherence and compliance are essential recommendations, where adherence can be measured as the proportion of patients taking ≥80% of their prescribed medications [6]. It is also agreed to be elemental in lowering the risks of microvascular and macrovascular complications and mitigating or delaying at most the onset of polypharmacy [7].

Poor adherence is reflected in various ways including non-initiation of therapy, self-reduction of prescribed medication dosage, non-completion of the medication course among others [8]. On a global scale, poor adherence is shown to impact more than 50% patients, translating to increased morbidity rates, financial burdens and polypharmacy [9, 10]. This can be further supported by systemic reviews which report significant declines in the mean dose-taking compliance when number of daily doses increase [11, 12]. Aside from the profound effect of complexity of treatment on adherence, there do exist several other factors that act as co-determinant in the precipitation of poor adherence. Psychological factors inclusive of poor social support and mental health, health literacy status and general attitude towards effectiveness of treatments based on past experiences from other therapeutic interventions may act as mediators of poor adherence [13]. Those factors related to the healthcare system, such as consultation timing limitations, patient-physician interaction and provision of care by multiple physicians among others should not be dismissed [14].

The impacts of poor adherence are extensive, such as medical readmissions [15] and the onset of clinical inertia; a detrimental behavioural characteristic exhibited by a proportion of healthcare professionals, which is also prevalent in T2DM patients with poor adherence [16, 17, 18]. It should be fair to mention that patients with suboptimal health literacy and less engaged towards treatment practices are affected by delays in treatment escalation, consequential effect of physician-mediated clinical inertia [19]. The most obvious and effective remedial actions to address poor adherence primarily revolve around decreasing polypharmacy to simplify medication regimen and pill burden [11]. As such, the development of dual therapies in the form of loose-pill combination therapy or fixed-dose combination (FDC) therapy has proved to be quite effective in promoting adherence in T2DM patients. Patients who either switched from co-administered dual therapy to FDC or from glyburide or metformin monotherapy to FDC were more adherent to [20, 21]. This therapeutic alternative has also showed promising results in helping newly diagnosed T2DM patients in achieving optimal HbA1c glycaemic targets of < 7.0%, which would not be feasible with a single oral agent [22, 23]. Practitioners unanimously agree that the current treatment regimen of loose pills is scant of achieving good blood sugar control to ward off secondary health complications. The advantages of FDC as reviewed by Vijayakumar et al. [20] are found to be multi-tiered, ranging from better tolerability and bio-availability, to decreased medical expenditure and less discomfort associated with swallowing multiple tablets over single ones. However, in the real-world setting, the percentage of patients adopting FDC is actually quite low. In Mauritius, the public health sector remains one of the major sources for the supply of diabetes medication, but FDC is currently not offered as part of the ‘free treatment’ plan, so overall diabetes management is still observed to be ‘moderately poor’ amongst adults diagnosed with T2DM [24]. The present study aims at exploring patients’ perspectives on FDC therapy in the management of T2DM and to understand the gap in treatment practice within the public health care setting which seems to be limiting the progressive decline of uncontrolled glycaemic control across the T2DM population in Mauritius.

Materials and Methods

Study settings

A total of 65 patients attending the Diabetes and Vascular Health Centre were earmarked to participate in this study. Medical records, i.e. case-sheets of patients who are on fixed-dose combination therapy and standard medication, were accessed. Inclusion criteria was: patients clinically diagnosed with T2DM, 18 years old and above, on at least two classes of oral hypoglycaemic agents or on fixed-dose combination tablets. Patients who either suffered from type 1 diabetes mellitus or gestational diabetes, as well as those on insulin therapy or less than two classes of oral hypoglycaemic agents as separate pills were automatically excluded. The participants were segmented into four groups according to their current and previous treatments: Group A – on FDC since start of treatment; Group B – switched from separate pills to FDC during treatment; Group C – on separate pills since start of treatment; and Group D – on FDC for a short time before reverting to separate pills (Figure 1). A non-probabilistic sampling strategy was used for Group A, B, and D, while participants from group C were chosen based on their adherence to clinical appointments and willingness to participate.

EDMJ 2019-112 - Meera Jhoti Mauritius_F1

Figure 1. Grouping of participants based on previous and on-going diabetic treatment plan.

Data Collection & Analysis

Using a mixed-method strategy, a pre-tested, self-designed questionnaire consisting of five sections inclusive of the patient’s biodata, medical history and clinical parameters, compliance to diabetes management, attitudes towards medications, knowledge and attitudes to fixed-dose combination therapy was administered individually. A focus group was conducted to probe into potential existing issues with the current treatments and fixed dose combination tablets. Data was analysed using SPSS (v 23.0) using Pearson’s chi-squared test and Mann-Whitney U-test to measure group-based differences for non-parametric values. The level of significance was set at P < 0.05.

Reliability

Reliability within each dimension was tested factoring subjectivity and masked responses given that the data was collected by the healthcare professionals involved in their treatment. The following values were recorded: Compliance, α = 0.496; Attitude to medication, α = 0.410; and knowledge and attitude to FDC, α = 0.577. The mean inter-item correlation per dimension was calculated and found to be within the range of 0.2–0.4 deemed to produce an optimal level of homogeneity [25].

Ethics

Ethical clearance for this study was granted by the Ministry of Health and Quality of Life (#MHC/CT/NETH/OZM).

Results

Population demographics and current health status

The sample population consisted of a higher percentage of male patients (male vs female: 52.3% vs 47.7%) from all the 4 groups. An exception was noted for Group B, i.e. patients who shifted from loose pills to FDC, as a higher number of female patients were more willing to transition to a new therapeutic method compared to males (female vs male: 59.3% vs 40.7%). A low employment status (33%) and high literacy rate (83.3%) was observed in Group A as opposed to Group B whereby 55.5% were actively employed and contrastingly were from a basic educational background (63% at a primary level) (Table 1). Findings also reported a shift towards FDC occurring towards the later stages of life, with 77.7% patients above the age of 50 years under such treatment. Clinical parameters showed some common traits across groups such as Body Mass Index (BMI) of approximately 40–67% patients categorized as overweight. Patients who were on FDC since the start of treatment or shifted to FDC mid treatment had a better blood pressure profile with 63–68% achieving a ratio of less than 140/90 mmHg, as opposed to those still on separate pills therapy (Table 2). These findings were further supported by the strong association (Cramer’s V = 0.322) between treatment type and the blood pressure profile (X2(6) = 13.52, p < 0.05); and the clear difference between patients on or who shifted to FDC versus patients on separate pills (Group A vs Group C, 56.00 vs 505.00, U = 35.00, p = 0.02; Group B vs Group C, 565.00 vs 920.00, U = 187.00, p = 0.001); results confirming a higher blood pressure profile among patients on conventional treatment, i.e. separate pills. Other clinical parameters such as serum cholesterol and creatinine were not affected by the treatment methods given the relatively similar levels across the groups.

Table 1. Demographic profile of study participants (N = 65).

Gender

Group A

Group B

Group C

Group D

Male

66.7%

40.7%

55.6%

80%

Female

33.3%

59.3%

44.4%

20%

Age

 < 40 years

7.4%

40–49 years

14.8%

14.8%

50–59 years

50%

29.6%

25.9%

60%

≥60 years

50%

48.1%

59.3%

40%

Occupation

Employed

33.3%

18.5%

29.6%

40%

Self-employed

14.8%

25.9%

40%

Housewife

16.7%

22.2%

18.5%

Retired

33.3%

29.6%

25.9%

Not employed

16.7%

14.8%

20%

Education level

None

16.7%

7.4%

18.5%

Primary

37%

63%

40%

Secondary

33.3%

40.7%

18.5%

20%

Tertiary

50%

14.8%

40%

Group Aon FDC since start of treatment; Group Bswitched from separate pills to FDC during treatment; Group Con separate pills since start of treatment; and Group Don FDC for a short time before reverting to separate pills

Table 2. Health Status of study participants (N = 65)

Clinical Parameters

Group A

Group B

Group C

Group D

BMI (Kg/m2)

Normal

16.7%

44.4%

18.5%

20%

Overweight

66.7%

40.7%

40.7%

60%

Obese

16.7%

14.8%

40.7%

20%

Blood Pressure (mmHg)

 < 140/90

66.7%

63%

22.2%

40%

140–159/90–99

33.3%

29.6%

40.7%

40%

160–179/100–109

7.4%

37%

20%

≥ 180/110

Serum Total Cholesterol (mmol/L)

 < 4.5

66.7%

66.7%

63%

60%

≥ 4.5

33.3%

33.3%

37%

40%

Serum Creatinine (umol/L)

 < 124

100%

96.3%

96.3%

100%

≥ 124

3.7%

3.7%

Group Aon FDC since start of treatment; Group Bswitched from separate pills to FDC during treatment; Group Con separate pills since start of treatment; and Group Don FDC for a short time before reverting to separate pills

Glycaemic index across and within treatment groups

44.6% of the patients had a long history of diabetes, i.e. more than 10 years. Analysis of their current glycemic parameters revealed a potentially higher proportion of patients from Group A and B with fasting blood sugar (FBS) levels of less than 7 mmol/L, however, no concrete association was distinguished between the treatment group and their immediate glycemic index which could be accounted by 66 -78% patients having an FBS level of less than 8.4 mmol/L across the different groups (Figure 2A). The glycemic index within group B showed a strong association (Cramer’s V = 0.451) with respect to FBS levels and treatment stage, i.e. prior to and after switching to FDC (X2(3) = 10.991, P < 0.05). Non-parametric paired Wilcoxon Signed Ranks test showed improved FBS levels post-FDC treatment switch with 17 patients scoring better after resorting to FDC therapy (Z = -3.570, P < 0.001) (Figure 2A). Although similar associations were not drawn for HbA1c levels (P = 0.093), related findings were observed when comparing the HbA1c levels pre and post FDC treatment switch (Z = -3.441, P = 0.001) advocating the efficiency of FDC treatment on the net amelioration of glycemic parameters (Figure 2B).

EDMJ 2019-112 - Meera Jhoti Mauritius_F2

Figure 2. (A) Fasting blood sugar (FBS) levels (B) HbA1c levels recorded in patients who shifted to fixed dose combination (FDC) from separate pills. (Solid line – current levels recorded, Dotted lines – levels measured prior to FDC switch)

Pill burden, complexity of treatment and adherence to medication

As detailed in Table 3, 67.7% of patients were taking more than 7 pills a day, while 24.6 % were on both oral hypoglycemic agents and insulin therapy. The majority patients from group C had a higher daily pill intake for diabetes and associated diseases (85.2%) as compared to group A (33.3%) and B (51.9%) supporting the association between treatment group and total number of prescribed medications (X2(6) = 18.229, p < 0.001) (Table 3). Patients from Group A reported to have never missed their diabetic medication compared to group B (85.5%) and group C (77.8%) who admitted to have missed their diabetes medications more than 3 times.. The data strongly supported the association between increasing treatment complexity across the groups and number of pills remaining (X2(9) = 19.048, P < 0.05); with higher number of pills remaining for group C versus B patients (918.50 vs 566.50; U = 188.50, P < 0.01). Prime cause was confusion due to increased number of pills to be taken (Figure 3). Other listed justifications such as forgetting to take pills, need help at home to take pills, taking pills over time become more difficult, feel taking too many medications, feeling anxious when having to take pills, deliberately omitting pills, portioning or taking extra medication did not seem to differ much in terms of behavioral attitudes across groups. However, in terms of monthly pill renewal, no marked discrepancies were found between the 4 groups (X2(3) = 3.08, P > 0.05), as all patients from were regular on their medication renewal. Moreover, since 92.3 % of patients also suffered from other associated diseases (50 patients with co-existing hypertension and 39 patients suffering from dyslipidemia), the ability to distinguish and map the different classes of medication to the treating disease was assessed. Results showed a near significant association between those two dimensions (X2(2) = 5.32, P = 0.07) with group C having a handicap in terms of medication mapping as compared to group B (820.50 vs 664.50; U = 286.50, P < 0.05). This supports the claim that FDC indeed decreases complexity of treatment in general.

EDMJ 2019-112 - Meera Jhoti Mauritius_F3

Figure 3. Perception of pill burden across treatment groups

N, never; R, rarely; S, sometimes; and A, always. P<0.05. Group Aon FDC since start of treatment; Group Bswitched from separate pills to FDC during treatment; Group Con separate pills since start of treatment; and Group Don FDC for a short time before reverting to separate pills

Table 3. Diabetes and associated diseases’ medication profile.

Classes of oral diabetes medications

Group A

Group B

Group C

Group D

2 classes

50%

59.3%

100%

80%

3 classes

50%

40.7%

4 classes

20%

Number of diabetes pills/day

1–3 pills

66.7%

55.6%

7.4%

20%

4–6 pills

33.3%

33.3

29.6%

80%

7–9 pills

11.1

63%

10–12 pills

Total number of pills/ day

1–3 pills

33.3%

7.4%

4–6 pills

33.3%

40.7%

14.8%

≥ 7 pills

33.3%

51.9%

85.2%

100%

Group Aon FDC since start of treatment; Group Bswitched from separate pills to FDC during treatment; Group Con separate pills since start of treatment; and Group Don FDC for a short time before reverting to separate pills

Adherence to general diabetes recommendations

44% of patients from group B acquired their diabetes medication both from private and public medical facilities. However, the public sector remains one of the major sources for diabetes medication supply in Mauritius. 90.8% of patients stated that they had received counselling and explanation on how and when to take their medications. 40% of patients from groups C and D also admitted to having missed their appointment with the healthcare practitioner. Of concern, 66.7% from group C did not have access to a glucometer to monitor their glucose levels at regular intervals, thus heavily depended on public health services (Table 4). With respect to lifestyle choices 40–70% of patients indulged in unhealthy eating behavior, which reflects a lack of stringency with respect to their dieting habits.

Table 4. Lifestyle and health check status among diabetes patients under different treatment.

Group A

Group B

Group C

Group D

Practising Exercise

66.7%

81.5%

70.4%

60%

Intake of unhealthy foodstuffs

44.4%

44.4%

45.7%

66.70%

Patients compliant to medication intake instructions

100%

88.9%

74.1%

80%

Patients missing/delaying their appointment with HCP

0%

11.1%

18.5%

40%

Patients renewing their medications on time

100%

96.3%

96.3%

80%

Patients attending for diabetic retinopathy screening

83.3%

100%

77.8%

100%

Patients attending for diabetic foot screening

66.7%

85.2%

70.4%

80%

Patients using a glucometer

100%

85.2%

33.3%

60%

Group A – on FDC since start of treatment; Group Bswitched from separate pills to FDC during treatment; Group Con separate pills since start of treatment; and Group Don FDC for a short time before reverting to separate pills

Attitude and barriers towards adoption of FDC

Only 30.8 % of patients were aware that 2 or more active medication ingredients may be present in a single pill, whereas only 54.6% were aware that FDC therapy consisted of two active diabetes medications. 84.6 % of patients agreed that FDC was important to decrease pill burden, with patients from group C and D expressing their willingness to move to FDC if made available in the public health care sector (96.3 and 80% respectively). Cost, on the other hand, was believed to be the most common drawback for using FDC (Figure 4).

Discussion

Impact of treatment type on systemic clinical parameters

While no association was depicted among clinical parameters such as BMI, serum creatinine and serum total cholesterol, across the treatment groups, blood pressure (BP) control significantly differed for patients who were on FDC versus those on separate pills, aligning with studies which have demonstrated a better blood pressure control in T2DM patients under anti-hypertensive and anti-diabetic FDC treatment [26]. 77.7% of patients on loose pills in our study were affected by high BP, which would warrant the use of FDC therapy targeting both their diabetic and hypertensive pathologies to ameliorate their health status as recommended by the American Diabetes Association [27]. Pathology-specific FDC treatment appears to play a vital role in managing T2DM to reach the ultimate target of achieving a blood pressure of < 140/90 mmHg among those patients. Among other health status determinants, a closer examination of BMI across groups revealed an obesity index of 40% vs. 14.8% among participants on separate pills and FDC respectively. Majority of patients (92.3%) had associated conditions, mainly hypertension and dyslipidemia, reflecting the long years, i.e. more than 10 years with a diabetic condition and supporting the notion of augmented risk of developing comorbid conditions with increased disease duration [28]. Interestingly, BMI adds to the equation whereby increase in BMI heightens the prevalence rate of hypertension, diabetes, and dyslipidemia [29, 30], validating the measures of those clinical parameters in the assessment of T2DM and treatment strategies. Restoring normal BMI through exercise and diet has been proved to positively contribute to the control of glycaemic index and lipid profile [31, 32]. The present study did not overlook the eating and exercising habits of the participants. Overall, a week prior to the study, 44.6 % participants used sugar, 60 % took some forms of sweet and 35.4 % had soft drinks, which shows the poor compliance in to dietary recommendations in accordance with other studies [33] and which may attributed to the perception of diet as a burden [34]. Therefore, modifying behavioural attitude towards clinically recommended lifestyle habits and treatment options may prove to enhance diabetic control.

EDMJ 2019-112 - Meera Jhoti Mauritius_F4

Figure 4. Attitudes and barriers towards adoption of fixed dose therapy amongst participants (N = 65)

FDC as a measure to improve glycaemic index in T2DM patients

No significant differences were recorded with respect to glycaemic index across the groups However; probing further into group B (patients who shifted from separate pills to FDC) a major improvement was depicted in their FBS and HbA1c levels, which is in line with findings of Thayer et al. [35] who a reported decrease in HbA1c levels following a swap from mono-therapeutic agents to a rosiglitazone/glimepiride FDC treatment. Similarly, Raskin et al. [36] demonstrated the ability of coupling repaglinide/metformin as an FDC regimen to induce a more rapid decrease in HbA1c levels, as opposed to monotherapy. The present findings are in support of such clinical studies which claim that lower doses of 2 agents in fixed combinations may offer greater efficacy in combination, at the same time reducing the risk of adverse events that may occur with higher doses of monotherapy [37].

Conventional therapies and failure to adhere to medication and general recommendations

Medication adherence is closely related to the drug regimen of the patients. The progressive nature of T2DM and its potent role in the generation of non-communicable diseases [38], increases by default the treatment spectrum to encompass the associated complications. A staggering 70% of patients in the present study were on more than 7 pills for diabetes and comorbid disease regulation. Pill burden is a major thorn in keeping T2DM treatment on track. A 5-year study on the change in medication profile after onset of diabetes, revealed an increase in pills targeting the cardinal comorbidities such as hypertension and dyslipidemia. Comparative analysis of the 4 treatment groups identified the following drawbacks whilst on loose pill therapy: difficulty in preparing doses, extended time taken to medicate, accidental mixing tablets/doses, as well as the overall cost of medication [39, 40, 41, 8], compared to those of FDC, the latter who were more rigid on their treatment schedule and pills intake. Moreover, compared to groups A and D, a significantly proportion of patients from group C had pills remaining when at the time of their next appointment, implying the notion of pill burden and non-compliance majorly associated to conventional therapies. Studies by up-titration, a core process in monotherapy, is streamlined or reduced in FDC, positively impacting the effects of pill burden as well as decreasing the adverse effects prevailing from high up-titrated doses of anti-diabetic agents [42].

Lifestyle factors play a critical role in the pre-disposition and management of T2DM. Considering the recommendations of the American Diabetes Association [27], a diet consisting of food with low glycaemic load and reduced sugar levels achieves better FBS control. Additionally, diet plans inclusive of high–unsaturated/low–saturated fat diet [43], low–glycaemic index diet [44], and low-carbohydrate ketogenic diets [45] have proved to be effective in normalizing the glycaemic index of T2DM patients. Physical activity routines including high-intensity progressive resistance training, and its modified version with coupled high-protein diet have been found to be effective in weight loss and improvements in glycaemic parameters [46, 47]. Our study showed that majority participants across all treatment groups were non-compliant with the recommendations as indicated by a meagre 26% engaged in physical activity for more than 3 times a week; and 50% with poor dieting habits. This could potentially be attributed to the lack of self-management know-how and unstimulated interests in self-care strategies, warranting better educational frameworks to be implemented in Mauritius to help improve lifestyle decisions amongst diabetics [48].

Knowledge, benefits and barriers to FDC: Patients’ perspective

Health literacy has a great impact on adherence and severity of illness perception such that low and moderate literacy among patients augments the perception of diabetes or co-morbid illnesses as ‘threatening’ which impairs medical adherence. The present data does not significantly point to perceptions of similar nature, but, 30–40% of patients from group B and C were in agreement of the stated perception. Therefore, the suggested role of health literacy as a protective factor in terms of medical adherence may be dependent on socio-economic status of the patients. A study by Powell et al. [49] explored and demonstrated the detrimental impacts of poor health literacy on declining glycaemic control. Our data showed similar results in terms of knowledge of FDC amongst group C patients, where only 7% aware of the existence of FDC. Modality of drug functions were not well spread among patients given that only 55% of patients on FDC were aware of its mechanism of action with a combination of two active ingredients. Poor knowledge of FDC could be attributed to a lack of knowledge about diabetes, public policies and availability of medication in public institutions; and clinical inertia [50, 51, 52]. In Mauritius, FDC is not part of the welfare programme, hence it cannot be prescribed by public health care professionals to T2DM patients. Such public policy matters are also of concern in countries such as Canada [53]. Clinical inertia, on the other hand, has developed into a prominent issue in the regulation of glycaemic index among T2DM patients and justifications for such stagnancy in treatment have been tossed between the patient and clinician. A fundamental approach towards reducing clinical inertia revolves around the education and continuous training of clinicians to be up-to-date with modern pharmaceutical agents and treatment strategies available for the betterment of the T2DM patients [54, 55].

A pertinent finding from this study was the impact FDC on the quality of life (QOL) of patients, specifically with respect to mental health. Patients from group A were not anxious during medication time as opposed to patients from group C, reports which corroborate data from Heckbert et al. [56] highlighting the association between patients with uncontrolled HbA1c levels and depression. Identification of psychosocial determinants which may exacerbate poor glycaemic control and adherence is important during the early stages of diabetes diagnosis as progression of disease and its associated treatment intensification may lead to a perception of failure in the day-to-day management of diabetes further demotivating the patient [57]. Treating mental health irregularities may also prove to be beneficial in strengthening the sustenance of healthy lifestyle habits in T2DM [58], hence the decrease in anxiety which is mediated by FDC appears to be a good indicator of the functionality of this therapeutic method on patients’ QoL.

FDC – cost implication of lifelong treatment

In the present study, cost was cited as being the prime justification for reverting back to separate pills therapy in group D patients. This was further supported by the fact that 25% of patients were complementing medications received in the public sector with medications bought from private pharmacies leading to drug wastage and mediated by the inability of the welfare programme and insurance policies to cover the FDC pills. T2DM patients have high medical costs, averaging $14, 000 as a result of the direct and indirect costs associated to the treatment of diabetes and its co-morbid conditions [59]. Similarly, Indian patients on loose pills therapy spend a monthly average of 216 rupees which roughly amounts to the cost of one FDC pill [60]- a situation which is replicated in Mauritius given that this type of treatment is not covered by the healthcare welfare; further endorsing an in-depth situational analysis and revamping of the medical coverage and treatment availability in the public sector. The call for a review of the anti-diabetic medication dispensing programme is further warranted given that FDC-associated costs are reported to be the inverse to what is claimed by the National Institute for Health and Clinical Excellence, with a yearly expenditure of approximately $1600 on FDC vs. $1900 on separate pills [61, 62]. Interestingly, many FCD respondents who mentioned that the pill strength was too high, which is relevant given the inflexibility of FDC and tailoring of dosage to individual characteristics inclusive of demographics and pharmacogenetics [63].

Conclusion

Our findings contribute to the scarcity of information pertaining to the patients’ outlook on T2DM treatment with emphasis on fixed dose combination therapy in Mauritius. Although being a welfare state which provides health care services free of charge, our findings have highlighted the consensus that medications from the public hospitals in the form of loose pills are burdensome, resulting in ineffective diabetes and co-morbidity management. Moreover, the relevance of patient empowerment in doctor-patient consultations should not be overlooked when challenged with finding solutions to reduce global incidence of hyperglycemia and adverse effects in dual therapy with individual components.

Contribution

MYO: study design and data collection; MP and JSB: study design, statistical analysis, manuscript editing and writing. All authors read and approved the final manuscript.

Acknowledgement

Authors would like to acknowledge the Ministry of Health and Quality of Life for granting access to relevant medical records, and the staff at Diabetes and Vascular Health Centre, Souillac for their support.

References

  1. Trikkalinou A, Papazafiropoulou AK, Melidonis A (2017) Type 2 diabetes and quality of life. World J Diabetes 8: 120–129. [crossref]
  2. International Diabetes Federation. IDF Diabetes Atlas 8th edition. Brussels, Belgium: International Diabetes Federation, 2017. Available: http: //www.diabetesatlas.org
  3. International Diabetes Federation. Recommendations For Managing Type 2 Diabetes In Primary Care, 2017. Available: www.idf.org/managing-type2-diabetes
  4. Druss BG, Marcus SC, Olfson M, Tanielian T, Elinson L, Pincus HA (2001) Comparing the national economic burden of five chronic conditions. Health Aff (Millwood) 20: 233–241
  5. Blüher M, Kurz I, Dannenmaier S, Dworak M (2015) Pill Burden in Patients With Type 2 Diabetes in Germany: Subanalysis From the Prospective, Noninterventional PROVIL Study. Clin Diabetes 33: 55–61. [crossref]
  6. Feldman BS, Cohen-Stavi CJ, Leibowitz M, Hoshen MB, Singer SR, et al. (2014) Defining the role of medication adherence in poor glycemic control among a general adult population with diabetes. PLoS One 9: 108145. [crossref]
  7. Chawla A, Chawla R, Jaggi S (2016) Microvasular and macrovascular complications in diabetes mellitus: Distinct or continuum? Indian J Endocrinol Metab 20: 546–551. [crossref]
  8. García-Pérez LE, Alvarez M, Dilla T, Gil-Guillén V, Orozco-Beltrán D (2013) Adherence to therapies in patients with type 2 diabetes. Diabetes Ther 4: 175–194. [crossref]
  9. Bailey CJ, Kodack M (2011) Patient adherence to medication requirements for therapy of type 2 diabetes. Int J Clin Pract 65: 314–322
  10. Rozenfeld Y, Hunt JS, Plauschinat C, et al (2008) Oral antidiabetic medication adherence and glycemic control in managed care. Am J Manag Care 14: 71–75
  11. Pantuzza LL, Ceccato MGB, Silveira MR, Junqueira LMR, Rei AMM (2017) Association between medication regimen complexity and pharmacotherapy adherence: a systematic review. Eur J Clin Pharmacol 73: 1475–1489
  12. Claxton AJ, Cramer J, Pierce C (2001) A systematic review of the associations between dose regimens and medication compliance. Clin Ther 23: 1296–1310
  13. Gonzalez JS, Tanenbaum ML, Commissariat PV (2016) Psychosocial Factors in Medication Adherence and Diabetes Self-Management: Implications for Research and Practice. Am Psychol 71: 539–551
  14. Brown MT, Bussell JK (2011) Medication adherence: WHO cares? Mayo Clin Proc 86: 304–314. [crossref]
  15. Abughosh SM, Wang X, Serna O, et al (2016) A pharmacist telephone intervention to identify adherence barriers and improve adherence among nonadherent patients with comorbid hypertension and diabetes in a medicare advantage plan. J Manag Care Spec Pharm 22: 63–73
  16. Triplitt C (2010) Improving treatment success rates for type 2 diabetes: recommendations for a changing environment. Am J Manag Care 16: S195–S200
  17. Grant R, Adams AS, Trinacty CM, Zhang F, Kleinman K, Soumerai SB, Meigs JB, Ross-Degnan D (2007) Relationship between patient medication adherence and subsequent clinical inertia in type 2 diabetes glycemic management. Diabetes Care 30: 807–812
  18. Reach G, Pechtner V, Gentilella R, Corcos A, Ceriello, A (2017) Clinical inertia and its impact on treatment intensification in people with type 2 diabetes mellitus. Diabetes & Metabolism 43: 501–511
  19. Pantalone KM, Misra-Hebert AD, Hobbs TM, Ji X, et al. (2018) Clinical Inertia in Type 2 Diabetes Management: Evidence From a Large, Real-World Data Set. Diabetes Care 41: 113–113e114. [crossref]
  20. Vijayakumar TM, Jayram J1, Meghana Cheekireddy V1, Himaja D1, Dharma Teja Y1, et al. (2017) Safety, Efficacy, and Bioavailability of Fixed-Dose Combinations in Type 2 Diabetes Mellitus: A Systematic Updated Review. Curr Ther Res Clin Exp 84: 4–9. [crossref]
  21. Cheong C, Barner JC, Lawson KA, Johnsrud MT (2008) Patient adherence and reimbursement amount for antidiabetic fixed-dose combination products compared with dual therapy among Texas Medicaid recipients. Clin Ther 30: 1893–1907
  22. Defronzo RA, Eldor R, Abdul-Ghani M (2013) Pathophysiologic Approach to Therapy in Patients With Newly Diagnosed Type 2 Diabetes. Diabetes Care 36: S127-S138
  23. Han S, Iglay K, Davies MJ, Zhang Q, Radican L (2012) Glycemic effectiveness and medication adherence with fixed-dose combination or coadministered dual therapy of antihyperglycemic regimens: a meta-analysis. Curr Med Res Opin 28: 969–977
  24. Mauritius Non-Communicable Diseases (NCD) survey report. The Trends in Diabetes and Cardiovascular Disease Risk in Mauritius 2015. Available: http: //health.govmu.org/English/Statistics/Pages/NCD-Survey-Reports.aspx
  25. Briggs SR, Cheek JM (1986) The role of factor analysis in the development and evaluation of personality scales. J Pers 54: 106–148
  26. Weber MA, Bakris GL, Jamerson K, Weir M, Kjeldsen SE, et al. (2010) Cardiovascular events during differing hypertension therapies in patients with diabetes. J Am Coll Cardiol 56: 77–85. [crossref]
  27. American Diabetes Association (2017) Standards of medical care in diabetes. Diabetes care 40: S11–24
  28. Lopez Stewart G, Tambascia M, Rosas Guzmán J, Etchegoyen F, Ortega Carrión J, et al. (2007) Control of type 2 diabetes mellitus among general practitioners in private practice in nine countries of Latin America. Rev Panam Salud Publica 22: 12–20. [crossref]
  29. Nguyen NT, Magno CP, Lane KT, Hinojosa MW, Lane JS (2008) Association of Hypertension, Diabetes, Dyslipidemia, and Metabolic Syndrome with Obesity: Findings from the National Health and Nutrition Examination Survey, 1999 to 2004. J Am Coll Surg 207: 928–934
  30. Cercato C, Mancini MC, Arguello AM, Passos VQ, Villares SM, Halpern A (2004) Systemic hypertension, diabetes mellitus, and dyslipidemia in relation to body mass index: evaluation of a Brazilian population. Rev Hosp Clin Fac Med Sao Paulo 59: 113–118
  31. Boulé NG, Haddad E, Kenny GP, Wells GA, Sigal RJ (2001) Effects of Exercise on Glycemic Control and Body Mass in Type 2 Diabetes MellitusA Meta-analysis of Controlled Clinical Trials. JAMA 286: 1218–1227
  32. Halle M, Berg A, Garwers U, Baumstark MW, Knisel W, et al. (1999) Influence of 4 weeks’ intervention by exercise and diet on low-density lipoprotein subfractions in obese men with type 2 diabetes. Metabolism. 48: 641–664
  33.  Nelson KM, Reiber G, Boyko EJ; NHANES III (2002) Diet and exercise among adults with type 2 diabetes: findings from the third national health and nutrition examination survey (NHANES III). Diabetes Care 25: 1722–1728. [crossref]
  34.  Vijan S, Stuart NS, Fitzgerald JT, Ronis DL, Hayward RA, et al. (2005) Barriers to following dietary recommendations in Type 2 diabetes. Diabet Med 22: 32–38. [crossref]
  35. Thayer S, Arondekar B, Harley C, Darkow TE (2010) Adherence to a Fixed-Dose Combination of Rosiglitazone/Glimepiride in Subjects Switching from Monotherapy or Dual Therapy with a Thiazolidinedione and/or a Sulfonylurea. Ann Pharmacothr 44: 791–799
  36. Raskin P, Lewin A, Reinhardt R, Lyness W (2009) Repaglinide/Metformin Fixed-Dose Combination Study Group. Twice-daily dosing of a repaglinide/metformin fixed-dose combination tablet provides glycaemic control comparable to rosiglitazone/metformin tablet. Diabetes Obes Metab 11: 865–873
  37. Abdulsalim S, Peringadi Vayalil M, Miraj SS (2016) New fixed dose chemical combinations: the way forward for better diabetes type II management? Expert Opin Pharmacother 17: 2207–2214. [crossref]
  38. Chaudhury A, Duvoor C, Reddy Dendi VS, Kraleti S, Chada A, et al. (2017) Clinical Review of Antidiabetic Drugs: Implications for Type 2 Diabetes Mellitus Management. Front Endocrinol (Lausanne) 8: 6. [crossref]
  39. Saundankar V, Peng X, Fu H, Ascher-Svanum H, Rodriguez A, et al. (2016) Predictors of Change in Adherence Status from 1 Year to the Next Among Patients with Type 2 Diabetes Mellitus on Oral Antidiabetes Drugs. JMPC 22: 467–482
  40.  Black JA, Simmons RK, Boothby CE, Davies MJ, Webb D, et al. (2015) Medication burden in the first 5 years following diagnosis of type 2 diabetes: findings from the ADDITION-UK trial cohort. BMJ Open Diabetes Res Care 3: 000075. [crossref]
  41. Farrell B, French Merkley V, Ingar N (2013) Reducing pill burden and helping with medication awareness to improve adherence. Can Pharm J (Ott) 146: 262–269. [crossref]
  42. Lavernia F, Adkins SE. Shubrook JH (2015) Use of oral combination therapy for type 2 diabetes in primary care: Meeting individualized patient goals. Postgraduate Medicine127: 808–817
  43. Tay J, Luscombe-Marsh ND, Thompson CH, Noakes M, Buckley JD, et al. (2014) A very low-carbohydrate, low-saturated fat diet for type 2 diabetes management: a randomized trial. Diabetes Care 37: 2909–2918. [crossref]
  44. Jenkins DJA, Kendall CWC, Mckeown-Eyssen G, Josse RG, Silverberg J, Booth GL, et al. (2008) Effect of a Low–Glycemic Index or a High–Cereal Fiber Diet on Type 2 Diabetes: A Randomized Trial. JAMA 300: 2742–2753
  45. Yancy WS Jr1, Foy M, Chalecki AM, Vernon MC, Westman EC (2005) A low-carbohydrate, ketogenic diet to treat type 2 diabetes. Nutr Metab (Lond) 2: 34. [crossref]
  46. Dunstan DW, Daly RM, Owen N, Jolley D, De Courten M, et al. (2002) High-intensity resistance training improves glycemic control in older patients with type 2 diabetes. Diabetes Care 25: 1729–1736. [crossref]
  47. Wycherley TP, Noakes M, Clifton PM, Cleanthous X, Keogh JB, et al. (2010) A high-protein diet with resistance exercise training improves weight loss and body composition in overweight and obese patients with type 2 diabetes. Diabetes Care 33: 969–976. [crossref]
  48. Davies MJ, Heller S, Skinner TC, Campbell MJ, Carey ME, et al. (2008) Effectiveness of the diabetes education and self-management for ongoing and newly diagnosed (DESMOND) programme for people with newly diagnosed type 2 diabetes: cluster randomised controlled trial. BMJ 336: 491–495. [crossref]
  49. Powell CK, Hill EG Clancy DE (2007) The Relationship between Health Literacy and Diabetes Knowledge and Readiness to Take Health Actions. Diabetes Educ 33: 144–151
  50. Abbasi YF, See OG, Ping NY, Balasubramanian GP, Hoon YC, et al. (2018) Diabetes knowledge, attitude, and practice among type 2 diabetes mellitus patients in Kuala Muda District, Malaysia – A cross-sectional study. Diabetes Metab Syndr 12: 1057–1063. [crossref]
  51. Kueh YC, Morris T Ismail AAS (2017) The effect of diabetes knowledge and attitudes on self-management and quality of life among people with type 2 diabetes. J Health Psychol 22: 138–144
  52. Pashaki MS, Eghbali T, Niksima SH, Albatineh AN Gheshlagh RG (2019) Health literacy among Iranian patients with type 2 diabetes: A systematic review and meta-analysis. Diabetes Metab Syndr 13: 1341–1345
  53. Canadian Diabetes Association (2019)Diabetes Canada’s Position on Government Efforts to Control Drug Costs. Available: https: //www.diabetes.ca/about-cda/public-policy-position-statements/government-efforts-to-control-drug-costs
  54. Shera AS, Jawad F Basit A (2002) Diabetes related knowledge, attitude and practices of family physicians in Pakistan. J Pak Med Assoc 52: 465–470
  55. Goswami N, Gandhi A, Patel P, Dikshit R (2013) An evaluation of knowledge, attitude and practices about prescribing fixed dose combinations among resident doctors. Perspect Clin Res 4: 130–125
  56. Heckbert SR, Rutter CM, Oliver M, Williams LH, Ciechanowski P, et al. (2010) Depression in relation to long-term control of glycemia, blood pressure, and lipids in patients with diabetes. J Gen Intern Med 25: 524–529. [crossref]
  57.  Ross SA (2013) Breaking down patient and physician barriers to optimize glycemic control in type 2 diabetes. Am J Med 126: S38–48. [crossref]
  58. Petrak, F, Baumeister H, Skinner TC, Brown A Holt RIG (2015) Depression and diabetes: treatment and health-care delivery. Lancet Diabetes Endocrinol 3: 472–485
  59. Zhuo X, Zhang P, Barker L, Albright A, Thompson TJ, et al. (2014) The lifetime cost of diabetes and its implications for diabetes prevention. Diabetes Care 37: 2557–2564. [crossref]
  60. Kannan S, Mahadevan S, Ramakrishnan A (2015) Fixed dose combinations for type 2 diabetes. Lancet Diabetes Endocrinol 3: 408. [crossref]
  61.  Clarke PM1, Avery AB2 (2014) Evaluating the costs and benefits of using combination therapies. Med J Aust 200: 518–520. [crossref]
  62. Hutchins V, Zhang B, Fleurence R L, Krishnarajah G, Graham J (2011) A systematic review of adherence, treatment satisfaction and costs, in fixed-dose combination regimens in type 2 diabetes. Curr Med Res Opin 27: 1157–1168
  63. Seedat YK (2008) Fixed drug combination in hypertension and hyperlipidaemia in the developing world. Cardiovasc J Afr 19: 124–126. [crossref]

Ultrasonographic Changes in Fascial Properties over Time after Myofascial Release

DOI: 10.31038/IJOT.2019214

Abstract

Recently, ultrasonic imaging modalities have been increasingly used to observe the locomotor apparatus. Furthermore, a high reliability has been reported for the measurements of fascial displacement using ultrasonic imaging and of muscle stiffness using ultrasonic elastography. This study aimed to clarify the ultrasonographic changes in fascial displacement and muscle stiffness induced by Myofascial Release (MFR). We divided 51 healthy adults (24 males and 27 females) into three groups: MFR, Static Stretching (SS), and control groups. The passive ankle joint dorsiflexion angle, isometric ankle joint flexor muscle strength, superficial- and deep-layer fascial displacement, and muscle stiffness were each measured before, immediately after, and at 4 days after an intervention. All parameters in the MFR group showed significant changes immediately after and 4 days after the intervention compared with those at baseline. The MFR group also showed more significant changes in the dorsiflexion angle, fascial displacement, and muscle stiffness after 4 days compared with the SS group. Thus, MFR improves the viscoelasticity of the gelled matrix and eliminates the densification of collagen and elastin fibers, thereby smoothing fascial gliding. Consequently, this technique may help to regain the gliding ability of the fascia during joint movement and muscle contraction. In addition, it was also suggested that changes in physical function and fascial property due to MFR were significantly different after 4 days.

Keywords

Myofascial Release, Static Stretching, Fascial Displacement, Muscle Stiffness, Changes Over Time

Introduction

The fascia is a tissue which envelops the whole body on the sheath from head to toe and is continuous from the surface of the soft tissue to the visceral organ. One of the main functions of the fascia is to support the organs, and in addition to supporting blood vessels, nerves, and lymphatics, it passes through them. Therefore, when a functional abnormality (such as densification of collagen and elastin fiber, gelation of matrix, aggregation of hyaluronic acid) occurs in the fascia, symptoms such as pain, malalignment, limited range of motion, or muscle output weakness are manifested [1]. Myofascial release (MFR) is a manual therapy used to treat fascial dysfunctions, such as dysfunctions, including collagen and elastin fiber densification, matrix gelation, and hyaluronic acid agglomeration, by continuously applying gentle pressure and extension to the deep fascia [1]. We previously investigated the immediate and long-term effects (6 days) of MFR for the hamstrings based on the straight-leg-raising angle and the knee flexion muscle strength. Significant increases were noted in both the angle and the strength until 4 days after MFR, [2] but the outcome was only verified by a change in physical function, it was unknown what changes occurred in the fascia, and it was not possible to explain what benefit fascia was actually giving.

Ultrasound is a noninvasive imaging method with easy utility that can be used to observe the locomotor apparatus. For example, Chi-Fishman et al. [3] and Maganaris et al. [4] reported high reliability with a positive correlation between ultrasound and the change in physical function. Fukunaga et al. [5] also observed changes in the pennation angle of the fascia and muscle bundle under voluntary contraction and reported that changes in muscle bundle length and pennation angle on ultrasound could be quantified for use in physiological and biomechanical research. These findings indicate that it is reasonable to use ultrasonography to observe fascial displacement (gliding). Indeed, Otsudo et al. [6] used ultrasound to visualize the fascia of the gastrocnemius during voluntary contraction, and Ichikawa et al. [7] reported that there was significant movement of the fascia of the vastus lateralis during knee flexion under voluntary contraction or passive exercise conditions. The reliability of ultrasonic imaging of the fascia was confirmed by Ichikawa et al. [8] for the vastus lateralis and by Murano et al. [9] for the tibialis anterior, with both showing high reliability without addition or proportional errors.

Elastography is another ultrasound method and can be used to measure muscle stiffness, with strain elastography most widely used because it can be applied simply and in real-time [10]. The intra-rater reliability of muscle stiffness measurement by strain elastography is reportedly very high [11–12]. Therefore, we used strain elastography to examine the intra- and inter-rater reliabilities at baseline and day 4 for measurements of muscle stiffness (0° ankle joint) and displacement of the superficial and deep fascia of the lateral head of the gastrocnemius during passive ankle dorsiflexion. The intraclass correlation coefficients indicated that reliability was almost perfect (0.89–1.00) [13,14]. Therefore, this method has high validity and high reproducibility for measuring fascial displacement and muscle stiffness of the lateral head of the gastrocnemius up to 4 days after MFR.

We wanted to use ultrasound equipment to visualize fascial gliding with high reliability to investigate the changes in fascial properties over 4 days. To clarify whether changes develop in the fascia after MFR, we assessed the effect of MFR on the fascia by observing not only changes in physical function but also the ultrasonographic changes in fascial displacement and muscle stiffness at baseline, immediately after, and at 4 days after MFR.

Methods and Materials

Study Design and Participants

This study included 51 healthy adults (24 males and 27 females) in their 20s and 30s who had no history of orthopedic diseases of legs, cardiovascular diseases, or central nervous system diseases. The average age (range) was 27.6 (22–37) years, the average height (standard deviation) was 162.9 (7.08) cm, and the average body weight (standard deviation) was 56.6 (9.34) kg. The participants were quasi-randomly distributed into an MFR group, a Static Stretching (SS) group, and a control group.

The study was approved by the Research Safety Committee of Tokyo Metropolitan University (approval number 17110), the Research Ethics Committee of Saku University (approval number 217004), and the Clinical Research Ethics Review committee of Asama General Hospital (approval number 17–18). All participants received an explanation of the purpose and content of the study and we obtained written informed consent.

Protocol

For the MFR group, a practitioner placed his or her hands on the proximal and distal portions of the lateral head of the gastrocnemius of the pivoting foot in the prone position and MFR was performed in the longitudinal direction for 180 s (Figure 1). For the SS group, the foot was taken out of the bed in the prone position and placed on a plantarflexion strength measuring aid (Takei Instrumentation Co., Ltd.). The trunk and foot are fixed by using the shoulder pad, pedal, and pelvic belt of this aid with the knee and the ankle joint at 0°. Then, passive dorsiflexion of the ankle joint was performed three times of resting for 60 s by turning the lever at the angle not causing compensation or pain (Figure 2). For the control group, participants were laid prone on the bed for 180 s and subject to no intervention. The participants were asked not to engage in any special exercise during the 4 days of the study, but they were encouraged to continue with daily life as usual.

Measurements

The following items were measured: (1) passive ankle joint dorsiflexion angle (“angle”), (2) isometric ankle joint flexion strength (“strength”), (3) superficial and deep fascial displacement, and (4) muscle stiffness. All items were measured in the prone position with feet taken out of the bed, the knee and the ankle joint at 0°, and the trunk and foot fixed with the shoulder pad, pedal, and pelvic belt of the plantarflexion strength measurement aid. Two or three people performed each measurement so that the participants were not informed of the group to which they were assigned. Each measurement was performed in triplicate before, immediately after, and 4 days after an intervention, and the average at each assessment was used. The measurement procedures are now presented in more detail.

IJOT 19-109 Yasuki Katsumata_F1

Figure 1. Myofascial release of the lateral head of the gastrocnemius.

IJOT 19-109 Yasuki Katsumata_F2

Figure 2. Method of passive dorsiflexion of the ankle joint.
(By turning the lever, the pedal is dorsiflexed and the triceps surae is stretched)

(1) Angle measurement

We used the sensors of a biaxial goniometer for the ankle joint (SG110 / type A manufactured by DKH Co., Ltd.) attached to a feedback recording device (PH-7010 Feedback Logger manufactured by DKH Co., Ltd.) placed on the fifth metatarsal bone and fibula (Figure 3). Passive ankle joint dorsiflexion was performed mechanically from a joint position of 0° using the plantarflexion strength measurement aid, and the maximum dorsiflexion angle within tolerable pain limits was measured.

IJOT 19-109 Yasuki Katsumata_F3

Figure 3. The procedure for measuring the range of motion.
A: The position of the electronic goniometer B: The mechanical passive ankle dorsiflexion

(2) Strength Measurement

This was measured at maximum isometric ankle joint plantarflexion by applying a sensor of a manual muscle strength measuring device (μTas F-1 manufactured by Anima Co., Ltd.) between the first metatarsal head and the pedal of the plantarflexion strength measurement aid (Figure 4). The value obtained was multiplied by the lever arm to obtain the joint torque value, before being divided by body weight.

IJOT 19-109 Yasuki Katsumata_F4

Figure 4. Positioning of the foot and sensor for strength measurement.
(The sensor position (arrow) of the measuring device for manual muscle force during isometric plantarflexion)

(3) Superficial and Deep Fascial Displacement

A linear probe with a coupler attached at the tip (EZU-TEATC 1 manufactured by Hitachi Aloka Medical, Co., Ltd.) was placed on the lateral head of the gastrocnemius of the pivoting foot, parallel to the long axis of the lower thigh. We marked the edge of the coupler attachment with a permanent marker so that the probe could be repeatedly applied to the same site. Passive ankle dorsiflexion was performed from 0° to 15° using the plantarflexion strength measuring aid, and we visually tracked the displacement of the intersection of the gastrocnemius muscle fiber and the superficial and deep fascia on the screen of an ultrasound (Noblus, manufactured by Hitachi Aloka Medical, Ltd.) (Figure 5) and measured it. We took great care to use minimum contact strength to ensure clear ultrasonic images without changes in muscle shape.

IJOT 19-109 Yasuki Katsumata_F5

Figure 5. Representative ultrasound images.
A: Intersection of the gastrocnemius muscle fiber and the superficial fascia. A’: Point A after passive dorsiflexion. B: Intersection of the gastrocnemius muscle fiber and the deep fascia. B’: Point B after passive dorsiflexion.

(4) Muscle Stiffness Measurement

SONA GEL (N0511 manufactured by Takiron Co., Ltd.) at a thickness of 5 mm was sandwiched between the probe and the skin when comparing muscle stiffness. We used the real-time tissue elastography setting and applied pressure several times on the part assessed in the measurement of fascial displacement at a prespecified level to identify the appropriate pressure. The strain ratios for the regions of interest were calculated for the SONA GEL (Figure 6A) and the gastrocnemius (upper, lower, left, and right central parts depicted on the screen) (Figure 6B).

Measurements and recordings were performed by 2–3 persons so that the subjects were not informed about the group to which they were assigned (PROBE method). Each measurement was performed 3 times: before, immediately after, and 4 days after the intervention, and an average value (three significant figures) was adopted.

Statistical Analysis

We used IBM SPSS Version 22 (IBM Corp., Armonk, NY, USA) for the statistical analyses. To compare physical features between the three groups, one-way analysis of variance was performed for the basic attributes (i.e., age, height, and weight of each group) and baseline measurements (i.e., before intervention) after confirming the normality of that data. The differences between groups at each measurement point and the differences between each measurement point in each group were analyzed using the Dunnett and Bonferroni methods after repeated measures analysis of variance with the basic attributes set as covariates. The significance level was set at 5%. Descriptive data are presented as mean (range) or as mean (standard deviation).

IJOT 19-109 Yasuki Katsumata_F6

Figure 6. Representative image of real-time tissue elastography.
A: Region of interest for SONA GEL (reference) B: Region of interest of for the gastrocnemius

Results

Basic Findings

The MFR, SS, and the control groups each included eight men and nine females. There were no differences in physical characteristics among the three groups before the intervention (Table 1). However, we did observe interactions between groups for each measurement item and at each measurement period immediately and 4 days after MFR. Tables 2–5 show the changes in each measurement item over time by study group.

Table 1. Baseline physical characteristics of each group.

IJOT 19-109 Yasuki Katsumata_F7

Data are shown as the mean (standard deviation) before intervention. Range is only reported for the age. Abbreviations: MFR, myofascial release; SS, static stretching. The control group received no intervention and simply lay on a bed for the same duration as used for SS and MFR.

Changes in the angle

There was a significant increase in the angle in the MFR group immediately and 4 days after the intervention compared with before the intervention; by contrast, the SS group showed a significant increase only immediately after the intervention. There were no significant differences in values between the MFR and SS groups immediately after the intervention, but the differences tended to be larger in the MFR group after 4 days (Table 2).

Table 2. Time course of the changes in angle (°) measurements.

IJOT 19-109 Yasuki Katsumata_F8

Mean (Standard deviation). *: P < 0.05; **: P < 0.01; †: 0.05 ≤ P < 0.1;
: represents the result of the Dunnett method. Abbreviations: MFR, myofascial release; SS, static stretching. The control group received no intervention and simply lay on a bed for the same duration as used for SS and MFR.

Changes in Strength

Strength increased significantly in the MFR group immediately and 4 days after the intervention compared with before, but decreased significantly in the SS group immediately after the intervention. The MFR group only showed significantly higher strength than the SS group immediately after intervention (Table 3).

Table 3. Time course of the changes in strength measurements (N∙m/kg).

IJOT 19-109 Yasuki Katsumata_F9

Mean (Standard deviation). *: P < 0.05; **: P < 0.01;
: represents the result of the Dunnett method. Abbreviations: MFR, myofascial release; SS, static stretching. The control group received no intervention and simply lay on a bed for the same duration as used for SS and MFR.

Changes in Fascial Displacement

In both the superficial and the deep layers, fascial displacement in the MFR group increased significantly immediately and 4 days after the intervention compared with before. However, the SS group only showed a significant increase immediately after the intervention. The results were comparable between the MFR and SS groups immediately after the intervention, but after 4 days, the MFR group tended to show greater displacement in the superficial layer and showed significantly greater displacement in the deep layer (Table 4).

Changes in Stiffness

Regarding the stiffness, the MFR group showed a significant decrease immediately and 4 days after the intervention compared with before, whereas the SS group showed a significant decrease only immediately after. The MFR group had significantly less stiffness than the SS group both immediately and 4 days after the intervention (Table 5).

Table 4. Time course of the changes in displacement (mm) measurements.

IJOT 19-109 Yasuki Katsumata_F10

Mean (Standard deviation). *: P < 0.05; **: P < 0.01; †:0.05 ≤ P < 0.1;
: represents the result of the Dunnett method. Abbreviations: MFR, myofascial release; SS, static stretching. The control group received no intervention and simply lay on a bed for the same duration as used for SS and MFR.

Table 5. Time course of the changes in muscle stiffness measurements.

IJOT 19-109 Yasuki Katsumata_F11

Mean (Standard deviation). *: P < 0.05; **: P < 0.01;
: represents the result of the Dunnett method. Abbreviations: MFR, myofascial release; SS, static stretching. The control group received no intervention and simply lay on a bed for the same duration as used for SS and MFR.

Discussion

We predicted that MFR would produce significant differences in physical function (angle and strength) and fascial properties (displacement and muscle stiffness) immediately and 4 days after the intervention compared with that at baseline and that those changes would be larger than those observed when performing SS. Consistent with our previous research, [2] we noted significant improvements in physical function in the MFR group compared with those in physical function in the SS and control groups at both post-intervention assessments. However, the angle tended to be higher after 4 days, with no significant difference in strength, whereas our previous data indicated that both the angle and strength continued to significantly improve until 4 days [2]. The gastrocnemius muscle has medial and lateral heads, which are semi-pennate muscles, and this muscle may account for the different results observed between our studies.

In the previous study, we performed MFR on the posterior aspect of the thigh to catch both the medial and lateral hamstrings. In this study, the gastrocnemius was used as a test muscle due to the ease of visualization of this muscle on ultrasonic imaging during passive exercise. However, the myofascial sequence of the lateral and medial heads of the gastrocnemius was different; [15] therefore, in this study, we performed MFR only on the lateral head of the gastrocnemius. Conversely, both the lateral and medial heads of the gastrocnemius were stretched by passive dorsiflexion of the ankle joint in the SS group. According to Kubo et al., the component of the longitudinal direction of the force exerted by the muscle fascicle determines the magnitude of the rotational moment of the joint in the pennate muscle [16]. The deep fascia of the lateral and medial heads were continuous, but MFR was only performed on the lateral head, which resulted in differences in the sliding of the deep fascia and muscle fibers. Consequently, components in the longitudinal direction may have become disproportionate and the study duration may have been insufficient to show changes in angle or strength after MFR. Temporary muscle weakness immediately after SS has already been explained through tendon spindle excitation, which is characterized by sustained elongation of the triceps surae and the suppression of muscle contraction (Ib inhibition) [17]. This is consistent with our result.

There were clear differences in fascial properties and physical function. The MFR group showed significant changes both immediately and at 4 days after the intervention compared with the SS and control groups. Nakamura et al. suggested that improving muscle flexibility by SS might improve the flexibility of connective tissue around muscle fibers instead of prolonging the length of muscle fibers [18]. Purslow also reported that connective tissue (e.g., the perimysium), was a major factor related to passive stiffness [19]. Thus, MFR might be more effective for improving fascial displacement and muscle stiffness than SS. In addition, Ichikawa et al. reported a significant increase in fascial displacement and a significant decrease in muscle stiffness immediately after MFR, [7] whereas Wong et al. reported a significant decrease in muscle stiffness [20]. Our findings support these and indicate that changes remain significant even at 4 days.

Although there were significant differences in muscle stiffness between the SS and MFR groups immediately after the intervention, there were no differences in either the angle or in fascial displacement. However, by 4 days, the MFR group tended to have a larger angle, significantly greater fascial displacement, and significantly lower muscle stiffness compared with the SS group. The mechanical properties of skeletal muscle can largely be divided into shrinkage, elasticity, viscosity, and plasticity, with muscle viscoelasticity being involved in muscle stiffness when measuring the magnitude of displacement against an external force [7]. Indeed, fascial viscosity is thought to be involved in the matrix [21]. Because the MFR group showed a significantly lower muscle stiffness, even after 4 days, we considered that MFR resolved not only the collagen and elastin fiber densification but also the matrix gelation (i.e., fascial dysfunctions) to improve viscosity. We suggest that those changes improved fascial gliding, increased fascial displacement, and increased the angle.

Concerning SS, Nakamura et al. reported a significant increase in displacement by the muscle tendon junction immediately after SS [18] and a significant decrease in muscle stiffness [22]. Akagi et al. also showed a significant acute decrease in muscle stiffness after three sets of SS for 2 minutes, with long-term effects after 5 weeks of an SS program [23,24]. However, Nordez et al. judged that there was no significant change on muscle stiffness after two sets of 2.5 minutes of SS [25]. It is possible that the SS implementation time may affect the muscle stiffness outcomes.

There are two main limitations of this study. The first relates to “stretch tolerance.” When measuring range of motion in the present study, limitation was determined subjectively based on this stretch tolerance of participants that is, to the point of pain and tolerability of the “stretchy feeling.” This has been cited as a major cause of acute changes in the range of motion assessed by SS [26,27]. However, acute changes in the range of motion and a temporary decrease in muscle strength occurred; thus, we cannot deny the possibility that changes after SS were due to a temporary change in the sense. The second limitation is that ankle joint measurements were taken in the neutral position (0°) to assess strength, fascial displacement, and muscle stiffness. According to Kawakami et al., the passive torque value of the ankle joint at 30° of plantarflexion becomes almost zero [28]. Thus, if 30° of plantarflexion indicates rest, 0° can be said to indicate that the triceps surae is extended. We do not believe that failing to measure at the original rest position of the triceps surae will have affected our results. However, it is possible that the values for strength, fascial displacement, and muscle stiffness are different in the two positions of the triceps surae.

In conclusion, we observed significant changes in fascial properties following manual MFR. These changes were consistent with improved viscoelasticity of the gelled matrix through gentle pressure and elongation, thereby eliminating collagen and elastin fiber densification. In this way, MFR restores fascial gliding during joint movement and muscle contraction. Significant changes in fascial properties remained even at 4 days after MFR, and all fascial changes were larger in the MFR group than in the SS group.

Acknowledgment

We would like to thank Enago (www.enago.jp) for the English language review.

References

  1. Takei H (2014) Myofascial release. In: Nara I, Kurosawa K, Takei H (eds.). Development of systematic treatment technique (3rdedn), Kyodo Isho publisher, Tokyo, Japan, Pg No: 13–58.
  2. Katsumata Y, Takei H, Hori T, Hayashi H (2016) Influences of muscle re-education exercises for myofascial extensibility and muscle strength after myofascial release. Rigakuryoho Kagaku 31: 99–106.
  3. Chi-Fishman G, Hicks JE, Cintas HM, Sonies BC, et al. (2004) Ultrasound imaging distinguishes between normal and weak muscle. Arch Phys Med Rehabil 85: 980–6.
  4. Maganaris CN, Baltzopoulos V, Sargeant AJ (1998) In vivo measurements of the triceps surae complex architecture in man: implications for muscle function. J Physiol 512: 603–614. [crossref]
  5. Fukunaga T, Ito M, Ichinose Y, Kuno S, et al. (1985) Tendinous movement of a human muscle during voluntary contractions determined by real-time ultrasonography. J Appl Physiol 81:1430–1433.
  6. Otsudo T, Takei H, Senoo A (2007) The influence of regulated compression for the gastrocnemius medialis muscle architectural change at rest and during isometric contraction in vivo. J Jpn Acad Health Sci (Japanese).
  7. Ichikawa K, Takei H, Usa H, Mitomo S, Ogawa D (2015) Comparative analysis of ultrasound changes in the vastus lateralis muscle following myofascial release and thermotherapy: a pilot study. J Bodyw Mov Ther 19: 327–336. [crossref]
  8. Ichikawa K, Usa H, Ogawa D, Mitomo S, et al (2013) The reliability of displacement measurement of the deep fascia using ultrasonographic imaging. J Jpn Acad Health Sci (Japanese).
  9. Murano I, Ebihara B, takihara J, Kawakami Y et al. (2016) Dynamics of the extensor retinaculum area of the Ankle measured by ultrasonography: reliability of a method for measuring the distance between the tibia and deep fascia. Rigakuryoho Kagaku.
  10. Shiina T (2014) Recent trends in research and development of ultrasound elastography. Med Imaging Technology. (Japanese).
  11. Junichi H, Mukai N, Takayanagi S, Miyakawa S (2013) The effect of muscle and tendon hardness after acute exercise: analysis on ultrasound Real-time Tissue elastography. J Phys Fit Sports Med. (Japanese)
  12. Muraki T, Ishikawa H, Morise S, Yamamoto N, Sano H, et al. (2015) Ultrasound elastography-based assessment of the elasticity of the supraspinatus muscle and tendon during muscle contraction. J Shoulder Elbow Surg 24: 120–126. [crossref]
  13. Katsumata Y, Takei H, Hayashi H, Ichikawa K (2017) Intra- and inter-rater reliabilities of measurements of fascial displacement and muscle stiffness by using ultrasound images. Rigakuryoho Kagaku. 2017 Apr 20. (Japanese).
  14. Landis JR, Koch GG (1977) The measurement of observer agreement for categorical data. Biometrics. 1977 March.
  15. Stecco L (2011) Myofascial Sequence Fascial Manipulation Theory Ed. Tokyo, Japan: Ishiyaku publisher 2011: 81–140.
  16. Kubo K, Azuma K, Kanehisa H, Kuno S, et al. (2003) Changes in muscle thickness, pennation angle and fascicle length with aging. Jap J Phys Fit Sport. (Japanese).
  17. Ninomiya I, Ando K, Kanosue K, et al. (2004) Physiology. 1st ed. Tokyo, Japan: Bunkodo 2004. (Japanese): 310–316.
  18. Nakamura M, Ikezoe T, Takeno Y, Ichihashi N. (2013) Time course of changes in passive properties of the gastrocnemius muscle-tendon unit during 5 min of static stretching. Man Ther. (Japanese).
  19. Purslow PP (1989) Strain-induced reorientation of an intramuscular connective tissue network: implications for passive muscle elasticity. J Biomech 22: 21–31. [crossref]
  20. Wong KK, Chai HM, Chen YJ, Wang CL, Shau YW, et al. (2017) Mechanical deformation of posterior thoracolumbar fascia after myofascial release in healthy men: A study of dynamic ultrasound imaging. Musculoskelet Sci Pract 27: 124–130.[crossref]
  21. Naka T (2003) A study of hyaluronic acid in skeletal muscle and its relevancy to physical therapy. Rigakuryoho. (Japanese).
  22. Nakamura M, Ikezoe T, Nishishita S, Umehara J, et al. (2017) Acute effects of static stretching on the shear elastic moduli of the medial and lateral gastrocnemius muscles in young and elderly women. Musculoskelet Sci Pract. 32:98–103.
  23. Akagi R, Takahashi H (2013) Acute effect of static stretching on hardness of the gastrocnemius muscle. Med Sci Sports Exerc 45:1348–1354.
  24. Akagi R, Takahashi H (2014) Effect of a 5-week static stretching program on hardness of the gastrocnemius muscle. Scand J Med Sci Sports 24: 950–957. [crossref]
  25. Nordez A, Gennisson JL, Casari P, Catheline S, et al. (2008) Characterization of muscle belly elastic properties during passive stretching using transient elastography. J Biomech 41: 2305–2311.
  26. Weppler CH, Magnusson SP (2010) Increasing muscle extensibility: a matter of increasing length or modifying sensation? Phys Ther 90: 438–449. [crossref]
  27. Magnusson SP, Simonsen EB, Aagaard P, Sørensen H, Kjaer M (1996) A mechanism for altered flexibility in human skeletal muscle. J Physiol 497: 291–298. [crossref]
  28. Kawakami Y, Ichinose Y, Fukunaga T (1985) Architectural and functional features of human triceps surae muscles during contraction. J Appl Physiol 85: 398–404.

Bone and Soft Tissue Tumours of the Foot and Ankle

DOI: 10.31038/IMCI.2019211

Epidemiological Considerations

Overall, tumours of the foot and ankle regions are rare. Whereas only 3 – 6 % of all osseous tumours found in the human body are confined to the pedal area, there are numbers of 5 % of all benign soft tissue tumours and at least 8 % of all malignant soft tissue tumours, resp., which are encountered in the foot and ankle [1].

Regarding pedal bone tumours, there is a strong preponderance of benign entities, reaching roughly 84 %. In contradistinction, only 50 % of all soft tissue pedal masses turn out to be benign [2].

The frequency (excluding ganglion cysts) of occurence of pedal tumours is divided into two peaks: the first peak falls into the first decade of life whereas the the second (smaller) peak lies within the 8th decade [3]. There is no overt difference in sex and race.

Local Distribution of Pedal Tumours

Considering bony tumours of the foot and ankle, the vast majority of these tumours are arising in the hindfoot and ankle, resp. Metatarsal bones as well as phalangeal bones are much less frequently affected. This is quite different in comparison to soft tissue tumours where the forefoot is the foremost afflicted site of such tumours [1].

Signs and Symptoms of Pedal Tumours

One major problem in identifying pedal tumours is confined to the fact that foot pain is a common feature due to daily mechanical stress, which can masquerade tumour-induced pain. Another problem is given by the fact that pedal tumours are often outside of a physician´s scope because of their rarity and are therefore not taken into account.

Although „lumps and bumps“ are readily detected by clinical investigation due to shallow soft tissue layers, covering the foot, diagnosis is nevertheless considerably delayed (2- to 3-fold compared to other body regions) [4]. This delay in establishing a timely diagnosis has usually to do with an underestimating these tumours as they are appearing as small masses. Small, well-demarcated and rounded soft tissue masses are erroneously considered as being simply benign or harmless, resp [5]. As a consequence, this assumption may lead to misdiagnosis and treatment failure. Fortunately, both delayed diagnosis and treatment do not deteriorate prognosis and overall survival because of the very slow pedal tumour growth rate (10 – 20-fold reduced growth rate compared to the rest of the body) and the overall small tumour size [6].

Special Anatomical Situation of the Foot and Ankle

Compartimental anatomy of foot and ankle is quite different compared to other body regions. Whereas the plantar soft tissue of the foot can be divided into distinct compartments, the dorsal aspect of the foot is mainly unseparated and therefore considered extra-compartimental. The same applies to the ankle region which is also considered extra-compartimental due to thin and perforated septae, allowing free tumour spreading. Furthermore, close relationship of some tumours to plantar neurovascular bundles may cause severe functional deficits in the case of foot-sparing resective procedures. Proper knowledge of unique compartmental anatomy is therefore of particular importance for surgical plannings [7].

Tumours smaller than 3 cm should be subject to excision biopsies if safely possible. Tumours larger than 3 cm should be diagnosed by open excision biopsy or by percutaneous core biopsy, using closed coaxial biopsy systems alternatively. No matter which biopsy strategy comes into operation, compartmental anatomy has to be respected otherwise the entire extremity is threatened to be lost due to compartimental contamination.

Imaging Diagnostic Work-Up

Plain Radiography: X-ray examination should be the first imaging modality if a mass lesion of the foot is present because of at least three reasons: 1, to get an overview about the osseous situation of the entire pedal skeleton; 2, to localize and characterize bony lesions if present; 3, to detect calcifications or ossifications within the mass lesion (the so-called tumour matrix).

Ultrasonography: Ultrasound examination plays an important role in the work-up of any palpable mass lesion in the foot. Because ganglion cysts are frequently encountered in the ankle and forefoot areas, ultrasonography is capable to clearly identify pure cystic lesions, thus they can be excluded from further clearing. If there are cyst-like lesions which are not clearly referred to as pure cysts or if there are solid soft tissue masses present, they all should be further evaluated, using MRI.

Computed Tomography: CT comes into play in such cases where bony abnormalities or osseous tumours, resp., should be further evaluated. CT proves to be helpful with the pedal skeleton because of its complex anatomy to image all bony components without superposition. Furthermore, CT is most sensitive if (even subtle) calcifications are looked for. Evidence of soft tissue calcificatons or ossifications, resp., turns out to be of paramount importance for differential diagnostic considerations (e.g., crystal depositions, phleboliths, ossifying myositis, chondrogenic calcifications, calcifications in synovial cell sarcoma).

Magnetic Resonance Imaging: MRI is the most powerful diagnostic modality within the diagnostic approach to pedal tumours. Superior soft tissue contrast helps to delineate and to differentiate both soft tissue masses and bone tumours, particularely for staging purposes (Enneking staging system, AJCC staging system). Contrast-enhanced techniques are able to distinguish viable and cystic or necrotic areas within the masses which is in particular helpful as a guidance for biopsy or resection plannings, resp.

Other Imaging Modalities: such as nuclear medicine techniques (bone scintigraphy, positron-emission-tomography) and digital subtraction angiography are all of minor importance in the routine diagnostic work-up of pedal tumours.

Tumours and Tumour-Like Lesions of the Foot and Ankle

In general, commonly encountered bone and soft tissue tumours of the human body can all be found in the foot and ankle, too. However, there are some special issues with such pedal tumours.

The majority of pedal osseous tumours are benign, comprising osteomas, osteochondromas, osteoid osteomas, as well as osteoblastomas, chondroblastomas, and enchondromas. Furthermore, there are also lytic bony lesions, including cysts (e.g., intraosseous ganglia, geodes, ABC), and giant cell tumours. There is a peculiar trabecular-poor area within the calcaneal body (stress-shielded region) which often develops intraosseous lipomas (vicarious lipoma). Those lipomas in turn may render liquid or they become calcified due to fat cell necrosis [8].

Malignant bone tumours of the foot are – as said earlier – very rare and constitutes of osteo- and chondrosarcomas as well as Ewing sarcomas. Although they are rare, they carry the same potential of both local recurrence and metastastic spreading as similar tumours somewhere else in the human body [9].

Considering soft tissue tumours, the pedal situation is somewhat different: cysts, ganglia, and bursae are frequently encountered because of the excusively joint- and tendon-rich anatomcial conditions alongside the entire foot and ankle. Leaving them out, there are a lot of benign solid tumours which are found in the foot: plantar fibromatosis, tenosynovial giant cell tumour, lipoma, neurogenic tumours, as well as hemangiomas and vascular malformations. In the forefoot, there is an unique tumour-mimicking entity, the so-called Morton´s neuroma. Being actually a misnomer, Morton´s neuroma is not a true neoplasia but rather a perineural reactive fibrosis. In contradistinction, to pedal bony tumours, there is a significant number of malignant soft tissue tumours, comprising synovial cell sarcoma, clear cell sarcoma, and epitheloid sarcoma [10]. While rarely encountered elsewhere in the human body, these malignant tumours are relatively typical for pedal soft tissue malignancies. Moreover, some of these soft tissue sarcomas are able to metastasize, using lymphatic pathways.

Although soft tissue sarcomas of the foot are – in general – less aggressive when compared to other body regions, the risk of local tumour recurrence is high because of the unique compartimental situation at the foot and ankle. For this reason, expectative procedural approach in the case of potentially malignant pedal tumours is highly questionable and amputations remain a mainstay in the curative therapy of these tumours [11].

References

  1. Chou LB, Ho YY, Malaver MM (2015) Tumours of the foot and ankle: experience with 153 cases. Foot Ankle Int 30: 836–841.
  2. Ruggieri P, Angelini A, Jorge FD, Maraldi FD, Gianinni S (2014) Review of foot tumors seen in a university tumor institute. J Foot Ankle Surg 53: 282–285.
  3. Yang P, Evans S, Bali N, Ramsamy A, Evans R (2017) Malignant bone tumours of the foot. Ann R Coll Surg Engl 99: 566–572.
  4. Brotzmann M, Hefti F, Baumhoer D, Krieg AH (2013) Do malignant bone tumors of the foot have a different biological behavior than sarcomas at other skeletal sites? Sarcoma 2013:767960.
  5. Toepfer A (2017) Tumors of the foot and ankle – a review of the principles of diagnostics and treatment. Fuß Sprunggelenk 15: 82–96.
  6. Walter JH, Goss LR (2017) How to detect soft tissue tumors. Podiatry Today 16: 82–96.
  7. Erickson SJ, Rosengarten JL (1993) MR imaging of the forefoot: normal anatomic findings. AJR Am J Roentgenol 160: 565–571.
  8. Malghem J, Lecouvet F, Vande Berg BC (2017) Calcaneal cysts and lipomas: a common pathogenesis? Skeletal Radiol 46: 1635–1642.
  9. Mascard E, Gaspar N, Brugières L, Glorion C, Pannier S, et al (2017) Malignant tumours of the foot and ankle. EFFORT Open Rev  2: 261–271.
  10. Woertler K (2005) Soft tissue masses in the foot and ankle: characteristics on MR imaging. Semin Musculoskelet Radiol 9: 227–242.
  11. Marqués B, Terrier P, Voigt JJ, Mihura J, Coindre JM (2000) Clear cell soft tissue sarcoma. Clinical, histopathological and prognostic study of 36 cases. Ann Pathol 20: 298–303.

Reimbursement Challenges in Europe for Innovative Therapies

DOI: 10.31038/JPPR.2019221


The thinking about the role of health care systems has been evolving over the last ten years such that there is more recognition of the importance of healthy populations on overall wealth and security [1].  At the European level and in WHO studies have shown that the positive return on investment in health systems is between 50% and 250% [2].  At the same time with the exploding advances in understanding how the body works, innovative therapies are proliferating at an ever so rapid pace [3].  What these innovations have in common that was not the case in the past is that they are more focused.  Their patient populations are smaller. They are more efficient.  That is to say those innovations a generation ago were targeting large populations (Block Buster drugs) with diseases for which we had a significant understanding at that time.  Today as scientific understanding is digging deeper into the chemistry of the body, the challenges for health care systems have focused on the rising costs and limited budgets.

The responsibility at the European level is to make sure that new therapies are safe.  Unlike in the US where the FDA is responsible for safety, they are also in some cases, responsible for reimbursement.  In Europe, there is a clear distinction between these roles.  Reimbursement is a Member State responsibility.  To talk about reimbursement challenges immediately devolves into 27 different health care systems.  So what commonalities can be used to address the way Reimbursement Authorities are taking on these challenges without becoming too bogged down into individual health care systems?  This article will assess the strategies for pricing, early access, budget controls and cost-effectiveness.

Pricing

While there is a range of approaches to pricing from initially allowing free pricing as in Germany, governmental negotiation on pricing as in France, prices pegged to categories of medications as in Spain to prices determined by cost-effective algorithms as in the UK.  The challenges facing Reimbursement Authorities are to identify a ‘fair’ price, given the pharmaceutical industry’s investment in creating innovative therapies.  Any meaningful discussion of the impact on pricing of access to medications or the overall health of the population is complicated by the fact that within each Member State, pricing policies are specific to where the treatment is provided (inpatient, outpatient, etc.) and often by region.  Nevertheless, there is no evidence that one strategy leads to better health than another strategy.  While prices do vary by country, going back to the initial premise that access to innovative treatment has a positive effect on society; it is not yet clear to what extent the price level contributes or takes away from overall societal wellbeing.  That is, when does the price get so high that the benefit is not justified?

Early Access

Early access programs are available throughout Europe but the intent and foci vary greatly.  The rationale for these programs is to assure that patients receive treatments that are specifically life-saving during the Regulatory (EMA level) and Reimbursement (Member State level) processes that can take from months to years.  The criteria and payment for these programs range from fully funded small populations with exceptional circumstances such as in Italy to broader patient groups in France and only partially funded or not funded as in the UK [4].  Some programs become available as soon as the new drug is being reviewed at the European level whereas others wait until approval is given but the Member State has yet to finish its deliberative process.  Some of the key considerations of manufacturers are how the program may effect pricing and what additional safety studies may be required.  There is general acceptance that these programs do provide a needed bridge that allows access to innovation that would not have been possible without their existence.

Budget Controls

Given the conflicting forces of improved health benefits and rising costs, the mechanism Member States are focusing on are ways to manage their budgets.  One of the limitations with this effort is that budgets are divided into categories that are self-contained.  That is, the health care budget is reviewed and those in charge are responsible irrespective of other budgets.  Hence, positive results from expenditures in health are not monetised and applied to non-health budgets.  Worse yet, within the health system, the various budgets are also independent.  A classic example is when an innovative medication results in patients avoiding hospitalisations.  The drug budget goes up and the hospital budget goes down in reality but is not captured in a meaningful way.

Strategies to account for cross-budget effects are beginning to emerge.  One important improvement has been in the move in all Member States to capitated hospital budgets.  There are various names for this but they are adaptations of the Diagnostic Related Grouping that was adopted in the US for Medicare hospital payments in the 1980s.  At least in hospitals, the medication costs are not independently budgeted.  If an innovation results in a shorter length of hospital stay, the hospital is able to benefit in the short run.

Non-hospital budget control strategies have been focused on pharmacy constraints such as requiring generic substitution.  Depending on the details of the policy, this could impact the willingness of manufacturers of innovative medications to offer access.

As yet, no budgetary control system has been able to integrate the budget impact of improved health from innovative therapies on the wealth and economic success of the country.

Cost-effectiveness

Another strategy for improved reimbursement decisions has been the advent of economic algorithms that try to capture the costs and benefit at the same time to arrive at a single ratio to be used in decision making.  There is strong conceptual support for this in economic theory. This was introduced over 20 years ago in the UK and has been adapted in several other Member States.  The concept is to compare the costs to a common health outcome.  Since health outcomes are not common, the most widely used created outcome is the Adjusted Life Years Saved.  This ratio simplifies comparisons across disparate therapies.  Without going into the mechanics of this approach, this approach presents the following issues for innovative therapies.

First is the pragmatic access to all costs over the lifetime of the public (patients, families, workplaces, etc.) affected by the therapy.  While direct therapeutic costs are often in claims processing databases, other costs are not.  Next is the significant shortfall in measuring the elements of the outcomes.  Without going into the extensive literature on these current shortfalls, there has been an emerging area of research in Real World Data to address some of these concerns.  This field is in its infancy but the future may lead to improved measurement of health outcomes.  Finally and potentially more importantly is the question of:  ‘What is a sufficient ratio to allow reimbursement of the innovation?’  Here, economic theory cannot help.  There is no yardstick to determine acceptability.  The UK has set ratios between 20k£ and 30k£ but there is no scientific support for this.  Worse yet, the ratios generated for innovative therapies for small populations fall far outside of this yardstick leading countries using economic algorithms as decision making guidelines to rethink their usefulness.

Conclusion

Hopefully innovative therapies will continue to proliferate and the health and economic security of the public will benefit from them.  At the same time, reimbursement policies need to evolve the take into consideration the new reality of the marvellous new world we are living in.

References

  1. McKee L, Suhrcke M, Nolte E, Lessof S, Figueras J, et al (2009) Health systems, health, and wealth : a European perspective. The Lancet 373 : 349–351.
  2. Suhrcke M, Rocco L, McKee M (2007) Health : a vital investment for economic development in eastern Europe and central Asia. Copenhagen : WHO Regional Office for Europe on behalf of the European Observatory on Health systems and Policies, 2007.
  3. Godman B, Bucsics A, Vella Bonanno P, Oortwijn W, Rothe C, et al (2018) Barriers for access to new medicines : Searching for the balance between rising costs and limited budgets. Fronties in Public Health 328.
  4. Urbinati D, Masetti L, Toumi M (2012) Early Access Programmes (EAPs) : Review of European system, ISPOR 15th Annual European Congress, Berlin, Germany.

The Positive Effect of Skd Plus Iot and Hbo2t In The Treatment Of Cancer [Introducing Sorush Cancer Treatment Protocol (Sctp)]

DOI: 10.31038/CST.2019414

Abstract

Background: The aim of this research is to figure out the effectiveness of the Sorush Cancer Treatment Protocol (SCTP) which is based on the Evolutionary Metabolic Hypothesis of Cancer (EMHC) and introducing the Specific Ketogenic Diet (SKD) plus Intravenous Ozone Therapy (IOT) in Phase (1) on 54 cancer patients, and combination of Hyperbaric Oxygen Therapy with vitamin/mineral and herbal supplementation beside the SKD and IOT in Phase (2) of this research on the remaining 31 cancer patients.

Introduction: Cancer based on the introduction of EMHC by Dr. Somayeh Zaminpira and Dr. Sorush Niknamian in 2017, is an evolutionary metabolic disease and through the incline of the Reactive Oxygen Species (ROS) and the Butterfly Effect in normal eukaryotic cells, the mitochondria become damaged or shut down. Cancer cells are primitive eukaryotic cells which have existed since around 1.5 billion years ago before the entrance of mitochondrion as endosymbiont.

Materials and Methods: Based on the researches from 1928–2016 and the experimentation of cancer treatments and protocols on cancer patients, we have reached a treatment and decided to test it on 54 voluntary cancer patients in the first stage of their disease. In this treatment we used a 5-day water fasting state, the Specific Ketogenic Diet (SKD) designed by ourselves and Intravenous Ozone Therapy (IOT) in the duration of 90 days (Phase 1) and another 90 days (Phase 2) with the entrance of Hyperbaric Oxygen Therapy (HBO2T) and several supplements which  have been effective in previous studies on cancer patients. We have used the measurement of saliva PH, the MRI device and statistical methods to test the shrinkage of the tumors.

Results: After Phase (1) of this research on 54 patients the average percentage decrease in the tumors was 58% and after Phase (2) on 31 remaining cancer patients the average percentage decrease in the tumors was 98.8%. The average saliva PH in the fasting state of the cancer patients improved from acidic to alkaline as well.

Conclusion:in conclusion, we have reached an effective cancer treatment based on SCTP by the usage of SKD, IOT, HBO2T and several supplements. There was an obvious improvement of cancer tumor decrease, lifestyle, saliva PH and we did not observe any side effects or cachexia in any of the patients.

Keywords

EMHC Hypothesis, SKD, IOT, ROS, HBO2T, SCTP

Introduction

Evolutionary Metabolic Hypothesis of Cancer (EMHC)

The first living cells on Earth are thought to have arisen more than 3.5 × 10⁹ years ago, when the Earth was not more than about 109 years old. The environment lacked oxygen but was presumably rich in geochemically produced organic molecules, and some of the earliest metabolic pathways for producing ATP may have resembled present-day forms of fermentation. In the process of fermentation, ATP is made by a phosphorylation event that harnesses the energy released when a hydrogen-rich organic molecule, such as glucose, is partly oxidized. The electrons lost from the oxidized organic molecules are transferred via NADH or NADPH to a different organic molecule or to a different part of the same molecule, which thereby becomes more reduced. At the end of the fermentation process, one or more of the organic molecules produced are excreted into the medium as metabolic waste products. Others, such as pyruvate, are retained by the cell for biosynthesis. The excreted end-products are different in different organisms, but they tend to be organic acids. Among the most important of such products in bacterial cells are lactic acid which also accumulates in anaerobic mammalian glycolysis, and formic, acetic, propionic, butyric, and succinic acids [1]. The first cell on the earth before the entrance of the bacteria did contain  a nucleus and used the fermentation process to produce ATP for its energy. Then an aerobic proteo-bacterium enters the eukaryote either as a prey or a parasite and manages to avoid digestion. It then became an endosymbiont. As we observe, the fermentation process used the glucose or even glutamine to produce ATP, but the aerobic process used the glucose, fat and protein to produce more ATP than the previous one. The symbio-genesis of the mitochondria is based on the natural selection of Charles Darwin. Based on Otto Warburg Hypothesis, in nearly all cancer cells, the mitochondrion is shut down or is defective and the cancer cell does not use its mitochondria to produce ATP [2]. This process of adaptation is based on Lamarckian Hypothesis of Evolution and the normal cells goes back to the most primitive time of evolution to protect itself from apoptosis and uses the fermentation process like the first living cells 1.5 billion years ago.  Therefore, cancer is an evolutionary metabolic disease which uses glucose as the main food to produce ATP and Lactic Acid. The prime cause of cancer is the abundance of Reactive Oxygen Species produced by mitochondria that is a threat to the living normal cell and causes mitochondrial damage mainly in its cristae [3].

Specific Ketogenic Diet (SKD)

Ketogenic diet is a kind of regime which uses high fat content and low carbohydrate. This diet changes the metabolic state into the condition called Ketosis. After several days, fat becomes your body’s primary energy source which causes an increase in the levels of compounds which are called “ketones” in the blood [4]. In general, a ketogenic diet used for weight loss is about 60–75% of calories as fat, with 15–30% of calories from protein and 5–10% of calories from carbs. However, when a ketogenic diet is being used therapeutically for the treatment of cancer, the fat content may be significantly higher that is up to 90% of calories, and the protein content lower [5]. The SKD contains 80% saturated fat, 15% protein with the lowest Glutamine content and 5% high-fiber carbohydrates mainly in the form of cruciferous vegetables.

Materials and Methods

Based on the researches from 1928–2016 and the experimentation of cancer treatments and protocols on cancer patients, we have reached a treatment and decided to test it on 54 voluntaries cancer patients. In this treatment we used a 5-day water fasting state to put the cancer patients body on cannibalism state. In this period of the experiment, normal body cells digest abnormal cancerous cells for food. Thomas N. Seyfried et al, 2012 After the water fasting period, we began the Specific Ketogenic Diet (SKD) designed by ourselves and Intravenous Ozone Therapy (IOT) in the duration of 90 days (Phase 1) and another 90 days (Phase 2) with the entrance of Hyperbaric Oxygen Therapy (HBO2T) and several supplements which have been effective in previous studies on cancer patients. We have also used the measurement of the saliva pH in the fasting state, the MRI device and statistical methods to test the decrease in size of the tumors. The dosage of the intravenous ozone therapy (IOT) which we used was: 42ug/cc on the first month, 56 ug/cc on the second month and 70ug/cc on the third month in the Phase (1) and 70ug/cc once per week and HBO2T twice per week in the Phase (2) of our research. This type of IOT was due to a decrease in the allergic reaction by the patients. Entering the vitamin/mineral, herbal supplements and probiotic foods benefited cancer patients in their mood and decreased the possibilities of depression and anxiety.

PHASE (1)

In Phase (1) of our research, there were two sessions of IOT on Saturdays and Tuesdays. There was no supplementation in this Phase of our experiment. The SKD is a type of Ketogenic Diet which consists of 80% saturated fat (Organic Cow Butter, Organic Cow Tallow and Coconut oil), 15% protein with lowest Glutamine content (Fish meat, shrimp, organic calf meat, organic whole eggs, organic chicken and low glutamine protein powder.) and 5% complex-high fiber carbohydrate (whole vegetables, cruciferous vegetables, lettuce, white mushrooms and dark green fruits). The consumption of any dairy, artificial sweeteners as well as stevia, vegetable oils, margarines, pig’s meat, soy products, sugar, alcohol, gluten and fruit juices were prohibited in this research. The Total calorie intake of this Diet should be 1200–1500 Cal/Day. The patients used fermented foods (Kimchee, Miso or Natto) every day for their benefits as probiotics to improve their digestion and absorbing important vitamins/minerals. For the improvement of the patients’ body pH and absorbing some important minerals, they have been given vegetable juice twice per day (500 ml/day). The intravenous ozone therapy (IOT) which we used was: 42ug/cc on the first month, 56 ug/cc on the second month and 70ug/cc on the third month. This type of IOT was done to decrease the allergic reaction by the patients. There was not any record of allergic reactions or side effects after the Phase (1) of the study.

The measurements and statistical data are as below:

Table (1) shows the number of patients, gender and the range of their age. As we can see, the highest number cancer types belong to the breast cancer and the lowest belongs to the kidney, colorectal, and lung cancer.

Table 1

Number

Cancer Types

Number of Patients

Male

Female

Range of Age

1

Brain Cancer

11

7

4

35–75

2

Breast Cancer

18

0

18

25–75

3

Colorectal Cancer

5

1

4

42–67

4

Kidney Cancer

5

3

2

25–60

5

Liver Cancer

10

8

2

35–64

6

Lung Cancer

5

4

1

40–70

As we can observe in the Table (2), the saliva pH of the cancer patients has improved by the SKD and IOT.

Table 2

Cancer Types

Saliva pH Range Before Treatment

Saliva pH Range After Phase (1) of the Treatment

Brain Cancer

6.5–6.9

7.0–7.6

Breast Cancer

6.8–7.1

7.0–7.3

Colorectal Cancer

6.0–6.2

7.0–7.2

Kidney Cancer

6.3–6.5

7.0–7.4

Liver Cancer

6.7–6.9

7.1–7.5

Lung Cancer

6.3–6.7

7.1–7.3

Table (3) and Figure (1) shows that the tumor size average of the cancer patients is decreased by 58% after 90 days of the controlled trial.

Table 3

Cancer Types

Tumor Size Before Treatment in Millimeter

Tumor Size Average in Millimeter

Tumor Size Average After Phase (1)
In Millimeter

Brain Cancer

5.00–29.00

17.00

2.21

Breast Cancer

5.00–30.00

16.50

4.12

Colorectal Cancer

5.00–7.00

6.00

4.50

Kidney Cancer

7.00–9.00

8.00

3.68

Liver Cancer

10.00–26.00

18.00

11.16

Lung Cancer

7.00–22.00

14.50

8.00

CST Article_ Sorush Niknamian_F1

Figure 1. Blue line shows the average size of the tumors before the experiment begins and the orange line shows the tumor size of the patients after 90 days.

PHASE (2)

After Phase (1) of this research which took 90 days, 23 of the patients  left the experiment due to passing away because of old age, car accident or not having enough hope for the future treatment. Some of them wanted to live with their families or saying goodbye to them and some of them did not do exactly the diet so we decided not to continue the treatment on them.  We continued the treatment on the remaining 31 patients for the next 90 days. After Phase (1) of our study, we did not observe any cachexia in the patients.

The Phase (2) of the research is the same as the Phase (1) in the Diet and Intravenous Ozone Therapy (IOT). We decided to enter Hyperbaric Oxygen Therapy (HBO2T) and special supplementation including vitamins/minerals and some herbal supplementation in our treamtent. There was one session of IOT on Saturdays with 70 ug/cc, and two sessions HBO2T which took 60 minutes in Mondays and Wednsedays. We did not have any HBO2T chamber so we decided to give the patients the pure oxygen inhalation by the oxygen container for 60 minutes every session.

(Table 4, 5, 6) (Figure 2)

Table 4

Number

Cancer Types

Number of Patients

Male

Female

Range of Age

1

Brain Cancer

7

5

2

35–75

2

Breast Cancer

14

0

14

25–75

3

Colorectal Cancer

1

0

1

45

4

Kidney Cancer

2

1

1

50–62

5

Liver Cancer

5

4

1

35–64

6

Lung Cancer

2

2

0

40–47

Table 5

Cancer Types

Saliva pH Range After Phase (1)

Saliva pH Range After Phase (2)

Brain Cancer

7.0–7.6

7.2–7.5

Breast Cancer

7.0–7.3

7.1–7.3

Colorectal Cancer

7.0–7.2

7.1–7.2

Kidney Cancer

7.0–7.4

7.1–7.5

Liver Cancer

7.1–7.5

7.2–7.4

Lung Cancer

7.1–7.3

7.2–7.3

Table 6

Cancer Types

Tumor Size Average in Millimeter

Tumor Size Average After Phase (1) in Millimeter

Tumor Size Average After Phase (2) in Millimeter

Brain Cancer

17.00

2.21

0.00

Breast Cancer

16.50

4.12

0.00

Colorectal Cancer

6.00

4.50

0.21

Kidney Cancer

8.00

3.68

0.00

Liver Cancer

18.00

11.16

0.00

Lung Cancer

14.50

8.00

0.14

CST Article_ Sorush Niknamian_F2

Figure 2. The blue line shows the tumor size before the experiment begins. The orange line shows the tumor size after Phase (1) of the treatment. The white line shows the shrinkage and improvement of the cancer patients tumors after 180 days.

As we can see in Table (5), the saliva pH of the patients is improved from acidic into the alkaline.

Table (6) and Figure (2) show the improvement of the tumor sizes from the beginning of the research, after Phase (1) and after Phase (2). After 180 days of this experiment, we have copmpeletly shrunk the tumor in 4 types of cancer patients and the remaining two have had the tumor size profoundly reduced.

Although we tried to find the natural vitamin/mineral supplement, the only one was “Immunace” by “vitabiotics company”, which had the near dosage we wanted to give to the patients. They were given one tablet of this supplement every night with dinner. They were given 3000 mg of Ascorbic acid (500 mg every two hours), one cup of cottage cheese with 5 gr of flaxseed oil every night for dinner (Table 7).

Table 7. Specific doses for supplements given to the patients.

Daily advantage herbal

Daily dose suggested in SCTP

Chlorella Vulgaris

8000 mg (Early in the morning in the fasting state with water)

Turmeric

500 mg (Three times per day with meal)

L-Taurine

400 mg

Bee Pollen

5000 mg  mixed with the low glutamine protein powder

Acetyl-L-Carnitine

2000 mg/day

Green tea extract

500 mg 30 minutes before lunch

Panax Gingeng

100 mg with breakfast

Alpha Lipoic Acid (ALA)

300 mg/Day

Results

This research was a controlled study on 54 cancer patients of several kind of cancers. We have put the study in two phases. Each phase took 90 days with different number of patients. In the Phase (1) there were 54 patients with 6 types of cancer: Brain cancer, Breast cancer, Colorectal Cancer, Kidney Cancer, Liver cancer and Lung cancer. We measured their saliva pH before the therapy in the fasting state which were totally acidic. We began the 5-day water fasting, SKD (with 1200–1500 Cal/Day) and IOT on the patients with no supplementation added. After 90 days we observed the tumor shrinkage obviously in all the patients as we can see in Table 3, and improvement in saliva pH from acidic into alkalinity in 90% of the patients.

In the Phase (2) of the study, the number of patients was reduced to 31 and we introduced supplemental vitamin/minerals, HBO2T and Herbal Supplements. The IOT reduced from two sessions to one session per week and HBO2T to two sessions per week to saturate the cancer cells with more oxygen and increasing the amounts of ROS in cancer cells. After Phase (2) which took another 90 days, the saliva PH of all patients became alkaline and several tumors disappeared completely: Brain cancer, Breast cancer, Kidney cancer and Liver.

In two types of cancer the tumor did not disappear completely but the tumors shrinkage improved obviously to less than 0.3 mm which was a marvelous result: Colorectal cancer and Lung cancer. The total survival of the patients was 99.7% and the improvement in the saliva pH was 100% in this research which shows the effectiveness of this methodology of cancer treatment.

Discussion

The effective diet introduced in this research is the Specific Ketogenic Diet (SKD) programmed by Dr. Somayeh Zaminpira and Dr. Sorush Niknamian. Normal cells use the sophisticated process of respiration to efficiently turn any kind of nutrient that is fat, carbohydrate or protein into high amounts of energy in the form of ATP. This process requires oxygen and breaks food down completely into harmless carbon dioxide and water. Cancer cells use a primitive process of fermentation to inefficiently turn either glucose from carbohydrates or the amino acid glutamine from protein into small quantities of energy in the form of ATP. This process does not require oxygen, and only partially breaks down food molecules into lactic acid and ammonia, which are toxic waste products. The most important result is that fatty acids or more generally, fats cannot be fermented by cells [6]. (Figure 3) shows the basic nutrition contents in the SKD.

CST Article_ Sorush Niknamian_F3

Figure 3. The Specific Ketogenic Diet (SKD).

The reason behind this kind of diet for cancer patients is to starve cancer cells and make them weak. Most patients cannot use cancer ketogenic diets due to gastrointestinal discomfort or high amount of fat which is 90%. SKD uses 80% fat in the form of saturated animal and coconut oil which are less likely to cause adverse side effects such as diarrhea.  Food restriction reduces the incidence of both inherited and acquired cancers in laboratory animals [7]. Most cancer cells grow best when they have access to a combination of glucose and the amino acid glutamine. But, there are some types of cancer cells which do just fine without any glucose as a food source, because they are especially good at burning glutamine. This is why both glucose from dietary carbohydrates and glutamine from dietary protein, need to be restricted in order to best target cancer cells. Therefore, a low-calorie ketogenic diet consisting of 90% fat, with the rest 10% being made up of protein plus carbohydrate maybe the best way to starve cancer cells. This diet forces normal cells to burn fat for energy. It contains enough protein for normal cells to function properly. Excess protein means excess amino acids and glutamine. The ketogenic diet does not have to contain any carbohydrate, However, it is not harmful if  it contains significant amounts of carbohydrate, as long as calories are kept low. Blood glucose levels respond more to calorie intake than to carbohydrate intake [8]. This is the reason for the lowest glutamine intake in the SKD (Figure 4).

CST Article_ Sorush Niknamian_F4

Figure 4. Explanation of different Ketogenic Diets [9].

Ozone has been found to be an extremely safe medical therapy, free from side effects. In a 1980 study done by the German medical society for ozone therapy, 644 therapists were polled regarding their 384,775 patients, comprising a total of 5,979,238 ozone treatments administered. There were only 40 cases of side effects noted out of this number which represents the incredibly low rate of 0.000007% and only 4 fatalities. Ozone has thus proven to be the safest medical therapy ever devised [10]. Ozone therapy causes an increase in the red blood cell glycolysis rate. This leads to the stimulation of 2,3-diphosphoglycerate which leads to an increase in the amount of oxygen released to the tissues. Ozone activates the Krebs cycle by enhancing oxidative carboxylation of pyruvate, stimulating production of ATP. It also causes a significant reduction in NADH and helps to oxidize cytochrome C. There is a stimulation of production of enzymes which act as free radical scavengers and cell-wall protectors: glutathione peroxidase, catalase and superoxide dismutase. Production of prostacyline, a vasodilator, is also induced by O3 [11].

Ozone administered at a concentration of between 30 and 55 μg/cc causes the greatest increase in the production of interferon and the greatest output of tumor necrosis factor and interleukin-2. The production of interleukin-2 launches an entire cascade of subsequent immunological reactions. [11] Ozone exposure induces a significant mean decrement in vital capacity. It significantly increases mean airway resistance and specific airway resistance but does not change dynamic or static pulmonary compliance or viscous or elastic work. It also significantly reduces maximal transpulmonary pressure. And further more significantly increases respiratory rate and decreases tidal volume [12–20].

There were no side effects like allergic reactions and gastrointestinal discomfort of this methodology of treatment recorded in this research and it was safe. HBO2T in combination with IOT and SKD reduced the acidity and pain in the patients as well.

We name this methodology used in this treatment the Sorush Cancer Treatment Protocol (SCTP). This protocol includes: 5-day water fasting, SKD, IOT, HBO2T, natural Vitamin/Mineral Supplements, Herbal Supplements, 3000–5000 mg ascorbic acid, probiotic foods and cottage cheese mixed with flaxseed oil. The total calorie intake by the patients should be 1200–1500 Cal/Day. The dietary restrictions in this protocol are: Dairy, Industrial Vegetable oils, Margarines, Alcohol, Gluten, Soy Products (Miso and Natto are exceptional), Artificial Sweeteners as well as Stevia, Fruit juices and any types of sugar including Honey.  The duration of the SCTP should not exceed 6 months to reduce the possibilities of ketoacidosis occurrence in patients.

Acknowledgement

This research is sponsored by the Violet Cancer Institute (VCI) and Weston A. Price Foundation (WAPF).

Conclusion

Using the Specific Ketogenic Diet (SKD) in combination with the Intravenous Ozone Therapy (IOT) resulted in the shrinkage in 6 cancer tumor types (Brain Cancer, Breast Cancer, Colorectal Cancer, Kidney Cancer, Liver Cancer and Lung Cancer) in vivo and improved the fasted saliva pH of the patients from acidic into alkaline after 90 days. By introducing the supplements including Vitamin/Mineral, Herbal supplements shown in (Table 7), Ascorbic Acid mega dosage (3000 mg/day) and Hyperbaric Oxygen Therapy (HBO2T) into our research, all the patients went into complete remission except colorectal and lung cancer in 180 days. The tumors of the remaining cancer patients decreased to less than 0.3 mm in size which shows the effectiveness of this cancer treatment protocol. There were no records of side effects including gastrointestinal discomfort and cachexia in this experiment. The pain related to the type of tumors in patients improved, the saliva pH of all patients became alkaline and the lifestyle of all patients improved after 180 day of the treatment. that the diet needs to be organic and that foods of the highest quality should be chosen. We suggest not using the SKD for more than 6 months to reduce the possibility of ketoacidosis in patients (Figure 5).

CST Article_ Sorush Niknamian_F5

Figure 5. SCTP procedure in brief.

List of Abbreviations:

EMHC: Evolutionary Metabolic Hypothesis of Cancer

SKD: Specific Ketogenic Diet

IOT: Intravenous Ozone Therapy

ROS: Reactive Oxygen Species

HBO2T: Hyperbaric Oxygen Therapy

SCTP: Sorush Cancer Treatment Protocol

References

  1. The Evolution of Electron-Transport Chains, Molecular Biology of the Cell. 4th edition. 2002, Bruce Alberts, Alexander Johnson, Julian Lewis, Martin Raff, Keith Roberts, and Peter Walter; Copyright © 1983, 1989, 1994, Bruce Alberts, Dennis Bray, Julian Lewis, Martin Raff, Keith Roberts, and James D. Watson. Bookshelf ID: NBK26849.
  2. Keeling PJ, Archibald JM (2008) Organelle evolution: what’s in a name? Curr Biol 18: 345–347. [crossref]
  3. WARBURG O (1956) On the origin of cancer cells. Science 123: 309–314. [crossref]
  4. Volek JS, Fernandez ML, Feinman RD, Phinney SD (2008) Dietary carbohydrate restriction induces a unique metabolic state positively affecting atherogenic dyslipidemia, fatty acid partitioning, and metabolic syndrome. Prog Lipid Res 47: 307–318. [crossref]
  5. Allen BG, Bhatia SK, Anderson CM, EichenbergerGilmore JM, Sibenaller ZA, et al. (2014) Ketogenic diets as an adjuvant cancer therapy: History and potential mechanism. Redox Biol 2: 963–970.
  6. Soroush Niknamian (2016) The Prime Cause, Prevention and Treatment of Cancer, International Science and Investigation Journal, ISSN: 2251–8576, 5(5), Journal homepage: www.isijournal.info.
  7. Valter D Longo, Luigi Fontana (2010) Calorie restriction and cancer prevention: metabolic and molecular mechanisms, Trends Pharmacol Sci. Author manuscript; available in PMC 2011 Feb 1. Published in final edited form as: Trends Pharmacol Sci 31: 89–98.
  8. Chevrollier A, Loiseau D, Gautier F, Malthièry Y, Stepien G (2005) ANT2 expression under hypoxic conditions produces opposite cell-cycle behavior in 143B and HepG2 cancer cells. Mol Carcinog 42: 1–8. [crossref]
  9. Allen BG, Bhatia SK, Anderson CM, EichenbergerGilmore JM, Sibenaller ZA, et al. (2014) Ketogenic diets as an adjuvant cancer therapy: History and potential mechanism. Redox Biol 2: 963–970.
  10. Somayeh Zaminpira, Sorush Niknamian, LAP LAMBERT PUBLICATION GROUP, 2017, [ISBN: 978-620-2-05082-1]
  11. Washutti J, Viebahn R, Steiner I (1990) The influence of ozone on tumor tissue in comparison with healthy tissue. Ozone Sci Engg12: 65–72.
  12. Washutti J, Viebahn R, Steiner I (1989) Immunological examinations in patients with chronic conditions under administration of ozone/oxygen mixtures. Ozone Sci Engg 11: 411–417.
  13. Zänker KS, Kroczek R (1990) In vitro synergistic activity of 5-fluorouracil with low-dose ozone against a chemoresistant tumor cell line and fresh human tumor cells. Int J Exp Clin Chemother 36: 147–154.
  14. Bocci V, Paulesu L (1990) Studies on the biological effects of ozone 1. Induction of interferon gamma on human leucocytes. Haematologica 75: 510–515. [crossref]
  15. Viebahn-Hansler R (1991) Ozone therapy-the underlying therapeutical concept and models of efficacy. Erfahrungs Heilkunde 4: 40.
  16. Kawalski H1, Sondej J, CierpioÅ‚-Tracz E (1992) The use of ozonotherapy in the nose correction operations. Acta Chir Plast 34: 182–184. [crossref]
  17. Johnson AS, Ferrara JJ, Steinberg SM (1993) Irrigation of the abdominal cavity in the treatment of experimentally induced microbial peritonitis: efficacy of ozonated saline. Am Surg J 59: 297–303.
  18. Gérard V, Sunnen MD (2003) SARS and ozone therapy: Theoretical considerations.
  19. Why consider ozone therapy/oxygen Spa as alternative treatment dallas Fort Worth? [cited in 2010].
  20. Viebahn-Hänsler R (2003)The use of ozone in medicine: Mechanisms of action. Munich. 2003. May 23–25.

Blood Pressure in Healthy Youngsters is modified by Vitamin-D Supplementation

DOI: 10.31038/EDMJ.2019325

Abstract

Objective

Our study aimed to investigate the effect of vitamin D supplementation on blood pressure in vitamin D insufficient young volunteers compared to an age matched control group with sufficient levels of vitamin D. Secondarily we aimed to evaluate the effect of vitamin D supplementation on the RAAS and sympathetic nervous system.

Design

Single centre, Randomised controlled Trial.

Methods

Fifteen vitamin D insufficient and 15 vitamin D sufficient youngsters (18–25 years) were recruited for a clinically controlled trial of 6 months vitamin D supplementation (30 µg/day). At baseline, 30 days, 90 days and 180 days, 24h systolic and diastolic blood pressure, and 25-hydroxyvitamin D, angiotensinogen, renin, angiotensin (I+II), aldosterone, and catecholamines were measured.

Results

The difference between baseline visit and 180 days visit for the vitamin D insufficiency group compared to the control group was; systolic BP (daytime) decreased -6.6 (Interquartile Range 2.4) mmHg (p = 0.009), diastolic BP (daytime) decreased -4.5 (2.1) mmHg (p = 0.03), norepinephrine decreased -0.80 (0.21) nmol/L, (p = 0.0002). There was no effect of vitamin D supplementation on night time systolic or diastolic BP, and no effect on angiotensinogen, renin, angiotensin (I+II), aldosterone or epinephrine.

Conclusion

We observed that 180 days of vitamin D supplementation in normal youngsters with insufficient vitamin D significantly lowered systolic and diastolic BP during daytime. Vitamin D supplementation also significantly lowered circulating norepinephrine. Nothing happened in the control group with normal vitamin D. Hence, it is tempting to conclude that vitamin D acts on BP through SNS as no changes were observed in the RAAS.

Keywords

Vitamin D, Blood pressure, Catecholamines, Normal Youngsters, RAAS.

Introduction

Vitamin D and its importance for skeletal development is well known. The research field of Vitamin D has been broadend even to gene regulation on a grand scale [1]. Recently, Vitamin D deficiency has been found associated with hypertension and several other diseases in epidemiological studies [2, 3] and is a risk factor for cardiovascular mortality [4] and cardiovascular incidents [5, 6] Vitamin D deficiency is prevalent in all ages [7], races [8], geographical regions [9], socioeconomic strata and seasons [10]. Hypertension and vitamin D deficiency are both prevalent worldwide [9, 11, 12] and a causative link between these may potentially have wide public health implications. Hypertension and heart disease are an enormous burden for society. The total direct and indirect costs in 2010 were estimated to $ 273 billion and $ 172 billion respectively in the US [13]. Vitamin D supplementation could potentially be a novel pathway to ease the burden of hypertension, given the low cost and mild adverse effects [14, 15]. Intervention studies with vitamin D supplementation for treatment of hypertension have yielded inconsistent results [16–34]. This inconsistency could be attributed to factors with influence on S-25[OH]D or attenuate the outcome blood pressure e.g. seasonal variation [20, 30], non-cardiovascular comorbidity [16–18, 20–24, 26, 27, 30–32, 34] , medication [16–18, 21–28, 30–32, 34] and normal physiological (S-25[OH]D >50 nmol/L) vitamin D levels [16–18, 21, 24, 26–28, 30, 32, 34] before treatment.

Regulation of Blood Pressure (BP) acts mainly through the Renin-Angiotensin-Aldosterone System (RAAS) and the Sympathetic Nervous System (SNS) [35]. Vitamin D supplementation is associated with the cardiac autonomic tone in healthy humans [36], and could indicate a modulating role of vitamin D in the SNS.

Vitamin D is a secosteroid hormone although it can be obtained through food intake [37]. The main source of vitamin D is represented by its synthesis in the body itself [38]. Vitamin D in its active form, 1, 25-dihydroxyvitamin D3 [1, 25(OH)2D3], crosses the cell membrane, enters the target cell and binds to a specific nuclear vitamin D receptor. The receptor is found in the kidneys, and in mice a decrease in vitamin D is found to increase renin [39]. Vitamin D supplementation could potentially lower renin, which is the first step in the RAAS-pathway and might have a cascading effect on the RAAS-pathway resulting in lowering angiotensin and aldosterone with a lower systemic BP as a result. In rats, vitamin D depletion leads to increases in norepinephrine [40] and increases in systolic BP [41].

To take into account the factors that could blunt or attenuate the effect of vitamin D on BP regulation an investigative setting; with healthy young adults and a group with constant vitamin D concentration acting as control group would be preferable to deal with the seasonal variation. In such a setting, it would be possible to get a more clear view of the effects of vitamin D on BP regulation. To our knowledge, this has not yet been done.

Our clinical trial aimed to investigate the effect of vitamin D supplementation on the BP in two groups; one with vitamin D insufficiency and one with normal levels of vitamin D. The secondary aim was to investigate the effects of vitamin D supplementation on RAAS and the autonomous nervous system, hopefully elucidating possible underlying mechanisms.

Methods

Study Design and Participants

The study was carried out from October 2012 to August 2014 as a single center, parallel-group, clinical controlled trial conducted at the Department of Clinical Physiology, Nuclear Medicine & PET, Rigshospitalet, Copenhagen, Denmark.

Subjects were recruited from a screening of 99 young adults aged 18–25 years. We found 27 potential controls with sufficient vitamin D levels (S-25[OH]D > 80 nmol/L) and 33 with insufficient vitamin D levels (S-25[OH]D <50 nmol/L) and all were invited to participate by e-mail. Participants were excluded if they suffered from diseases or took medication known to interfere with vitamin D as well as pregnancy, hypertension, heart- or kidney disease, diabetes, epilepsy, bone diseases, use of anabolic or systemic steroids

After 15 controls and 15 vitamin D insufficient volunteers accepted the invitation further enrollment was stopped. After enrolment serum 25[OH]D was remeasured to assure that each participant was within inclusion limits of each group on the first day of the study. Each subject’s respective vitamin D level was a result of their lifestyle and genes as all participants were vitamin D so-called naive as only subjects who did not take supplementation was included in the study.

Ethics

We performed the study in accordance to the Helsinki II declaration considering biomedical research. Informed, written consent was obtained from all participants prior to enrollment. The Ethical Committee of the Capital Region, Denmark (ref. no. H-1–2012–023) approved the project.

Intervention

The vitamin D insufficiency group was supplemented to increase the concentration of S-25[OH]D and the control group were supplemented to be kept at S-25[OH]D normal steady state concentration > 80 nmol/L. All participants were supplemented by 30 µg cholecalciferol and 1.200 mg of calcium per day. The participants were instructed to bring all supplied containers and remaining tablets to next visit for compliance estimation.

Study Program

The program comprised four visits, at baseline, after one month, three months, and six months. All visits took place between 08.00 and 17.00; participants had fasted for two hours prior to all visits.

Participants rested 30 min supine position before blood sampling for the assessment of S-25[OH]D, angiotensinogen, renin activity, angiotensin I, angiotensin II, aldosterone, epinephrine, and norepinephrine. Office BP in sitting position was measured and 24-hour ambulatory BP (24hr-AMBP) recording was performed. Vitamin D supplementation needed until next visit was handed to the participants in containers of 180 tablets to be taken three every day (vitamin D3 10 µg and calcium 400 mg per tablet). The second, third, and fourth visit was carried out as the first visit, with the addition of compliance estimation by count of remaining tablets.

Outcome measures

The primary outcome measure was the between-group differences in day and night values from the 24hr-AMBP recording systolic and diastolic BP. The secondary outcome was the between-group comparisons of angiotensinogen, renin activity, angiotensin I, angiotensin II, aldosterone, epinephrine, and norepinephrine.

Measurements

Lifestyle

Through a questionnaire, the participants habit of exercise, smoking and alcohol consumption status was obtained. Smoking: “How many cigarettes have you smoked in the last seven days?” grouped into smoking yes/no. Alcohol: “How many units (12 g) of alcohol have you beendrinking in the last seven days?” grouped into alcohol yes/no. Exercise habits: “How many hours have you spent on exercise in the last seven days?” grouped into three groups; “0–2”, “2–7”, and “7 or more”.

Medical history was obtained through a personal interview to ensure that the subjects were clinically healthy and did not fulfil any of the exclusion criteria. Height was measured using a vertical mounted cm ruler. Weight was measured using an electronic weight (OBH Nordic 6295). Calculation of compliance as the difference in prescribed intake and actual intake divided by prescribed intake of vitamin D supplementation.

Blood pressure measurement

Twentyfour hour ambulatory blood pressure data was recorded with the SpaceLabs 90207 oscillometric unit (Spacelabs, Redmond CA). The default daytime interval was set from 07.00 to 23.00 hr and night time interval was set from 23.00 to 07.00 hr. If participants reported other sleep habits, default values were not used, instead the actual day and night time were used. In the day time BP was measured for every 20 min and every 30 min at night time to fullfil the European guidelines for AMBP measuring at least 14-day time and seven-night time measurements.

Biochemical Analyses

Sympathetic nervous system activity

Sympathetic nervous system activity (SNS) was assessed by measurement of plasma epinephrine and norepinephrine after 30 min. at rest in supine position. Blood samples were obtained in pre-chilled EDTA-tubes and centrifuged at 5 °C for 10 min. at 3, 000 rpm and afterwards stored at -80 until analyzed. Plasma norepinephrine and epinephrine was analysed with a commercial RIA-kit (2-Cat RIA from Labor Diagnostika Nord, Nordhon Germany). Catecholamine was calculated as the sum of epinephrine and norepinephrine.

Renin-angiotensin-aldosterone system

Renin-angiotensin-aldosterone system activity was assessed after 30 min of rest in supine position applying both in-house and commercial available biochemical methods. Blood samples for angiotensinogen were obtained in lithium heparin tubes and measured with the antibody trapping method. Blood sample for renin was obtained in pre-chilled EDTA tubes and measured with RIA based on renin activity. Blood samples 10 mL each for angiotensin I+II was obtained in tubes prepared with inhibitor and measured with an in-house RIA-based method. Blood samples for aldosterone were obtained in tubes with a serum clot activator and analysed with Siemens RIA Coat-a-count.

Serum-25-Hydroxyvitamin D

Serum-25[OH]D was analyzed with the chemiluminescent immunoassay (Liaison® 25-OH Vitamin D Total Assay; Diasorin Inc., Saluggia (Vercelli), Italy).

Statistical Analyses

Sample size calculation for the primary outcome was based on the least relevant effect size of 6 mmHg with an SD = 5 mmHg, α = 0.05, and β = 0.80, we calculated a sample size of 15 subjects for each group to be enrolled.

The continuous data was reported as means and Standard Deviations (SD) when data followed a normal distribution or medians and Interquartile Range (IQR) when they did not. Visual inspection of the continuous data was used to determinate the distribution. For categorical data, percentages were used.

Skewed variables were log (e) transformed before use in parametric statistical analysis.

Group analysis at baseline was performed with student’s t-test or χ2-test. The main analysis of the outcome was by originally assigned groups. We attempted to follow-up on subjects who withdraw by phone, texting, and e-mail. Missing data was assumed missing at random.

A mixed model was applied to take advantage of repeated measurements and deal with missing data. Comparison of simple effects was performed at each visit without separating data in one analysis, to test for the effect of supplementation on visits. For all statistics, (SAS® Version 9.3, Cary, NC, USA) was used. We considered a p-value of <0.05 statistical significant.

Results

Two participants with vitamin D insufficiency and one vitamin D sufficient were excluded on the basis of S-25[OH]D, as they were no longer within the inclusion criteria. Two men and one woman in the control group and two men and one woman in the insufficient group did not complete all four visits, Table 1.

Table 1. Baseline characteristics of participants

Variable

Sufficiency (N = 14)

Insufficiency (N = 13)

P-Value

Age (years) (Mean ± SD)

20.5 ± 2.4

21.7 ± 2.0

0.13¹

S-25[OH]D (nmol/L)(Median (Range)

96.3 (65.3–164.0)

33.3 (10.0–65.8)

Weight (kg) (Mean ± SD)

70.1 ± 11.1

78.4 ± 15.4

0.23¹

Height (cm) (Mean ± SD)

176.4 ± 9.7

174.2 ± 6.0

0.56¹

Office BP systolic (mmHg) (Mean ± SD)

120.6 ± 8.6

126.6 ± 10.8

0.12¹

Office BP diastolic (mmHg) (Mean ± SD)

69.1 ± 5.1

79.0 ± 14.7

0.039¹

Sex

Women

10 (62.5%)

6 (37.5%)

0.18²

Men

4 (36.4%)

7 (63.6%)

Tobacco

No

13 (56.5%)

10 (43.5%)

0.24²

Yes

1 (25.0%)

3 (75.0%)

Alcohol consumption

No

8 (57.1%)

6 (42.9%)

0.57²

Yes

6 (46.2%)

7 (53.8%)

Physical Activity (hours/week)

0–2

1 (11.1%)

8 (88.9%)

0.011²

2–7

5 (71.4%)

2 (28.6%)

7 or more

8 (72.7%)

3 (27.3%)

¹ Mann-Whitney test, ² Chi-square test

Baseline characteristics of the youngsters with sufficient levels of S-25[OH]-vitamin D (controls) and with insufficient levels of S-25[OH]-vitamin D

The first baseline visit was performed in October 2012 and the last follow-up visit was performed in August 2014.The analysis comprised in total 11 males aged 20.4 ± 1.7 yrs and 16 females aged 21.0 ± 2.2 yrs. The baseline characteristics of the participants are given in Table 1. At baseline, no significant differences were found regarding age, height, weight, systolic BP, sex, tobacco, and alcohol consumption between the two groups. At baseline, the group with insufficient vitamin D had higher diastolic BP compared to controls.

The period of supplementation (median [Interquartile Range (IQR)]) for vitamin D was 184 [180–200] days for the insufficiency group and 183 [179–200] days for the control group.

The effect of vitamin D supplementation on S-25[OH]D is shown in Figure 1A. Serum-25[OH]D in the insufficiency group increased from 32.0 (IQR 16.5) nmol/L at visit one to 64.5 (IQR 8.6) nmol/L at visit four. In the control group the change was from 99.9 (IQR 24.1) nmol/L at first visit to 96.1 (IQR 27.1) nmol/L at visit four. The estimated treatment effect of vitamin D supplementation on S-25[OH]D (95% Cl) was an impressive mean increase of 38.1 (Range 25.1 to 51.1) nmol/L for the insufficiency group compared to the controls (p<0.0001).

EDMJ 2019-110 - Lars Thorbjørn Jensen Denmark_F1

Figure 1. Treatment effect of Vitamin D supplementation compared to baseline values

Overall treatment effect over four visits of vitamin D supplementation (ergocholecalcipherol 30 µg/day) in healthy young adults. All BPs are 24hr-AMBP. (A) Treatment effect on S-25[OH]-vitamin D (nmol/L) is significant at visit two (p = 0.0001), three (p<.0001) and four (p<.0001); (B) Treatment effect on catecholamines (nmol/L) is significant at visit four (p = 0.0009); (C) Treatment effect on systolic-BP (mmHg) in daytime (0700–2300 hour) is significant at visit four (p = 0.009); (D) Treatment effect on diastolic-BP (mmHg) in daytime (0700–2300 hour) is significant at visit four (p = 0.03).

The effect of vitamin D supplementation on systolic-BP (24 hr-AMBP, daytime) is shown in Figure 1C.
Systolic BP (24 hr-AMBP, daytime) in the insufficiency group decreased from 124.5 (IQR 12.3) mmHg at visit one to 120.4 (IQR 9.5) mmHg at visit four. In the control group systolic-BP (24 hr-AMBP, daytime) remained unchanged from 115.8 (IQR 8.2) mmHg at first visit to 115.6 (IQR 7.3) mmHg at visit four. The estimated treatment effect of vitamin D supplementation on systolic-BP (24 hr-AMBP, daytime) was a significant decrease of -6.6 (IQR 2.4) mmHg, (p = 0.009) for the insufficiency group compared to the control group.

The effect of vitamin D supplementation on diastolic-BP (24 hr-AMBP, daytime) is shown in Figure 1D. Diastolic-BP (24hr-AMBP, daytime) in the insufficiency group decreased from 73.1 (IQR 10.9) mmHg at visit one to 71.1 (IQR 9.3) mmHg at visit four. In the control group diastolic-BP (24 hr-AMBP, daytime) remained unchanged from 68.1 (IQR 5.4) mmHg at first visit to 69.3 (IQR 4.5) mmHg at visit four. The estimated treatment effect of vitamin D supplementation on diastolic-BP (24hr-AMBP, daytime) was a significant decrease of -4.5 (IQR 2.1) mmHg, (p = 0.03) for the insufficiency group compared to the control group.

The effect of vitamin D supplementation on systolic-BP (24 hr-AMBP, nighttime) is given in Table 2. Systolic-BP (24 hr-AMBP, night time) in the insufficiency group decreased from 106.8 (IQR 11.2) mmHg at visit one to 103.2 (IQR 12.7) mmHg at visit four. Within the control group systolic-BP (24 hr-AMBP, night time) decreased from 105.3 (IQR 7.1) mmHg at first visit to 102.8 (IQR 6.7) mmHg at visit four. The estimated treatment effect of vitamin D supplementation on systolic-BP (24 hr-AMBP, nighttime) was an insignificant increase of in average 0.7 (IQR 3.4) mmHg, (p = 0.8) for the insufficiency group compared to the controls.

Table 2. Effect of vitamin D supplementation on blood pressure and S-25[OH]-vitamin D

Visit no.

1. (Baseline)

2. (30 days)

3. (90 days)

4. (180 days)

S-25[OH]D (nmol/L)

Control

99.9 (24.1)

97.8 (27.6)

94.4 (33.2)

96.1 (27.1)

Insufficient

32.0 (16.5)

54.1 (15.0)

63.2 (16.6)

64.5 (8.6)

Treatment effect

.

+23.6 (5.9)

+37.8 (6.1)

+38.1 (6.5)

Systolic BP, daytime (mmHg)

Control

115.8 (8.2)

115.5 (10.1)

114.2 (9.7)

115.6 (7.3)

Insufficient

124.5 (12.3)

122.2 (9.3)

120.3 (9.3)

120.4 (9.5)

Treatment effect

.

-1.2 (2.3)

-2.9 (2.3)

-6.6 (2.4)

Diastolic-BP daytime (mmHg)

Control

68.1 (5.4)

68.2 (6.7)

69.3 (4.4)

69.3 (4.5)

Insufficient

73.1 (10.9)

70.5 (8.0)

69.2 (9.5)

71.1 (9.3)

Treatment effect

.

-2.8 (1.9)

-3.9 (2.0)

-4.5 (2.1)

Systolic-BP nighttime (mmHg)

Control

105.3 (7.1)

105.5 (10.2)

102.0 (8.4)

102.8 (6.7)

Insufficient

106.8 (11.2)

107.8 (11.4)

103.1 (10.6)

103.2 (12.7)

Treatment effect

.

+3.3 (3.1)

+2.7 (3.3)

-0.7 (3.4)

Diastolic-BP nighttime (mmHg)

Control

56.8 (6.2)

57.3 (4.5)

56.2 (4.8)

57.5 (3.9)

Insufficient

55.3 (7.1)

56.8 (10.8)

51.1 (11.0)

54.7 (10.8)

Treatment effect

.

+2.9 (2.5)

-1.3 (2.7)

-1.3 (2.8)

Controls have normal S-25[OH]-vitamin D at baseline whereas all vitamin D insufficient participants had S-25[OH]-vitamin D below 50 nmol/L at baseline. All BP are 24hr-AMBP. Estimated treatment effect (individual change from baseline compared to groups). Statistically significant (p<0.05) treatment effects are marked with bold. Data presented as median (Interquatile Range)

The effect of vitamin D supplementation on diastolic-BP (24 hr-AMBP, nighttime) is presented in Table 2. Diastolic-BP (24 hr-AMBP, night time) in the insufficiency group remained unchanged from 55.3 (IQR 7.1) mmHg at visit one to 54.7 (IQR 10.8) mmHg at visit four. In the control group diastolic-BP (24 hr-AMBP, night time) remained unchanged from 56.8 (IQR 6.2) mmHg at the first visit to 57.5 (IQR 3.9) mmHg at visit four. The estimated treatment effect of vitamin D supplementation on diastolic-BP (24hr-AMBP, night time) shows a decreasing trend of -1.3 (IQR 2.8) mmHg, (p = 0.6) for the insufficiency group compared to the controls.

For the secondary outcome, we observed an effect of vitamin D supplementation from visit one to visit four on catecholamines. The effect of vitamin D supplementation on catecholamine is shown in Figure 1B. Catecholamines in the insufficiency group decreased from 1.79 (IQR 0.49) nmol/L at visit one to 1.26 (IQR 0.37) nmol/L at visit four, estimated treatment effect in the group was a significant decrease of -0.47 (IQR 0.20) nmol/L, (p = 0.02). Catecholamines in the control group showed a trend of increased from 1.04 (IQR 0.26) nmol/L at visit one to 1.40 (IQR 0.51) nmol/L at visit four, estimated change in the group was 0.33 (IQR 0.21) nmol/L, (p = 0.11). The estimated effect of vitamin D supplementation on catecholamines was a significant decrease of -0.77 (IQR 0.22) nmol/L for the insufficiency group compared to the controls (p = 0.0009).

Norepinephrine in the insufficiency group decreased from 1.61 (IQR 0.48) nmol/L at visit one to 1.19 (IQR 0.37) nmol/L at visit four, estimated effect in the group was a significant decrease in norepinephrine of -0.46 (IQR 0.19) nmol/L, (p = 0.02). Norepiniphrine in the control group increased from 0.94 (IQR 0.25) nmol/L at first visit to 1.40 (IQR 0.51) nmol/L at visit four, estimated effect was an insignificant decrease of 0.36 (IQR 0.19) nmol/L, (p = 0.06). The estimated effect of vitamin D supplementation on norepinephrine was a significant decrease of -0.80 (IQR 0.21) nmol/L, for the insufficiency group compared to the controls (p = 0.0002).

Vitamin D supplementation showed no effect within groups nor overall for angiotensinogen, renin activity, angiotensin I, angiotensin II, aldosterone or epinephrine. No adverse events were recorded through the study.

Discussion

This randomised, controlled trial with vitamin D supplementation in normotensive youngsters over a period of 6 months included 15 controls with sufficient levels of vitamin D and 15 cases with insufficient levels of vitamin D. We observed a significant decrease of both systolic and diastolic blood pressure in the group with insufficient vitamin D levels. Vitamin D supplementation also lowered catecholamines, more specifically a significant decrease in norepinephrine. Conversely, we did not detect any change of the parameters in the RAAS. This points to vitamin D affecting BP through the SNS and not RAAS, contrasting other randomized controlled trials which found lower levels of renin and aldosterone [23, 42, 43].

Most studies investigating vitamin D supplementation on BP show a lack of effect. Looking at meta-analyses with pooled data from 64 randomized controlled trials show that only 8 report of beneficial effects with most studies having been conducted on normotensive participants and a duration of under a year [29, 44–51]. Two large scale trials with vitamin D supplements and a follow-up times of 3 and 7 years show no change in blood pressure [52, 53]. These limitations also apply to our study which investigate normotensive participants over 6 months. Lasting effects beyond the 6 months are unknown, but it is worth noting that during daytime the treatment effect between the control and case groups increased at all visits, indicating that an even greater effect could potentially be seen at further time points.

Vitamin D insufficiency in itself did not activate the RAAS system in our population as the baseline values for the RAAS did not differ between the groups. Rejnmark et al [54] demonstrated in postmenopausal women, that only the concentrations of S-25[OH]D below 80 nmol/L increased 1, –25(OH)2D3 and that Parathyroid Hormone (PTH) are better related to 1, –25(OH)2D3 than 25[OH]D. A similar effect could well be in play here too, as the 25[OH]D concentration in our subjects was not low enough to alter 1, –25(OH)2D3 and stimulate the RAAS-system. The lack of changes in the RAAS system under vitamin D supplementation is a strong argument for the RAAS system not to be modulated by S-25[OH]D in healthy young adults. However, the unchanged RAAS system does not exclude an impact of vitamin D insufficiency on the RAAS activation in already hypertensive and elderly patients.

As expected vitamin D supplementation increased the concentration of S-25[OH]D in the insufficient group whereas the control group remained at a steady state level as intended. This study design handled the seasonal variation well as none from the control group decreased significantly.

Besides the short observation period the study has few limitations. The two groups investigated differed only in physical activity at baseline; the control group had a higher mean physical activity, compared to the insufficient group. This might affect BP and explain the initial difference in total plasma catecholamines. The change over time in total catecholamines is only attributable to changes in S-25[OH]D as this was the only parameter that differed between the two groups between visits. Catecholamines in plasma are a useful measure of the activity of the SNS, despite known limitations. It acts as a systemic index, thus providing no pattern of regional activity of the SNS, i.e. in the heart or in the BP modifying arteries. Another factor to consider, is whether calcium supplementation plays a role in itself. Meta analyses have shown a small effect on BP, especially in patients with insufficient dietary intake [55]. Both groups received calcium supplements, but we cannot rule out the possibility that the patients with insuffient vitamin D could have a greater benefit than the controls.

In conclusion, increase in S-25[OH]D by supplementation might have a clinical relevant effect on lowering the blood pressure in healthy young adults, and might be associated with a modulation of the activity of the SNS but not RAAS. The increase of S-25[OH]D by vitamin D supplementation decreases catecholamines at rest. Further investigations of S-25[OH]D modulation of the SNS is needed to elucidate the importance of S-25[OH]D on BP regulation.

Table 3. Effect of vitamin D supplementation on the Renin-Angiotensin-Aldosterone-System

Visit no.

1. (Baseline)

2. (30 days)

3. (90 days)

4. (180 days)

S-25[OH]D (nmol/L)

Control

99.9 (24.1)

97.8 (27.6)

94.4 (33.2)

96.1 (27.1)

Insufficient

32.0 (16.5)

54.1 (15.0)

63.2 (16.6)

64.5 (8.6)

Treatment effect

.

+23.6 (5.9)

+37.8 (6.1)

+38.1 (6.5)

Angiotensinogen (nmol/L)

Control

1986 (1361)

1953 (1286)

2552 (1829.0)

2471 (1436)

Insufficient

1561 (1044)

1498 (727)

1807 (1466)

2116 (1713)

Treatment effect

.

+137 (290)

+403 (296)

+223 (330)

Renin (mIU/L)

Control

15.5 (11.4)

42.4 (69.0)

20.6 (26.3)

17.0 (12.9)

Insufficient

33.7 (31.2)

34.7 (33.1)

34.6 (19.5)

24.7 (20.0)

Treatment effect

.

+24.1 (12.0)

+3.1 (12.3)

+13.6 (13.9)

Angiotensin I (pmol/L)

Control

40.5 (24.9)

36.0 (35.1)

50.6 (49.3)

30.2 (14.7)

Insufficient

45.8 (34.1)

36.2 (22.5)

68.8 (50.2)

44.4 (29.5)

Treatment effect

.

+1.9 (14.2)

-14.9 (14.2)

-6.5 (15.3)

Angiotensin II (pmol/L)

Control

14.2 (12.9)

12.6 (9.7)

17.1 (13.0)

14.0 (10.1)

Insufficient

17.9 (15.9)

17.1 (12.0)

21.7 (12.6)

17.3 (14.6)

Treatment effect

.

+0.2 (5.8)

-2.5 (5.9)

+0.9 (6.4)

Aldosterone (pmol/L)

Control

244 (152)

211 (145)

448 (466)

318 (234)

Insufficient

197 (82)

302 (189)

291 (169)

224 (138)

Treatment effect

.

-136.7 (99.6)

+105.7 (101.9)

+36.9 (109.5)

Norepinephrine (nmol/L)

Control

0.94 (0.25)

0.79 (0.39)

0.95 (0.32)

1.33 (0.50)

Insufficient

1.61 (0.48)

1.31 (0.61)

1.34 (0.61)

1.19 (0.37)

Treatment effect

.

+0.15 (0.18)

+0.29 (0.19)

+0.80 (0.21)

Epinephrine (nmol/L)

Control

0.08 (0.04)

0.08 (0.07)

0.08 (0.06)

0.07 (0.07)

Insufficient

0.08 (0.03)

0.10 (0.08)

0.08 (0.04)

0.08 (0.04)

Treatment effect

.

-0.01 (0.02)

-0.01 (0.02)

-0.01 (0.02)

Estimated treatment effect (individual change from baseline compared to groups). Statistically significant (p<0.05) treatment effects are marked with bold. Data presented as median (Interquartile Range)

References

  1. Ramagopalan SV, Heger A, Berlanga AJ, Maugeri NJ, Lincoln MR, et al. (2010) A ChIP-seq defined genome-wide map of vitamin D receptor binding: associations with disease and evolution. Genome research 20: 1352–1360.
  2. Hossein-nezhad A, Holick MF (2013) Vitamin D for health: a global perspective. Mayo Clin Proc 88: 720–755. [crossref]
  3. Autier P, Boniol M, Pizot C, Mullie P (2014) Vitamin D status and ill health: a systematic review. Lancet Diabetes Endocrinol 2: 76–89. [crossref]
  4. Bjelakovic G, Gluud LL, Nikolova D, Whitfield K, Wetterslev J, et al. (2011) Vitamin D supplementation for prevention of mortality in adults. Cochrane Database Syst Rev 6: CD007470.
  5. Wang L, Song Y, Manson JE, Pilz S, Marz W, et al. (2012) Circulating 25-hydroxy-vitamin D and risk of cardiovascular disease: a meta-analysis of prospective studies. CircCardiovascQualOutcomes. 5: 819–829.
  6. Leu M, Giovannucci E (2011) Vitamin D: epidemiology of cardiovascular risks and events. Best Pract Res Clin Endocrinol Metab 25: 633–646. [crossref]
  7. McKenna MJ (1992) Differences in vitamin D status between countries in young adults and the elderly. Am J Med 93: 69–77. [crossref]
  8. Powe CE, Evans MK, Wenger J, Zonderman AB, Berg AH, et al. (2013) Vitamin D-binding protein and vitamin D status of black Americans and white Americans. N Engl J Med 369: 1991–2000. [crossref]
  9. Holick MF, Chen TC (2008) Vitamin D deficiency: a worldwide problem with health consequences. Am J Clin Nutr 87: 1080S-1086S. [crossref]
  10. Webb AR, Kline L, Holick MF (1988) Influence of season and latitude on the cutaneous synthesis of vitamin D3: exposure to winter sunlight in Boston and Edmonton will not promote vitamin D3 synthesis in human skin. J Clin Endocrinol Metab 67: 373–378.
  11. Rahimi K, Emdin CA, MacMahon S (2015) The epidemiology of blood pressure and its worldwide management. Circ Res 116: 925–936. [crossref]
  12. Kearney PM, Whelton M, Reynolds K, Muntner P, Whelton PK, et al. (2005) Global burden of hypertension: analysis of worldwide data. Lancet 365: 217–223. [crossref]
  13. Heidenreich PA, Trogdon JG, Khavjou OA, Butler J, Dracup K, et al. (2011) Forecasting the future of cardiovascular disease in the United States: a policy statement from the American Heart Association. Circulation123: 933–944. [crossref]
  14. Jones G (2008) Pharmacokinetics of vitamin D toxicity. Am J Clin Nutr 88: 582S-586S. [crossref]
  15. Hathcock JN, Shao A, Vieth R, Heaney R (2007) Risk assessment for vitamin D. Am J Clin Nutr 85: 6–18. [crossref]
  16. Gepner AD, Ramamurthy R, Krueger DC, Korcarz CE, Binkley N, et al. (2012) A prospective randomized controlled trial of the effects of vitamin D supplementation on cardiovascular disease risk. PLoSOne 7: 36617.
  17. Witham MD, Price RJ, Struthers AD, Donnan PT, Messow CM, et al. (2013) Cholecalciferol treatment to reduce blood pressure in older patients with isolated systolic hypertension: the VitDISH randomized controlled trial. JAMA Intern Med 173: 1672–1679. [crossref]
  18. Larsen T, Mose FH, Bech JN, Hansen AB, Pedersen EB (2012) Effect of cholecalciferol supplementation during winter months in patients with hypertension: a randomized, placebo-controlled trial. Am J Hypertens 25: 1215–1222.
  19. Jehle S, Lardi A, Felix B, Hulter HN, Stettler C, et al. (2014) Effect of large doses of parenteral vitamin D on glycaemic control and calcium/phosphate metabolism in patients with stable type 2 diabetes mellitus: a randomised, placebo-controlled, prospective pilot study. Swiss Med Wkly 144: 13942. [crossref]
  20. Witham MD, Adams F, Kabir G, Kennedy G, Belch JJ, et al. (2013) Effect of short-term vitamin D supplementation on markers of vascular health in South Asian women living in the UK–a randomised controlled trial. Atherosclerosis 230: 293–299. [crossref]
  21. Forman JP1, Scott JB, Ng K, Drake BF, Suarez EG, et al. (2013) Effect of vitamin D supplementation on blood pressure in blacks. Hypertension 61: 779–785. [crossref]
  22. Kampmann U, Mosekilde L, Juhl C, Moller N, Christensen B, Rejnmark L, et al. (2014) Effects of 12 weeks high dose vitamin D3 treatment on insulin sensitivity, beta cell function, and metabolic markers in patients with type 2 diabetes and vitamin D insufficiency – a double-blind, randomized, placebo-controlled trial. Metabolism 63: 1115–1124.
  23. Pfeifer M, Begerow B, Minne HW, Nachtigall D, Hansen C (2001) Effects of a short-term vitamin D(3) and calcium supplementation on blood pressure and parathyroid hormone levels in elderly women. J Clin Endocrinol Metab 86: 1633–1637. [crossref]
  24. Dalbeni A, Scaturro G, Degan M, Minuz P, Delva P (2014) Effects of six months of vitamin D supplementation in patients with heart failure: a randomized double-blind controlled trial. Nutr Metab CardiovascDis 24: 861–868.
  25. Wamberg L, Kampmann U, Stodkilde-Jorgensen H, Rejnmark L, Pedersen SB, et al. (2013) Effects of vitamin D supplementation on body fat accumulation, inflammation, and metabolic risk factors in obese adults with low vitamin D levels – results from a randomized trial. Eur J Intern Med 24: 644–649.
  26. Scragg R, Slow S, Stewart AW, Jennings LC, Chambers ST, et al. (2014) Long-term high-dose vitamin D3 supplementation and blood pressure in healthy adults: a randomized controlled trial. Hypertension 64: 725–730. [crossref]
  27. Sollid ST, Hutchinson MY, Fuskevåg OM, Figenschau Y, Joakimsen RM, et al. (2014) No effect of high-dose vitamin D supplementation on glycemic status or cardiovascular risk factors in subjects with prediabetes. Diabetes Care 37: 2123–2131. [crossref]
  28. Jorde R, Sneve M, Torjesen P, Figenschau Y (2010) No improvement in cardiovascular risk factors in overweight and obese subjects after supplementation with vitamin D3 for 1 year. J Intern Med 267: 462–472. [crossref]
  29. Kunutsor SK, Burgess S, Munroe PB, Khan H (2014) Vitamin D and high blood pressure: causal association or epiphenomenon? Eur J Epidemiol 29: 1–14. [crossref]
  30. Schleithoff SS, Zittermann A, Tenderich G, Berthold HK, Stehle P, et al. (2006) Vitamin D supplementation improves cytokine profiles in patients with congestive heart failure: a double-blind, randomized, placebo-controlled trial. Am J Clin Nutr 83: 754–759. [crossref]
  31. Arora P, Song Y, Dusek J, Plotnikoff G, Sabatine MS, et al. (2015) Vitamin D therapy in individuals with prehypertension or hypertension: the DAYLIGHT trial. Circulation 131: 254–262. [crossref]
  32. Witham MD, Ireland S, Houston JG, Gandy SJ, Waugh S, et al. (2014) Vitamin D therapy to reduce blood pressure and left ventricular hypertrophy in resistant hypertension: randomized, controlled trial. Hypertension 63: 706–712.
  33. Kienreich K, Grubler M, Tomaschitz A, Schmid J, Verheyen N, et al. (2013) Vitamin D, arterial hypertension & cerebrovascular disease. Indian J Med Res 137: 669–679.
  34. Wood AD1, Secombes KR, Thies F, Aucott L, Black AJ, et al. (2012) Vitamin D3 supplementation has no effect on conventional cardiovascular risk factors: a parallel-group, double-blind, placebo-controlled RCT. J Clin Endocrinol Metab 97: 3557–3568. [crossref]
  35. Boron WF, Boulpaep EL (2003) Medical Physiology. 1 (edn). Philadelphia: Saunders; 2003.
  36. Mann MC, Exner DV, Hemmelgarn BR, Turin TC, Sola DY, et al. (2014) Vitamin D supplementation is associated with improved modulation of cardiac autonomic tone in healthy humans. International journal of cardiology 172: 506–508.
  37. Schmid A, Walther B (2013) Natural vitamin D content in animal products. Adv Nutr 4: 453–462. [crossref]
  38. Bogh MK, Schmedes AV, Philipsen PA, Thieden E, Wulf HC (2011) Vitamin D production depends on ultraviolet-B dose but not on dose rate: a randomized controlled trial. Exp Dermatol 20: 14–18. [crossref]
  39. Li YC (2003) Vitamin D regulation of the renin-angiotensin system. J Cell Biochem 88: 327–331. [crossref]
  40. Baksi SN, Hughes MJ (1984) Alteration of adrenal catecholamine levels in the rat after dietary calcium and vitamin D deficiencies. Journal of the autonomic nervous system 11: 393–396.
  41. Baksi SN (1988) Altered pressor response to norepinephrine in calcium- and vitamin D-deficient rats. Clin Exp Hypertens A 10: 811–832. [crossref]
  42. Schroten NF, Ruifrok WP, Kleijn L, Dokter MM, Sillje HH, et al. (2013) Short-term vitamin D3 supplementation lowers plasma renin activity in patients with stable chronic heart failure: an open-label, blinded end point, randomized prospective trial (VitD-CHF trial). Am Heart J 166: 357–364.
  43. Grubler MR, Gaksch M, Kienreich K, Verheyen N, Schmid J, et al. (2016) Effects of Vitamin D Supplementation on Plasma Aldosterone and Renin-A Randomized Placebo-Controlled Trial. J Clin Hypertens (Greenwich) 18: 608–613.
  44. Witham MD, Nadir MA, Struthers AD (2009) Effect of vitamin D on blood pressure: a systematic review and meta-analysis. J Hypertens 27: 1948–1954. [crossref]
  45. Wu SH, Ho SC, Zhong L (2010) Effects of vitamin D supplementation on blood pressure. South Med J 103: 729–737. [crossref]
  46. Lee KJ, Lee YJ (2016) Effects of vitamin D on blood pressure in patients with type 2 diabetes mellitus. Int J Clin Pharmacol Ther 54: 233–242. [crossref]
  47. Elamin MB, Abu Elnour NO, Elamin KB, Fatourechi MM, Alkatib AA, et al. (2011) Vitamin D and cardiovascular outcomes: a systematic review and meta-analysis. J Clin Endocrinol Metab 96: 1931–1942. [crossref]
  48. Pittas AG, Chung M, Trikalinos T, Mitri J, Brendel M, et al. (2010) Systematic review: Vitamin D and cardiometabolic outcomes. Ann Intern Med 152: 307–314. [crossref]
  49. Beveridge LA, Struthers AD, Khan F, Jorde R, Scragg R, et al. (2015) Effect of Vitamin D Supplementation on Blood Pressure: A Systematic Review and Meta-analysis Incorporating Individual Patient Data. JAMA Intern Med 175: 745–754. [crossref]
  50. Golzarand M, Shab-Bidar S, Koochakpoor G, Speakman J R, Djafarian K (2016) Effect of vitamin D3 supplementation on blood pressure in adults: An updated meta-analysis. Nutr Metab Cardiovasc Dis 26: 663–673. [crossref]
  51. Manousopoulou A, Al-Daghri NM, Garbis SD (2015) Vitamin D and cardiovascular risk among adults with obesity: a systematic review and meta-analysis. Eur J Clin Invest 45: 1113–1126. [crossref]
  52. Margolis KL1, Ray RM, Van Horn L, Manson JE, Allison MA, et al. (2008) Effect of calcium and vitamin D supplementation on blood pressure: the Women’s Health Initiative Randomized Trial. Hypertension 52: 847–855. [crossref]
  53. Scragg R, Stewart AW, Waayer D, Lawes CMM, Toop L, Sluyter J, et al. (2017) Effect of Monthly High-Dose Vitamin D Supplementation on Cardiovascular Disease in the Vitamin D Assessment Study: A Randomized Clinical Trial. JAMA Cardiol 2: 608–616.
  54. Rejnmark L, Vestergaard P, Heickendorff L, Mosekilde L (2008) Plasma 1,25(OH)2D levels decrease in postmenopausal women with hypovitaminosis D. Eur J Endocrinol 158: 571–576. [crossref]
  55. van Mierlo LA, Arends LR, Streppel MT, Zeegers MP, Kok FJ, et al. (2006) Blood pressure response to calcium supplementation: a meta-analysis of randomized controlled trials. J Hum Hypertens 20: 571–580.

Skin Cancers in Albinos at Surgical Oncology Unit of Donka National Hospital (Conakry)

DOI: 10.31038/CST.2019413

Abstract

Purpose: To determine the frequency of albino skin cancers and to describe the difficulties related to the diagnostic and therapeutic management of these patients in Guinea.

Material and methods: This was a retrospective cohort study on albinos attending Surgical Oncology Unit of Donka National Hospital for skin cancer from March 17, 2007, to December 17, 2016.

Results: We identified the 30 albinoes who presented 41 skin cancer lesions. There were 18 (60.0%) women and 12 (40.0%) men. The average consultation delay was 28.3 months. Patients were housewives in 10 cases (33%), merchants in 8 cases (26.6%) and students in 6 cases (20.0%). The primary sites were the face in 22 cases (73.3%), trunk in 4 cases (13.3%) and neck in 3 cases (10.0%). There were squamous cell carcinoma in 29 cases (96.7%) and sarcoma 1 case (3.3%). The clinical stage was localized in 16 cases (53, 3%), locally advanced in 13 cases (43.3%) and metastatic in 1 case (3.3%).  Wide surgical excision performed in 17 (56.7%) for 28 lesions. Wound closure was achieved by a myocutaneous flap in 15 cases, directed scarring in 7 cases, direct suture in 4 cases and skin graft in 2 cases. After a median follow-up of 8 months, 2 patients presented with relapse and 3 new tumor lesions and 9 (30.0%) died. At 24 months, overall survival was 29.0%.

Conclusion: The incidence of skin cancer is high among albinos. Late diagnosis and inaccessibility to means of treatment are factors limiting the management of this vulnerable group.

Keywords

skin cancers, albinos, squamous cell carcinomas, late diagnosis

Introduction

Albinism is an inherited genetic disorder characterized by hypopigmentation of the skin, hair and / or eyes due to a lack or reduced cutaneous production of melanin [1]. Albinos are very sensitive to sunlight damage to the skin [2]. There are two main types of albinism, oculocutaneous (eyes, skin, and hair) and ocular. Skin cancer is a major cause of morbidity and mortality in albinos. They develop precancerous and cancerous lesions at a young age and suffer from advanced skin cancers in the third and fourth decade of their life [3].

It is clear that there are social discrimination and stigma directed towards albinos. As a result of this social discrimination, they are severely limited in the search for medical care when they have significant deformities following advanced disease [4]. Few data exist on skin cancer in albinos in Guinea. The previous study in our unit showed that skin cancers accounted for 7.8% of cancers and 4 of the 84 cases were albinos [5].

These patients have very little access to prevention and care whereas they should be under dermatological screening. Surgical treatment is the only means of treatment available for healing in our settings. This study aimed to determine the frequency and discuss the management of skin cancers of this vulnerable population at Surgical Oncology Unit of Donka National Hospital.

Material and Methods

Settings

Data collection took place at the Surgical Oncology Unit (SOU) of Donka National Hospital, Conakry University Hospital. This unit, created since 2007, receives albino patients from the dermatology and other departments for the skin cancers treatment.

Study design

This was a retrospective cohort study of albino’s patients with cutaneous cancers at the SOU from May 17, 2007, to December 17, 2016. The consultation records, albino patient records, pathology reports, and the operating protocol register completed data collection forms.

Population and data collection

We included records of albino patients who had histologically confirmed skin cancers among other cases of skin cancer during the study period. Records of albino patients with histologically unconfirmed skin tumors or other types of cancer were excluded.

The socio-demographic data studied included age, sex, ethnicity, occupation, and residence. The history of skin cancer, actinic lesions, smoking, and alcohol consumption was recorded. Infection with the human immunodeficiency virus (HIV) was sought by retroviral serology.

Consultation delay from the moment that the patient observed the lesion and came for consultation was identified. Iterative excision was defined by this done before the patient came to the SOU. Clinical data included clinical appearance, tumor size in centimeters, number of lesions, and primary site.

Histological confirmation was obtained on an incisional biopsy specimen or on a complete excision sample. Histological types were classified according to the World Health Organization (WHO) [6]. Adjacent infiltration of muscles or bone was reported. Regional lymphadenopathies were checked by clinical assessment. The sparing assessment was completed by chest x-ray (looking for pleuropulmonary opacities) and abdominal and pelvic ultrasound (looking for hepatic hypoechoic images). The TNM clinical classification of the International Union against Cancer (UICC) 2010 [7] was used to classify skin cancers in this study.

The types of surgical excision, closure of the operative wound, excision margin status, operative complications, and hospitalization were described. Some patients benefited from palliative chemotherapy (5- Fluoro-uracil and cisplatin). There is no radiotherapy in our country. Follow-up time, rates of recurrence and appearance of new tumor foci, and survival were assessed.

Data analysis

Statistical data were analyzed with statistical package for the social sciences (version 21.0 for Windows, SPSS, Inc., Chicago, IL). Categorical variables were shown as the frequency and percentage (%), and continuous variables were presented as the mean (± standard deviation) and / or median and interquartile range (IQR). Patients lost to follow-up were included in the survival analysis. Factors associated with survival were studied in relation to surgical excision and clinical stage. Survival was calculated according to the Kaplan Meier method. The log-rank test was used to analyze prognostic factors. The cox model was used to search for independent prognostic factors. The test was significant if the p-value was less than 0.05.

Ethical considerations

The data analyzed in this study respected anonymous and confidential principles.

Results

From 2007 to 2016, we recorded 41 albinos with clinically suspected skin cancers. Eleven cases were excluded because of the absence of histological examination. We included the records of 30 patients who had histologically confirmed skin cancer. They accounted for 21.9% of 137 patients with skin cancer at the Donka SOU during the study period. Figure 1 shows the number of cases per year.

CST 2019-103 - Bangaly Traore Guinea_F1

Figure 1. Number per year of albinos among patients presenting skin cancer

Sociodemographic Data

The age ranged from 17 to 76 years with an average of 31.6 years (± 14.0) and a median of 31.5 years (IQR 21.7–45.2). Patients aged 30 and under accounted for 50%. There were 12 men (40.0%) and 18 women (60.0%). Patients were housewives in 10 cases (33.3%), merchants or traders in 7 cases (23.3%) and students in 6 cases (20.0%). The patients were from Conakry region in 8 cases (30.0%), Kindia in 7 cases (23.3%) and Kankan in 6 cases (20.0%). Fulani accounted for 14 cases (46.7%), Mandingo 11 cases (36.7%), Soussous 4 cases (13.6%) and Kissi 1 cases (3.3%).

Risk factors

A patient has been previously treated for skin cancer. An actinic lesion has been found in one patient. Smoking and alcohol consumption were reported in the lifestyle of 5 (16.7%) and 3 (10.0%) patients, respectively. HIV infection was found in one patient.

Clinicopathological features

The median consultation delay was 12 months (IQR 8.5–46.0). Before admission, iterative excision was noted in 3 patients. For the 30 patients, there were 41 cancerous skin lesions or 1.4 lesions per patient. Patients had one lesion in 23 cases (76.7%), 2 lesions in 4 cases (13.3%), 3 lesions in 2 cases (6.7%) and 4 lesions in 1 case (3.3%).

The primary site was the face in 22 cases (73.3%), the trunk in 4 cases (13.3%) and the neck in 3 cases (10.0%).

The clinical aspect was nodular in one patient and ulcero-budding in 29 patients. The tumor size ranged from 1–47cm with a median of 5cm (IQR 3.0–12.0). The tumor infiltrated adjacent muscles in 6 cases (20.0%) and bone in 1 case (3.3%). There was regional lymph node involvement in 7 cases (23.3%) and hepatic metastases in one patient. The clinical stage, according to TNM classification of UICC 2010, was localized in 16 cases (53, 3%), locally advanced in 13 cases (43.3%) and metastatic in 1 case (3.3%). Table 1 presents sociodemographic data, the primary sites, and clinical tumor (T) classification.

Table 1. Sociodemographic data, Primary sites and clinical primary tumor (T) classification (UICC 2010) of skin cancer in albinos (n = 41)

Characteristics

Number

%

Age

–     10–19

–     20–29

–     30–39

–     40–49

–     50–59

–     60 & more

5

8

8

6

2

1

16.6

26.6

26.6

20.0

6.6

3.3

Occupations

–     Housewives

–     Pupils / Students

–     Merchants or sellers

–     Drivers

–     Artist

–     Teacher

–     Veterinarian

–     None

10

6

8

2

1

1

1

1

33.3

20.0

26.6

6.6

3.3

3.3

3.3

3.3

Residence

–     Conakry

–     Kindia

–     Kankan

–     Faranah

–     Boké

–     Mamou

–     Labé

9

7

6

3

2

2

1

30.0

23.3

20.0

10.0

6.6

6.6

3.3

Primary sites

–     Face

–     Trunk

–     Neck

–     Arms

–     Eyelids

–     Multiple

22

4

3

1

1

1

73.3

13.3

10.0

3.3

3.3

3.3

Primary tumor (T) classification

–     T1

–     T2

–     T3

–     T4

–     Tx

4

6

13

2

5

13.3

20.0

43.3

6.7

16.7

The diagnosis based on the histological examination of the biopsy specimen in 20 patients (66.7%) and the excisional specimen in 10 (33.3%) patients. This was squamous cell carcinoma in 29 cases (96.7%) and sarcoma 1 case (3.3%).

Treatment

A wedge surgical excision was performed in 17 patients (56.7%) for 28 lesions. Radical cervical lymph node dissection was performed in the second time in one patient. Wound closure was obtained by a simple suture in 4 cases, cutaneous graft in 2 cases, myocutaneous flaps in 15 cases and directed scarring in 7 cases. Excision margins were free in 7 documented cases. Infection of the operative site (1 case) and delay of healing (1 case) were complications observed. This intervention required hospitalization in 7 cases. The median hospital stay was 6.5 days (IQR 4.5–20.7). Salvage and palliative chemotherapy were performed in 2 and 1 patients respectively. The clinical response to this chemotherapy was disease progression in all cases.

Follow-up

Nine patients were seen once at the consultation. After a median follow-up time of 8 months [95% CI 2.3–13.7], we observed a relapse in 2cases (6.7%), the appearance of new tumor lesions in 3 (10%) patients and 9 (30%) patients had died. Figure 2 shows the old scars and new tumor lesions.

CST 2019-103 - Bangaly Traore Guinea_F2

Figure 2. Old scars and new tumor lesions

Overall survival after a median follow-up of 8 months was 70.0%. At 24 months, overall survival was 29.0% (Figure 3). This survival was correlated with being operated upon (88.2% versus 46.2%) (p = 0.02). It varied according to the stage: 87.5% for the localized stage, 53.8% for the locally advanced stage and none for the metastatic stage (p = 0.056). None of the factors were independent after analysis by the Cox model.

CST 2019-103 - Bangaly Traore Guinea_F3

Figure 3.  Overall Survival of skin cancers in Albinos (n = 30)

Discussion

The limitations of this study were the low number of histologically confirmed cases of skin cancer in albinos. Despite this, we showed the high frequency of skin cancer in albinos, which accounts for about one-fifth of all skin cancers in this study. This frequency was similar according to Kromberg et al [8] in South Africa. It was higher than that of Mabula et al [1] in Tanzania which was 13.2%. In an Imo State plastic surgery department in Nigeria, skin cancer in albinos represented 67.0% [9].

As in other findings [1,3,10], the patients are in their third decade.

The high frequency in the Conakry region and surrounding areas is related to the proximity of the reference services (Dermatology and Oncological Surgery Unit) in the management of skin cancers.

The socio-professional groups involved in this study were those (housewives, tradesmen, students) who were exposed to the sun. Patients working outdoors, under the sun accounted for 75.0% according to Opara and Jiburum [9]. The use of wide-brimmed hats, long-sleeved shirts, scarves on the neck, sunglasses, and sunscreens could reduce the occurrence of cancer in these areas of the body.

Smoking found in some cases would increase the risk of CCS [11]. Actinic lesions was reported only in one patient where is found by Emadi et al [12]in 37.7% of women and 29.1% of men.

HIV infection, diagnosed in a patient, would increase the frequency of cutaneous cancers in albino but the etiopathogenic mechanism is not known [13]. HIV infection was reported in 6.2% of albino patients in the Mabula et al [1] series.

Clinicopathological features

The long delay, varying from 3 to 120 months, was reported by Opara and Kiprono [3,9]. This late presentation was mainly related to poverty and ignorance. Treatment in peripheral hospitals and among traditional healers is mentioned in some studies [1]. Three of them were poor first management in peripheral health facilities, hence the need to improve continuing health professionals training on early detection. The multiple lesions were common in the same patient. The mean number of outbreaks was  1.4 per patient in our study and 1.9 lesions per patient according to Opara [9]. The part of the body (face, trunk, and neck) exposed to the sun, were the most common primary sites. Although none exist in our study, rare cases of localization on the genitals and the lower limbs have been described by Mabula et al [1].

The average size of 5cm is reported in other studies [1, 14].

The diagnosis of cutaneous cancer was confirmed on the histological analysis of the biopsy specimen in 2/3 of the cases and the operative specimen 1/3 of the cases. In the first case, it is often advanced lesions, multiple or from other services with the results. In the second case, these are patients who have resectable lesions, who accept the surgical treatment after assessment; the resection is then both diagnostic and therapeutic.

Almost cases were squamous cell carcinoma in this study. This was reported by several studies [1,3,8,15]. There are no basal cell carcinomas and melanomas, but these forms reported [1,3,9]. In contrast, cutaneous sarcomas in albino are very rare; only one case in this study. Rare cases of sarcomas have been reported [16,17].

Adjacent muscle or bone, and cervical lymph node involvement indicate advanced stages in these patients. These lymphadenopathies were all related to SCC. Mabula et al [1] reported 12.5% of regional lymphadenopathies in 64 patients. In this study, liver metastases were present in one patient whereas Mabula et al [1] described liver, lung, bone and nerve metastases in 6 out of 64 patients.

Treatment

One of the limitations of this study was the small number of patients treated. Our 60% of patients treated were greater than those of a previous study in which 46 of 102 skin cancer patients were treated. [18]. This difference can be explained by the effect of the campaign of early detection and management of albinos in 2014. However, in Africa, black albinos often suffer social discrimination because of superstitious beliefs and the stigma associated with albinism. They are often rejected by their communities, with a resulting delay in the search and treatment of any precancerous or malignant keratosis lesions. Thus, at the time of diagnosis, the lesion is often advanced and has a poor prognosis [13].

Surgery has been reported as the mainstay of treatment for the majority of skin cancers in albinos [19,20]. Wide excision is the most important to prevent local recurrence. Good results can be achieved with radical surgery and optimal surgical margins as well as the reconstructive procedure when needed. In the current study, wide local excision, with skin flap closure or graft was the most performed surgical procedure as in many studies [1,4,9].

One patient underwent cervical dissection for regional lymph node relapse, after treatment of the primary lesion by wide excision. Mabula et al [1] performed a single lymph node dissection among the 64 patients in their study. We did not perform systematic lymph node dissection because we considered that the lymph node would be related to secondary infection. In addition, all lymph nodes decreased after the excision of the primary lesion.

It is often an outpatient surgery. But hospitalization may be needed as for 7 patients who underwent extensive resection and / or to avoid complications while Mabula et al [1] hospitalized more than 90.0% of patients for their treatment. Wound Infection and delayed healing were surgical complications observed in one patient. In addition to these complications, flap necrosis and skin graft loss have been described [1].

Three (3) patients received cisplatin and 5 fluorouracil-based chemotherapy and results were progression disease. Although cases of complete or partial responses have been reported after chemotherapy with adriamycin and platinum salts (carboplatin or cisplatin) [21, 22], there is not enough data to confirm the role of neoadjuvant chemotherapy in locally advanced skin cancers in albinos.

In this study, we had problems to follow-up these patients. The median time to follow up was 8 months. These follow-up problems have been reported by other authors as well [1,9]. Despite these follow-up problems, we were able to assess the local control by the recurrence rate which was 2 out of 17 cases, representing a relapse rate of 11.7%. This rate seems less than that found by Mabula et al [1] which was 30.0%. These differences could be explained by surgical margins status. In this study, surgical margins vary 1–2cm as reported in the previous study on skin cancer surgery in our unit [18]. Our patients did not receive radiotherapy, which is indicated in cases of unresectable locally advanced cancers, in the adjuvant situation and in cases of relapse [1,9]. In addition, radiotherapy can optimize local control after surgical excision of the lesion.

In this study, we noticed the appearance of new tumor lesions in 3 patients. Thus, multiple lesions, relapse, and new tumor lesion mean that albinos can undergo multiple skin surgeries during their lifetime [14].

Approximately one-third of patients died in this study while the mortality was 4 out of 64 patients in Tanzania [1]. This high mortality is related to not being operated upon and has been higher in advanced cases.

Conclusion

The incidence of skin cancer is high among albinos. Late diagnosis and inaccessibility to means of treatment are factors limiting the management of this vulnerable group.

Acknowledgment

We said thanks to Mr. Thierno Boubacar Balde for the patient records availability

Ethics approval and consent to participate: In this retrospective study, data were collected anonymously and confidentially. Patients signed the consent form for the use of data contained in their records.

Consent for publication: Patients signed the consent form for the use of data contained in their records.

References

  1. Mabula Jb, Chalya Pl , Mabula Dm (2012) Skin cancers among albinos at a university teaching hospital in northwestern Tanzania: retrospective review of 64 cases. BMC Dermatology 12: 5.
  2. Ramalingam VS, Sinnakirouchenan R, Thappa MS (2009) Malignant transformation of actinic keratoses to squamous cell carcinoma in an albino. Indian J Dermatol 54: 46–48.
  3. Kiprono SK, Chaula BM, Beltraminelli H (2014) Histological review of skin cancers in African Albinos: a 10-year retrospective review. BMC Cancer 14: 157. [crossref]
  4. Ademola SK (2015) Analysis of skin cancer in albinos Ibadan ; Nigerian J Plast Surg  11: 23–28.
  5. Traoré B, Keita M, Condé M (2016) Skin cancers clinicopathological features in the surgical oncology unit of Conakry Teaching Hospital. Rev CMES santé  2: 2424–7243.
  6. Fritz A, Percy C, Jack A et al. (2000) International Classification of Diseases for oncology. World Health Organization Geneva. Third Edition 2000
  7. Sobin LH, Gospodarowier MK, Wittekind CH (2010) Classification des tumeurs malignes UICC CASSINI 7e édition  173–174 ; 180.
  8. Kromberg JG, Castle D, Zwane EM et al. Albinism and skin cancer in Southern Africa. Clin Genet 1989 36: 43–52.
  9. Opara KO, Jibururum BC (2010) Skin cancers in albinos in a teaching Hospital in eastern Nigeria – presentation and challenges of care; Word J Surg Oncol 8: 73.
  10. Eisenhauer EA, Therasse P, Bogaerts J (2009) New response evaluation criteria in solid tumors: revised RECIST guideline (version1.1). Eur J Cancer 45: 228–247.
  11. Dusingize JC, Olsen CM, Pendeya NP (2017) Cigarette smoking and the Risks of Basal cell carcinoma and squamous cell carcinoma. J Invest Dermatol 137: 1700–1708.
  12. Emadi SE, Suleh AJ, Babamamoodi F (2017) Common malignant cutaneous among albinos in Kenya. Med J Islam Republ Iran  31.1
  13. Lekalakala PT, khammissa RAG, Kramer B (2015) Oculocutaneous Albinism and Squamous Cell Carcinoma of the Skin of the Head and Neck in Sub-Saharan Africa,” Journal of Skin Cancer 2015 : 6.
  14. Onuigbo W (2015) The Recognition of recurrent from of albino skin cancer. J cancer Prev Cur Res  3(1)
  15. Asuquo ME, Otei OO, Omotoso J, Bassey EE (2010) Letter: Skin cancer in albinos at the University of Calabar Teaching Hospital, Calabar, Nigeria. Dermatol Online J 16: 14. [crossref]
  16. Graziosi GB, Sbachiero JC, Neto BRC (2014 ) Diagnostique et traitement pour le cancer de la peau chez les albinos : une etude Descriptive. Brazilian journal of plastic surgery 26:1983–5175
  17. Ofilli O (2014) Recurrence of Rhadomyo sarcoma in squamous cell carcinoma in Nigeran pal skinned person (albinos) : A case report. Advanced Research Journal of Medical Sciences  1: 058–060.
  18. Traore B et Lamah L (2017) Outcomes of surgical treatment of skin cancer at surgical oncology of Donka Conakry University hospital. Journal of cancer therapy 8 : 1086–1094.
  19. Hong ES, Zeeb H, Repacholi MH (2006) Albinism in Africa as a public health issue. BMC Public Health 6: 212. [crossref]
  20. Berger E, Hunt R, Tzu J (2011) Squamous-cell carcinoma in situ in a patient with oculocutaneous albinism. Dermatology Online  17: 22.
  21. Chidothe IA, Masamba L. Neoadjuvant chemotherapy in Albinos with advanced skin cancer at a Blantyre Hospital: Case series. Malawi Medical Journal 23 : 97–99.
  22. Mapurisa G1, Masamba L (2010) Locally advanced skin cancer in an albino: a treatment dilemma. Malawi Med J 22: 122–123. [crossref]

Egg and Sperm Donors: Parental Identity Formation

DOI: 10.31038/IGOJ.2019221


Infertility is a medical condition that affects many aspects of human life. It does affect one’s relationship with self and consequently will impact one’s self- Identity as a mother or father. Individuals who resort to Assisted Reproductive Technology methods will recognize the emotional impacts, physical, social and as well as economic hardship on their families.

How individual deal with these unexpected emotions, depends on one’s personality style, coping mechanism and external and familial support systems.

Often facing infertility and having to deal with its traumatic impact leads to denial and projection. The traumatic loss of one’s ideal self makes it a challenge for the individual who has to deal with infertility. One cannot rely upon secondary process thinking. The unconscious wishes will always be carrying reason along in the course of the decision making process and what goes into choosing egg or sperm donor.

In considering the psychological implications of ART, here we first discuss the various reproductive technologies available to couples. There are many resources that patients can access to learn about infertility, reproductive facts and Assisted Reproductive Technology. They can also access mental health professionals to help them with their unresolved emotions regarding their infertility, use of egg and sperm donor or surrogate mother.

In the United States, the American Society of Reproductive Medicine (ASRM) has been instrumental in providing specific educational resources to guide people who are facing infertility. American Fertility Association (AFA) is an organization created to educate the public about reproductive disease and support families during struggles with infertility and adoption, (http://www.theAFA.org)

In the United Kingdom since 2005, the child who is the product of egg donation can now find out non-identifying information about its donor at sixteen, and more detailed information, including name and address, when it reaches eighteen. Although the numbers of egg donors didn’t collapse after this, as feared, fewer new donors registered and there has been a shortage as demand has increased – around 1,300 women every year in the UK are treated with donated eggs – with waiting lists of around a year at some clinics, which has resulted in many women and couples seeking treatment abroad. In the UK, the number of women treated using donor eggs has hovered around 1,300 every year since 2007 [1]. (The Guardian, Dec 12, 2012).

The new trend is to air for openness and transparency when individuals resort to egg donors and sperm donors, much similar to what adoption is now a days. More parents do plan to tell such children how they were conceived. There are counseling centers that help couples on how best to do it. Anonymity and secrecy is no longer in fashion. There are still some cases that do not dare to break the secrecy, since struggle with stigmatization, fear of forming weaker attachment bonding and inner conflicts.

Many gay and lesbian couples pioneered openness about using donors; many form relationship with their child’s biological parent.

Today, one in every 100 babies in the U.S is created through some form of in vitro fertilization, or IVF, even many heterosexual couples like to tell their children this modern-day version of the facts of life. (npr report) http://www.npr.org/2011/09/17/140476716/a-new-openness-for-donor-kids-about-their-biology When and how to tell a child about biological genes, depend on the child’s developmental and cognitive capacity to understand the meaning of the information they receive. Dishonesty affects the child’s sense of trust toward their parents. It potentially creates disequilibrium in their psychic function and object relation.

Egg Donors

For woman with premature ovulation failure woman’s ovaries, advanced age, lower ovarian reserve, autoimmune disease, failed IVF, or concerns about genetically transmitted disease, donor egg IVF may be considered. When in-vitro fertilization treatments are not effective, donor eggs can allow an infertile woman to carry a pregnancy to term and give birth. In men with deformed or absent sperms, the use of a technique called, ICSI (Intra Cytoplasmic Inoculation) could potentially present risks to the future child.

Although egg donation is scientifically analogous to artificial insemination with donor sperm, it raises questions concerning the medical risks and potential psychological impact on the mother, couple, and future child. The risks include expense to the woman donating the egg, the risk of carrying multiple babies to term, as well as ethical and legal issues involved in egg donation that have yet to be resolved. There are many psychological, social, and economic issues associated with the use of ART.

During the course of infertility work up, the attention is often focused on the external medical team than an individual‘s mind and unconscious fantasy life. The new infertility techniques help many infertile women to get pregnant, but the interaction between fantasy and reality stimulated by the adult wish for a baby (Pines, 1972) is complicated both before conception and during the pregnancy and the concerns transference feelings toward the donor egg or donor sperm.

After consultation with the reproductive physician, the couple can meet the egg donor though the donor egg coordinator in conjunction with the physician. Psychological issues often appear during the selection process. Some of these cases need help with the entire Egg IVF treatment, donor selection, cycle coordination, egg retrieval, and transfer of embryos.

Unlike their European colleagues, reproductive specialists in the U.S. tend to transfer multiple embryos at a time, resulting in an increased risk of multiple birth pregnancies. Although patients have opportunities to explore the concrete details of IVF available in clinician offices or on websites, they often do not explore their own internal fantasy construct. One example of denial of what reality may present is dealing with multiple babies. There is potential for both pleasure and peril in carrying multiple babies to term and parenting multiples; however pre-warning educative stance could be the most crucial task of reproductive physician and his team.

Sperm Donor

Some men must confront their own infertility issue once the actual infertility like their female counterparts.

In approximately 40% of infertile couples, the male partner is either the sole or a contributing cause of infertility. There may be abnormality related to the volume or amount, motility, and morphology of the sperm. A male fertility work up can involve genetic testing and other hormonal testing. In some cases, no obvious cause of poor sperm quality can be found.

Treatment for male factor infertility may include antibiotic therapy for infection, surgical correction of varicocele (dilated or varicose veins in the scrotum) or duct obstruction, or medications to improve sperm production. In some men, surgery to obtain sperm from the testis can be performed. In some cases, no obvious cause of poor sperm quality can be found. Intrauterine insemination (IUI) or IVF may then be recommended.

When the male infertility is the cause of the problem, individual has the option of choosing a sperm donor. Direct injection of a single sperm into an egg called ICSI, (intra-cytoplasmic sperm injection) may be recommended as a part of the IVF process. In men with deformed or absent sperms, the use of this technique could carry some risks. The physician may recommend using a sperm donor. Insemination with donor sperm may also be considered if IUI is not successful or if the couple does not choose to undergo IVF. Psychologically, men are not immune to devastating feelings of despair when you discover they are infertile.

Men might feel infertility as loss of success—that is as failure or life crisis. As one of my male patients described his feeling of failure, he felt his life came to disequilibrium. He felt a chronic sense of fear and anxiety that felt unending. The recovery from the loss may never reach to a full resolution. The mourning period can linger on for a long time and becomes an unfinished mourning in some cases. A good number of cases are unable to ask for help to process the intense feeling of disappointment to recover from the loss. The feeling of “Why me”, in particular can erodes one’s sense of self-confidence and self-doubt sets in.

Cases

Here we describe three cases in psychodynamic psychotherapy that illustrate the complex psychological ramifications of fertility and the impact of ART.

Nelly

Nelly is a 32-year-old married woman, who came to psychotherapy treatment for depression. She was unhappy in her life, suffered from poor self-esteem and harbored ambivalent feelings towards getting pregnant.

There was no history of childhood disturbances and she was used to being an only child. She had close healthy attachment to her mother. Her developmental milestones were reportedly normal. She had no memory of any other caregivers besides her mother.

Unconsciously she identified with her mother who denigrated her stepfather. Her mother was not a nurturing woman and was often angry with Nelly when she was a young child. In contrast her stepfather was a caring man who showed affection toward her. As a child, she was under the impression that she was conceived out of wedlock. After Nelly turned sixteen, her mother told her that she was conceived with the help of a sperm donor. Her mother refused to tell her whether she had used a sperm bank or the sperm from a friend or acquaintance. Her world suddenly became upside down—not knowing anything about her origin. Her sense of identity was shaken up. Initially shocked by this tightly kept secret. Nelly became depressed when she could not find out the identity of her biological father. She was angry with her mother who concealed the truth from her. She developed an obsession with the thought of wanting to find her biological father.

She needed to know where her chin or nose came from and also why she developed an interest in international relation and cross-cultural psychology. She finally was able to find her father through Internet search after a long detective work. She wanted to solve the puzzle of “Who am I?”

Nelly hoped to forgive her mother for having her out of wedlock, and that someday her mother would tell her about the man whom she got pregnant. She started to understand her mother anxiety about her biological clock and uncertainty about her sense of femininity.

Her mother explained that she was not sure she could marry at age 34 and the clock was ticking away. She did not think she could attract a man to marry her. She decided to use anonymous sperm donor. She told her that her doctor helped her with an anonymous sperm donor. She wanted it to be something like an immaculate conception. Nelly’s mother for reasons of her own did not tell her how she was conceived or where she found the sperm donor. She did not think that far ahead about Nelly’s future inquiry into her root. All Nelly knew was that the man she called Dad was not her biological father. None of her friends knew that Nelly had stepfather.

Once Nelly became aware of the intensity of her chronic anger toward her mother, she decided to get psychotherapeutic help. She felt frozen in her life and could not move forward.

She was in tear one day and said she cannot free herself from her rage. “I don’t understand why my mother did not think about what would happen to me when I had to live in her secret world of lies and deceit! Did she want empathy from me that she was not marriageable and she had to resort to lying to everyone especially to me? I am a person too”.

After she discovered the biological father, she became angry with him as well. One day she related,  “Now I know who was the donor I am angry with him too. It is like staying anonymous and absolved from his responsibility finished his job! I feel miserable. My mother brought me into this world just to please herself by affirming her feminine and fertile self”.

In therapy, she worked on her revived deep sense of shame and narcissistic disappointment. She was ashamed of herself and her mother who lacked self-confidence. She had anxious fantasies that she was joined with her mother eternally and could not find her own autonomous self. She worried her rage would destroy her connection with her mother. Her fear of losing her god-like father of her childhood image of her stepfather mixed with a newly emerging image of this other “father”, these fears turned into an anxiety about her identity diffusion. She felt regret for getting herself into “this mess” without knowing how to get out of it. She wondered about repeating what her mother had done. She fantasized about staying and childless to get revenge from her mother. She did not want to let technology decide her conception. She struggled with her husband’s wish for wanting to have children.

She became aware of her ambivalent feeling about “motherhood” and was willing to work through her childhood wish to conceive and bear a child. She learned to value her academic achievement, which was so much greater than her mother’s without having to feel guilty of surpassing her.

Todd

Todd and Sherry, as a couple, parent of a four-year-old son came to see me because Todd had difficulty relating to their son. He was conceived through using sperm from a sperm donor who was a friend of family and Sherry’s eggs.

Sherry was 35 when after many years of trial to get pregnant; the male infertility was identified as the main factor in failing to conceive. Todd recalled the sense of failure was made infertility so difficult to deal with. It felt like a crisis for him and he went through cycles of hope, fear and despair. It felt for like an emotional roller coaster each time they started a new round of ICSI.  After multiple trials, they came to accept the fact that they had to use a donor sperm. He wanted to use his close friend’s sperm and his wife agreed to that. When Sherry became pregnant, they were able to go through feeling of anticipation and excitement together as a couple. The pregnancy was uneventful their healthy baby boy was born. He was a beautiful boy who did not resemble Todd.

He found himself feeling surprised having noticed some strange feeling toward his infant son and his friend with whom he had a close friendship and working relationship. In retrospect, he started to have doubting feeling about his decision using his friend’s sperm rather going to a sperm bank. It felt right to ask his good friend at that time, but after Sherry gave birth to their son, he noticed he was having many doubts about his ability to be a good father. How could he have ignored his own longing for biological relationship to his child? After all many people went to “Cryobank” and arranged to get donor sperm. He felt his decision asking his friend was a reasonable one at the time. He did assume the biological root did not matter and what mattered was “the end product”. He secretly blamed his wife for rushing to get pregnant. Now that their son is four years old, he looks so much like his friend Peter. He avoids getting together with Peter because he worries his son would show more affinity to Peter as well as Peter towards him.

He wondered if he could ever have the stamina keeping the secret from his son. He worried if he discloses to his son about his genetic root, he would turn away from him. Did he strip his son from the right to know who both of his parents came from? How can he and his wife explain all of these to him?

He argued with himself that his son has the right to know that Todd is not his biological father. Furthermore, he feared his friend Peter would someday reclaim his right as biological father. He kept wondering what would happen to their marriage when all three of them would attend gatherings especially when they would also take their son with them. What if Sherry developed closer connection to Peter and consequently ends their marriage.

The new dilemma he was facing caused the two of them a lot of tension. Sherry communicated to him it was his entire fault that they had to resort to his friend for help. She reminded him that she preferred an anonymous donor. They did yell at each other and it seemed like they could not agree about anything especially when it came down to decisions about the kind of day care their son was to attend or issues around discipline rules. He recalled how he felt mixed, when there was an expectation to be a hand holder when Sherry was going through pregnancy.

He did not have time to think through his decision and was expected to offer Sherry emotional support. He did not know he had come to terms with his own infertility let alone to play a new role supporting his wife. He did not know how he could offer support especially when another man’s sperm was involved in this process. The sense of profound failure as a male was a prevailing feeling. He was there for her when she went through wrenching experience of the harvesting of the ova, but now he felt as if his son was a stranger.  Now only in retrospect, he was able to think more deeply and wondered what effect his consenting to use donor sperm would have had on his sense of father identity and paternity right of their son?

He tormented himself with another question; his fear of seemingly weakened bond with his son. He wished he could have foreseen and prevented psychological complications of his rushed decision.

In his therapy Todd was able to discuss all of his many fears and self-doubt as non-biological father as well as his role as husband to Sherry. He felt he had to prepare himself to be less emotionally reactive or erratic when he encountered his friend. After all, he could not be ungrateful to his friend, since he was an honorable, altruist man who helped to create their son.

He just could not believe that his feelings were going to be so out of control after the baby was born. He agreed to freeze two of Sherry’s embryos for the future use. He resented the thought of having more kids, fearing having to endure the same familiar range of intense emotions. The emergence of a powerful destructive fantasy was explored during this period of his work with me. How could he deny Sherry for wanting to have more babies?

His individual therapy helped him to work through his destructive feelings, mange his intense negative affect, develop a better tolerance, and not acting out on them.  After much individual work, He became interested to start couple therapy. He felt he was in a much better place since he developed a more consolidated sense of himself. He wanted to work on stability of his marital relationship.

From a post therapy contact by phone, Todd appeared that his relationship with his son improved and overall he was able to enjoy a healthy relationship with him. He learned the importance of openness and wanted to tell his son about the sperm donor when he was at a right age to comprehend it’s meaning. His son temperamentally resembled him but not physically.

Emily

Emily a married professional of 45 came to therapy because of conflicts about her desire to become a mother and martial problem. She was doubtful about their capacity to become parents.

She postponed her decision to have a child for many years and suddenly realized time was running fast. Emily was the second child from a family of three children. Her sister was five years older than her and was very popular girl. She could never be like her sister and she felt her mother preferred her sister because they both were brunet and had more in common. Emily was blond and petit. The youngest was a girl who was born eight years after her birth. Emily grew up with a pervasive feeling that she was damaged, a feeling that was reinforced by her over anxious mother throughout her childhood. She was maternal to her younger sister and fiercely competitive to her older sister. Her father drank a lot and used fowl language when she was drunk. She learned to avoid him and his abusiveness.

Emily was an obedient girl who thought she was not intelligent. Her mother constantly compared her to her older sister and her father jokingly called her dumb little blond. She was filled with anxiety and self-doubt. Her family was struggling financially, and she felt inferior to her class -mates who were living in comfort.

In her early adolescence, she befriended a girl from a high socioeconomic class. She could ride in her friend’s car going to school while enjoying the association to her friend’s especial privilege of being driven by her chuffer. She felt envious of her friend and secretly wished she could be her. Her friend’s grandfather, a financially prominent man lived with his Emily’s friend’s immediate family. He touched her chest several times inappropriately during her pubescent years. She recalled those early experiences exciting and at the same time was fraught with shame and guilt. Her friend’s move to another school put an end to it. She liked the attention the old man was giving her by having her sit on his lap. She never told anyone about this.

Emily finished her high school years and was able to enter a prestigious collage. She met her husband in collage and after short few months, they decided to get married. The couple waited for few years before they decided to give it a try to conceive.

Their trials for conception failed for few years and finally the gynecological work up revealed multiple calcified fibromyoma in her uterus.  Her mother also suffered from the same problem. However her mother had her three children before her fibromyoma became problematic.  Additionally Emily’s contributing psychological component complicated further to her infertility problem. Her difficulty conceiving made her feel as though she was “damaged goods”. She could not become a mother unlike her mother and sister. She was bitter and could not accept that her uterine abnormality was an important reason for not conceiving. She felt it was not fair that her sister had children and she could not get pregnant. She was a “virtuous good girl” and her mother relied on her when her family needed help. She felt she was denied something very important, meaning getting pregnant like anyone else. “It was my birth right, it was not fair!”, one day she uttered, and she wanted me to agree with her.

On the other hand, after she found out she could not conceive, she thought “there was a big sign on me like in Scarlet letter that I was Infertile”. The fertility clinic told her she needed to talk to a psychiatrist because her infertility was “psychogenic”. I was going to a full circle. I thought I was grieving. I was so disappointed each time I tried. My husband was not grieving. But, to be fair to him he actually was very supportive of me and left me free to make a decision how to go forward. He even was willing to be childless if I wanted to.

In one of her analytical hours, she said “I must have made myself infertile by being neurotic. See, I am not smart to catch on to things quickly. See, pregnancy may never happen for me. May be I wanted too much like I wanted my friend’s wealth and prestige. I wanted to wear expensive clothes, drive expensive car and marry a rich man. It may want everything or wanting too much, being greedy has to do with not getting what I really want, a family is what I have always dreamt of.” She had tears in her eyes. She was in despair and full of doubt. She continued, “I did not even ask why I needed to talk to a psychiatrist. I followed their advice. Looking back I could tell why I needed to see someone and now I am here to see you in order to understand my ambivalence feeling about motherhood.”

She felt she needed me to help her learning to accept her fate, or maybe she would regain her stamina to pursue other options such as using egg donor or resigning to the prospect of being childless.

She had contemplated using a surrogate mother but wanted to give it a shot to egg donor option and her newly reconstructed uterus a good try (She had gone through extensive myomectomy). Her two IVFs and GIFT (Gamete in the Fallopian tube) procedures were unsuccessful. These failures caused her a great anguish, hopelessness and self -doubt.

She realized how angry she was with her mother who did not empower her and instead made her a damaged woman. She also felt that I was an impotent analyst and that her problem was far more complicated, beyond the scope of my expertise to be able to solve it. She was unsure about the help I could offer her. In the transference I turned in to an “Infertile analyst”. She agreed with my interpretation of how she wished I could have had a magic formula to help her damaged uterus, damaged mind and damaged body. She felt I was letting her suffer in her despair and was being indifferent to her pain. I emerged as a controlling pre-oedipal mother who expected a total obedience and submission.

The decision about using an egg donor and who to ask became an obsession that agonized her for many months. She thought maybe she could ask her younger sister to become her egg donor. She asked herself if her sister could have a second thought about going through the medical procedure. She wanted her child to have her family genes and not to go to a stranger for eggs.

After several month of deliberation, she got her courage up to ask her sister Ann to see if she was willing to be her donor.  Ann was a mother of two and was happily married. She was eager to help her older sister whom she was very fond of. Emily was static when she heard her sister accepted to be her donor egg. We tried to explore the meaning of using the eggs from her sister.

Her desire to use her sister eggs was so strong that she was not interested to explore the meaning of her decision. Her conscious desire was to have her family gene pull with her husband’s sperm than using some stranger whom she did not know. She was set to have her own child and if her sister was willing to give her eggs, it meant that those were like her own eggs. It was like a dress they would share both. That is how she put it with a glee on her face. Shortly after this decision, she started to have fears about her sister’s children who were her child’s half siblings. How could she bear the thought of keeping it secret or have it out in open?

One happy thought countering her fear was “why not to become a big happy family?” She would carry the baby to term and everyone would understand and support her. She also thought she was being greedy to ask for her sister’s eggs, which were not hers. To her it was like stealing! This self-accusation led to an association to an earlier memory about her mother. She recalled how her mother declared one day that how could she feed her children when there was hardly any food at home. Her father, an alcoholic was not helping the family when he spent money on his alcohol. Food was scares and the family had to deal with extreme deprivation.

Together we had done good deal of analytical work to help her with feelings of envy, greediness and stealing charge. She worked hard to overcome her doubt and move forward with her decision to enter into the world of motherhood.

After this unsettling emotional period was over, a much hopeful anticipation to “become a mother” prospect, made Emily overcome her disabling doubts. Her pregnancy was uneventful and she gave birth to a healthy baby girl. She brought her baby infant to one of her sessions. The baby had resemblance to her. She wanted to hear my reassurance   that indeed her daughter looked like her. It was very important to her to hear it from me.

Two years later, after a period of hiatus in her treatment, she phoned to see me for a follow up visit. She was caught by surprise when she began feeling confused about her reaction toward her sister in a holiday family gathering. She felt her daughter seemed to go to her aunt (her biological mother) and she imagined her sister also made it obvious through her non-verbal interaction. She told me that she had never thought about the future encounters and her unexpected emotional reaction. She knew her sister had not revealed to her own two children about having volunteered to be an egg donor to her older sister. Emily was not prepared to talk about it with her daughter and was not sure that she would have wanted to disclose to her.

There was more work for us to do in therapy, exploring the meaning of her motivation giving promise to herself “the promise of anonymity”. She felt competitive toward her sister and felt inferior to her. She struggled with the old feeling about her body that betrayed her.

Discussion

For men like Todd, infertility does not directly affect their traditional and gender role, although it can be profoundly disappointing and be experienced as performance failure and a failure of masculinity, as well. In some cultures, masculinity is directly linked to being able to produce children and as a woman’s value to the man is diminished after her child bearing ends at menopause. There is no parallel to the visible personal bodily changes that the woman experiences in pregnancy.

Both men and women go through the physical and emotional turmoil of infertility. Infertility is both unique and complex. Although children are born through ART, the emotional impact of such reproductive methods is in need of further studies.  The experience of going through fertility work up and ultimately having to go through many medical and psychological phases leading to a successful outcome is very unique for each individual. It can be a lonely and private experience for both men and women. It does affect their sense of which they are and who they imagined in their youth wanted to be. The fundamental value of capacity for creation has been so deeply rooted in sense of bodily self that individual belief systems about her/his sense of identity become challenged. Patient will struggle consciously and unconsciously with the meaning of borrowing eggs or sperms from other living beings.

The intense emotions erupt without knowing how to manage these strong emotions while they go through reproductive procedures.

Analysts and psychotherapists roles offering a holding environment at such trying times are each of these cases presents a complex of social, familial and cultural, unconscious and conscious elements which intern influence the ways in which navigate through the turmoil of their development challenges and unexpected losses. The earlier unconscious conflicts reappear and affect their sense of identity and their couple relationship.

References

  1. The Guardian, UK, Wednesday 12 December 2012
  2. Robert Nachtigall, Elizabeth Mehren (1991) Overcoming Infertility a practical strategy for navigating the emotional, medical, & financial minefields of trying to have a baby. Doubleday Book