DOI: 10.31038/EDMJ.2018243
Abstract
This paper builds upon a body of research which illustrates that the main function of the brain is to modulate the coherent function of the organ networks more commonly known as physiological systems and hence ensure our optimum physiological stability and function. The aim of this article is to further develop this hypothesis and illustrate examples which support it.
Moreover the existence of the neurological paradigm i.e. the mechanism by which the brain regulates the coherent function of the physiological systems, by comparison to the contemporary biological paradigm, illustrates fundamental conceptual limitations of biomedicine and, in particular, of the most widely used diabetes drug metformin; in particular that at normal dosage metformin does not appear to function as a drug but instead as a biological buffer which regulates plasma pH at indicatively 6.9–7.1 thereby adversely changing plasma pH to a level which, for many, ensures that their diabetes persists for as long as they are taking this medication and which for the obese may defer the progression of more severe diabetic comorbidities.
Such an observation requires a fundamental rethink of what exactly is diabetes and has significant implications re what is diabetes, how it should be measured, and how it should be treated i.e. by dealing with the neurological origins of the condition or by treating the biomedical consequences, or by a combination of both approaches.
Keywords
stress, genotype, phenotype, autonomic nervous system, physiological systems, mathematical model, metformin, pH, acidity
Introduction
Stress is experienced through the senses, alters sense perception, and is often manifest as a myriad of pathological symptoms. This illustrates that the brain is intimately involved in the regulation of the body’s biochemistry [1]. Moreover that there are pathological changes at the molecular level indicates that there must also be changes at the cellular level, changes to the structure and function of organs, and also to the coherent function of the organ networks which are more commonly known as the physiological systems.
Medical research provides us with a range of biomedical indicators which can be used to characterise the patient’s health however a GP’s training, and their examination of their patient(s), is based upon a rudimentary understanding of the physiological systems.
- The relationship between brain function and pathological onset has been extensively studied by clinical psychologists who recognise that stress causes pathological onset [1] i.e. exposure to stress, by magnitude or longevity, influences the stable and coherent function of the physiological systems.
- Cognitive psychologists have recognised that changes of sense perception, in particular of colour perception, have pathological significance [2,3].
- Neurologists increasingly recognise that there is a link between pathological onset and the EEG frequencies i.e. the synchronous and coordinated operation of the brain [4]. Although the link is recognised it remains experiential i.e. the fundamental relationship remains poorly defined * (see Note 1).
- Sports physiologists recognise that the brain continuously regulates and adjusts the stable and coherent function of the body systems [5]. Accordingly ‘what are the nature of these physiological systems? [6]’ and ‘why is this so significant? [7,8]?’
That there is a feedback mechanism from the visceral organs to the brain is the fundamental basis for modern medicine and/or pharmaceutics (see figure 1) and, in particular the delivery of psychotropic substances to the brain. It also serves to explain how the various acupuncture modalities stimulate the network of acupuncture points/meridians, release endorphins which, in turn, and influence the coherent function of the neural components in the brain.
*Note 1: the author is CEO of Mimex Montague Healthcare: a company devoted to the commercialisation of the first technology (Strannik) to be based upon a precise and sophisticated mathematical model of how the brain regulates the autonomic nervous system and physiological systems.
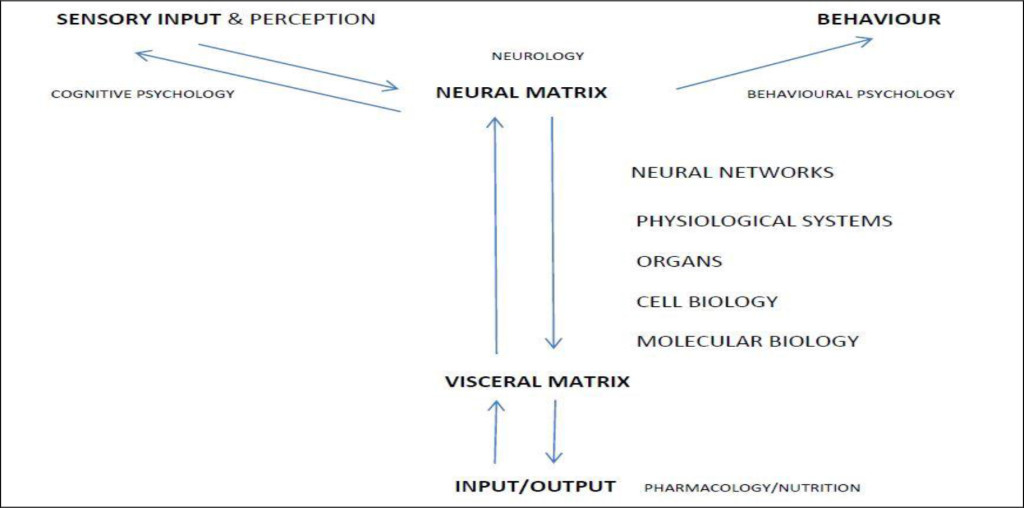
Figure 1. The Structural Nature of the Autonomic Nervous System
The problem faced by biomedicine is that it has developed a range of experientially derived markers in order to characterize various medical conditions e.g. the measurement of HbA1c, LDL and/or HDL cholesterol, etc; however such markers are the consequence of autonomic dysfunction and the failure of the brain to regulate the coherent function of the autonomic nervous system and physiological systems; and are often convenient compromises which contrast with the basic pathological processes involving (i) the rate of expression of particular proteins arising from the coherent function of a number of genes (genotype); and (ii) the rate at which the expressed protein in its reactive coiled form reacts with its reactive substrate (phenotype/the stress response). In addition, medicine has characterized the stress response – deviations from homeostasis of the autonomic nervous system – as the sympathetic nervous system and as the parasympathetic nervous system; and has also embraced genetic screening. Both are entirely logical and useful observations if considered fully i.e. the autonomic nervous system covers how the brain reacts to stress and alters normal biological processes with subsequent onset of changes to cellular and molecular biology i.e. pathological onset; however the focus upon genetics covers only an estimated 5–10% of pathological onset whereas phenotype (lifestyle/environment/the stress response) – upon which biomedicine is based – is responsible for the remaining 90–95% of pathological onset.
Biomedicine is completely dependent upon understanding, manipulating, and masking and/or otherwise modulating the function of the autonomic nervous system i.e. with the exception of antibiotics it often treats the physiological consequences of autonomic dysfunction rather than its cause(s). See Figure 1.
Behavioural psychologists have recognised that a person’s behavioural characteristics are influenced by their genetic profile [9]. If so, it follows that their behavioural, psychological and/or psychoemotional profile(s) must also be influenced by pathological onset i.e. their genotype AND phenotype (see figure 1). It follows therefore that the administration of drugs must materially influence how a person functions, thinks, etc. This has been referred to and/or variously recognized as their rationality and emotionality [10].
Various types of behaviours have been linked to genetically expressed proteins and hormones e.g. leptin, insulin and ghrelin are associated with feelings of appetite, hunger and satedness; therefore the extent of these behaviours must be associated with the rate of genetic expression of the particular protein or hormone (genotype) which is responsible for the particular behaviour and/or the rate at which the protein or hormone subsequently reacts with its reactive substrate(s) (the stress response/phenotype) [11]. This blurs the conventional distinction between the function of the brain and the function of the body/visceral organs i.e. both function in a biodynamic relationship.
Moreover, that genotype and phenotype are components in cells and organs in physiological systems which perform a physiological function illustrates how pathological onset must to some extent influences particular functions and associated thought patterns. For example emergent pathologies in any of the organs in the system which regulates sleep e.g. the brain, spinal cord [12], ears [13], nose [14], adrenal and thyroid glands; will influence the quality and quantity of sleep.
In addition, one person’s behaviour (sensory output) can be another person’s stress (sensory input) [15].
If we do not have good quality, or sufficient, sleep this may often disrupt our feelings of appetite, hunger and satedness to the extent that we become overweight or obese which influences our speed of action i.e. our vitality, function, and ultimately the state of our physiological and mental health. There is a biodynamic and structural relationship between the function of the brain, the senses [16–18] and molecular biology in which the brain regulates the coherent function of the organ networks which subsequently results in both genetic and phenotypic changes; and that emergent genetic and/or phenotypic changes influence brain function (which explains how psychotropic drugs influence brain chemistry and often results in changes of systemic stability e.g. of blood glucose levels, weight gain, etc). On the one hand, stress [1] influences how the brain regulates the body’s function and results in pathological onset (phenotype) and; on the other hand, how pathological and biological changes, perhaps introduced by gene-altering moieties, influence brain function.
In the case of diabetes, pathological onset in a wide range of physiological systems e.g. sleep [19], sexual function, pH [20], blood pressure [21], blood volume; each of which contributes to instability in the system which maintains optimal blood glucose levels [22]; and of pathological onset in the pancreas but also in the adrenal [23], pituitary [24], and thyroid glands [25]; kidneys [26], liver [27], small intestine [28], brain [28], and sexual organs [29]; influences blood glucose levels and thereby contributes to the onset of what is commonly known as diabetes mellitus. This supports the earlier observation that the regulation of blood glucoseis that of a neurally regulated physiological system which incorporates the maintenance of plasma pH at typically 7.35–7.45 [30], and the optimisation of blood glucose levels within normal regulated parameters of indicatively 4–8 mmol/litre.
The issue is further complicated by considering whether diabetes has genetic origins (type 1) or non- genetic origins (type 2) or a combination of both genotype and phenotype ** (See Note 2) i.e. which if misdiagnosed will influence the selection of therapeutic approach [31].
**Note 2: reduced expression of protein (genotype) is effectively a measure of physiological capacity whilst reduced protein reactivity (phenotype) is effectively a measure of psychophysiological demand i.e. the body becomes progressively less able to function if the level of psychophysiological demand exceeds the supply of a particular component. Every medical condition must therefore, to some extent, comprise a combination of genotype and phenotype.
Accordingly, the diagnosis and measurement of diabetes and diabetic comorbidities should determine whether pathological onset in any of these and/or other systems and organs materially contributes to unstable or abnormal blood glucose levels [32].
This raises a number of issues regarding the etiology of diabetes, the techniques used to measure diabetes, and the effectiveness of drugs used to treat diabetes. Furthermore, the onset of Diabetes is often accompanied by various comorbidities including depression [33–35], cardiovascular pathologies [36–39], kidney disease, cancer(s) [40], etc.
Current diagnostic methods are unable to precisely determine the onset of pre-diabetes, to determine the fundamental causal factors which are responsible for the onset of diabetes. They measure blood glucose levels – effectively seeking to establish how effectively the brain is regulating the level of the physiological system blood glucose i.e. they consider blood glucose as a molecular marker rather than a measure of systemic stability [21] and that type 1 and type 2 diabetes are separate conditions when both exist as comorbidities – which can often lead to misdiagnosis [41]; and there are no current tests (see Note 1) which are able to define, in significant detail, the complex correlates of what is now considered to be type 3 diabetes [42] yet which is the onset of the complex multi-systemic progression of the chronic condition [43,44].
The tests used to diagnose diabetes have significant limitations [41–49] e.g. blood glucose test results can vary according to sample storage temperature; exposure of samples to sunlight, pH; levels of Haemoglobin (in most situations the test is based upon the observation that only 60–80% of the available Hb is glycated); HbA1c test results may be ca 40% irreproducible after one month [42]; whilst the accuracy of the test is poor in hypoglycaemia e.g. the true frequency of hypoglycaemia is often difficult to determine [43]; and increases with hyperglycaemia.
Erroneous results are associated with a wide range of factors e.g. opiate addiction, alcoholism; levels of iron, vitamin B9 (folate), B12, C and E; medications e.g. dapsone, antiretrovirals, methylene blue, phenacetin, nitrites, salicylates, etc; and a range of medical conditions including liver disease, splenectomy, hysterectomy, rheumatoid arthritis, lymphocytic leukaemia, haemolysis, hyperbilirubinaemia, hypertriglyceridaemia, haemodialysis, etc. If taken to its logical and exhaustive conclusion i.e. checking patients for such issues, this leads to a situation of enormous complexity and cost.
The Limited Success of Diabetes tests and Drugs
It is an inescapable observation that the incidence of diabetes continues to increase throughout the world. In 2005 333 million persons were recorded with diabetes and by 2015 this had increased to 435million.
Medicine evolved over hundreds of years during which many different techniques have been used to treat the patient, sometimes with disastrous outcomes. It is an experiential paradigm. By the 19th and early 20th centuries modern medicine i.e. the doctor’s physical examination and/or consultation, was based upon a rudimentary understanding of the physiological systems. Indeed it remains the case that the doctor will often seek in his consultation to establish the stability or otherwise of the patient’s physiological systems in their forensic efforts to establish what ails the patient e.g. by measuring body temperature, pH of their urine, whether the patient’s excrement is well formed, whether the patient’s posture is satisfactory, their blood pressure, blood glucose, heart rate, temperature, etc.
By the early-mid 20th century the advent of biomedicine originated out of the realisation that drugs could be delivered which could eradicate a bacterial infection, that insulin could be used to treat diabetes, that some herbal medicines had medicinal properties, etc. This has led to the proliferation of biomedical test methods which, it is assumed, can be used to characterise the patient’s health and hence select an appropriate drug treatment. Such an observation assumes that the measured parameters are the cause of the condition – it follows the precedent set re bacterial infection and antibiotics – however research conducted in the late 20th and early 21st century have questioned the fundamental basis of this assumption e.g. (i) If someone is stressed as a result of a bereavement the symptoms arising from the stress are merely the consequence of this problem, not its cause. The symptoms will recede when the stress is managed by the patient. (ii) If someone eats and drinks too much of the wrong things and becomes diabetic and obese ‘why do we think that giving a drug will stop them being diabetic or obese?’ Becoming diabetic and/or obese is the consequence of eating and drinking too many of the wrong things. If we give a drug to treat diabetes and/or obesity this will have very little effect upon their health and will merely delay the date when more significant, invasive and costly interventions are required unless the patient reduces their calorific intake. The biomedical consequences of the problem have been widely researched however the neurological origins of the problem remain poorly researched.
Moreover the steadily increasing numbers of diabetic and obese patients, despite the immense amounts of medications which have been administered over the last 25–50 years, have done little to address the problem [50–53]
“there is no conclusive evidence that improved glucose control with oral agents leads to a decrease in the complications of type 2 diabetes.[53]”
If diabetes and the occurrence of diabetic comorbidities and complications continues to escalate, as is clearly the case, it appears reasonable to question the effectiveness of diabetes medications i.e. (i) Are diabetes medications merely masking the incidence of diabetes? (ii) What are the numbers and/or % of patients being successfully treated by medications i.e. who are no longer considered to be diabetic? (iii) Are diabetes medications merely masking diabetes until the emergence of diabetic comorbidities of ever greater complexity and cost? and (iv) What are the fundamental issues responsible for the ever-increasing levels of diabetes? Is it due to calorific control i.e. the balance between calorific intake and energy expenditure, as most people now recognise?
Perhaps the issues are most glaringly exposed by recognising the limitations of the biomedical tests which are used to diagnose a particular medical condition and which lead to claims of misdiagnosis; the adverse use of drugs which lead to claims of misprescribing; and more generally the limitations of biomedicine and healthcare; arising from inadequate etiology of many medical conditions due to the rigid adherence to the reductionist principles upon which the biomedical paradigm is slavishly based e.g.
- The idea that one gene produces one protein – upon which the genetic paradigm was originally based – is a discredited concept. In most cases many genes cooperate in the expression of a particular protein. There are few, if any, examples whereby only one gene is responsible for the expression of a single protein.
- That the chemical structure of the genes explains the expression of a particular protein. Replacing a gene by gene editing techniques often has very low levels of success therefore a broader phenomenon, including gene morphology, has to be taken into account [54].
- That a particular protein reacts with another protein or substrate ignores the complex range of factors which influence this process and determine the rate at which this reaction proceeds e.g. pH, levels of essential minerals, the coiled or uncoiled nature of proteins [32], and their reactive substrates, etc;
- That the body’s inorganic chemistry is largely ignored in favour of considering mainly its biology [55] yet the prevailing levels of essential minerals clearly influence genetic expression, the rate at which coiled proteins react with their reactive substrates, metabolic rate;
- That the body’s function proceeds independently of the brain, upon which biomedicine is based, is now recognised to have significant limitations [7]. The brain functions as a neuromodulator.
- The significance of the body’s physiological systems [56] i.e. of body temperature, osmotic pressure, rate of blood circulation, blood viscosity; influence the body’s function;
- How stress – either as a psychological or psychophysiological phenomena – adversely influences the body’s function [57] and, in particular, autonomic stability;
- The influence of protein coiling/uncoiling [58] and/or the photostimulating effect of light [59] i.e. proteins are visually active. Light provides the energy which raises proteins to their reactive state and enables the protein to react with its reactive substrate.
Consequently, irrespective of the cause(s), the health services are faced with an epidemic of diabesity which is resulting in ever greater demand for the most expensive interventions i.e. cancer treatments [60], cardiac interventions, bariatric surgery, prostate cancer interventions [61–62], etc.
Metformin is Eliminated Unmetabolised
The most commonly prescribed anti-diabetes medication is metformin yet it is eliminated from the body almost completely unmetabolised. It is the most widely prescribed medication for diabetes yet the evidence to support its use is elusive [63] and suggests that it is not a drug. Indeed, if it were a drug it would be metabolised! Despite this observation various novel and elegant pathways have been proposed [64,65]. Nevertheless the generally accepted mechanism of metformin’s effect is that it stimulates Adenosine Monophosphate (AMP)-Activated Protein Kinase (AMPK) i.e. AMPK is directly activated by an increase in AMP:ATP ratio in metabolic stress conditions including hypoxia and glucose deprivation.
Drugs depend upon the autonomic nervous system for their effect therefore understanding how the autonomic nervous system functions and, in particular, is regulated will lead to a greater understanding of diabetes and thereby explain how metformin influences the function of the autonomic nervous system by a mechanism which does not ‘directly’ act upon the function of the autonomic nervous system and, in particular, its biology.
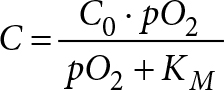
The body is regulated to function at a plasma pH of 7.35–7.45 however this applies mainly to the adult population, and less to young children, the elderly, and/or many who have chronic autonomic dysfunction. Irrespective, maintenance of pH is one of the body’s essential functions [20] and is carried out by a network of organs, a physiological system, involving the coherent function of the brain, pituitary gland, thyroid gland, adrenal glands, liver, pancreas, blood and peripheral blood vessels, lungs and bronchi, skin, stomach, duodenum, small Intestine, large Intestine, kidneys.
Accordingly, deviations from optimal pH are indicative of the stress response commonly known as the sympathetic nervous system.
Long-term or large magnitude exposure to conditions which elevate the sympathetic nervous system e.g. to psychological or psychophysiological stress; leads to the situation whereby the brain often considers the elevated state, of autonomic dysfunction, to be the stable ‘chronic’ state. It is an acidifying process which lowers plasma pH [20]. So too is excess weight – the weight being largely comprised body fat (the accumulation of fatty ‘acids’ e.g. triglycerides, glycated proteins, etc). As we age we become physically less active and less able to eliminate CO2 (which binds with water to form carbonic acid).
We consume carbonated and acidified (often acidified with phosphoric acid) beverages, and alcoholic beverages which are, directly or indirectly, acidifying; demineralise the body of essential minerals; and influence the metabolic rate of all body systems. These are some of the fundamental factors which influence the stable function of the autonomic nervous system and are ultimately expressed as a plethora of lifestyle-related pathologies.
This is significant because Metformin appears to exhibit the characteristics of a biological buffer or secretagogue i.e. a chemical which ‘secretly’ influences metabolic processes.
It is a biguanide with the chemical structure (CH3)2–N–C(=NH)–NH–C(=NH)–NH2
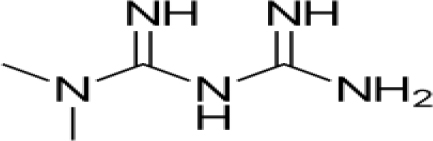
Metformin is not metabolised in the liver, does not bind to proteins to any significant extent, is eliminated in urine in an almost completely unmetabolised form [66] and has a pKa value of 12.33 [67]. The pH of a 1% aqueous solution of metformin hydrochloride is 6.68 therefore the pH of an 0.1% solution can be expected to be more typically in the range 6.9–7.1.
By contrast other diabetes medications e.g.
Glimepiride
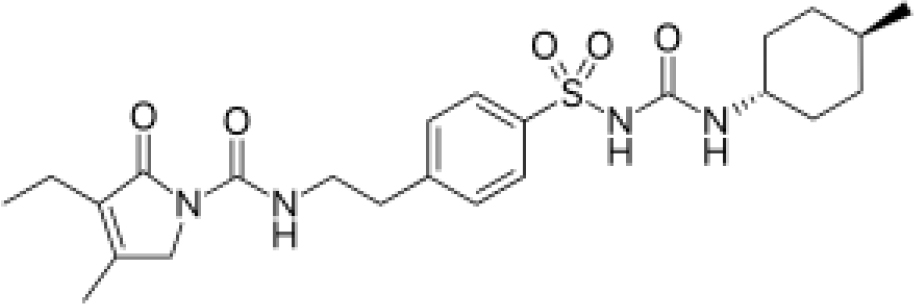
Glibenclamide
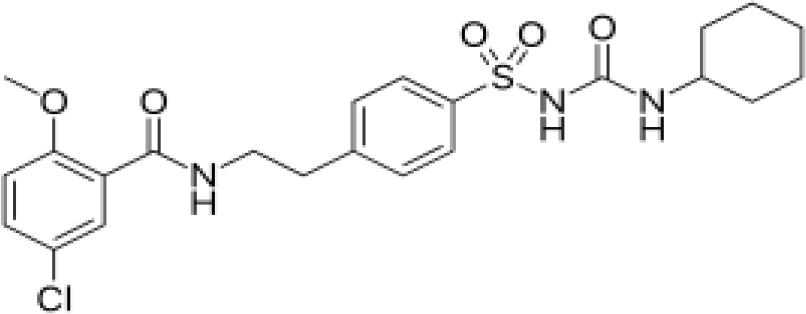
Glipizide
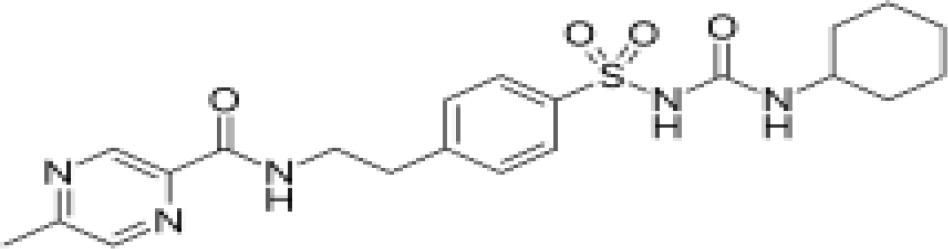
Gliclazide
are extensively bound to proteins and metabolised in the liver. It is considered that they stimulate the production of insulin, which reduces plasma levels of blood glucose, and enhances insulin reactivity [68]; however sulphonyl urea drugs are ineffective on patients with type 1 diabetes. If so the main effect is more likely to be to enhance the reactivity of insulin, perhaps by elevating pH and/or enhancing the levels of coiled reactive insulin [69,70] i.e. reducing insulin-resistance; rather than stimulating the expression of insulin.
Note 3: insulin is a polar substance which is characterised by –COOH and –NH2 groups. Accordingly it’s structure and function is pH dependent. At neutral pH it is a coiled protein however the degree of coiling starts to change as pH declines.
One report highlighted that there was no conclusive evidence of efficacy of this new generation of anti-diabetes medications [71] and questioned the focus of metformin upon the management of blood glucose levels whilst another [72] indicated, paradoxically, that all of the drugs were equally good at lowering glucose and were better than diet alone; but that despite lowering blood glucose levels the patient’s weight increased (typically – over the study period – a 5kg weight gain with sulphonyl ureas, a 7kgs weight gain with insulin, and a 1 kg weight gain with metformin) which is quite extraordinary when considering that >90% of type 2 diabetes is considered to be due to excess weight and that the use of metformin is to assist patients to manage their blood glucose levels and their weight.
The most widely accepted explanation is that sulphonyl ureas bind to ATP-sensitive K (Katp) channels which has the effect of preventing the departure of potassium, opening calcium channels, which leads to increased secretion of insulin. Moreover the ratio of ATP to ADP is a Magnesium dependent reaction [73,74], and levels of Mg are largely pH dependent, therefore the ratio of ATP to ADP must also be pH dependent.
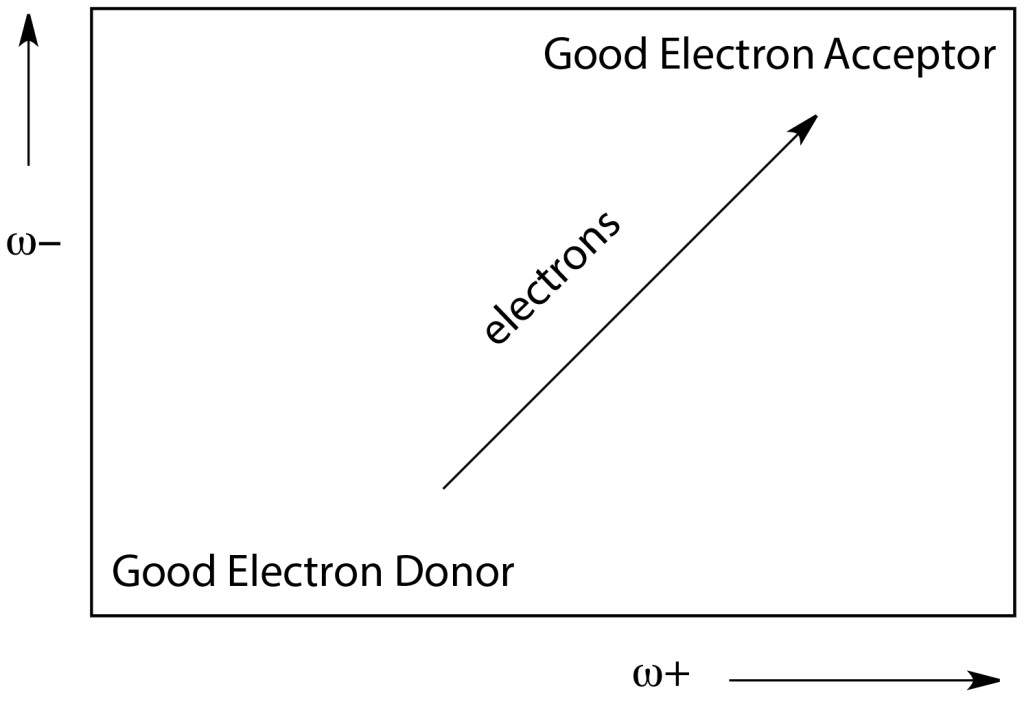
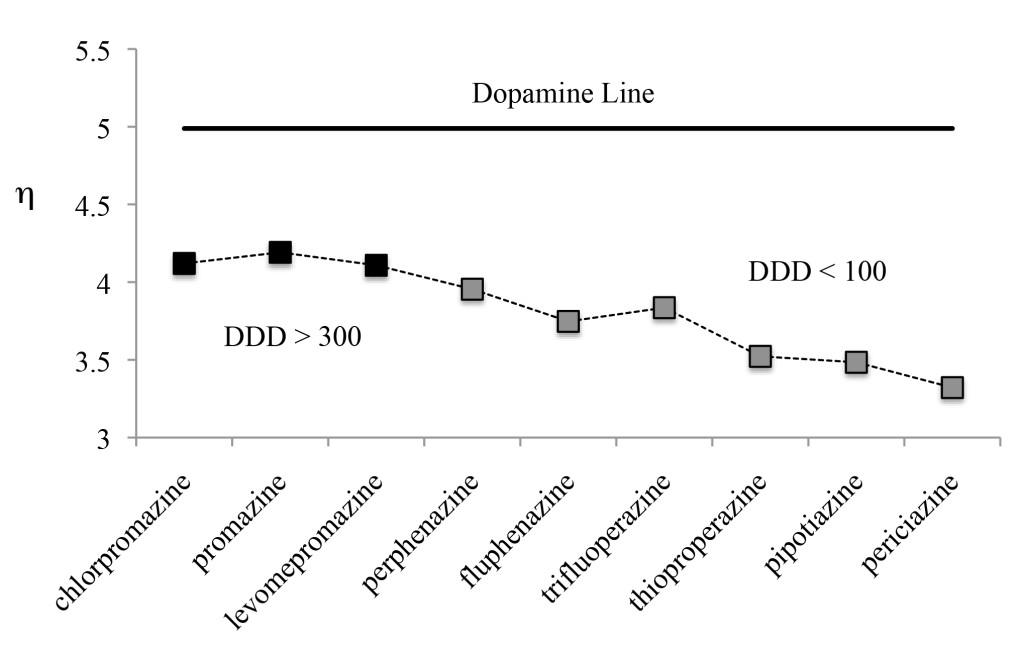
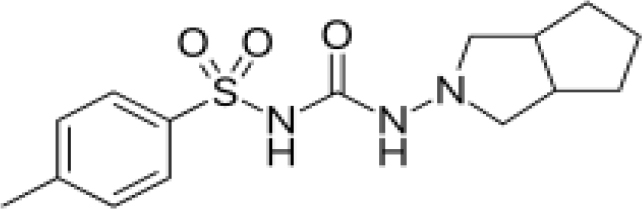
These diabetes medications exhibit a minor structural similarity to biological buffers [75] which exert a buffering effect upon biological systems however with metformin this structural similarity is most striking. The idea that metformin functions as a buffer is intriguing. It is a very stable molecule in which there is a core with delocalised electrons across five nitrogen atoms whereas the sulphonyl ureas have a core -C6H4-SO2-NH-CO-NH- structure which is intrinsically more reactive. This is intriguing because [68] some researchers argue that the levels of the sulphonyl urea, glibenclamide, are too low to explain the drug’s effect. Is it conceivable therefore that such drugs have a mild buffering effect before being metabolised and binding to ATP-sensitive K (Katp) channels?
The body is buffered by three individual buffers: the carbonic Acid/bicarbonate buffer exuded by the pancreas into the duodenum which maintains pH at levels which maintain the bioavailability of Zn (also Magnesium, Calcium and Chromium) and hence facilitates the release of CO2 by carbonic anhydrase in the lungs and bronchii, and neutralises excess stomach acidity, thereby ensuring appropriate digestive motility in the intestines; the phosphate buffer system which neutralises excess alkalinity in the intercellular environment; and the protein buffer system which helps to neutralise intercellular acidity. Each acts upon different species and thereby influences the normal regulated level of plasma pH. Accordingly, it is entirely plausible that various drugs have a mild and temporary buffering effect (until metabolised) due to their unique chemistry which, for example, influences the levels of microbiotic species in the intestines [76]. Moreover several chemotherapy drugs are co-administered with Sodium Bicarbonate [77] – which is also used to treat severe ketoacidosis [78–80]. If so, how much of the effect of the drug is actually due to the effect of the bicarbonate?
There has been a heated debate over this issue for decades since the publication of texts promoting the use of sodium bicarbonate as a therapeutic modality yet the body eliminates acidity via the kidneys and urine [81–83], skin [84], lungs and saliva. Excess acidity is associated with obesity/excess body fat, metabolic syndrome, the consumption of alcoholic and acidic beverages, stress, etc. To illustrate the point: urine with acidity <5.5 is often encountered in type 2 diabetes patients [81–83]. See Note 4.
Note 4: pH is used as a measure of the hydrogen ion concentration. pH= -log10[H]. It should be noted that pH7 is equivalent to zero hydrogen ion concentration; pH6 is therefore equivalent to 10, and pH5 to 100. Accordingly the use of pH – by 1unit – can overlook the actual increase of acidity and its biochemical significance. That the body favours a pH of 7.35–7.45 illustrates that it prefers a low level of hydroxyl ion concentration i.e. that hydrogen ion concentrations are inherently pathological.
Metformin exists as hydrophilic cationic species at physiological pH whereas sulphonylurea drugs are insoluble anionic species. The pKa of 11.5 (and 2.8) makes metformin a stronger base than many other drugs [see Table 1], which conceivably explains why lactic acidosis occasionally occurs after the administration of metformin, and is characterised by decreased plasma pH, associated electrolyte disturbances, etc [85]. It does not stimulate insulin secretion, or cause hypoglycemia or hyperinsulinemia which are common side effects associated with other antidiabetic drugs [86]. It increases glucose metabolism, increases insulin reactivity/signaling, decreases fatty acid and triglyceride synthesis, and increases fatty acid metabolism. It may also increase glucose metabolism in peripheral tissues [87], reduce appetite, and reduce glucose absorption in the intestines. If taken with alcohol, or a sulphonylurea, metformin could trigger a ‘hypo’glycaemic event.
Table 1. pKa values of Common Diabetes Medications Acidic Basic
|
|
Acidic
|
Basic
|
References
|
|
Metformin
|
11.5
|
2.8
|
https://www.drugbank.ca/drugs/DB00331[67]
|
|
Glibenclamide
|
4.32
|
-1.20
|
https://www.drugbank.ca/drugs/DB01016
|
|
Glimepiride
|
2.23
|
-0.36
|
https://www.drugbank.ca/drugs/DB00222
|
|
Glipizide
|
4.32
|
-0.059
|
https://www.drugbank.ca/drugs/ DB01067
|
|
Gliclazide
|
4.07
|
1.38
|
https://www.drugbank.ca/drugs/DB01120
|
If, as outlined in this paper, metformin acts as a buffer which influences plasma pH, typically in the range of 6.9–7.1*, it can be expected to have a differential effect between the normally functioning and healthy patient, in particular between the pre-diabetic patient, the typical type-2 diabetic, and the heavily type 2 diabetic and/or obese patient i.e. with patients who have levels of plasma acidity which is above or below the pH of metformin.
It is not possible to give clear delineations between diabetic patients. The precise level of plasma pH which accompanies their diabetes differs for many reasons e.g. the amount of food consumed, the nature of the food consumed, the level of daily exercise, what they drink, how much they drink, their exposure to stress, etc. Figure 2 is meant only to illustrate the point raised in the text i.e. that metformin can reasonably be expected to worsen type 2 diabetes in the prediabetic and improve the management of diabetes in the severely diabetic and obese patient but also that metformin does not, and cannot, relieve a patient of their diabetes and hence should not therefore be considered to be a long-term solution.
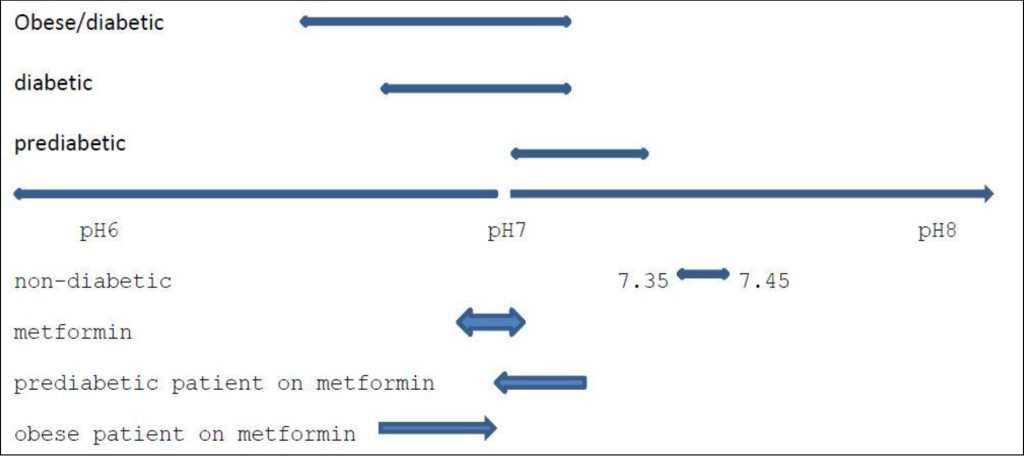
Figure 2. Prevailing levels of pH in the Diabetic patient/expected influence of Metformin
There is increasing interest in the use of metformin, a drug commonly used to lower blood glucose levels and treat diabetes, as a drug for the treatment of heart disease [88,89] e.g. to lower systolic BP in prediabetic and obese patients, cancer [90–93], and immunoregulation; improve the management of PCOS [94], depression [95], schizophrenia [96], dementia and the anti-aging process, suicide and alcohol-related matters; yet despite its widespread use – it is the major drug for the treatment of type 2 diabetes – the etiology of this drug remains poorly defined.
Metformin worsens the occurrence of prostate cancer [97] yet improves outcomes in colorectal cancer [98]. This is intriguing because if, as stated earlier, metformin buffers plasma at an estimated pH of 6.9–7.1 it stimulates the stress response i.e. the sympathetic nervous system, and thereby contributes to pathological onset in the pre-diabetic patient but lessens the stress response in the diabetic [99] and in diabetic comorbidities including cancer [40,100–102].
Discussion
The etiology of metformin appears to be marked by contradictions which are difficult to explain if metformin is considered to be a drug which acts upon a specific pathological process; however metformin has numerous applications which illustrates that it has a broad spectrum of activity, more typical of a systemic level intervention rather than as a solely biological intervention i.e. as a biological buffer regulating pH, rather than that of a drug.
As illustrated in the earlier research metformin does not stimulate insulin secretion or cause hypoglycaemia or hyperinsulinemia [88]. It reduces glucose levels by increasing the activity of insulin [87], reduces the absorption of glucose from the intestines, and reduces the glycation of plasma proteins. Such observations are consistent with metformin’s mode of action as a biological buffer and with pH being a neurally regulated physiological system which regulates plasma acidity at a normally regulated pH (indicatively 7.35–7.45 in the adult male) and which is adversely influenced by pathological onset which alters brain function, the stable and coherent function of the physiological systems, and subsequently the normal regulated function of the organs in each physiological system, and the cellular and molecular processes therein which are manifest as inflammatory processes [103]. This conceivably explains the often contradictory observations associated with metformin i.e. how it can be effective in one set of patients and yet by ineffective or damaging to another subset of patients. One subset has a higher level of intercellular acidity whilst the other subset has a lower level of intercellular acidity.
Metformin stabilises plasma acidity at indicatively 6.9–7.1 so (i) for patients with pre-diabetes and plasma acidity in the range 6.9–7.1 to 7.35–7.45 the administration of metformin enhances their predisposition to diabetes i.e. instead of being prediabetic they can be expected to develop the symptoms of diabetes; (ii) for patients with plasma pH indicatively 6.9–7.1 there is likely to be little effect; however (iii) for patients with much greater levels of diabetes i.e. plasma acidity below pH 6.9, which are characterised by high levels of diabetes markers e.g. blood glucose and HbA1c levels, their prevailing level of plasma pH will be increased to circa 6.9–7.1 and they can be expected to exhibit lower levels of diabetes markers e.g. blood glucose, HbA1c. Their insulin resistance (and also leptin resistance and ghrelin resistance) [32] will decline and they will have more normal appetite and satedness, and be less hungry.
This highlights the need for a more complete and rigorous scientific understanding of how the body regulates its functions [103] which can be applied to improve the quality of healthcare and thereby reduce misdiagnoses, misprescribing of drugs, unnecessary prescribing of drugs, etc. Indeed this limited understanding leads to a wide range of misconceptions e.g. which lead to the use of anti- depressants and induce weight gain [104]; which reduce heart rate in order to reduce blood pressure but subsequently have the knock-on effect of effectively reducing metabolic rate and leads to the effect which the drug was intended to prevent – weight-gain [105, 106] and the onset of diabetic comorbidities, in particular cardiovascular disease(s); the use of bariatric surgery and complications which arise therefrom [107, 108]; the occurrence of cancer [109], etc.
Acknowledgement
The author recognises the contribution of the many researchers who through their research have made this article possible, in particular Dr Igor Gennadyevich Grakov, developer of the Strannik technology; and encouragement by Dr Syed Hasan Parvez, Professor Paolo Pozzilli, Professor Shahidul Islam and others.
Abbreviations
EEG: Electroencephalograph, GP: General Practitioner, HbA1c: Glycated Haemoglobin.
References
- Ranabir S, Reetu K (2011) Stress and hormones. Indian J Endocrinol Metab 15: 18–22. [crossref]
- Ewing GW, Ewing EN (2008) Cognition, the Autonomic Nervous System and the Physiological Systems. Biogenic Amines 22: 140–163.
- Ewing GW, Parvez SH, Grakov IG (2011) Further Observations on Visual Perception: the influence of pathologies upon the absorption of light and emission of bioluminescence. The Open Systems Biology Journal 4: 1–7.
- Pinotsis DA, Buschman TJ, Miller EK. Working Memory Load Modulates Neuronal Coupling. Cerebral Cortex. Published March 28 2018.
- St Clair Gibson A, Swart J, Tucker R (2017) The interaction of psychological and physiological homeostatic drives and role of general control principles in the regulation of physiological systems, exercise and the fatigue process – The Integrative Governor theory. European Journal of Sport Science 18: 25–36.
- Ewing GW, Parvez SH (2008) Systemic Regulation of Metabolic Function. Biogenic Amines 22: 279–294.
- Ewing G (2016) What is the function of the Brain? What does it do and how does it do it? It functions as a Neuroregulator, which continuously regulates the Autonomic Nervous System and Physiological Systems, and enables us to Recognise that Sleep Exhibits the Characteristics of a Neurally Regulated Physiological System. J Neurol Psychol 4: 9.
- Marks AR (2008) Physiological systems under pressure. J Clin Invest 118: 411–412. [crossref]
- Hopwood CJ, Donnellan MB, Blonigen DM, Krueger RF, McGue M, et al. (2011) Genetic and environmental influences on personality trait stability and growth during the transition to adulthood: A three wave longitudinal study. J Pers Soc Psychol 100: 545–556.
- Kirman A, Livet P, Teschl M (2010) Rationality and emotions. Philos Trans R Soc Lond B Biol Sci 365: 215–219. [crossref]
- Pfaff DW (1997) Hormones, genes, and behavior. Proc Natl Acad Sci U S A 94: 14213–14216. [crossref]
- Castriotta RJ, Wilde MC, Sahay S (2012) Sleep Disorders in Spinal Cord Injury. Sleep Medicine Clinics 7: 643–653.
- Test T, Canfi A, Eyal A, Shoam-Vardi I, Sheiner EK (2011) The Influence of Hearing Impairment on Sleep Quality Among Workers Exposed to Harmful Noise. Sleep 34: 25–30.
- Park CY, Hong JH, Lee JH, Lee KE, Cho HS, Lim SJ, et al. (2014) Clinical Effect of Surgical Correction for Nasal Pathology on the Treatment of Obstructive Sleep Apnea Syndrome. PLoS ONE 9: 98765.
- Schneiderman N, Ironson G, Siegel SD (2005) STRESS AND HEALTH: Psychological, Behavioral, and Biological Determinants. Annu .Rev. Clin. Psychol 1:607–628.
- Riera CE, Tsaousidou E, Halloran J, Follett P, Hahn O, et al. (2017) The Sense of Smell Impacts Metabolic Health and Obesity. Cell Metab 26: 198–211. [crossref]
- Aguilera G, Subburaju S, Young S, Chen J (2008) The parvocellular vasopressinergic system and responsiveness of the hypothalamic pituitary adrenal axis during chronic stress. Prog. Brain Res 170:29–39.
- Neary NM, Goldstone AP, Bloom SR (2004) Appetite regulation: from the gut to the hypothalamus. Clin Endocrinol (Oxf) 60: 153–160. [crossref]
- Vetter C, Dashti HS et al. (2018) Night Shift Work, Genetic Risk, and Type 2 Diabetes in the UK Biobank. Diabetes Care 41: 762–769. [crossref]
- Ewing GW (2012) The Regulation of pH is a Physiological System. Increased Acidity alters Protein Conformation and Cell Morphology and is a Significant Factor in the onset of Diabetes and other common pathologies. The Open Systems Biology Journal5: 1–12.
- Ewing GW, Parvez SH (2011) Mathematical Modeling the Systemic Regulation of Blood Glucose: ‘a top- down’ Systems Biology Approach. NeuroEndocrine Letters 32: 371–379
- Ewing GW (2010) Mathematical Modeling the Neuroregulation of Blood Pressure using a Cognitive Top-down Approach. N.Am.J.Med.Sci 2: 341–352.
- Nestler JE, McClanahan MA (1992) Diabetes and adrenal disease. Baillieres Clin Endocrinol Metab 6: 829–847. [crossref]
- Lupi I, Raffaelli V, Di Cianni G, Caturegli P, Manetti L, et al (2013) Pituitary autoimmunity in patients with diabetes mellitus and other endocrine disorders. J.Endocrinol.Invest. 36: 127–31.
- Hage M, Zantout MS, Azar ST (2011) Thyroid disorders and diabetes mellitus. J Thyroid Res 2011: 439463. [crossref]
- Koppe L, Nyam E, Vivot K, Manning Fox JE, Dai X-Q, et al (2016) Urea impairs ß cell glycolysis and insulin secretion in chronic kidney disease. Journal of Clinical Investigation
- Blendea MC, Thomson MJ, Malkani S (2010) Diabetes and Chronic Liver Disease: Etiology and Pitfalls in Monitoring. Clinical Diabetes 28: 139–144
- Luo J, Manson JE, Urrutia RP, Hendryx M, LeBlanc ES, Margolis KL (2017) Risk of Diabetes After Hysterectomy With or Without Oophorectomy in Postmenopausal Women. Am. J. Epidemiol 185: 777–785.
- Feingold KR (1989) Importance of Small Intestine in Diabetic Hypercholesterolemia. Diabetes 38: 141–145.
- Marunaka Y (2015) Roles of interstitial fluid pH in diabetes mellitus: Glycolysis and mitochondrial function. World J. Diabetes. 6: 125–135.
- Mohd Nor NS, Jalaludin MY, Harun F (2013) Misdiagnosis of type 1 diabetes mellitus. Int.J.Pediatr.Endocrinol : 23.
- Ewing GW (2018) A Different Perspective on Diabetes & Obesity – what it is and how it can be measured. Case Reports in Clinical Medicine 7: 269–287
- Yu R, Y-Hua L, Hong L (2010) Depression in newly diagnosed type 2 diabetes. Int J Diabetes Dev Ctries 30: 102–104. [crossref]
- Badescu SV, Tataru C, Kobylinska L, Georgescu EL, Zahiu DM (2016) The association between Diabetes mellitus and Depression. J .Med. Life. 9: 120–125.
- Hare DL, Toukhsat SR, Johansson P, Jaarsma T (2014) Depression and cardiovascular disease: a clinical review. European Heart Journal 35: 1365–1372
- Dhar AK, Barton DA (2016) Depression and the Link with Cardiovascular Disease. Front Psychiatry 7: 33. [crossref]
- Wynn A (1967) Unwarranted emotional distress in men with ischaemic heart disease (IHD). Med J Aust 2: 847–851. [crossref]
- Ritchie SA, Connell JM (2007) The link between abdominal obesity, metabolic syndrome and cardiovascular disease. Nutr. Metab. Cardiovasc. Dis. 17: 319–326.
- Giovannucci E, Michaud D (2007) The role of obesity and related metabolic disturbances in cancers of the colon, prostate, and pancreas. Gastroenterology 132: 2208–2225.
- Ewing GW (2013) The ‘Biology of Systems’ or the ‘Systems of Biology’: Looking at Diabetes from the Systemic Perspective. International Journal of Systems Biology 4: 45–56.
- Gooderick D, Dashora U, Kumar S (2011) Ketoacidosis in type 2 diabetes–is it type 1 and 1/2 diabetes? BMJ Case Rep 2011. [crossref]
- McDonald TJ, Warren R (2014) Diagnostic confusion? Repeat HbA1c for the diagnosis of diabetes. Diabetes Care 37: e135–136. [crossref]
- Elliott L, Fidler C, Ditchfield A, Stissing T (2016) Hypoglycemia Event Rates: A Comparison Between Real-World Data and Randomized Controlled Trial Populations in Insulin-Treated Diabetes. Diabetes Ther 7: 45–60.
- English E1, Idris I, Smith G, Dhatariya K, Kilpatrick ES, et al. (2015) The effect of anaemia and abnormalities of erythrocyte indices on HbA1c analysis: a systematic review. Diabetologia 58: 1409–1421. [crossref]
- Ewald N, Hardt PD (2013) Diagnosis and treatment of diabetes mellitus in chronic pancreatitis. World J Gastroenterol 19: 7276–7281. [crossref]
- Mayor S (2017) Type 3c diabetes associated with pancreatic disease is often misdiagnosed, finds study. British Medical Journal 359
- Ewing GW (2015) Case Study: the Determination a Complex Multi-Systemic Medical Condition by a Cognitive, Virtual Scanning Technique. Case Reports in Clinical Medicine 4: 209–221
- Ewing GW (2016) The Use of Strannik Virtual Scanning as a Modality for the Earliest Screening of the Pathological Correlates of Alzheimer’s Disease. Human Frontier Science Program (HFSP) Journal 10: 2–20
- Ewing GW (2013) A Comparison of the Diagnostic Scope of Biomarker techniques, Genetic Screening and Virtual Scanning. Immunology, Endocrine & Metabolic Agents in Medicinal Chemistry 13: 35–45.
- Klonoff DC (2009) The increasing incidence of diabetes in the 21st century. J Diabetes Sci Technol 3: 1–2. [crossref]
- Thibault V, Bélanger M, LeBlanc E, Babin L, Halpine S, et al (2016) Factors that could explain the increasing prevalence of type 2 diabetes among adults in a Canadian province: a critical review and analysis. Diabetol.Metab.Syndr 8:71.
- Ingelfinger JR, Jarcho JA (2017) Increase in the Incidence of Diabetes and Its Implications. N Engl J Med 376: 1473–1474. [crossref]
- Therapeutics Initiative (1998) Management of type 2 diabetes. Therapeutics Letter 23:1–4.
- Ewing GW (2017) The Interpretation of Genetic Data – Considering the Effect of Changes to Gene Conformation — If the facts don’t support the theory, change the theory – how does this contribute to understanding Diabetes? J.Genet. Disor. Genet. Rep 6: 1–4
- Seo JW1, Park TJ (2008) Magnesium metabolism. Electrolyte Blood Press 6: 86–95. [crossref]
- Bartsch RP, Liu KK, Bashan A, et al. (2015) Network Physiology: How Organ Systems Dynamically Interact. PLoS One 10: 142143. [crossref]
- Yaribeygi H, Panahi Y, Sahraei H, Johnston TP, Sahebkar A (2017) The impact of stress on body function: A review. EXCLI J 16: 1057–1072. [crossref]
- Ewing GW, Parvez SH, Grakov IG (2011) Further Observations on Visual Perception: the influence of pathologies upon the absorption of light and emission of bioluminescence. The Open Systems Biology Journal 4:1–7.
- Ewing GW (2009) A Theoretical Framework for Photosensitivity: Evidence of Systemic Regulation. Journal of Computer Science and System Biology 2: 287–297.
- Stattin P, Björ O, Ferrari P, Lukanova A, Lenner P, et al. (2007) Prospective study of hyperglycemia and cancer risk. Diabetes Care 30: 561–567. [crossref]
- Freedland SJ, Aronson WJ (2004) Examining the relationship between obesity and prostate cancer. Rev Urol 6: 73–81. [crossref]
- Parikesit D, Mochtar CA, Umbas R, Hamid AR (2016) The impact of obesity towards prostate diseases. Prostate Int 4: 1–6. [crossref]
- Jensen JB, Sundelin EI, Jakobsen S, Gormsen LC, Munk OL, et al (2016) 11C-Labeled Metformin Distribution in the Liver and Small Intestine Using Dynamic Positron Emission Tomography in Mice Demonstrates Tissue-Specific Transporter Dependency. Diabetes 65: 1724–1730.
- Hundal RS, Krssak M, Dufour S, Laurent D, Lebon V, et al (2000) Mechanism by which metformin reduces glucose production in type 2 diabetes. Diabetes 49: 2063–2069.
- Foretz M, Guigas B, Bertrand L, Pollak M, Viollet B (2014) Metformin: from mechanisms of action to therapies. Cell Metab 20: 953–966. [crossref]
- Pentikäinen PJ, Neuvonen PJ, Penttilä A (1979) Pharmacokinetics of metformin after intravenous and oral administration to man. Eur J Clin Pharmacol 16: 195–202. [crossref]
- https://www.drugbank.ca/drugs/DB00331
- Proks P, Reimann F, Green N, Gribble F, Ashcroft F (2002) Sulfonylurea stimulation of insulin secretion. Diabetes 51: 368–376.
- Gupta S, Chattopadhyay, Pal Singh M, Surolia A (2010) Supramolecular insulin assembly II for a sustained treatment of type 1 diabetes mellitus. PNAS 107: 13246–13251.
- Mukherjee A, Morales-Scheihing D, Butler PC, Soto C (2015) Type 2 diabetes as a protein misfolding disease. Trends Mol Med 21: 439–449. [crossref]
- (1998) Is the current ‘glucocentric’ approach to management of type 2 diabetes misguided? Therap.Letter; issue 23, Jan-Mar
- (1995) United Kingdom Prospective Diabetes Study (UKPDS). 13: Relative efficacy of randomly allocated diet, sulphonylurea, insulin, or metformin in patients with newly diagnosed non-insulin dependent diabetes followed for three years. BMJ 310: 83–88. [crossref]
- Gout E, Rébeillé F, Douce R, Bligny R (2014) Interplay of Mg2+, ADP, and ATP in the cytosol and mitochondria: unravelling the role of Mg2+ in cell respiration. Proc Natl Acad Sci U S A 111: 4560–4567. [crossref]
- Ko YH, Hong S, Pedersen PL (1999) Chemical mechanism of ATP synthase. Magnesium plays a pivotal role in formation of the transition state where ATP is synthesized from ADP and inorganic phosphate. J. Biol. Chem. 274:28853–28856.
- https://en.wikipedia.org/wiki/Good%27s_buffers.
- Rothschild D, Weissbrod O, Barkan E, et al. (2018) Environment dominates over host genetics in shaping human gut microbiota. Nature 555: 210–215. [crossref]
- Raghunand N, Gillies RJ (2001) pH and chemotherapy. Novartis Found Symp 240: 199–211. [crossref]
- Lever E, Jaspan JB (1983) Sodium bicarbonate therapy in severe diabetic ketoacidosis. The American Journal of Medicine 75: 263–268
- Rodríguez-Gutiérrez R, Cámara-Lemarroy CR, Quintanilla-Flores DL, González-Moreno EI, González-Chávez JM, et al (2015) Severe Ketoacidosis (pH = 6.9) in Type 2 Diabetes: More Frequent and Less Ominous Than Previously Thought. BioMed. Research International :5
- Green SM, Rothrock SG, Ho JD et al (1998) Failure of adjunctive bicarbonate to improve outcome in severe pediatric diabetic ketoacidosis. Annals of Emergency Medicine 31: 41–48.
- Otsuki M, Kitamura T, Goya K, Saito H, Mukai M, et al (2011) Association of urine acidification with visceral obesity and the metabolic syndrome. Endocr .J. 58: 363–367.
- Maalouf NM, Cameron MA, Moe OW, Sakhaee K (2010) Metabolic basis for low urine pH in type 2 diabetes. Clin J Am Soc Nephrol 5: 1277–1281. [crossref]
- Hashimoto Y, Hamaguchi M, Nakanishi N, Ohbora A, Kojima T et al (2017) Urinary pH is a predictor of diabetes in men; a population based large scale cohort study. J.Diabetes Research & Clinical Practice 130: 9–14.
- Mackiewicz-Wysocka M, Araszkiewicz A, Niedzwiedzki P, Schlaffke J, Micek I, et al (2015) Skin pH Is Lower in Type 1 Diabetes Subjects and Is Related to Glycemic Control of the Disease. Diabetes Technology & Therapeutics 17:
- Desai D, Wong B, Huang Y, Ye QM, Guo H (2015) Wetting Effects Versus Ion Pairs Diffusivity: Interactions of Anionic Surfactants with Highly Soluble Cationic Drugs and Its Impact on Tablet Dissolution. Journal of Pharmaceutical Sciences 104: 2255–2265.
- Gong L, Goswami S, Giacomini KM, Altman RB, Klein TE (2012) Metformin pathways: pharmacokinetics and pharmacodynamics. Pharmacogenet. Genomics 22: 820–827.
- Hayata H, Miyazaki H, Niisato N, Yokoyama N, Marunaka Y (2014) Lowered extracellular pH is involved in the pathogenesis of skeletal muscle insulin resistance. Biochem. Biophys. Res. Commun 445: 170–174.
- Zhou L, Liu H, Wen X, Peng Y, Tian Y (2017) Effects of metformin on blood pressure in nondiabetic patients: a meta-analysis of randomized controlled trials. J. Hypertens 35: 18- 26.
- Romero-Corral A, Montori VM, Somers VK, et al (2006) Association of bodyweight with total mortality and with cardiovascular events in coronary artery disease: a systematic review of cohort studies. Lancet 368: 666–678.
- Papanas N, Maltezos E, Mikhailidis DP (2010) Metformin and cancer: licence to heal? Expert Opin Investig Drugs 19: 913–917. [crossref]
- Tseng C-H (2011) Diabetes and Risk of Prostate Cancer. A study using the National Health Insurance. Diabetes Care 34: 616–621
- Hershcopf RJ, Bradlow HL (1987) Obesity, diet, endogenous estrogens, and the risk of hormone-sensitive cancer. Am J Clin Nutr 45: 283–289. [crossref]
- Berger NA (2014) Obesity and cancer pathogenesis. Ann N Y Acad Sci 1311: 57–76. [crossref]
- Lashen H (2010) Role of metformin in the management of polycystic ovary syndrome. Ther Adv Endocrinol Metab 1: 117–128. [crossref]
- Guo M, Mi J, Jiang QM, Xu JM, Tang YY, et al (2014) Metformin may produce antidepressant effects through improvement of cognitive function among depressed patients with diabetes mellitus. Clin. Exp. Pharmacol. Physiol 41: 650–656.
- Allison DB, Fontaine KR, Heo M, Mentore JL, Cappelleri JC, et al. (1999) The distribution of body mass index among individuals with and without schizophrenia. J Clin Psychiatry 60: 215–220. [crossref]
- Murtola TJ, Tammela TLJ, Määttänen L, Huhtala H, Platz EA, et al (2010) Prostate cancer and PSA among statin users in the Finnish prostate cancer screening trial. IJC 127: 1650–1659.
- Cima I, Kong SL, Sengupta D, Tan IB, Phyo WM, et al (2016) Tumor- Derived Circulating Endothelial Cell Clusters in Colorectal Cancer. Science Translational Medicine
- Saisho Y (2015) Metformin and Inflammation: Its Potential Beyond Glucose-lowering Effect. Endocr. Metab. Immune Disord. Drug Targets 15: 196–205.
- Cameron AR, Morrison VL, Levin D, Mohan M, Forteath C, et al (2016) Anti- Inflammatory Effects of Metformin Irrespective of Diabetes Status. Circ Res. 119: 652–665.
- Hirsch HA, Iliopoulos D, Struhl K (2013) Metformin inhibits the inflammatory response associated with cellular transformation and cancer stem cell growth. Proc. Natl. Acad. Sci. U S A. 110: 972–977.
- Le CP, Nowell CJ, Kim-Fuchs C, Hiller JG, Ismail H, et al (2016) Chronic stress remodels lymph vasculature for metastatic dissemination. Nature Communications 2016 7:10634.
- Piening BD, Zhou W, Contrepois K, Röst H, Gu Urban GJ, et al. (2018) Integrative Personal Omics Profiles during Periods of Weight Gain and Loss. Cell Syst 6: 157–170. [crossref]
- Deeny SR, Steventon A (2015) Making sense of the shadows: priorities for creating a learning healthcare system based on routinely collected data BMJ Qual.Saf. Published Online First: 10 June 2015.
- Gafoor R, Booth HP, Gulliford MC (2018) Antidepressant utilisation and incidence of weight gain during 10 years’ follow-up: population based cohort study. British Medical Journal 2018: 361
- Messerli FH, Bell DS, Fonseca V, Katholi RE, McGill JB, et al. (2007) Body weight changes with beta-blocker use: results from GEMINI. Am J Med 120: 610–615. [crossref]
- Schulman AR, Thompson CC (2017) Complications of Bariatric Surgery: What You Can Expect to See in Your GI Practice. Am J Gastroenterol 112: 1640–1655. [crossref]
- Ma IT, Madura JA (2015) Gastrointestinal Complications After Bariatric Surgery. Gastroenterol .Hepatol .(N Y). 11: 526–535.
- Swietach P, Vaughan-Jones RD, Harris AL, Hulikova A (2014) The chemistry, physiology and pathology of pH in cancer. Philos Trans R Soc Lond B Biol Sci 369: 20130099. [crossref]