Author Archives: rajani

The Past, Present, and Future of Pancreas Transplantation for Diabetes Mellitus

DOI: 10.31038/EDMJ.2018235

Introduction

Pancreas transplantation was initially developed as a means to re-establish endogenous insulin secretion responsive to normal feedback controls and has evolved over time to a form of auto-regulating total pancreatic endocrine replacement therapy that can reliably achieve a durable euglycemic state without the need for either exogenous insulin therapy or close glucose monitoring. Pancreas transplantation is performed in patients who require administration of insulin because of type 1 or, less commonly, insulin-requiring type 2 diabetes, or following total pancreatectomy for benign disease [1]. Pancreas transplantation entails a major surgical procedure and the necessity for long-term immunosuppression so it is not offered universally to all patients with insulin-requiring diabetes but is usually directed to those that will already be committed to chronic immunosuppression [most commonly for kidney transplantation secondary to end stage diabetic nephropathy) [1]. In addition, candidates with potentially life-threatening metabolic complications from diabetes such as hypoglycemia unawareness or those who are failures of exogenous insulin therapy may benefit from pancreas transplantation in the absence of a kidney transplant [2]. A successful pancreas transplant is currently the only definitive long-term treatment that restores normal glucose homeostasis in patients with complicated diabetes without the risk of either severe hypo/hyperglycemia and may prevent, stabilize, or reverse progressive diabetic complications [1–3].

The history of pancreas transplantation largely parallels advances in clinical immunosuppression and surgical techniques. As of December 2017, more than 56,000 pancreas transplants were reported to the International Pancreas Transplant Registry [IPTR) including >32,000 from the United States [US) and >24,000 from outside of the US [FIGURE 1). [3–6) Pancreas transplantation in diabetic patients is divided into 3 major categories; those performed simultaneously with a kidney [SPK) transplant, usually from a deceased donor; those performed after a successful kidney [PAK) transplant in which the kidney transplant was performed from either a living [most commonly) or deceased donor; and pancreas transplantation alone [PTA) in the complete absence of the need for a kidney transplant. The latter two [PAK and PTA) categories are usually combined together as solitary pancreas transplants because the transplant is performed in the absence of uremia. Historically, solitary [PAK and PTA) transplants have had similar albeit inferior outcomes compared to SPK transplantation. In the US, the majority [84%) of pancreas transplants are currently performed as SPK transplants whereas approximately 16% are performed as either PAK or PTA cases [FIGURE 2) [3–6].

PowerPoint Presentation

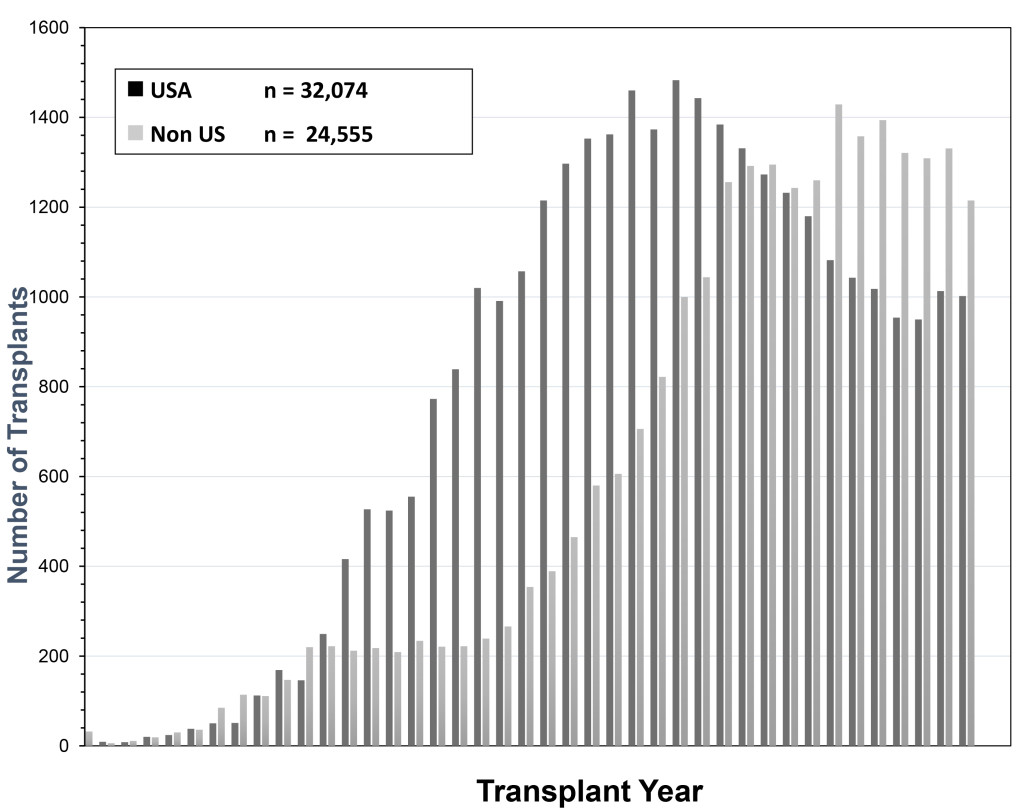
Figure 1. Total number of pancreas transplants performed in the US and outside of the US between 1966 and 2017 as reported by UNOS and the IPTR (at the time of analysis the reporting for non-US cases was not complete for the year 2017)

SPK transplantation has become a generally accepted treatment for uremic type 1 diabetes [1]. The evolution in surgical techniques, current patient management strategies, and advances in immunosuppression have resulted in excellent outcomes, even in populations previously considered high risk, such as patients older than 50 years, African-American recipients, patients with a “type 2 diabetes” phenotype, and solitary pancreas transplants recipients[1–11]. Insulin independence is sustained at 5 years in 77% of SPK and 60% of solitary pancreas transplant recipients [3–6]. For SPK transplant recipients with dual allograft function at one year, the conditional half-life of the pancreas graft currently averages 12–15 years, which is amongst the longest for extra-renal grafts
[FIGURE 3). [3–6, 12] Nearly all pancreas transplants are currently performed by one of three standardized techniques[1, 13–15]. Both technical and immunologic graft failure rates have decreased over time [3–6]. One of the most recent and exciting innovations in pancreas transplantation is the description of laparoscopic pancreas transplantation under robotic assistance [16, 17].

PowerPoint Presentation

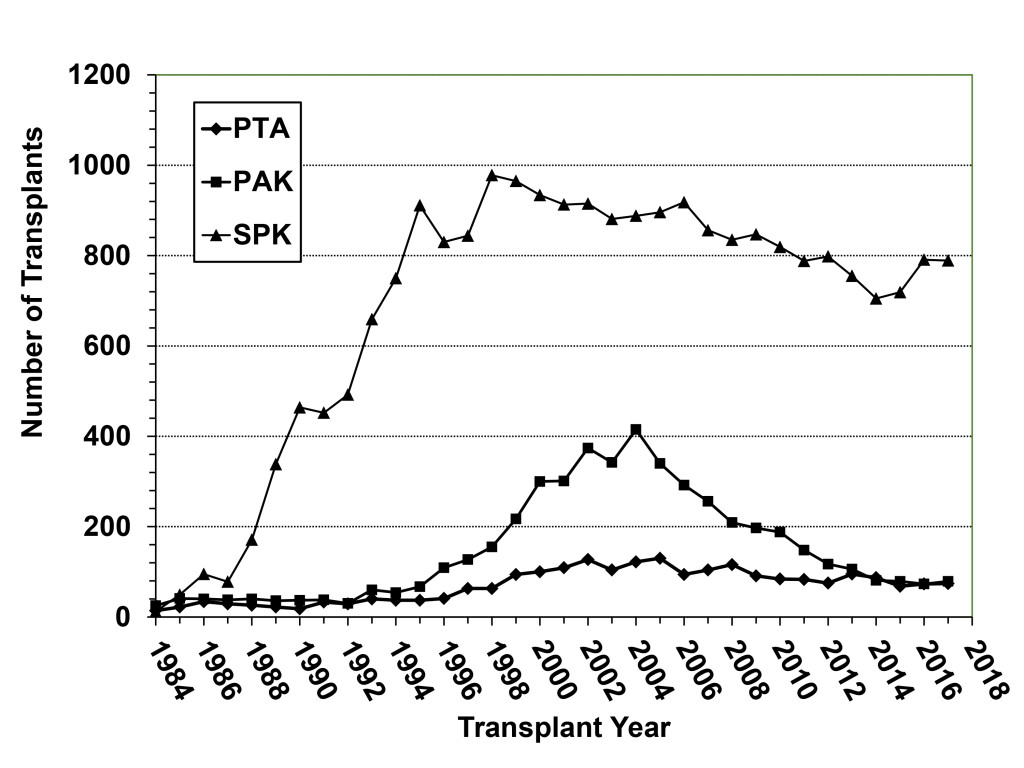
Figure 2. Annual number of pancreas transplant procedures in diabetic patients performed by transplant category in the US; the decline in SPK transplants began in 1999 whereas the number of solitary pancreas transplants (both PAK and PTA) started decreasing after 2004.

PowerPoint Presentation

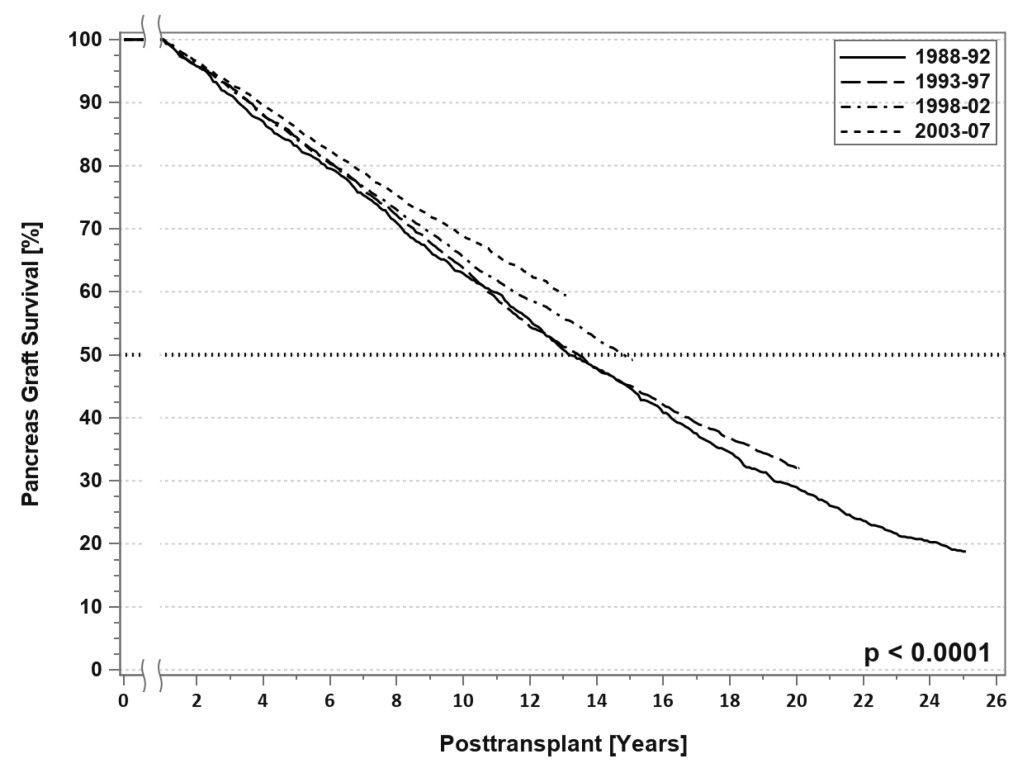
Figure 3. SPK conditional primary deceased donor pancreas graft survival for transplants performed between 1988 and 2007.

Pancreas transplantation in 2018 can be characterized by the “rule of 90s”; worldwide, 90% are SPK transplants, 90% are from conventional [young and low Body Mass Index [BMI] <30 kg/m2) donors, 90% are performed with enteric drainage, 90% have systemic venous drainage, 90% are managed with antibody induction, 90% receive initial tacrolimus or mycophenolate maintenance therapy, 90% of recipients are Caucasian, 90% have type 1 diabetes, 90% of recipients have a BMI <30 kg/m2, 90% have a panel reactive antibody level ≤20%, the 1-year graft survival rate for SPK transplants is 90%, and 5-year patient survival rates are 90% in all three recipient categories. [3–6] At the other end of the spectrum, there is the “rule of 30s”; 30% of patients are ≥ age 50 years , 30% undergo relaparotomy, 30% experience acute rejection, 30% of dual organ biopsies are discordant, 30% develop donor specific antibody, 30% remain steroid-free long-term, 30% of centers perform PTAs, 30% of centers performed more transplants in the most recent era [2010–2014) compared to the previous era [2005–2009), 30% of centers are very low volume centers [≤10 pancreas transplants in 5 years; Figure 4), 30% of SPK transplants in the US are performed by 12 large volume centers, and a 30% overall reduction in total pancreas transplants performed annually in the US occurred in the decade from 2005 to 2015 [Figure 1) [3–6].

PowerPoint Presentation

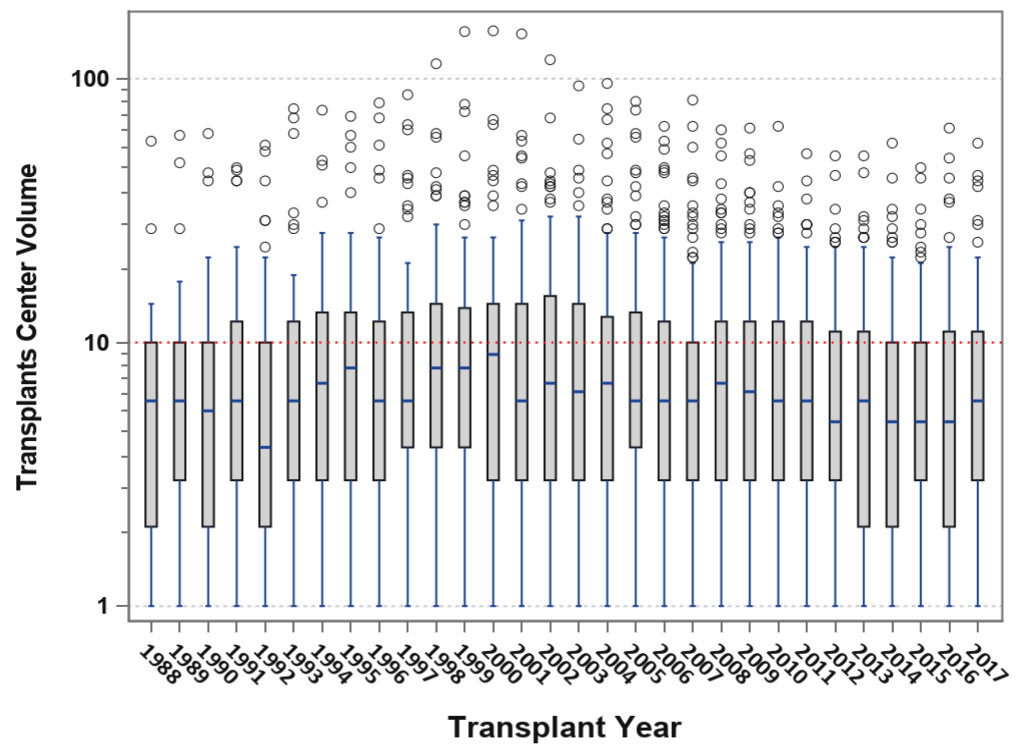
Figure 4. Box-plot analysis showing transplant center volume over time; the median center volume has decreased from 9 to 6 pancreas transplants annually and the current lower and upper quartile values are 3–12 pancreas transplants per year.

Improving Outcomes in the Setting of Fewer Transplants Being Performed

According to data from the IPTR and the United Network for Organ Sharing [UNOS), the total annual number of pancreas transplants steadily increased in the US until 2004 [peaking at 1484) but then declined annually for the next 11 consecutive years [reaching a low of 943 in 2015, which was the lowest total since 1994). Fortunately, the number of pancreas transplants has rebounded to above 1000 per year in 2016 and 2017 [Figure 1) [3–6, 18]. This trend downward has been more dramatic for solitary pancreas transplants, particularly in the PAK category [415 performed in 2004, 79 performed in 2017, Figure 2). From 2004–2015, the annual number of SPK transplants in the US declined by 20% overall whereas the annual overall decreases in PAKs and PTAs were 81% and 42%, respectively [Figure 2) [3–6, 18]. In the last decade, era analyses of national data have demonstrated that deceased donor recovery rates and additions to the waiting list have decreased while donor organ discard rates and recipient waiting times have increased. At present, pancreas transplantation is one of the few solid organ transplants in the US that is experiencing an overall decline in activity [3–6, 18]. Unexpectedly, this has occurred in spite of significant improvements in graft and patient survival outcomes, even in higher risk patients, as shown below [Table 1) – an alarming trend because the history of solid organ transplantation has been characterized by an increase in volume mirroring improved results in most circumstances [18, 19].

Table 1. Recent outcomes of primary deceased donor pancreas and pancreas/kidney transplants performed between 1998 and 2017 with a potential follow-up time of at least 6 months.

1998–02

2003–07

2008–12

2013–17

P-value

Patient Survival
[%]

SPK

1 Year

94.7

95.4

96.9

97.4

<0.0001

3 Year

90.1

91.5

94.0

95.1

5 Year

85.2

87.2

89.6

PAK

1 Year

95.3

96.3

97.1

95.7

0.13

3 Year

89.9

91.4

93.5

91.3

5 Year

82.1

85.1

88.8

PTA

1 Year

98.2

96.3

96.6

98.4

0.36

3 Year

93.1

91.6

93.6

94.9

5 Year

88.8

87.8

86.8

Graft
Function
[%]

SPK

Pancreas

1 Year

83.4

85.0

88.8

90.3

<0.0001

3 Year

76.6

78.8

82.9

84.7

5 Year

69.8

72.6

77.1

Kidney

1 Year

91.8

92.6

94.8

95.8

<0.0001

3 Year

84.5

86.2

88.8

90.8

5 Year

77.0

79.7

82.2

PAK

1 Year

78.3

78.9

84.7

85.1

<0.0001

3 Year

66.6

65.5

73.7

75.3

5 Year

57.0

56.3

67.1

PTA

1 Year

80.2

77.8

82.2

84.0

0.03

3 Year

63.4

60.0

67.8

72.2

5 Year

55.2

53.0

58.2

Coincident with the decrease in pancreas transplant activity in the US, there has been a steady increase in the number of pancreas transplants performed outside of the US such that more annual pancreas transplants are now being performed outside of the US since 2008 [3–6]. In 2017, 1002 pancreas transplants were performed in the US [including multivisceral transplants) whereas nearly 1400 pancreas transplants were performed outside of the US and reported to the IPTR [Figure 1) [3–6]. Because reporting of pancreas transplants performed in the US is mandatory and reporting of non-US cases is voluntary, the actual number of pancreas transplants performed outside of the US may be even higher. However, recent data from the Eurotransplant [a collective of all transplant centers in eight European countries) and United Kingdom [UK) transplant registries suggest that a reduction in annual pancreas transplant activity has occurred in these regions as well [20]. Between 2004 and 2016, the average annual decline in pancreas transplant rates was 2.9% in the US and 1.8% in Eurotransplant member countries. In the UK, from 2009 to 2016, a 0.5% annual decline in pancreas transplant activity occurred. The overall increase of non-US transplant numbers was due to the increased transplant activities of South American transplant centers where new pancreas transplant programs were started. Paradoxically, this decrease in annual pancreas transplant activity occurred commensurate with a burgeoning increase in incident rates for type 1 diabetes in children. Corresponding to the >30% decline in the total annual number of pancreas transplants being performed in the US in the past decade, fewer patients are being added to the waiting list, waiting times have increased, and wait list mortality for SPK transplant candidates has risen to 10% [3–6].

Only about 7 in 10,000 Type 1 and 4 in 1 million Type 2 patients with diabetes will ever receive a pancreas transplant in the US. Concurrent with the above trends, the overall number of active pancreas transplant centers are declining; only 10 centers in the US performed ≥20 pancreas transplants in 2017 and half of all centers perform <6 pancreas transplants in 2017 [Figure 4); many do not perform solitary pancreas transplants [3–6, 21]. For example, <50% of pancreas transplant centers perform PAKs and <25% actually perform PTAs in a given year. Only 12 centers in North America are certified by the American Society of Transplant Surgeons [ASTS) for pancreas transplant fellowship training [which previously required performing a minimum of 20 pancreas transplants per year). With the steady decline in volumes, many pancreas transplant programs are losing their ASTS fellowship training accreditation. Consequently, the ASTS recently lowered the annual threshold to 15 pancreas transplants per annum in order to permit centers to gain or maintain certification for fellowship training. Pancreas transplant programs comprise the vast majority of organ-specific transplant programs in the US that are most commonly cited by the UNOS Membership and Professional Standards Committee for not meeting minimum activity requirements. Low center volume is a problem in the Eurotransplant consortium as well. As a result, fewer surgeons are adequately trained in pancreas transplantation and many abdominal organ recovery surgeons are not experienced in pancreas organ recovery, which may influence pancreas procurement [18, 22]. Parenthetically, previous data have suggested that pancreas transplant outcomes are favorably influenced by increasing center volume [21].

This unintentional de-emphasis on pancreas transplantation represents a “crisis in confidence” and has the potential to threaten the existence of the procedure as a viable and effective therapeutic option. The national trend in decreasing numbers of pancreas transplants is disturbing and related to a number of factors. For example, the lack of a primary referral source from either diabetologists, endocrinologists or family medicine practitioners has hindered the growth of pancreas transplantation. Most pancreas transplant referrals are from nephrologists who refer patients with diabetes and chronic kidney disease to a transplant center for kidney rather than pancreas transplant evaluation. Ideally, a kidney transplant program with an active pancreas transplant component will identify potential candidates and appropriately offer them either SPK or PAK transplantation. However, this may not occur in programs that do not perform pancreas transplantation but would like to retain the patient for renal transplantation alone. The situation for PTA candidates is even worse as many diabetic patients actually have to circumvent the conventional diabetes care model in order to gain access to PTA.

Improvements in diabetes management, education and awareness; better insulin analogues and glucose sensors; sophisticated and more patient-friendly insulin pumps; and the promise of the artificial or bionic pancreas have all contributed to the diversion of interest away from pancreas transplantation [23]. For most patients with diabetes, the above advances are obvious improvements in therapy because they frequently result in a delay in the progression of diabetic complications. Consequently, lower rates of chronic kidney disease and delayed progression to other end-organ complications may result in fewer or later referrals for transplantation. This may be preferred for patients with diabetes that are able to avoid the need for transplantation. However, for those who might benefit from pancreas transplantation, late referral usually means that patients are older, may have a higher BMI, and may have additional co-morbidities that preclude successful pancreas transplantation. Additionally, most patients with diabetes have non-type 1 diabetes, which is generally, but incorrectly, regarded as a contraindication to pancreas transplantation.

SPK and PAK transplantation became Medicare-approved procedures on July 1st, 1999, after which time the American Diabetes Association included these treatment options within their evidence-based standards of care [24]. PTA became approved by Medicare on April 26, 2006, and despite coverage by Medicare and most primary insurers, subsequent validation by the American Diabetes Association has not occurred even though data on PTA spans several decades, thousands of transplants and chronicles steadily improving outcomes [2, 23, 24]. Because PTA is one of many treatment options available for diabetes mellitus, it stands in direct competition with conventional medical therapies and islet transplantation [23, 25, 26]. Many diabetes care professionals consider PTA to be a “radical”, aggressive, or overzealous therapy [requiring major surgery and lifelong immunosuppression) for a “benign” [yet life-shortening) disease. Other available treatment options are less invasive and, for that reason alone, more appealing to patients, diabetologists, endocrinologists, and primary care physicians. However, the long-term survival advantage in all three recipient categories of pancreas transplantation is not widely known or accepted. Even today, pancreas transplantation is often considered only as a life enhancing rather than a life-extending procedure.

For instance, the University of Wisconsin published their experience with 1000 SPK transplants with 22 year follow-up [27]. In this report, patient survival following SPK transplantation was superior to all other transplant options for type 1 diabetic patients with uremia. Patient survival following SPK transplant was even superior to uremic patients with Type 1 diabetes who underwent living donor kidney transplantation alone. This remarkable finding supports the contention that freedom from diabetes provides a survival advantage in the setting of kidney transplantation. Another study from the University of Minnesota evaluated outcomes in patients following living donor kidney transplantation who either underwent subsequent PAK transplant or were eligible for but did not undergo PAK because of financial or personal [but not medical) reasons. Patients who were ineligible for PAK because of comorbidity were excluded from analysis [28]. Although patient and kidney graft survival rates were not influenced [positively or negatively) by PAK transplant, 4-year renal function was significantly improved following PAK transplant in the setting of improved glycemic control. In a UNOS registry analysis from 1995–2010 of all adult patients registered either for an SPK or PAK transplant, the major findings were: 1. Patient survival for all transplanted patients was far superior to remaining on the waiting list; 2. Five-year patient survival was similar but 10-year patient survival was higher for SPK compared to PAK transplant recipients; 3. Receiving a PAK following either living or deceased donor kidney transplantation markedly improved long-term kidney graft survival rates compared to not receiving a pancreas graft; 4. Ten-year kidney graft survival rates were similar [61%) for recipients of either an SPK or living donor kidney alone transplants; and 5. Ten-year pancreas graft survival rates were 58.7% for SPK, 44.4% for pancreas after living donor kidney transplant, and 41.7% for pancreas after deceased donor kidney transplant [29]. However, the kidney graft survival rate was highest at 10 years [69.7%) for those surviving patients who received a living donor kidney followed by a sequential PAK transplant. Other studies have documented steadily improving outcomes following PAK transplant [29]. Based on these findings, it is logical to infer that both patient and renal graft longevity is maximized by achieving an insulin and dialysis-free state, whether this is accomplished either by an SPK transplant or a PAK transplant following [preferably) a living donor kidney transplant. Adding a pancreas to a kidney transplant [either simultaneously or sequentially) provides a survival advantage beyond kidney transplantation alone compared to all other treatments available to the uremia diabetic individual.

To further corroborate this viewpoint, recently published data have documented that since the inception of UNOS in 1987, 79, 198 life-years have been “saved” by SPK transplantation [4.6 life-years per recipient) and 14, 903 life-years by solitary pancreas transplants [2.4 life-years per recipient) in the US [30]. The perception that PTA is merely an invasive insulin replacement therapy is contrary to existing literature because this option confers a median survival time of 13.6 years compared to 8.0 years for patients who remain on the waiting list. The target patient population is also at significantly increased risk for multiple other morbidities attributed to diabetes that are not captured by data that address survival exclusively. Considering all of the data, the lack of wider application of pancreas transplantation to appropriately selected patients with complicated diabetes remains enigmatic and a missed opportunity.

It has been virtually overlooked that pancreas transplantation is now associated with an extremely low mortality rate, ranging from 3% at 1 year to 5–8% at 3 years in all 3 pancreas transplant categories [Table 1) [3–6]. At 3 years follow-up, pancreas graft survival [insulin-independence) rates are 85% for SPK transplant, 75% for PAK, and 72% for PTA recipients nationally. Following SPK transplantation, the national 3-year kidney graft survival rate is 91%. Many pancreas transplant recipients have been insulin-independent for >10 years and some for >20 years [12]. In every update of the IPTR spanning 30 years, patient and graft survival rates in all 3 categories of pancreas transplantation have continued to improve whereas early technical and immunological graft losses have continued to decline. However, the transplant community has become victimized by success; improving survival rates in all solid organ transplants have translated into higher thresholds that are implemented as metrics of acceptable performance. With fewer pancreas transplants being performed and fewer patients on the waiting list, the margin for error is much smaller and not all transplant centers remain actively involved in or committed to the practice of pancreas transplantation. Because of increased regulatory oversight, even large centers have responded by adopting a more risk adverse approach to transplantation in general and pancreas transplantation specifically. In addition, the marked decline in PAK transplants may be explained in part by overall improvements in outcomes and quality of life for patients receiving a kidney alone transplant, after which time they feel “well enough” to forego another transplant. Unfortunately, this is very shortsighted as these patients still face major issues despite a functioning kidney transplant; low quality of life and shortened lifespan because of their unchanged or even worsened diabetic state; and the potential for earlier kidney graft failure secondary to recurrent diabetic nephropathy [28, 29, 31].

Donor, Recovery and Preservation Issues

At present, pancreata are currently recovered for the intent to transplant in only 17% of deceased donors in the US [32]. Of these recovered organs, 25% are discarded so only 13% of deceased donors provide a pancreas that is actually transplanted. Some of these pancreata are sent for islet recovery, which in most cases does not result in islet transplantation. In other cases, aberrant hepatic artery anatomy or intestinal recovery may preclude pancreas recovery, although both of these conditions may be compatible with safe pancreas transplantation [22, 32]. Rates of pancreas utilization among Donor Service Areas vary from 0 to 50+% of donors. Pancreas utilization is influenced by limitations in acceptable warm and cold ischemia, which largely prevents widespread organ sharing and routine acceptance of donation after cardiocirculatory death [DCD) donors. However, recent reports have suggested that pancreas utilization in DCD donors is underutilized and a missed opportunity [32–34]. Moreover, because of logistical constraints, having a back-up patient at another center is problematic if the primary center chooses not to use the pancreas graft. In addition to donor quantity, donor quality has changed because donor age, BMI and proportion of donors who sustain brain death secondary to a cerebrovascular or cardiovascular etiology have all increased over time. The ideal pancreas donor ranges from 10–40 years of age, weighs 60–180 lbs., and sustains head trauma as a cause of brain death [32]. With the addition of cold ischemia <12 hours, these 4 core factors primarily determine the likelihood of success [and utilization) in pancreas transplantation. Having more than one of these factors outside the ideal range may have a significant detrimental effect on outcomes [35]. However, the recent surge in organ donation from young donors who sustain brain death secondary to anoxic encephalopathy following a drug overdose is rapidly becoming another source of “ideal” pancreas donors. Another viable alternative for pancreas recovery is the use of pediatric donors [below the age of 10 years or less than 30 kg in size) [36].

An additional aspect of donor pancreas under-utilization is the decline in experienced recovery teams that are able to adequately manage the donor, define and preserve the anatomy, and safely remove the pancreas intact without compromising any of the abdominal organs [22, 32]. The UNOS Pancreas Transplant Committee noted in a June 2014 Report to the Board of Directors that many pancreas discards were for reasons such as surgical error, surgical damage, and poor allograft description, with some of the discards attributed to the experience level of the recovery surgeon. The number of transplant surgeons actively involved in pancreas transplantation and donation is substantially lower than the number of kidney and/or liver transplant surgeons [18]. In addition, liver and kidney recovery usually take precedence over pancreas recovery among the abdominal organs, and the “liver” team is usually directing the recovery of abdominal organs. The lack of a “pancreas organ advocate” during the retrieval process may limit recovery and placement. In addition, having fewer patients on the waiting list may translate into greater selectivity with respect to donor organ offers. Finally, because of the constraints of cold ischemia coupled with Medicare regulations, pancreas recovery is rarely performed unless a specific recipient or receiving center has been identified preemptively.

Pancreas Allocation and Donor Risk Indices

The new Pancreas Transplant allocation policy [initiated on 10/31/2014) introduced recipient qualifying criteria for eligibility to accrue waiting time for SPK transplant, which limits the body mass index [BMI) cut-off for patients with diabetes mellitus and a C-peptide level >2.0 ng/ml. However, these new criteria are not supported by outcome or utilization data and have the potential to reduce overall pancreas transplant activity [3, 18]. Consequently, these qualifying criteria may be removed from the waiting list process. The overall decline in pancreas transplant activity is also temporally associated with the development and introduction of the Pancreas Donor Risk Index as a screening tool into clinical practice, in which multiple risk factors such as donor age, BMI, and cold ischemia time are integrated into a composite score to objectify donor assessment [37]. The Pancreas Donor Risk Index was designed using UNOS data to provide a predictive model to estimate post-transplant graft survival using pretransplant variables. While the Pancreas Donor Risk Index may accurately discriminate optimal versus marginal donor pancreas utilization at the extremes, there are insufficient data to validate its ability to stratify the average risk or suboptimal donor. Therefore, it has not been generally accepted into practice and is rarely used in making decisions about organ offers.

Surgical Techniques

Prior to the mid-1980s, a number of different techniques of exocrine drainage were investigated and many pancreas transplants were performed as segmental grafts [13–15]. During this developmental phase, exocrine drainage techniques were considered to be the “Achilles’ heel” of pancreas transplantation. From the late-1980s to 1995, the majority of pancreas transplants were performed as whole organ pancreatic grafts with systemic venous and bladder exocrine drainage [systemic-bladder technique). The advent of bladder drainage of the exocrine secretions revolutionized the safety and improved the success of pancreas transplantation. However, starting in 1995, a seismic shift from bladder to enteric exocrine drainage occurred coincident with improvements in immunosuppression, preservation techniques, diagnostic monitoring, general medical care, and the success of enteric conversion [13–15]. In the new millennium, most pancreas transplants have been performed as whole organ pancreatico-duodenal grafts with systemic venous delivery of insulin and enteric exocrine drainage [systemic-enteric technique) [1, 3, 5].

Enteric drainage usually refers to jejunal or ileal diversion of the exocrine secretions either with or without a diverting Roux limb[13–15]. Pancreas transplantation with primary enteric exocrine drainage accounted for 91% of SPK, 89% of PAK, and 89% of PTA cases in the US from 2010–2014 [3]. However, during this time, the systemic-bladder technique remained a viable option in selected cases and a preferred option at specific centers [1]. Of the cases performed with enteric drainage in the US, the proportions performed with a diverting Roux-en-y limb were 21% in SPK, 15% in PAK, and 15% in PTA cases [3, 5, 6]. To improve the physiology of pancreas transplantation, an innovative technique of portal venous delivery of insulin and enteric drainage of the exocrine secretions [portal-enteric technique) was developed in the early 1990s and refined over the past 20+ years [14, 15]. Currently, the proportions of enteric-drained cases performed with portal venous delivery of insulin are 22% in SPK, 11% in PAK, and 13% in PTA cases [3]. While the potential of the portal-enteric technique has not been fully realized, it has spawned a number of newer techniques of enteric exocrine drainage including duodenal or gastric diversion [14, 15]. A number of studies have demonstrated no major or consistent differences in outcomes for bladder-drained or enteric-drained pancreas transplants with either portal or systemic venous drainage [13–15]. The surgical complication rate also does not vary according to the type of transplant [SPK versus solitary pancreas transplantation). The incidence of duodenal segment leaks has been reported to be 5–20% in bladder-drained and 5–8% in enteric-drained pancreas transplants [13–15, 27, 38]. Increasing experience with enteric exocrine drainage is likewise associated with a decreased incidence of surgical complications. Although nearly all pancreas transplants are currently performed with one of the three above techniques, current philosophy dictates that the most appropriate technique to be performed is defined by both donor and recipient anatomy as well as the individual surgeon’s comfort level and experience.

Recipient Selection and Waiting List Considerations

The number of additions to the kidney-pancreas waiting list in the US steadily decreased from a high of 1935 in 2000 to 1228 in 2017 [5, 6]. In addition, the number of prevalent candidates [active and inactive) on either the kidney-pancreas or the pancreas waiting lists steadily decreased from 3499 in 2002 to 2518 in 2018. The number of active candidates has decreased by more than 50%, from 2776 in 2002 to 1039 in 2018. In spite of fewer patients on the active waiting list, median waiting times for kidney-pancreas transplantation have continued to increase and range from 1.2 to 4 years depending on blood type. In the past decade, the proportion of recipients who are older, African American, have a higher BMI, or are characterized as having type 2 diabetes have all increased [1, 3, 5, 6]. Recent studies have reported that pancreas transplantation can be successfully performed in selected patients with non-type 1 diabetes [7–10, 39]. In 2013, 25.7% of candidates on the waiting list were ≥ age 50 years, 19.7% were African American [11.4% were Hispanic), 19.1% had a BMI ≥ 30 kg/m2, and 8.9% were classified as having type 2 diabetes. This positive trend in successfully transplanting higher risk patients that were excluded from receiving a pancreas transplant in the past has become possible secondary to significant advances in surgical techniques, immunosuppression and post-transplant medical management strategies. Unfortunately, guidelines for liberalizing recipient criteria have not been widely promulgated or accepted by the medical and surgical communities.

Immunosuppression and Immunological Outcomes

The history of pancreas transplantation is a remarkable success story of the last 50 years that is closely linked to advances in biological and immunosuppressive drug therapies [1–3]. Progress in surgical techniques and clinical immunosuppression have led to improving results in vascularized pancreas transplantation that are attributed to reductions in technical failures and immunologic graft losses over time, respectively [1–6, 40]. The use of biologic agents for induction and “cocktails” of multiple agents with varying mechanisms of action for maintenance therapy have become the standard of immunosuppression following pancreas transplantation [1–8, 40–43]. Immunosuppressive strategies in pancreas transplantation have evolved from experience extrapolated in kidney transplantation because the majority are performed as SPK transplants. Unlike other types of solid other transplants, pancreas transplantation provides an excellent paradigm to study acute rejection because insulin-requiring diabetic patients represent a relatively homogeneous patient population who historically had a high rate of acute rejection possibly because of variable drug absorption [from impaired gastric emptying] or heightened immune responsiveness from the presumed auto-immune etiology of diabetes. In addition, adding a pancreas to a kidney allograft appears to increase the risk of acute rejection, which may be related to the inherent immunogenicity of the pancreas graft or perhaps because of increased antigen load or altered antigen presentation in the recipient. [43–46] Consequently, SPK transplantation has been associated with a higher rate of acute rejection compared to other transplanted organs whereas solitary pancreas transplantation may have even a higher rate of acute rejection secondary in part to limitations in monitoring the pancreas graft. [2, 23, 47]

At present, 90% of SPKT recipients receive antibody induction, with nearly 80% receiving a depleting antibody agent. [3–6, 43] Depleting antibody induction using a biological agent has become a cornerstone of contemporary immunosuppression in pancreas transplantation. The rationale for the evolving trend in depleting antibody induction is to provide a more potent immunosuppressive umbrella of protection for maintenance therapies that incorporate minimization strategies such as corticosteroid elimination or avoidance, calcineurin inhibitor reduction or withdrawal, or even calcineurin inhibitor monotherapy. According to International Pancreas Transplant Registry data, rabbit anti-thymocyte globulin and alemtuzumab are currently the two most commonly used antibody induction agents in SPK transplantation. One-year rates of acute rejection have steadily decreased and are currently in the 5–20% range depending on pancreas transplant category, case mix and immunosuppressive regimen. [3, 4, 6] Historically, these regimens were based primarily on efficacy in the prevention of acute rejection. However, the amount, frequency, and duration of various agents must be tailored according to individualized risk factors. Although nearly all possible combinations of maintenance immunosuppressive protocols have been used, nearly 80% of patients in the recent past have received maintenance therapy with the tacrolimus/mycophenolate combination, and 30–50% have undergone either early or delayed corticosteroid withdrawal without adverse consequences. [3–5, 40–43] The current one-year rate of immunological pancreas graft loss is 1.8% in SPK transplant recipients. [3, 4, 6] Although depleting antibody induction strategies are associated with lower rates of acute rejection compared to either no induction or non-depleting antibody induction, somewhat surprisingly no major differences in mid-term patient or graft survival rates or graft function have been noted according to method of antibody induction. As early graft survival rates have improved because of lower rates of both acute rejection and immunological graft loss, the consequences of chronic rejection have become more important. [45] Ultimately, the development of a non-nephrotoxic, non-diabetogenic, and non-gastrointestinal toxic maintenance immunosuppressive regimen is highly desirable to improve outcomes and quality of life in pancreas transplant recipients. Immunosuppressive strategies will continue to evolve to safer, less toxic, and more targeted therapies with similar or improved efficacy long-term compared to currently available regimens.

Pancreas Versus Islet Transplantation

PTA and islet transplantation are usually linked together as equivalent beta-cell replacement strategies for patients with diabetes in the absence of chronic kidney disease, both of which are then considered as investigational therapies rather than as standards of care. [24–26] Unfortunately, this characterization is not accurate and confusing to patients who might benefit from PTA. In 2000, Shapiro, et al, published their landmark paper on successful islet transplantation in seven patients using the “Edmonton” protocol. [48] Although islet transplant outcomes have continued to improve, overall graft function and durability have not matched those achieved for PTA. [2, 23, 30, 49] In fact, complete and stable long-term insulin independence is uncommon and, in current studies, is not even a primary endpoint following islet transplantation. In addition, “successful” islet transplantation frequently requires more than one donor pancreas. Unlike PTA, islet transplantation remains in a developmental phase with slightly improved success rates only reported in the new millennium in a few hundred cases. At present, islet transplantation is not approved by the Center for Medicare and Medicaid Services in the US, but is paid for by public health systems in some other countries. Similar to islet transplantation, other novel diabetes management options such as the “bionic pancreas”, immunotherapy, gene therapy and stem cell therapy remain innovative yet unrealized investigational ventures that have overshadowed enthusiasm for PTA. Moreover, none of these promising therapies have the current established successful track record of PTA but are being touted as potential “cures” for diabetes. Yet, the mere prospect of potential effectiveness with non- or less-invasive treatment options has subjugated the proven success of PTA.

Summary and Conclusion

In spite of the increasing success of pancreas transplantation, it seemingly has been relegated to a secondary or even tertiary role in the management of diabetes. Overall advances in diabetes management, education and awareness; newer insulin analogues and glucose sensors; state of the art, portable, and more patient-friendly insulin pumps; and the potential of the artificial or bionic pancreas have all contributed to the diversion of interest away from pancreas transplantation as a viable treatment option in the absence of uremia. Pancreas transplantation has been performed with a high and increasing level of success for 30 years. Consequently, it is logical to assume that the diabetes care community will not change their perception of pancreas transplant as a “last resort” form of therapy. However, in spite of recent trials and tribulations, pancreas transplantation remains an important therapeutic alternative for selected patients with hyperlabile or “complicated” diabetes who cannot be managed optimally with conventional insulin therapy. Ultimately, a more reliable source of high quality organs, less diabetogenic [and less toxic] immunosuppression, and lower surgical morbidity are needed in order to propel pancreas transplantation into the forefront of widely accepted management strategies for patients with insulin-requiring diabetes.

Because the healthcare landscape is a moving target, new and innovative ways to educate the public and medical community are needed to correct misperceptions about pancreas transplantation. In addition to conducting outreach sessions with endocrinologists and diabetologists, the pancreas transplant community needs to reach the vast number of family practice physicians who manage the majority of patients with diabetes. Regarding “promotion” of pancreas transplantation, recent data and new evidence needs to be disseminated using not only conventional publications but also social networking, medical websites, media campaigns and through re-engaging the American Diabetes Association. Ultimately, the most important factor for more widespread application of pancreas transplantation remains education, including ongoing engagement of patients with diabetes and health care professionals. Various types of media and social networks could and should function as ideal platforms for recipients of successful pancreas transplants to spread the message that complete and durable insulin-independence is an attainable goal in the majority of cases.

From a transplant community perspective, greater emphasis needs to be placed on improving pancreas recovery rates including removing financial disincentives, facilitating broader sharing with charter aircraft to minimize cold ischemia, implementing pancreas donor advocates, expanding acceptable donor criteria to include selected donation after circulatory death donors and pediatric donors, and assuring that abdominal organ recovery surgeons are experienced in pancreas recovery. In addition, liberalizing recipient selection to include older patients as well as non-type 1 diabetics with uremia and expanding indications for solitary pancreas transplantation (PAK and PTA) will increase the size of the waiting list, which ultimately drives pancreas utilization. Recent studies have suggested that even at active pancreas transplant centers, there are a number of patients who are either on the kidney waiting list or whom have received successful kidney alone transplantation who may benefit from either SPK or PAK transplantation. Having a multidisciplinary team in place to specifically evaluate uremic diabetic individuals for pancreas transplantation can facilitate the “pipeline” by effectively triaging more potential candidates, increase “internal conversions” from the kidney to the SPK transplant waiting list, and identifying patients who may benefit from PAK transplantation. [50] Rather than relying on the diabetes care and nephrology communities for access to potential pancreas transplant candidates, kidney transplant centers must become accountable for providing the opportunity for pancreas transplantation. For SPK transplant recipients with potential living donors, one might consider having the living donor donate their kidney to someone else on the kidney waiting list in exchange for priorization on the SPK waiting list. Alternatively, a more assertive approach to PAK transplantation may be warranted. In spite of recent challenges, pancreas transplantation remains an important therapeutic option for selected patients with hyperlabile or “complicated” diabetes who cannot be managed optimally with conventional insulin therapy.

Abbreviations

ASTS: American Society of Transplant Surgeons

BMI: Body Mass Index

DCD: Donation after Cardiocirculatory Death

IPTR: International Pancreas Transplant Registry

PAK: Pancreas after Kidney

PTA: Pancreas Transplant Alone

SPK: Simultaneous Pancreas-Kidney

UK: United Kingdom

UNOS: United Network for Organ Sharing

US: United States

References

  1. Gruessner RW, Gruessner AC (2013) The current state of pancreas transplantation. Nat Rev Endocrinol 9: 555–562. [crossref]
  2. Gruessner RW, Gruessner AC (2013) Pancreas transplant alone: a procedure coming of age. Diabetes Care 36: 2440–2447. [crossref]
  3. Gruessner AC, Gruessner RW (2016) Pancreas Transplantation of US and Non-US Cases from 2005 to 2014 as Reported to the United Network for Organ Sharing (UNOS) and the International Pancreas Transplant Registry (IPTR). Review of Diabetic Studies 13: 35–58.
  4. Updated International Pancreas Transplant Registry (IPTR) data, Angelika Gruessner (personal communication); United Network for Organ Sharing (UNOS).
  5. Kandaswamy R, Stock PG, Gustafson SK, Skeans MA, et al. (2018) OPTN/SRTR 2016 Annual Data Report: Pancreas. Am J Transplant 18: 114–171. [crossref]
  6. Gruessner AC, Gruessner RWG (2018) Pancreas Transplantation for Patients with Type 1 and Type 2 Diabetes Mellitus in the US – A Registry Report. Gastroenterol. Clin N Am 47: 417–441.
  7. Orlando G, Stratta RJ, Light J (2011) Pancreas transplantation for type 2 diabetes mellitus. Curr Opin Organ Transplant 16: 110–115. [crossref]
  8. Stratta RJ, Rogers J, Farney AC, et al. (2015) Pancreas transplantation in C-peptide positive patients: Does “type” of diabetes really matter? J Am Coll Surg 220: 716–727.
  9. Gruessner AC, Laftavi MR, Pankewycs O, Gruessner RWG (2017) Simultaneous Pancreas and Kidney Transplantation – Is it a Treatment Option for Patients with Type 2 Diabetes Mellitus? An Analysis of the International Pancreas Transplant Registry. Current Diabetes Reports 17: 44 (1–9).
  10. Rogers J, Farney AC, Orlando G, Iskandar SS, Doares W, et al. (2014) Pancreas transplantation: The Wake Forest experience in the new millennium. World J Diabetes 5: 951–961. [crossref]
  11. Redfield RR, Scalea JR, Odorico JS (2015) Simultaneous pancreas and kidney transplantation: current trends and future directions. Curr Opin Organ Transplant 20: 94–102.
  12. Gruessner AC, Gruessner RWG (2016) Long-term Outcome after Pancreas Transplantation – A Registry Analysis. Curr Opin Organ Transplant 21: 377–385.
  13. Boggi U, Amorese G, Marchetti P (2010) Surgical techniques for pancreas transplantation. Curr Opin Organ Transplant 15: 102–111. [crossref]
  14. Rogers J, Farney AC, Orlando G, Farooq U, Al-Shraideh Y, et al. (2014) Pancreas transplantation with portal venous drainage with an emphasis on technical aspects. Clin Transplant 28: 16–26.
  15. El Hennawy H, Stratta RJ, Smith F (2016) Exocrine Drainage in Vascularized Pancreas Transplantation in the New Millennium. World J Transplant 6 (2): 255–71. doi: 10.5500/wjt.v6.i2.255.
  16. Boggi U, Signori S, Vistoli F, et al. (2012) Laparoscopic robot-assisted pancreas transplantation: First world experience. Transplantation 93: 201–206.
  17. Cantrell LA, Oberholzer J (2018) Robotic pancreas transplantation: the state of the art. Curr Opin Organ Transplant 23: 423–427. [crossref]
  18. Stratta RJ, Gruessner AC, Odorico JS, Fridell JA, Gruessner RW (2016) Pancreas Transplantation: An Alarming Crisis in Confidence. Am J Transplant 16: 2556–2562. [crossref]
  19. Gruessner AC, Gruessner RW (2014) Declining Numbers of Pancreas Transplants but Significant Improvements in Outcome. Transplant Proc 46: 1936–1937.
  20. Kopp W, van Meel M, Putter H, Samuel U, Arbogast H, et al. (2017) Center Volume is Associated with Outcome after Pancreas Transplantation within the Eurotransplant Region. Transplantation 101: 1247–1253.
  21. Alhamad T, Malone AF, Brennan DC, Stratta RJ, Chang SH, et al. (2017) Transplant Center Volume and the Risk of Pancreas Allograft Failure. Transplantation 101: 2757–2764. [crossref]
  22. Ausania F, Drage M, Manas D, Callaghan CJ (2015) A registry analysis of damage to the deceased donor pancreas during procurement. Am J Transplant 15: 2955–2962. [crossref]
  23. Niederhaus SV (2015) Pancreas transplant alone. Curr Opin Organ Transplant 20: 115–120. [crossref]
  24. Robertson RP, Davis C, Larsen J, Stratta R, Sutherland DE (2000) ADA Position Statement: Pancreas and islet transplantation for patients with diabetes. Diabetes Care 23: 112–116.
  25. Niclauss N, Morel P, Berney T. (2014) Has the Gap Between Pancreas and Islet Transplantation Closed? Transplantation 98: 593–599.
  26. Moassesfar S, Masharani U, Frassetto LA, et al. (2016) A Comparative Analysis of the Safety, Efficacy, and Cost of Islet Versus Pancreas Transplantation in Nonuremic Patients with Type 1 Diabetes. Am J Transplant 16: 518–526.
  27. Sollinger HW, Odorico JS, Becker YT, D’Alessandro AM, Pirsch JD (2009) One thousand simultaneous pancreas-kidney transplants at a single center with 22-year follow-up. Ann Surg 250: 618–630.
  28. Kleinclauss F, Fauda M, Sutherland DER, Kleinclauss C, Gruessner RW, et al. (2009) Pancreas after living donor kidney transplants in diabetic patients: Impact on long-term kidney function. Clin Transplant 23: 437–446.
  29. Fridell JA, Niederhaus S, Curry M, Fox A: Odorico J (2018). The Survival Advantage of Pancreas after Kidney Transplantation. Am J Transplant 18: in press
  30. Rana A, Gruessner A, Agopian VG, Khalpey Z, Riaz IB, et al. (2015) Survival benefit of solid-organ transplant in the United States. JAMA Surg 150: 252–259. [crossref]
  31. Weiss AS, Smits G, Wiseman AC (2009) Twelve-Month Pancreas Graft Function Significantly Influences Survival Following Simultaneous Pancreas-Kidney Transplantation. Clin J Am Soc Nephrol 4: 988–995.
  32. Fridell J, Rogers J, Stratta RJ (2010) The pancreas allograft donor: Current status, controversies, and challenges for the future. Clin Transplantation 24: 433–449.
  33. Muthusamy AS, Mumford L, Hudson A, Fuggle SV, Friend PJ (2012) Pancreas Transplantation from Donors after Circulatory Death from the United Kingdom. Am J Transplant 12: 2150–2156.
  34. Kopp WH, Lam HD, Schaapherder AFM, et al. (2018) Pancreas Transplantation with Grafts from Donors Deceased after Circulatory Death: 5 years Single-Center Experience. Transplantation 102: 333–339.
  35. Finger EB, Radosevich DM, Dunn TB, Chinnakotla S, Sutherland DE, et al. (2013) A composite risk model for predicting technical failure in pancreas transplantation. Am J Transplant 13: 1840–1849. [crossref]
  36. Fernandez L, Turgeon NA, Odorico JS, et al. (2004) Superior Long-Term Results of Simultaneous Pancreas-Kidney Transplantation from Pediatric Donors. Am J Transplant 4: 2093–2101.
  37. Axelrod DA, Sung RS, Meyer KH, et al. (2010) Systematic Evaluation of Pancreas Allograft Quality, Outcomes, and Geographic Variation in Utilization. Am J Transplant 10: 837–845.
  38. Sutherland DE, Gruessner RW, Dunn DL, Matas AJ, Humar A, et al. (2001) Lessons learned from more than 1,000 pancreas transplants at a single institution. Ann Surg 233: 463–501. [crossref]
  39. Wiseman AC, Gralla J (2012) Simultaneous Pancreas Kidney Transplant Versus Other Kidney Transplant Options in Patients with Type 2 Diabetes. Clin J Am Soc Nephrol 7: 656–664.
  40. Odorico JS, Sollinger HW (2002) Technical and immunosuppressive advances in transplantation for insulin-dependent diabetes mellitus. World J Surg 26: 194–211.
  41. Singh RP, Stratta RJ (2008) Advances in immunosuppression for pancreas transplantation. Curr Opin Organ Transplant 13: 79–84. [crossref]
  42. Heilman RL, Mazur MJ, Reddy KS (2010) Immunosuppression in simultaneous pancreas-kidney transplantation: progress to date. Drugs 70: 793–804. [crossref]
  43. Stratta RJ, Farney AC, Rogers J, Orlando G (2014) Immunosuppression for Pancreas Transplantation with an Emphasis on Antibody Induction Strategies: Review and Perspective. Expert Rev Clin Immunol 10: 117–132.
  44. Reddy KS, Davies D, Ormond D, Tuteja S, Lucas BA, et al. (2003) Impact of acute rejection episodes on long-term graft survival following simultaneous kidney-pancreas transplantation. Am J Transplant 3: 439–444. [crossref]
  45. Humar A, Khwaja K, Ramcharan T, Asolati M, Kandaswamy R, et al. (2003) Chronic rejection: the next major challenge for pancreas transplant recipients. Transplantation 76: 918–923. [crossref]
  46. Troxell ML, Koslin DB, Norman D, et al. (2010) Pancreas allograft rejection: analysis of concurrent renal allograft biopsies and posttherapy follow-up biopsies. Transplantation 90: 75–84.
  47. Gruessner RWG, Sutherland D, Kandaswamy R, et al. (2008) Over 500 solitary pancreas transplants in nonuremic patients with brittle diabetes mellitus. Transplantation 85: 42–47.
  48. Shapiro AM, Lakey JR, Ryan EA, et al. (2000) Islet transplantation in seven patients with type 1 diabetes mellitus using a glucocorticoid-free immunosuppressive regimen. N Engl J Med 343: 230–38.
  49. Schuetz C, Anazawa T, Cross SE, Labriola L, Meier RPH, et al. (2018) β Cell Replacement Therapy: The Next 10 Years. Transplantation 102: 215–229. [crossref]
  50. Scalea JR, Sultan S, Lamos EM, Bartlett ST, Barth RN (2018) Improvement in Pancreas Transplant Evaluation and Surgical Volume Using a Multidisciplinary Approach. Am J Transplant 18: 1295–1296.

Plasma Visfatin is reduced in Subjects with the Metabolic Syndrome and Pre-Diabetes

DOI: 10.31038/EDMJ.2018234

Abstract

The adipocytokine Visfatin (VF) has been linked with visceral adiposity, insulin resistance and Metabolic Syndrome (MS), however, studies have been inconsistent regarding its relationship with these metabolic enteties. The aim of this study was to explore the relationships between plasma VF, High Molecular Weight (HMW) Adiponectin and the MS.

We measured fasting plasma VF and HMW Adiponectin in 29 males with the MS and 29 age-matched male controls. Plasma VF was significantly reduced in MS subjetcs compared to controls (98.2 ± 29.7 Vs.141.4 ± 39.1 ng/ml, respectively, P=0.04). One Way ANOVA showed that subjects with MS and pre-diabetes had extremely lower concentrations of plasma VF (60.8 ± 35.9 Vs141.4 ± 39.1 ng/ml ), for MS and controls, respectively, P < 0.009. HMW Adiponectin concentrations were similar in both groups and negatively correlated with HOMA-IR(r = -0.40, P= 0.03). Using Stepwise regression, WC was independently associated with plasma VF concentrations. There was no correlation between plasma VF and insulin sensitivty or beta cell function measured with HOMA-IR and HOMA % B, respectively.

In conclusion: Reduced plasma VF concentrations may play a role in the pathophysiology of pre-diabetes and cardiometabolic risk, however, this will require further study.

Keywords

Metabolic Syndrome, Visfatin, HMW adiponectin

Introduction

Visceral adipose tissue produces a number of adipocytokines such as adiponectin, tumour necrosis factor-alpha, and interlukin (IL)-6, which modulate insulin sensitivity and appear to play an important role in the pathogenesis of insulin resistance, diabetes, inflammation and atherosclerosis [1–3]. Visfatin (VF) is a recently discovered adipocytokine that was first described by Fukuhara and colleagues in 2005 as being exclusively secreted by visceral fat and had insulin-mimetic properties [4]. VF corresponds to a 52 kilodalton cytokine known as Pre-B- Cell Colony-Enhancing Factor or (PBEF) responsible for maturation of B cell precursors [5]. VF/PBEF has also been shown to be an enzyme that catalyses the rate-limiting step in the Nicotinamide Adenine Dinucleotide (NAD) biosynthetic pathway and is known as nicotinamide phosphoribosyltransferase or ‘Nampt’ [6]. Nampt exists in two forms: intracellularly as ‘iNampt’ and extracellularly as ‘eNampt’; the latter corresponds to VF/PBEF [7]. Administration of exogenous VF to animal models of acute myocardial infarction was shown to be cardioprotective [8]. Moreover, Revollo and colleagues showed that Nampt is essential for normal beta cell function when they demonstrated that Nampt (+/-) heterozygous mice had defects in both NAD biosynthesis and Glucose-Stimulated Insulin Secretion (GSIS) [9]. Interestingly, Nampt(+/-) heterozygous mice developed impaired glucose tolerance and the administration of NMN(the product of Nampt reaction) corrected the defects in GSIS and restored normal glucose tolerance [9]. However, in human beings, the relationship between VF/PBEF/eNampt and the metabolic syndrome (MS), insulin resistance, obesity, and cardiovasular disease has been controversal, as evidenced by the conflicting results from published work [10–12] . It is well established that higher concentartions of plasma adiponectin have been shown to be cardioprotective while reduced concentrations of plasma adiponectin have been linked to cardiovascualr disease insulin resistance, obesity and the MS [13–15]. We hypothesed that subjects with the MS, who are at increased risk of developing type 2 diabetes and cardiovascular disease, would have reduced concentrations of circulating plasma VF. We also measured HMW Adiponectin, the active form among adiponectin multimers.

Research Design, Subjects and Methods

This was a cross-sectional study. Construction workers were screened for diabetes, pre-diabetes and cardiometabolic risk factors as part of a pilot health screening programme conducted by the Construction Workers’ Health Trust (CWHT). Data including demographics, anthropometric measurments, FindRisk diabetes questionnaire, and laboratory results were prospectively entered into a central database. The study population was predominantly male (99 %). A random sample of exclusively male subjects was taken from the central database for the purpose of this study . The full details of the study can be found in the Construction Workers Health Trust screening study [16]. The study protocol was approved by the Joint Research Ethics Committee of the Federated Dublin Voluntary Hospitals and St James’ Hospital. All participants signed written informed consent.

Measurement of Biomarkers

Body weight and height were measured in participants wearing light clothing without shoes. BMI was calculated as weight in kilograms divided by height in meters square. Waist circumference was measured at the level of the umbilicus. Hip circumference was measured at the level of the anterior superior iliac spine. Blood pressure was measured in the sitting position after a 10-min rest period in the left arm. Blood samples were taken in the morning after a 12-hour overnight fast. All measurements and samples were obtained at the healthcare centres provided at construction work sites.

Laboratory Analysis

Fasting bloods were obtained after 12 hours fast and included the following: plasma glucose, lipid profile, insulin, plasma visfatin, and plasma HMW adiponectin. Plasma glucose was measured using a glucose oxidase method [bio Merieux kit/ Hitachi Modular]. Plasma total cholesterol and triglycerides were measured using enzymatic methods (Human Liquicolor kits/ Hitachi Modular). Plasma high-density lipoprotein [HDL] cholesterol and Low-Density Lipoprotein (LDL) cholesterol were measured directly with enzymatic methods (Randox direct Kits/ Hitachi Modular).

Visfatin and HMW Adiponectin Assays

VF was measured in fasting EDTA plasma samples by a specific Enzyme-Linked Immunosorbent Assay (ELISA) [linear range, 0.1–1000 ng/mL; specificity, 100% human) [17], obtained from Phoenix Pharmaceuticals Inc. (Karlsruhe, Germany). The intra-assay coefficient of variation was 5.6% and 5.8% for low and high VF concentrations, respectively. Data were expressed as absolute concentrations.

HMW Adiponectin was determined from fasting EDTA plasma sample by ELISA detection [Millipore]. For measurement of high molecular weight adiponectin plasma samples were extracted with protease treatment following manufacturer’s instructions. Sensitivity of the assay is 0.5ng/ml and the coefficients of intra-assay variations were 0.97–3.41%.

Insulin Sensitivity and Beta Cell Function

Insulin sensitivity was estimated using the homeostasis model assessment for insulin resistance index (HOMA-IR); beta cell function was assessed by HOMA-B. Both HOMA-IR and HOMA-B was quantified using a HOMA calculator as previously described [18].

Glucose Metabolism

All subjects had fasting plasma glucose as screening test and those who had impaired fasting glucose (IFG) of ≥ 5.6 mmol/l underwent a 2- hour oral glucose tolerance test (OGTT) . Subjects were further sub-classified as having impaired glucose tolerance (IGT) if the 2-hours postprandial glucose value was between 7.8 – 11.0 mmol/l or diabetes if the fasting plasma glucose value was ≥ 7.0 mmol/l and/or 2-hours postprandial glucose value ≥ 11.1 mmol/l.

Definition of the Metabolic Syndrome

The Metabolic Syndrome (MS) was defined according to the International Diabetes Federation (IDF) criteria [19] Subjects with the MS were further divided according to the results of oral glucose tolerence and fasting plasma glucose results: subjects with MS and Normal Glucose Tolerance (NGT) were referred to as (NGT-MS); subjects with MS and (IFG) as IFG-MS, and subjects with MS and IGT as (IGT-MS). We excluded subjects with previously diagnosed diabetes, as they have established cardiovascular risk and their inclusion as MS is controversial.

Statistical Analysis

The demographic characteristics of study participants are presented as mean +/- SEM. Since VF, HMW Adiponectin and the other biomarkers were not normally distributed; Mann-Whitney test was used to test the differences between subjects with the MS and controls. Spearman’s correlations were used to examine correlations between VF, HMW Adiponectin and the other biomarkers. Logarithmic transformations of the biomarkers were used in One Way ANOVA to compare the differences in VF and HMW adiponectin levels between the subgroups of the MS and the controls. Also, logarithmic transformations of the biomarkers were used in stepwise multiple regression analyses to identify the independent predictors of VF and HMW Adiponectin. All statistical analyses were performed using SPSS (SAS, Version 13). Statistical significance was set at P<0.05

Results

The baseline characteristics of the study subjects are shown in Table 1. As expected, subjects with MS had significantly higher BMI, Waist Circumference (WC), Fasting Plasma Glucose (FPG), Triglycerides (TGs) and Waist Hip Ratio (WHR). MS subjects were more insulin resistant compared to controls (Table 1). Systolic BP was marginally higher in MS subjects; LDL-cholesterol, total cholesterol and beta cell function (HOMA-B) were not different between the two groups. MS subjects had significantly higher FINDRISC score, indicating increased lifetime risk for developing type 2 diabetes [20].

Table 1. Baseline characteristics of the study subjects.

Biomarker

MS Subjects
(N=29)

Controls
(N=29)

P value

Age, Years

43.5 ± 2.0

39.1 ± 1.8

0.133

BMI, kg/m2

30.7 ± 0.8

27.2 ± 0.8

0.002

Waist Circumference(WC), cm

108 ± 2.

96 ± 2

<0.0001

Waist: Hip Ratio(WHR)

1.01 ± 0.1

0.97 ± 0.01

0.004

Systolic BP, mmHg

137 ± 2

132 ± 3

0.08

Diastolic BP, mmHg

85 ± 2

82 ± 2

0.17

Fasting plasma glucose, mmol/l

5.4 ± 0.1

4.9 ± 0.1

0.012

HDL-Cholesterol , mmol/l

1.06 ± 0.03

1.24 ± 0.1

0.005

Triglycerides, mmol/l

1.8 ± 0.1

1.1 ± 0.1

<0.0001

Total Cholestrol, mmol/l

5.13 ± 0.13

5.06 ± .016

0.56

Fasting Insulin, pmol/l

60.6 ± 4.5

51.9 ± 11

0.004

HOMA-IR

1.15 ± 0.08

0.96 ± 0.1

0.004

HOMA % B

90.1 ± 5

88.5 ± 8.2

0.29

HOMA % S

101.6 ± 8

160.9 ± 16.6

0.003

FindRisk Score

10

6

0.002

Visfatin (VF), ng/ml

98.2 ± 29.7

141.4 ± 39.1

0.041

HMW Adiponectin, ng/ml

4103 ± 610

4074 ± 434

0.36

Data presented as mean ± SEM. SEM=Standard error of the mean. P value obtained from Mann Whitney test.

Plasma Visfatin and HMW Adiponectin

Subjects with the MS had significantly reduced circulating concentrations of plasma VF compared to controls (98.2 ± 29.7 vs.141.4 ± 39.1 ng/ml, P=0.041), as shown in Table 1. One Way ANOVA showed that subjects with the MS and pre-diabetes (IFG/IGT) had significantly lower VF concentrations 60.8 ± 35.9 ng/ml when compared to controls(141 ± 39.1 ng/ml), P =0.009), and marginally lower VF concentrations when compared with subjects with the MS and normal glucose metabolism(133.2 ± 46 ng/ml), P=0.05, as shown in Figure 1. Likewise, Mean HMW adiponectin levels were similar between the two groups(4103 ± 610 ng/ml in MS subjects vs. 4074 ± 434 ng/ml in controls, P=0.36). One-Way ANOVA showed that subjects with MS and pre-diabetes had slightly lower concentrations of HMW adiponectin compared to both subjects with MS and normal glucose tolerance and controls, however, it did not reach statistical significance (Table 3).

Table 2. Spearman’s correlations between plasma VF, HMW Adiponectin and the different biomarkers in the whole group.

Biomarker

Visfatin
N=58

HMW adiponectin
N=58

Weight

r = -0.316, P=0.016

r = -0.13, P=0.43

BMI

r= -0.30, P=0.02

r = -0.05, P=0.68

WC

r= -0.33, P=0.012

r = -0.07, P=0.60

Age

r= -.26, P=0.053

r = 0.10, P=0.43

SBP

r = -0.15, P= 0.26

r = -0.09, P=0.46

DBP

r = -0.23, P=0.07

r = 0.08, P=0.53

TGs

r = – 0.08, P =0.52

r = -0.19, P= 0.15

FPG

r = -0.32, P = 0.015

r= -0.04, P=0.70

Fasting insulin

r= 0.15, P=0.28

r = 0.16, P=0.22

HOMA-IR

r = 0.15, P=0.27

r= -0.17, P=0.20

HOMA % B

r =0.09, P=0.48

r = 0.48, P=0.22

HDL-C

r = -0.10, P=0.41

r = 0.46, P=0.0001

FINDRISC score

r = -0.26, P=0.052

r =0.09, P=0.51

Table 3. One Way ANOVA. Plasma Visfatin and HMW Adiponectin levels according to metabolic syndrome status and glucose metabolism.

Biomarker

Controls

N=(29)

NGT+ MS

N=(15)

IFG/IGT+MS

(N=14)

P value

Mean plasma Visfatin, ng/ml

141.4 ± 43

133.2 ± 46

60.8 ± 35.9 ¥

Mean plasma HMW Adiponectin, ng/ml

4074.4 ± 433.6

4592.8 ± 920

3613.6 ± 812

 NS

HOMA-IR

0.96 ± 0.2

0.97 ± 0.1

1.3 ± 0.1

HOMA % S

160.9 ± 16.7

118 ± 11.7

82.8 ± 8.5

HOMA % B

88.5 ± 8

100.7 ± 7

77.8 ± 5.7

NS

One way ANOVA comparing mean Visfatin and HMW Adiponectin concentrations between the groups.
NGT+MS: Normal Glucose Tolerant Subjects with Metabolic Syndrome.
IGT+MS: Impaired Glucose Tolerant Subjects with the Metabolic Syndrome.
IFG+MS: Subjects with Metabolic Syndrome and Impaired Fasting Glucose.
¥P value < 0.009 between controls and IFG/IGT+MS.
P =0.05 between NGT+MS and IFG/IGT+MS.
NS: No Significant difference between the groups P > 0.05.
P value= 0.011 between controls and IFG/IGT+MS.
P value < 0.009 between controls and IFG/IGT+MS.

EDMJ 2018-107 - Imad Brema Saudi Arabia_F1

Figure 1. One Way ANOVA comparing mean Visfatin concentrations between the groups.

NGT MS: normal glucose tolerance metabolic syndrome; IGT: impaired glucose tolerance; IFG: impaired fasting glucose. NS: not significant. Error bars represent standard error of the mean.

Correlations between Visfatin, HMW adiponectin and other biomarkers

Spearman’s correlations between VF, HMW adiponectin and the different biomarkers are shown in Table 2.

In the whole group, VF negatively correlated with FPG ( r= -0.31, P=0.015), WC (r= -0.32, P=0.012), Weight (r=-.316, P=0.016) and BMI (r= -0.30, P=0.02), as shown in Table 2. There was a negative correlation between plasma VF and the FINDRISC score with marginal statistical significane (r=-.26, P=0.052). In MS subjects alone , VF negatively correlated with FPG, (r= -0.34 p=0.018).

VF did not correlate with fasting insulin, HOMA-IR or HOMA-B in either group.

HMW adiponectin levels positively correlated with HDL-Cholesterol (HDL-C) in MS subjects (r= 0.43, P=0.02), as well as in the whole group (r= -0.46, P <0.0001). In MS subjects alone, HMW adiponectin negatively correlated with fasting insulin(r=-0.40, P=0.037) and HOMA-IR (r=-0.40, P=0.038).

There was no significant correlation between VF and HMW adiponectin in the whole group or in each group seperately.

Multiple stepwise regression analysis showed that log WC was negatively and independently associated with VF, in a model that included log VF as the dependenet variable, and log WC, log FPG and log fasting TGs as independent variables. This model showed an R2 of 0.100 and P=0.016. β-coefficient was -3.522. WC explained 10 % of VF variance. Likewise, log HDL-C was positively and independently associated with log HMW Adiponectin in a model that included HMW Adiponetin as the depenent variable and log HOMA-IR, log HDL-C and log WC as independent variables. β-coefficient: 1.42, P=0.001. log HDL-C explained 19.7 % of the variation in log HMW adiponectin.

Discussion

In the present study, we showed that male subjects with increased cardiometabolic risk profile and insulin resistance had significantly reduced concentrations of plasma VF, which negatively correlated with FPG, WC, weight and BMI . Moreover, we showed that subjetcs with the MS and pre diabetes had very low concentrations of plasma VF not only when compared to controls, but also when compared to subjects the MS and normal glucose tolerance, although with marginal statistical significnace. In addition, we showed a non-significnat trent of a negative correlation between plasma VF and the FindRisk score, which suggests that lower concentations of plasma VF may be associated with increased lifetime risk of developing type 2 diabetes but this oservation requires further clarification in a larger study. The inverse and independant association between plasma VF and WC in the stepwise regression may indicate an indirect relationship between reduced plasma VF concentrations and the risk of developing type 2 diabetes and cardiovascular disease, however, again this requires further exploration in future studies as causality could not be assumed from our cross-sectional study. Several studies have explored the relationship between VF and the MS in the past few years with conflicting results. In agreement with our study, plasma Visfatin/Nampt levels has been shown to be reduced in patients with MS and type 2 diabetes in one study [21]. Most studies repored increased plasma VF concentration was shown to be increased in subjects with MS in two previous studies [11, 22–24]. Three more studies found no association between plasma VF and the MS [12, 25, 26]. It is worthwhile mentioning that the patient characteristics and/or the criteria for defining the MS were different in all the three studies mentioned above and this may have affected the results. The mechanisms underlying the association between low plasma VF concentrations and the MS in our study are not fully understood, however, a possible mechanism may be through the modification of the activity of the downstream target, SIRT1 which may be supported by the findings of De Kreutzenberg and colleagues, who showed that subjects with the MS and increased insulin resistance had reduced SIRT1 gene and protein expression [27]. Moreover, the same authors showed that high glucose and palmitate concentrations resulted in downregulation of Nampt (Visfatin expression, a reduction in intracellular NAD (+) levels and a reduction in SIRT1 activity in mononuclear cells from subjects with MS [27]. A more recent study by Yoshino and colleagues reported that Nampt-mediated NAD+ biosynthesis is severely compromised in both diet and age-induced models of diabetes in mice [28] . Interestingly, the authors showed that Nicotine Mononucleotide ( NMN), the product of Nampt reaction, was effective to treat the two different animal models of diabetes [28]. Moreover, Revollo and colleagues showed that Nampt is essential for normal beta cell function when they demonstrated that Nampt (+/-) heterozygous mice had defects in both NAD biosynthesis and glucose-stimulated insulin secretion (GSIS) [9]. Interestingly, Nampt (+/-) heterozygous mice developed impaired glucose tolerance and the administration of NMN (the product of Nampt reaction) corrected the defects in GSIS and restored normal glucose tolerance. In our study, we did not find any correlation between fasting plasma VF and insulin sensitivity measured by HOMA-IR, which is in agreement with several other studies which showed lack of association between Plasma VF and insulin resistance [29–31]. We found no correlation between Plasma VF and beta cell function measured by HOMA-B neither in the controls nor in subjects with the MS. The relationship between VF and beta cell function is being explored by some authors since VF is important for glucose-stimulated-insulin secretion from beta cells. One study in animals showed that VF reduced the degree of apoptosis of beta cells due to exposure of cell lines to interferon Gamma [32]. However, in human beings serum VF has been shown to increase with progressive beta cell failure in healthy males in a previous study, again adding to inconsistency of evidence regarding this molecule [33]. Several studies described significant increase in plasma VF concentrations after different types of bariatric surgery in morbidly obese subjects [34–36]. Moreover, Haider and colleagues showed that treatment with the insulin sensitizer rosiglitazone increased both plasma VF and adiponectin in HIV-positive, insulin resistant subjects [37]. However, opposite results have also been reported where plasma VF has been shown to decrease after bariatric surgery as well [38] . Therefore, it is difficult to draw any conclusions about whether is beneficial or reduced levels of plasma VF are useful or harmful, unlike the case with adiponectin, where low levels have been consistently shown to be associated with type 2 diabetes, insulin resistance, and the risk for cardiovascular disease in may studies [39–41] . We may speculate that previously described increased concentrations of plasma VF in some studies in subjects with type 2 diabetes, MS and obesity may represent a compensatory mechanism to increase GSIS and improve glucose tolerance. Another explanation for the inconsistencies in published work on VF could be due to differences in immunoassays used by different research groups, as previously reported by Korner and colleagues [42]. A Third explanation for the inconsistency in VF work may be due to the presence of two iso-forms for eNampt (monomeric and diameric forms) and it has been shown that serum monomeric eNAMPT levels were elevated in HFD-fed mouse models of diabetes, whilst eNAMPT-dimer levels were unchanged. Very interestingly, eNAMPT-monomer neutralisation in HFD-fed mice with anti-monomeric eNampt antibodies resulted in lower blood glucose levels, amelioration of impaired glucose tolerance and whole-body insulin resistance, improved pancreatic islet function, and reduced inflammation [43]. Therefore, investigators should cleary indicate in future studies what iso-form of VF/Nampt was measured . We expected to see lower concentrations of plasma HMW adiponectin in subjects with the MS however, this may be due to the small sample size, however, HMW adiponectin was negatively correlated with HOMA-IR in subjects with the MS in our study, which is in agreement with previous studies that described association of reduced HMW adiponectin isoforms with the risk of insulin resistance and type 2 diabetes. There was no correlation between VF and HMW Adiponectin in this study but a previous study described a negative correlation between plasma Adiponectin and VF in patients with Rheumatoid Arthritis [44].

We acknowledge that this study has some limitations including the small sample size, the cross-sectional design and the use of HOMA-IR and HOMA-B as crude measures for assessing of insulin sensitivity and beta cell function, respectively. Also lack of simultaneous measurement of VF and HMW Adiponectin mRNA expressions in visceral and subcutaneous fat depots and their correlation with serum levels is yet another limitation.

In conclusion, we report reduced circulating concentrations of plasma VF in subjects with the MS compared to age and gender-matched controls, with extremely low concentrations of plasma VF in subjects with the MS and pre-diabetes. The findings of this study point towards a possible relationship between reduced concentrations of plasma VF and increased cardiometabolic risk and pre-diabetes , however, it is not clear from this study whether low plasma VF concentrations acts as a mediator or a marker of cardio metabolic risk and pre-diabetes. Further mechanistic studies are needed to explore this important relationship.

Acknowledgement

We would like to thank the Construction Workers’ Health Trust and all the study volunteers for their participation in this study. Many thanks to the staff nurses in the metabolic research unit

Funding

This study was funded by the Diabetes Education and Research Fund and the CWHT.

Authors’ contribution

Imad Brema: Study design and conception, data collection, statistical analysis, manuscript writing

Hood Thabit: Data collection, manuscript writing

Shabahat Shah: Data collection, manuscript writing

Nicole Burns: Data collection, manuscript writing

Declan Gasparro: Laboratory analysis of plasma samples for glucose, lipids, insulin

Vivion Crowley: Laboratory analysis,

Angela Storka: Visfatin and HMW Adiponectin assays

Michael Wolzt: Visfatin and HMW Adiponectin assays, manuscript writing

John J Nolan: Study design, data analysis, manuscript writing.

Abbreviations

CWHT: Construction Workers’ Health Trust

GSIS: Glucose-Stimulated-Insulin Secretion

HFD: High Fat Diet

HOMA-B: Homeostasis Model Assessment for Beta Cell Function

HOMA-IR: Homeostasis Model Assessment for Insulin Resistance Index

IDF: International Diabetes Federation

IFG-MS: Impaired Fasting Glucose Subject with Metabolic Syndrome

IFG: Impaired Fasting Glucose

IGT-MS: Impaired Glucose Tolerant Subject with Metabolic Syndrome

IGT: Impaired Glucose Tolerance

IL-6: Interlukin-6

MS: Metabolic Syndrome

Nampt: Nicotinamide Phosphoribosyl transferase

NAD: Nicotinamide Adenine Dinucleotide

NGT: Normal Glucose Tolerance

NGT-MS: Normal Glucose Tolerant Subject With Metabolic Syndrome

NMN: Nicotinamide Mononucleotide

OGTT: Oral Glucose Tolerance Test

PBEF: Pre-B- Colony Enhancing Factor

Sir1: Silent Information Regulator 1

VF : Visfatin

References

  1. Kershaw EE, Flier JS (2004) Adipose tissue as an endocrine organ. J Clin Endocrinol Metab 89: 2548–2556. [crossref]
  2. Arner P (2005) Insulin resistance in type 2 diabetes — role of the adipokines. Curr Mol Med 5: 333–339. [crossref]
  3. Fantuzzi G (2005) Adipose tissue, adipokines, and inflammation. J Allergy Clin Immunol 115: 911–919. [crossref]
  4. Fukuhara A, Matsuda M, Nishizawa M, Segawa K, Tanaka M, et al. (2005) Visfatin: a protein secreted by visceral fat that mimics the effects of insulin. Science 307: 426–430. [crossref]
  5. Samal B, Sun Y, Stearns G, Xie C, Suggs S, et al. (1994) Cloning and characterization of the cDNA encoding a novel human pre-B-cell colony-enhancing factor. Mol Cell Biol 14: 1431–1437. [crossref]
  6. Revollo JR, Grimm AA, Imai S (2004) The NAD biosynthesis pathway mediated by nicotinamide phosphoribosyl transferase regulates Sir2 activity in mammalian cells. J Biol Chem 279: 50754–50763.
  7. Wang T, Zhang X, Bheda P, Revollo JR, Imai S, et al. (2006) Structure of Nampt/PBEF/visfatin, a mammalian NAD+ biosynthetic enzyme. Nat Struct Mol Biol 13: 661–662. [crossref]
  8. Lim SY, Davidson SM, Paramanathan AJ, Smith CC, Yellon DM, et al. (2008) The novel adipocytokine visfatin exerts direct cardioprotective effects. J Cell Mol Med 12: 1395–403.
  9. Revollo JR, Korner A, Mills KF, Satoh A, Wang T, et al. (2007) Nampt/PBEF/Visfatin regulates insulin secretion in beta cells as a systemic NAD biosynthetic enzyme. Cell Metab 6: 363–375.
  10. Filippatos TD, Derdemezis CS, Kiortsis DN, Tselepis AD, Elisaf MS (2007) Increased plasma levels of visfatin/pre-B cell colony-enhancing factor in obese and overweight patients with metabolic syndrome. J Endocrinol Invest 30: 323–326.
  11. Zhong M, Tan HW, Gong HP, Wang SF, Zhang Y, et al. (2008) Increased serum visfatin in patients with metabolic syndrome and carotid atherosclerosis. Clin Endocrinol (Oxf) 69: 878–884.
  12. Lin CC, Lai MM, Li TC, Li CI, Liu CS, et al. (2009) Relationship between serum retinol-binding protein 4 and visfatin and the metabolic syndrome. Diabetes Res Clin Pract 85: 24–29.
  13. Ntzouvani A, Fragopoulou E, Panagiotakos D, Pitsavos C, Antonopoulou S (2016) Reduced circulating adiponectin levels are associated with the metabolic syndrome independently of obesity, lipid indices and serum insulin levels: a cross-sectional study. Lipids Health Dis 15: 140.
  14. Wang W, Xing W, Zhang H, Ding M, Shang L, et al. (2013) Reduced high-molecular-weight adiponectin is an independent risk factor for cardiovascular lesions in hypercholesterolaemic patients. Clin Endocrinol (Oxf) 78: 539–544.
  15. Hojlund K, Frystyk J, Levin K, Flyvbjerg A, Wojtaszewski JF, et al. (2006) Reduced plasma adiponectin concentrations may contribute to impaired insulin activation of glycogen synthase in skeletal muscle of patients with type 2 diabetes. Diabetologia 49: 1283–1291.
  16. Thabit H, Burns N, Shah S, Brema I, Crowley V, et al. (2013) Prevalence and predictors of diabetes and cardiometabolic risk among construction workers in Ireland: the Construction Workers Health Trust screening study. Diab Vasc Dis Res 10: 337–345.
  17. Chen MP, Chung FM, Chang DM, Tsai JC, Huang HF, et al. (2006) Elevated plasma level of visfatin/pre-B cell colony-enhancing factor in patients with type 2 diabetes mellitus. J Clin Endocrinol Metab 91: 295–299.
  18. Levy JC, Matthews DR, Hermans MP (1998) Correct homeostasis model assessment (HOMA) evaluation uses the computer program. Diabetes Care 21: 2191–2192.
  19. Alberti KG, Zimmet P, Shaw J; IDF Epidemiology Task Force Consensus Group (2005) The metabolic syndrome–a new worldwide definition. Lancet 366: 1059–1062. [crossref]
  20. Lindström J, Tuomilehto J (2003) The diabetes risk score: a practical tool to predict type 2 diabetes risk. Diabetes Care 26: 725–731. [crossref]
  21. Schindler K, Vila G, Hoppichler F, Lechleitner M, Luger A, et al. (2012) The impact of type 2 diabetes on circulating adipokines in patients with metabolic syndrome. Obes Facts 5: 270–276. [crossref]
  22. Filippatos TD, Derdemezis CS, Gazi IF, Lagos K, Kiortsis DN, et al. (2008) Increased plasma visfatin levels in subjects with the metabolic syndrome. Eur J Clin Invest 38: 71–72. [crossref]
  23. de Luis DA, Aller R, Gonzalez Sagrado M, Conde R, Izaola O, et al. (2013) Serum visfatin levels and metabolic syndrome criteria in obese female subjects. Diabetes Metab Res Rev 29: 576–581.
  24. Kocelak P, Olszanecka-Glinianowicz M, Owczarek AJ, Krupa W, Obirek P, et al. (2015) Plasma visfatin/nicotinamide phosphoribosyltransferase (visfatin/NAMPT) concentration in elderly subjects with metabolic syndrome. Polskie Archiwum Medycyny Wewnetrznej 125: 402–413.
  25. Guducu N, Isci H, Gormus U, Yigiter AB, Dunder I. (2013) Serum visfatin levels do not increase in post-menopausal women with metabolic syndrome. J Endocrinol Invest 36: 157–161.
  26. Jialal I, Devaraj S, Kaur H, Adams-Huet B, Bremer AA (2013) Increased chemerin and decreased omentin-1 in both adipose tissue and plasma in nascent metabolic syndrome. J Clin Endocrinol Metab 98: 514–517.
  27. de Kreutzenberg SV, Ceolotto G, Papparella I, Bortoluzzi A, Semplicini A, et al. (2010) Downregulation of the longevity-associated protein sirtuin 1 in insulin resistance and metabolic syndrome: potential biochemical mechanisms. Diabetes 59: 1006–1015.
  28. Yoshino J, Mills KF, Yoon MJ, Imai S (2011) Nicotinamide mononucleotide, a key NAD(+) intermediate, treats the pathophysiology of diet- and age-induced diabetes in mice. Cell Metab 14: 528–536. [crossref]
  29. Pagano C, Pilon C, Olivieri M, Mason P, Fabris R, et al. (2006) Reduced plasma visfatin/pre-B cell colony-enhancing factor in obesity is not related to insulin resistance in humans. J Clin Endocrinol Metab. 91: 3165–3170.
  30. Brema I, Hatunic M, Finucane F, Burns N, Nolan JJ, Haider D, et al. (2008) Plasma visfatin is reduced after aerobic exercise in early onset type 2 diabetes mellitus. Diabetes, obesity & metabolism 10: 600–602.
  31. Dogru T, Sonmez A, Tasci I, Bozoglu E, Yilmaz MI, et al. (2007) Plasma visfatin levels in patients with newly diagnosed and untreated type 2 diabetes mellitus and impaired glucose tolerance. Diabetes Res Clin Pract 76: 24–29.
  32. Xiang RL, Mei M, Su YC, Li L, Wang JY, et al. (2015) Visfatin Protects Rat Pancreatic beta-cells against IFN-gamma-Induced Apoptosis through AMPK and ERK1/2 Signaling Pathways. Biomed Environ Sci 28: 169–177.
  33. Lopez-Bermejo A, Chico-Julia B, Fernandez-Balsells M, Recasens M, et al. (2006) Serum visfatin increases with progressive beta-cell deterioration. Diabetes 55: 2871–2875.
  34. Krzyzanowska K, Mittermayer F, Krugluger W, Kopp HP, Schernthaner G (2006) Increase in visfatin after weight loss induced by gastroplastic surgery. Obesity (Silver Spring) 14: 1886–1889.
  35. Garcia-Fuentes E, Garcia-Almeida JM, Garcia-Arnes J, Garcia-Serrano S, Rivas-Marin J, et al. (2007) Plasma visfatin concentrations in severely obese subjects are increased after intestinal bypass. Obesity (Silver Spring) 15: 2391–2395.
  36. Botella-Carretero JI, Luque-Ramirez M, Alvarez-Blasco F, Peromingo R, San Millan JL, et al. (2008) The increase in serum visfatin after bariatric surgery in morbidly obese women is modulated by weight loss, waist circumference, and presence or absence of diabetes before surgery. Obes Surg 18: 1000–1006.
  37. Haider DG, Schindler K, Mittermayer F, Müller M, Nowotny P, et al. (2007) Effect of rosiglitazone on visfatin and retinol-binding protein-4 plasma concentrations in HIV-positive patients. Clin Pharmacol Ther 81: 580–585. [crossref]
  38. Haider DG, Schindler K, Schaller G, Prager G, Wolzt M, et al. (2006) Increased plasma visfatin concentrations in morbidly obese subjects are reduced after gastric banding. J Clin Endocrinol Metab 91: 1578–1581.
  39. Hara K, Yamauchi T, Imai Y, Manabe I, Nagai R, et al. (2007) Reduced adiponectin level is associated with severity of coronary artery disease. Int Heart J 48: 149–153.
  40. Linscheid P, Christ-Crain M, Stoeckli R, Reusch CE, Lutz TA, et al. (2008) Increase in high molecular weight adiponectin by bariatric surgery-induced weight loss. Diabetes Obes Metab 10: 1266–1270.
  41. Otto C, Otto B, Goke B, Pfeiffer AF, Lehrke M, Vogeser M, et al. (2006) Increase in adiponectin levels during pioglitazone therapy in relation to glucose control, insulin resistance as well as ghrelin and resistin levels. J Endocrinol Invest 29: 231–236.
  42. Körner A, Garten A, Blüher M, Tauscher R, Kratzsch J, et al. (2007) Molecular characteristics of serum visfatin and differential detection by immunoassays. J Clin Endocrinol Metab 92: 4783–4791. [crossref]
  43. Kieswich J, Sayers SR, Silvestre MF, Harwood SM, Yaqoob MM, et al. (2016) Monomeric eNAMPT in the development of experimental diabetes in mice: a potential target for type 2 diabetes treatment. Diabetologia
  44. El-Hini SH, Mohamed FI, Hassan AA, Ali F, Mahmoud A, et al. (2013) Visfatin and adiponectin as novel markers for evaluation of metabolic disturbance in recently diagnosed rheumatoid arthritis patients. Rheumatol Int 33: 2283–2289.

Extracorporeal Shockwave Therapy (ESWT) and Peripheral Magnetic Stimulation (Super Inductive System) Promotes Healing of Tibial Fracture Non-Union Unresponsive to Conventional Therapy: A Case Report

DOI: 10.31038/IJOT.2018113

Introduction

Delayed and nonunion of the tibia are not uncommon in medical practice and are associated with a significant impact on patients’ quality of life and health care cost. Extracorporeal shockwave therapy (ESWT) has been shown to improve osseous healing in vitro and in vivo. In this case we are presenting the impact of ESWT in combination with peripheral pulsed magnetic stimulation (Super Inductive System) in a 60 years old male patient who suffered for 7 months with a nonunion spiral right tibial fracture during skiing. In the initial evaluation patient was walking using a tall ankle foot support (walking boot) and two maxillary crutches.

Material and Method

ESWT coupled with high intensity pulsed peripheral pulsed magnetic stimulation and post treatment mobilization. ESWT parameters consisted of frequency 20Hz, 4000 shocks per session and pressure of 4 bars, energy flux density of 0.5 J/mm2. Super Inductive System parameters consisted of frequency 5Hz,10 minutes duration per session and intensity 40% of 3 Tesla. Patient received one session per week and 8 sessions in total.

Results

Outcome measures included verbal pain rating scale (VAS: 1/10 versus Vas: 6/10), radiographing imaging improvement, obvious after first 4 sessions already (see photos) and a return to activities of daily living (ADLs) with normal gait pattern without using the ankle foot support (walking boot) and the maxillary crutches 1 month post treatment.

Discussion

This case demonstrates the successful boosting of bone regenerative healing process in management of tibia non union. The procedure is well tolerated, time-saving, lacking side effects, with potential to significantly decrease of health care costs and improvement of patient’s Quality of life.

Conclusion

A combination of ESWT and peripheral pulsed magnetic stimulation is a feasible treatment combination which seems to accelerate tibia nonunion fracture.

X-ray of Tibia1 month post treatment

IJOT2018-103-F1

References

  1. d’Agostino MC, Craig K, Tibalt E, Respizzi S (2015) Shock wave as biological therapeutic tool: From mechanical stimulation to recovery and healing, through mechanotransduction. Int J Surg 24: 147–153. [Crossref]
  2. Elster EA, Stojadinovic A, Forsberg J, Shawen S, Andersen RC, et al (2010) Extracorporeal shock wave therapy for nonunion of the tibia. J Orthop Trauma 24: 133–141 [Crossref]
  3. Naomi M. Shupak, Frank S. Prato, Alex W. Thomas (2003) Therapeutic uses of pulsed magnetic-field exposure: A review. URSI Radio Science Bulletin 307: 09–32

Long-Term Outcomes in Patients after Discontinuation of Immune Checkpoint Inhibitors

DOI: 10.31038/JCRM.2018132

Abstract

Introduction: Programmed death protein/ligand 1 (PD1/PDL1) inhibitors are approved for several advanced or metastatic malignancies with improvement in both progression free and overall survival. However, there is a paucity of data on optimal treatment duration. Both KEYNOTE-001 and KEYNOTE-006 studies showed durable antitumor activity in approximately 90% of melanoma patients after discontinuation of two-year pembrolizumab treatment, with a median follow up duration of 32 and 33.9 months respectively. To our knowledge, there has been no study that provides similar information for other types of solid cancers. Hence, we report a retrospective single institute experience of the durable response after discontinuation of PD1/PDL1 inhibitors.

Materials & Methods: Data on patients treated with immunotherapy between 2010 and 2017 were collected retrospectively. Patients with all types of cancers who achieved disease control (including stable disease, partial and complete response) and were no longer treated with the immunotherapy for any reason were included. We analyzed the outcomes of these patients after discontinuation of immunotherapy.

Results: We evaluated a total 282 patients with a variety of solid tumor types who were treated with PD1/PDL1 inhibitors; 20 patients met our criteria. Cases were divided into two groups; melanoma (total 8), and non-melanoma (total 12; 3 renal cell, 3 bladder, 1 hepatocellular, 1 colon, and 4 non-small cell lung). As of Jan 2018, 7 out of 8 (88%) in the melanoma group had disease control after a median follow-up of 9 months post-treatment, whereas 8 out of 12 (67%) in non-melanoma group had disease control after a median follow-up of 10 months. The median treatment cycle in the melanoma group was 11.5 cycles (range: 3–20) versus 11 cycles (range: 3–15) in non-melanoma group. The main reason for stopping treatment was patient preference.

Conclusion: Our study shows similar efficacy of durable response in melanoma patients after stopping immunotherapy compared to KEYNOTE studies. Despite limited sample size and short duration of follow-up, our study was the first showing sustained disease control in several non-melanoma cancers after discontinuation of approximately one-year PD1/PDL1 inhibitor treatment. Future prospective malignancy specific trials for optimal duration are warranted.

Keywords

Immunotherapy, long term outcomes, melanoma, non-melanoma

Introduction

Immune checkpoint inhibitors have transformed the field of oncology. This treatment modality has been approved for several solid tumors with improvement in both progression free and overall survival. Yet, there is a paucity of data with respect to the optimal treatment duration and availability of a biomarker to predict treatment response. Both KEYNOTE-001 and 006 studies showed that 24-month disease free survival rate from time of complete remission was 90% vs. 55% after discontinuation of two-year pembrolizumab treatment. To our knowledge, there is no study that reports similar information for other types of solid cancers. As a retrospective single-center experience, we evaluated durable antitumor activity in both melanoma and non-melanoma patients who achieved treatment response (complete, partial or stable) after discontinuation of immunotherapy for any reason.

Materials & Methods

Data on patients treated with immunotherapy from Jan 2010 to Dec 2017 were collected retrospectively. Patients with any type of cancer that achieved a treatment response (complete, partial or stable) and had completed immunotherapy for any reason were included. Patient demographic information including age, sex, primary cancer, prior therapy, total number of doses, and duration of treatment response after discontinuation of therapy and types of response (complete, partial, stable or progression) were obtained. The study approved by local Institutional Review Board (IRB) and the IRB protocol number is 43216.

Results

We evaluated a total 282 patients with a variety of stage IV solid cancers who were treated with immune checkpoint inhibitors. Of that group, 157 patients were treated with nivolumab and 125 patients were treated with pembrolizumab. In this single-center, retrospective study, 20 patients met our eligibility criteria. This cohort was divided into two groups: a melanoma group (total 8), and a non-melanoma group (total of 12; 3 renal cell, 3 bladder, 1 hepatocellular, 1 colon, and 4 non-small cell lung). Patient baseline characteristics are detailed in Table 1.

Table 1. Baseline Characteristics and Outcomes.

Case

Age

Sex

Cancer

Previous Therapy

Total # Treatments (doses)

Reason to Discontinue

Immune-related AEs

Duration of Response (mos)

Outcome

1

60

F

Melanoma

Ipi × 4

Pem × 10

Organizing pneumonia

Organizing pneumonia

28

CR

2

89

F

Melanoma

None

Pem × 17

Patient Request

None

9

CR

3

77

M

Melanoma

None

Pem × 10

Patient Request

None

2.3

CR

4

67

M

Melanoma

Interferon; BRAF

Nivo × 20

RA Exacerbation

RA Exacerbation

9.1

CR

5

90

F

Melanoma

None

Pem × 13

Patient Request

None

5

CR

6

53

F

Melanoma

BRAF

Pem × 8

RA

Hypothyroid & RA

4.6

CR

7

60

M

Melanoma

No

Niv × 8

Pancreatitis

Pancreatitis

4.8

SD

8

87

M

Melanoma

Ipi × 4

Niv × 3

Patient Request

None

16.7

CR

9

67

M

RCC

Pazopanib

Niv × 25

Patient Request

None

6

P

10

40

M

RCC

Sunitinib

Niv × 30

Patient Request

None

11.3

SD

11

74

F

RCC

Pazopanib

Niv × 20

Sjogren

Sjogren

4.2

SD

12

87

M

Bladder

Cis/Gem

Pem x11

Patient Request

None

11

SD

13

58

M

Bladder

Carbo/Gem

Pem × 13

Patient Request

None

10.6

PR

14

70

M

Bladder

Carbo/Gem

Pemx 12

HLH

HLH

12

P

15

58

M

HCC

Embolization

Nivx6

Patient Request

None

11

P

16

79

F

NSCLC

Carbo/pem

Niv x8

Hepatitis

Hepatitis

7

PR

17

78

M

NSCLC

Carbo/Gem

Nivx 18

Patient Request

None

6

P

18

76

F

NSCLC

Unknown

Niv × 24

Patient Request

None

14

SD

19

66

F

NSCLC

None

Pemx 15

Patient Request

None

22.6

CR

20

55

F

Colon

FOLFOX

Pemx9

Peripheral neuropathy

Peripheral neuropathy

8.8

PR

Ipi = ipilimumab; Pem = pembrolizumab; Niv = nivoluamb; Cis/Gem = cisplatin/gemcitabine; Carbo/Gem = carboplatin/gemcitabine; carbo/pem =carboplatin/pemetrexed; FOLFOX = Folinic acid+Fluorouracil+Oxaliplatin; mos= months; AEs = adverse responses; CR = complete response; P = progression; SD = stable disease; PR = partial response; BLE = bilateral lower extremities; RA = Rheumatic arthritis; HLH = Hemophagocytic lymphohistiocytosis.

In melanoma group, the median age was 73 years (range: 44–90), with male and female equally represented. Performance status (Eastern Cooperative Oncology Group, ECOG) for all patients was 0 to 1. Four of the 8 melanoma patients had prior therapies; two patients received four doses of adjuvant ipilimumab and two patients were treated with BRAF inhibitors. Three of the 8 patients had the BRAFV600E mutation. Five of the eight melanoma patients were treated with pembrolizumab and the remaining three patients were treated with nivolumab. The median duration of the first radiographic response was 5 months (range: 3–8). The median number of immunotherapy treatment doses was 12 (range: 3–20). The median duration of durable treatment response after discontinuation of immunotherapy was 9.7 months (range: 2–27). Four patients discontinued treatment due to immune-related adverse events: 1 developed organizing pneumonia; 2 acquired Rheumatoid arthritis; and 1 developed pancreatitis. The remaining four patients requested to stop treatment. (Tables 1, 2)

In non-melanoma group of 12 patients, three were diagnosed with renal cell cancer (RCC), three with bladder cancer, there was one hepatocellular cancer (HCC), one colon cancer, and four patients with non-small cell lung cancer (NSCLC). The median age was 67 years (range: 40–87). Eight of the twelve were male and 4 were female. Ten of 12 patients had prior therapies. Three patients were treated with tyrosine kinase inhibitors (two with pazopanib and one with sunitinib) for RCC. Three bladder cancer patients received platinum with gemcitabine. One HCC had localized therapy by embolization. Two of the 4 NSCLC had chemotherapy (1 with carboplatin/gemcitabine for squamous cell, 1 with carboplatin/pemetrexed for adenocarcinoma). One colon cancer patient was treated with FOLFOX. Three of the 8 patients were positive for the BRAFV600E mutation. Seven patients were treated with nivolumab, and four patients were treated with pembrolizumab. The median duration of the first radiographic response was 3.2 months (range: 2–5). The median number of immunotherapy treatment doses was 15 (range: 6–30). The median duration of durable treatment response after discontinuation of immunotherapy was 10.4 months (range: 4–23). Four patients discontinued treatment due to immune related adverse events: 1 developed Sjogren syndrome; 1 developed hemophagocytic lymphohistiocytosis; 1 acquired hepatitis, and 1 had peripheral neuropathy. The remaining patients requested a break from treatment. Four patients had disease progression after discontinuation of immunotherapies with the median duration of 8.7 months. (Tables 1, 2)

Table 2. Outcome Comparisons for the Melanoma and Non- Melanoma groups.

Characteristics

Melanoma

N= 8

Non-melanoma

N = 12

Median age in years (range)

73 (44–90)

67 (40–87)

Men, N (%)

4 (50%)

8(66%)

ECOG 0–1, N (%)

8 (100%)

12(100%)

Previous therapy, N (%)

4 (50%)

10 (83%)

BRAF mutant positive

3 (38%)

0

PD-L1 positive (>50%)

Unknown

0

Median duration of first radiographic response in months (range)

5 (3–8)

3.2 (2–5)

Median number of immunotherapy cycles, (range)

12 (3–20)

15 (6–30)

Median duration in months of treatment response after discontinuation of therapy, (range)

9.7 (2–27)

10.4 (4–23)

Disease response (CR, PR, stable, progression)

7 (88%) CR

1(12%) stable

3 (25%) PR

4 (33%) stable

4 (33%) progression

1 (8%) CR

Immune related side effects, N (%)

4 (50%)

4 (33%)

ECOG = Eastern Cooperative Oncology Group; CR = complete response; PR = partial response; N = number.

Seven out of 8 patients (88%) from the melanoma group had disease free progression after a median follow-up of 9 months. Eight out of 12 patients (67%) from the non-melanoma group had disease free progression after a median follow-up of 10 months.

Discussion

Immune checkpoint inhibitors have transformed oncologic therapeutics. Immunotherapy provides improved overall survival and progression free survival for several solid tumors including melanoma, NSCLC, bladder cancer and RCC. However, there is no good biomarker that predicts which patient will benefit with immunotherapy. It was thought that programmed death ligand 1 (PDL1) expression would predict a good prognostic biomarker, however, there are multiple limitations related to this new type of therapeutic [1–3]. The optimal duration for therapy is ambiguous, however the current practice is to continue immunotherapy until disease progression or intolerable adverse events (AEs) occur. Immunotherapy is associated with immune-related AEs, some that can cause toxicities of grade 3 or higher. Thus, a shorter duration of therapy could spare patients from unnecessary toxicities and health expenditures.

Most patients in our study were treated with immunotherapy as a second-line therapy. Approximately 50% of patients from the melanoma group and 33% from the non-melanoma group experienced immune-related AEs, which led to discontinued treatment. The remaining 50% (melanoma) and 67% (non-melanoma) of the patients requested a therapy break secondary to a variety of issues. A common issue was financial, related to limitations imposed by insurance companies. Another issue related to transportation difficulties, especially when bi-weekly commutes were required. Finally, some patients questioned why they would need to continue treatment if they had already achieved a complete response. The median duration of treatment in both groups was approximately one-year, and 88% of the melanoma group, 67% from non-melanoma group achieved disease control with a median follow-up of 9–10 months.

Schadendorf et al. hypothesized that the immune-related AEs could be a hint for durability in the response, secondary to activation of immune system [4]. The KEYNOTE-006 phase III trial prospectively investigated for a two-year treatment of pembrolizumab in advanced melanoma. The study demonstrated that 55% of patients on pembrolizumab had a 24-months overall survival benefit after discontinuation of the treatment [5]. Conclusions from the KEYNOTE-001 phase III trial supported those reported in the KEYNOTE-006 trial, that patients who achieved a complete response could consider a discontinuation of the treatment. In fact, 90.9% of those patients who discontinued treatment were in disease-free-remission after a median follow up of two years [6].

These two KEYNOTE studies provide convincing evidence that a two-year immunotherapy treatment period improves overall survival benefit. When compared to the KEYNOTE studies, our study provided similar efficacy in terms of a durable response in melanoma patients in the post immune-treatment period. Interestingly, our patient cohort received treatment for approximately one year. A limitation of our study is that it is a retrospective study.

Cancer cells become resistance to chemotherapy and targeted therapies. An understanding of this concept is important in the sequencing of therapeutics for our patients. Well-performed studies established that mutations develop during ontogenesis that can be driver or passenger mutations, and give rise to non-epitopes that the immune system recognizes as neo-antigens. The immune checkpoint inhibitors act on specific tumor mutant proteins to reactivate the T-cell response. Hence, cases with a high tumor mutation burden (TMB) have a high treatment response rate [7, 8]. Studies have suggested that a high TMB predicts a favorable treatment response and also durable clinical benefit. For example, a high TMB in NSCLC predicted a higher response rate 59% vs 12% in low TMB patients and longer progression free survival (14.5 months in high TMB patients vs. 4.1 months in low TMB) in patients receiving a PD-1 inhibitor [9]. For bladder cancer, a high TMB did predict a favorable response [10]. Treated tumors exposed to genotoxic chemotherapy or radiotherapy are known to have a higher mutational rate compared to the TMB at diagnosis or prior to treatment [11, 12]. Therefore, TMB is an emerging biomarker of positive response to immune checkpoint inhibitors. However, efforts should be made to develop a molecular profile of prognostic variables or predictive biomarkers to customize prognosis at the baseline, and thereby guide an optimal duration for the immunotherapy.

Conclusion

Our study showed a sustained durable response in a variety of solid tumors after discontinuation of immunotherapy with a median 9–10 months of disease free progression post-therapy after median 11 cycles of treatment. Additional prospective trials are warranted.

Declaration Statement

Ethics Approval and Consent to Participate: The study approved by local Institutional Review Board (IRB) and the IRB protocol number is 43216.

Consent for Publication: Not applicable.

Availability of Data and Material: Data sharing is not applicable to this article as no datasets were generated or analyzed during the current study.

Author Contributions: Conception and design: All authors; Administrative support: PW; Provision of materials: All authors; Collection and assembly of data: All authors; Data interpretation: All authors; Manuscript writing and final approval: All authors

Compliance with Ethical Standards: Not Applicable

Conflict of Interest: The authors declare that they have no conflict of interest.

Funding: Not Applicable

Consent for Publication: Not Applicable. The study approved by local institution review board.

Acknowledgements: The authors thank Catherine Anthony, Ph.D. and the Markey Cancer Center Research Communications Office for assistance with manuscript preparation.

References

  1. Rimm DL, Han G, Taube JM, Yi ES, Bridge JA, et al. (2017) A Prospective, Multi-institutional, Pathologist-Based Assessment of 4 Immunohistochemistry Assays for PD-L1 Expression in Non-Small Cell Lung Cancer. JAMA Oncol. 3: 1051–8.[Crossref]
  2. McLaughlin J, Han G, Schalper KA, Carvajal-Hausdorf D, Pelekanou V, et al. (2016) Quantitative Assessment of the Heterogeneity of PD-L1 Expression in Non-Small-Cell Lung Cancer. JAMA Oncol. 2: 46–54. [Crossref]
  3. Grigg C,Rizvi NA. (2016) PD-L1 biomarker testing for non-small cell lung cancer: truth or fiction? J Immunother Cancer. 4: 48.
  4. Schadendorf D, Wolchok JD, Hodi FS, Chiarion-Sileni V, Gonzalez R, et al. (2017) Efficacy and Safety Outcomes in Patients With Advanced Melanoma Who Discontinued Treatment With Nivolumab and Ipilimumab Because of Adverse Events: A Pooled Analysis of Randomized Phase II and III Trials. J Clin Oncol. 35: 3807–14. [Crossref]
  5. Schachter J, Ribas A, Long GV, Arance A, Grob JJ, et al. (2017) Pembrolizumab versus ipilimumab for advanced melanoma: final overall survival results of a multicentre, randomised, open-label phase 3 study (KEYNOTE-006). Lancet. 390: 1853–62. [Crossref]
  6. Robert C, Ribas A, Hamid O, Daud A, Wolchok JD, et al. (2017) Durable Complete Response After Discontinuation of Pembrolizumab in Patients With Metastatic Melanoma. J Clin Oncol. Jco2017756270. [Crossref]
  7. Schumacher TN,Schreiber RD. (2015) Neoantigens in cancer immunotherapy. Science. 348: 69–74.
  8. Van Allen EM, Miao D, Schilling B, Shukla SA, Blank C, et al. (2015) Genomic correlates of response to CTLA-4 blockade in metastatic melanoma. Science. 350: 207–11. [Crossref]
  9. Rizvi NA, Hellmann MD, Snyder A, Kvistborg P, Makarov V, et al. (2015) Cancer immunology. Mutational landscape determines sensitivity to PD-1 blockade in non-small cell lung cancer. Science. 348: 124–8. [Crossref]
  10. Powles T, Eder JP, Fine GD, Braiteh FS, Loriot Y, et al. (2014) MPDL3280A (anti-PD-L1) treatment leads to clinical activity in metastatic bladder cancer. Nature. 515: 558–62. [Crossref]
  11. Johnson BE, Mazor T, Hong C, Barnes M, Aihara K, et al. (2014) Mutational analysis reveals the origin and therapy-driven evolution of recurrent glioma. Science. 343: 189–93. [Crossref]
  12. Padovan-Merhar OM, Raman P, Ostrovnaya I, Kalletla K, Rubnitz KR, et al. (2016) Enrichment of Targetable Mutations in the Relapsed Neuroblastoma Genome. PLoS Genet. 12: e1006501. [Crossref]

Proseal™ LMA Insertion: Comparison of the Nasogastric Catheter Guided Technique with the Conventional Digital Technique

DOI: 10.31038/JCRM.2018131

Abstract

Several techniques have been introduced to improve the success rate and efficiency of the ProsealTM laryngeal mask airway (PLMA) placement along with decreasing complication. The aim of this study is to compare the success rate of the nasogastric catheter guided technique to the conventional digital technique.

Methods

In this randomized-controlled clinical trial, 200 patients, age between 18 and 65 years old, underwent inhalation technique anesthesia were enrolled. Participants were randomized by computer to Nasogastric catheter guided group (NG) and Digital technique group (DT). Anesthesia was induced with propofol (3 mg/kg) and fentanyl (2 mcg/kg). In DT group, the PLMA was inserted by using the index finger insertion technique. In NG group, PLMA with nasogastric catheter protruding for 5 cm from the PLMA drain tube distal aperture was inserted with the same method. Successful insertion was evaluated by the chest movement and the persistent rising of end-tidal carbon dioxide. The quality of placement was also recorded after the patient regained spontaneous breathing. Complications were evaluated at the end of the surgery and at the PACU discharge time.

Result

Patient characteristics were similar in both groups. The overall insertion success rates were similar; 89.3% in NG and 81.5% in DT group (P=0.22). There was no difference in insertion attempt (success rate in the first attempt = 86.7% and 84.0% in NG group and DT group respectively, P = 1.00). The time to the success of insertion was not significantly different; 30 seconds in NG group vs 35 seconds in DT group (P=0.185). There were no differences in the complications such as airway bleeding, sore throat, dysphagia, and hoarseness.

Conclusion

Insertion of Proseal LMA using nasogastric catheter guided technique did not provide an advantage over digital technique. The complications from both insertion techniques were also similar.

Keywords

Proseal LMA, Nasogastric catheter, Airway device

Background

Laryngeal mask airway (LMA) is an alternative airway device widely used during elective surgical procedures. ProsealTM LMA (PLMA) is another advanced form of this supraglottic airway device. PLMA may be inserted by the standard index finger or by using the introducer. Several techniques have also been introduced to improve the success rate and efficiency of the PLMA placement along with decreasing the complications [1,2] [4–8] [10].

The previous studies comparing the success rate of PLMA insertion showed that the use of suction catheter guided insertion had the higher success rate than the insertion without the guide [1,2]. Gum elastic bougie (GEB) guided insertion was not different in comparison to the metallic introducer in the point of success rate but it showed the improvement of the position of PLMA placement [3]. Using laryngoscope to direct insertion of GEB into esophagus before assisting PLMA insertion further improved the success rate significantly [4–6]. However, the mucosal trauma occurrence was higher with GEB guided insertion. Flexi-slip stylet guided insertion also showed higher success rate together with decreasing trauma complications [7]. The airway stylet; Foley airway stylet (FAST), had similar outcomes but it had the higher trauma rate compared to the metallic introducer [9]. Additionally, neuromuscular blocking agents could be used to improve the laryngeal airway insertion [11]. Advancing the guide such as the suction catheter into esophagus 10 to 15 centimeters to guide PLMA had the higher success rate as well [8–10].

Methods

This randomized controlled clinical trial was approved by the Ethics Committee of the Faculty of Medicine, Prince of Songkla University (ethical number: 59-192-08-1). Data were collected from October 2016 to October 2017. We recruited 200 patients, with the age between 18 – 65 years old, the American Society Anesthesiologists physical status I – III, who underwent inhalation technique of anesthesia. Patients who had body weight lower than 30 kilograms or heavier than 70 kilograms or body mass index more than 35 kilograms per square centimeters, history or suspicion of difficulty in airway management, the risk of aspiration, respiratory diseases and change of anesthetic technique were excluded from the study. Computerized randomization was performed to divide participants into nasogastric catheter guided technique group (NG) and Digital technique group (DT) equally. The opaque envelopes containing group assignment were opened prior to the start of the induction of anesthesia.

The patients were not given sedative agents for premedication. The patient position was supine without the pillow. After applying the standard monitoring and preoxygenation for 3 minutes with 100% oxygen, anesthesia was induced with propofol (3 mg/kg) and fentanyl (2 mcg/kg) intravenously. Additional boluses of propofol 0.5 mg/kg intravenously were given as required to achieve the adequate depth of anesthesia, apnea, and adequate jaw relaxation. The PLMA insertion was performed by the first or second-year anesthetic residents or in-training anesthetic nurses who had experience more than 5 success of LMA insertion. In DT group, the PLMA was inserted by using index finger insertion technique according to the manufacturer’s instruction manual. In NG group, PLMA with nasogastric catheter protruding for 5 cm from the PLMA drain tube distal aperture was inserted with the same method. The PLMA size 3 or 4 selection was based on anesthesiologists’ consideration. Neuromuscular blocking agents were not allowed to be used. The duration for insertion started as the opening of the patient’s mouth and ended after successful insertion proved by chest movement along with the ventilation and the persistent rising of end-tidal carbon dioxide for at least 5 waves. If unsuccessful insertion occurred, PLMA would be removed, then preoxygenation and additional propofol bolus doses were provided. PLMA insertions were allowed for only 2 attempts, after that, it was considered as failed insertion then the airway management was followed by the discretion of anesthetic staff. In both groups, the PLMA cuff was inflated with air to the pressure of 40 centimeters of water. Patient’s ventilation was assisted until regaining of the spontaneous breathing. Anesthesia was maintained with volatile anesthetic agent and 50% of oxygen in air. Five minutes later, the secondary outcomes were assessed by following; the position of the nasogastric catheter placement confirmed with the audible sound at epigastrium by 10 milliliters of air push, hypercapnia (End tidal Carbon dioxide more than 60 mmHg), hypoxia (Oxygen saturation less than 95%) and the leakage of ventilation (leakage sound through the patient’s mouth). The awake technique for PLMA removal was used at the end of anesthesia.

The complications were assessed after removal of PLMA. Any visible blood stain or blood in the early oropharyngeal secretion suction was noted. Patients were asked for the sore throat, hoarseness or dysphagia before discharging from PACU by PACU nurses who were blinded to the insertion technique.

Statistical analysis

The sample size was calculated from the difference of the success rates in the previous study [1]. The number of population required for this study was 90 patients for each group. With the 10% drop-out rate, therefore, the definite number of the population was 100 patients in each group. This estimation would give a power of 80% to detect the difference at the significance level of 0.05.

Statistical analysis was performed using R software. Continuous variables were presented as median and interquartile range (IQR) or mean. Categorical variables were presented as number of patients and percentages. Continuous variables were analyzed by Student t-test or Wilcoxon Rank Sum test. Categorical variables were analyzed by Fisher’s exact test, or Chi-square test. P value less than 0.05 was considered as statistical significance.

Result

Two hundred participants were enrolled into the study, eight patients in DT group and sixteen patients in NG group were excluded (Figure 1). Patient characteristics were not significantly different (Table 1).

JCRM 2018-111 - Wirat WasinWong Thailand_F1

Figure 1. Consort flow diagram

Table 1. Demographic data of the patients.

NG (n=84)

DT (n=92)

P-value

Age (year)*

Gender+

 – Male

 – Female

45 (32–51)

16 (19)

68 (81)

46 (35–54)

24 (26)

68 (74)

0.20

0.35

Weight (kg)*

58 (49–65)

60 (52–63)

0.56

Height (cm)*

157 (154–160)

158 (154–165)

0.41

BMI

22.8 (3.0)

22.8 (3.5)

0.89

ASA+

 – I

 – II

 – III

Mallampati score+

 – I

 – II

 – III

Proseal size

 – 3

 – 4

Performer

 – In-training anesthetic nurse

 – 1st year resident

 – 2nd year resident

20 (23.8)

64 (76.2)

0 (0)

36 (42.9)

44 (52.4)

4 (4.8)

36 (42.9)

48 (57.1)

39 (46.4)

29 (34.5)

16 (19)

22 (23.9)

68 (73.9)

2 (2.2)

48 (52.2)

42 (45.7)

3 (2.2)

32 (34.8)

60 (65.2)

51 (55.4)

29 (31.5)

12 (13)

0.60

0.38

0.35

0.40

* Data are presented as a median (IQR)
+ Data are presented as a number (%)
• Data are presented as a mean (SD)

There were no significant difference in success rates (Table 2). Success rate in NG group at first attempt was 86.7% and 13.3% in second attempt. In DT group, success rate at first attempt was 84% and 16% in second attempt. The overall success rate were 89.3% in NG group and 81.5% in DT group (P value = 0.216). By the Logistic regression analysis with the insertion success as the outcome variable, there was no significant variables (ASA status, Mallampati score, the performers, PLMA size).

Table 2. Success and quality of PLMA placement

NG
(n=84)

DT
(n=92)

P-value

Insertion success+

Insertion attempt+

 – 1

 – 2

75 (89.3)

65 (86.7)

10 (13.3)

75 (81.5)

63 (84.0)

12 (16.0)

0.22

0.82

Insertion time (second)*

30 (25–47)

35 (25–54)

0.38

Proper nasogastric catheter placement+

68 (90.7)

60 (80.0)

0.11

Hypoxemia+

2 (2.7)

3 (4.0)

1.00

Hypercapnia+

Leakage+

2 (2.7)

32 (42.7)

2 (2.7)

29 (38.7)

1.00

0.74

* Data are presented as a median (IQR)
+ Data are presented as a number (%)
• Data are presented as a mean (SD

For the success of PLMA insertion (75 cases) in both groups, there were no differences in the time to success insertion and the PLMA position. The duration of insertion were 30 seconds (IQR = 25 – 47 seconds) in NG group and 35 seconds (IQR = 25 – 54 seconds) in DT group. The nasogastric catheter placement in the proper position were not significantly different which were 68 of 75 (90.7%) patients in NG group and 60 of 75 (80%) patients in DT group. The incidences of hypoxemia, hypercapnia and air leakage were not significant difference.

The visible blood stain on PLMA or in the early suction was noted after PLMA removal. Bleeding was found similarly both in NG group (24%) and in DT group (20%) (P-value = 0.693). Sore throat was reported by 36% of patients in DT group and 26.7% of patients in NG group (P-value = 0.291). Dysphagia was the same as 4% in both groups (Table 3). Hoarseness was not significantly different between the two groups (4% and 2.7% in NG and DT groups, respectively). The symptoms of all patients improved within two days postoperatively.

Table 3. Airway complications

NG
(n=75)

DT
(n=75)

P-value

Bleeding

Sore throat

18 (24)

20 (27)

15 (20)

27 (36)

0.69

0.29

Dysphagia

Hoarseness

3 (4)

3 (4)

3 (4)

2 (3)

1.00

1.00

Data are presented as a number (%)

Discussion

The success rate of PLMA insertion by using the nasogastric catheter guiding was slightly higher, but not significantly different from the conventional digital technique. Due to the number of the patients in the NG group were withdrawn more than 10% drop-out, therefore, the sensitivity analysis was also performed and analyzed. The result still showed no significantly different in the success rates between the two groups. The numbers of insertion and the duration of PLMA placement were also similar between the two groups. The quality of PLMA position which determined by the proper position of the nasogastric catheter placement, hypercapnia, hypoxia and the leakage of ventilation also revealed the insignificant differences between the two groups. However, the rate of proper nasogastric-catheter-positioning was slightly higher in NG group.

The nasogastric catheter used as a guide for PLMA insertion in our hospital might be different from previous literatures. The nasogastric catheter from the different company might differ in the consistency of the material. Therefore, it might not be helpful to be the guide of the PLMA insertion in this study. Even though, the complications such as airway trauma were not significantly different. Five centimeters protrusion of nasogastric catheter from the distal end of PLMA drainage tube in our study was less than those in the previous reports so it could be inserted together with PLMA and the protruding nasogastric catheter would act as the guide to the proper positioning of PLMA. Unlike the previous studies, the nasogastric catheter was inserted 10 to 15 centimeters deep into the esophagus and then following by the PLMA [8,10]. With the longer length of nasogastric catheter, it was easier to be folded or kinked while passing through posterior pharyngeal wall causing the impediment of the PLMA insertion and also caused mucosal trauma and increased the time of insertion. In this study, the success rates were not different from the other reports (90%) in NG guided technique which also performed by inexperienced performers [1,2], whereas the success rate of the digital technique in this study was higher than those in the previous reports [1,2].

The experience of the anesthesiologist is another important factor for the successful insertion of PLMA. In the experienced hands, the success rate might not be different because of the ease of the LMA insertion by itself. In the other hand, the different techniques of insertion might affect the success in the learners. Thus, the first and second-year anesthetic residents and in-training anesthetic nurses were designed as the performers. However, the result showed no significant difference in the success rates between the two groups.

For the patients who failed PLMA insertion, half of them were managed by intubation with oroendotracheal tube. Three patients were successfully inserted the PLMA by anesthetic staff in the third attempt. However, it had to reduce the size 4 to size 3 of PLMA to achieve the successful PLMA insertion in three patients.

In DT group, there were some patients failed to properly advance the nasogastric catheter to the stomach. The cause probably be due to the misplacement of the tip of drainage tube of PLMA which was not properly at the esophageal opening or the minor folding of the tip of PLMA after insertion.

The Use of larygeal mask airway in an elective surgery is safe and has low incidences of the serious complications. The mild, short-lasting complications such as airway bleeding/trauma, sore throat, hoarseness are more common. The incidences of airway trauma and sore throat varied from 9 – 22% and 5.8 – 34% depending on the PLMA insertion techniques [11]. The complications of PLMA insertion in our study were not different from the previous studies [1,8,11] but the incidences were higher than those in the reports using laryngoscope and oesophageal vent to guide the PLMA insertion [4,12].

Limitation

First, fourteen patients were excluded from the study due to incomplete data. Even this did not affect to the primary outcome which tested by sensitivity analysis, but it might affect some other secondary outcomes. Secondly, the variation in the experience among the 13 anesthetic nurses and 17 anesthetic residents to perform PLMA insertion during the 1-year duration of the study. Thirdly, we did not use flexible fiberoptic laryngoscope to determine the proper position of placement. The malposition rate might be higher compared to the clinical judgement. Lastly, this study could not be blinded for the assessment of PLMA insertion.

Conclusion

Insertion of the Proseal LMA using nasogastric catheter protruding 5 cm from the drainage tube distal aperture for guiding technique did not provide an advantage over the index finger technique by the inexperienced performers. The complications from both insertion techniques were also similar.

Thai Clinical Trial Registry number: TCTR20161026001

Financial support of the work: Songklanagarind Hospital, Department of Anesthesia, Faculty of Medicine, Prince of Songkla University, Thailand

Conflict of Interest: none

Acknowledgement: none

References:

  1. Perilli V, Aceto P, Sacco T, Martella N, Cazzato MT, Sollazzi L (2014) Suction catheter guided insertion of ProSeal laryngeal mask airway: Experience by untrained physicians. Indian J Anaesth. 58(1): 25–9. [Crossref]
  2. Nagata T, Kishi Y, Tanigami H, Hiuge Y, Sonoda S, Ohashi Y, et al. (2012) Oral gastric tube-guided insertion of the ProSeal™ laryngeal mask is an easy and noninvasive method for less experienced users. J Anesth 26(4): 531–5. [Crossref]
  3. El Beheiry H, Wong J, Nair G, Chinnappa V, Arora G, Morales E, et al. (2009) Improved esophageal patency when inserting the ProSealTM laryngeal mask airway with an EschmannTM tracheal tube Introducer. Can J Anaesth 56(10): 725–32. [Crossref]
  4. Eschertzhuber S, Brimacombe J, Hohlrieder M, Stadlbauer KH, Keller C (2008) Gum Elastic Bougie-guided insertion of the ProSeal Laryngeal mask airway is superior to the digital and introducer tool techniques in patients with simulated difficult laryngoscopy using a rigid neck collar. Anesth Analg 107(4): 1253–6. [Crossref]
  5. Howath A, Brimacombe J, Keller C (2002) Gum-elastic bougie-guided insertion of the ProSeal laryngeal mask airway: a new technique. Anaesth Intensive Care 30(5): 624–7. [Crossref]
  6. Brimacombe J, Keller C. (2004) Gum elastic bougie-guided insertion of the ProSeal Laryngeal Mask Airway. Anaesth Intensive Care 32(5): 681–4. [Crossref]
  7. Chen HS, Yang SC, Chien CF, Spielberger J, Hung KC, Chung KC (2011) Insertion of the ProSealTM laryngeal mask airway is more successful with the Flexi-SlipTM stylet than with the introducer. Can J Anesth 58(7): 617–23. [Crossref]
  8. García-Aguado R, Viñoles J, Brimacombe J, Vivó M, López-Estudillo R, Ayala G (2006) Suction catheter guided insertion of the ProSealTM laryngeal mask airway is superior to the digital technique. Can J Anesth 53(4): 398–403. [Crossref]
  9. Chen MK, Hsu HT, Lu IC Shih CK, Shen YC, Tseng KY, et al. (2014) Techniques for the insertion of the proseal laryngeal mask airway: comparison of the foley airway stylet tool with the introducer tool in a prospective, randomized study. BMC Anesthesiol 14: 105. [Crossref]
  10. Gasteiger L, Brimacombe J, Perkhofer D, Kaufmann M, Keller C (2010) Comparison of guided insertion of the LMA ProSealTM vs the i-gelTM. Anaesthesia 65(9): 913–6. [Crossref]
  11. Michalek P, Donaldson W, Vobrubova E, Hakl M (2015) Complications associated with the use of supraglottic airway devices in perioperative medicine. Biomed Res Int 2015: 746560.
  12. Eschertzhuber S, Brimacombe J, Hohlrieder M, Keller C (2009) The Laryngeal Mask Airway SupremeTM – a single use laryngeal mask airway with an oesophageal vent: a randomized, cross-over study with the Laryngeal Mask Airway ProSealTM in paralysed, anesthetized patients. Anaesthesia 64(1): 79–83. [Crossref]

Rieger Syndrome: A Case with Congenital Absence of Premaxillary Area

DOI: 10.31038/JDMR.2018113

Case Study

Rieger syndrome is characterized by absent maxillary incisor teeth, malformation of the anterior chamber of the eye, and umbilical anomalies [1]. A case with congenital absent of premaxillary area is presented.

The patient, a 10 7/12 -year-old boy, was born to young (father 25, mother 16), non-consanguineous, apparently normal parents, after an uneventful, full-term pregnancy. Hydramnios and a long-lasting delivery is reported. He weighed 3000 gr. at birth and had choanal atresia, bilateral aniridia, glaucoma and inverted strabismus. His younger 7-year-old brother and 4-year-old sister are reportedly normal. No similar case among relatives is reported.

Physical and radiologic examination showed absence of premaxllary area and incisor teeth hypodontia and delayed eruption of permanent dentition, short facial height (-3.0 SD) highly arched narrow palate, (narrow free border of soft palate, with small uvula, hypertrophic tonsils), severely short palatal plane (–5.4 SD) and concave skeletal profile (–5.6 SD) posterior displacement of maxillary sinuses and projection of the periumbilical skin (dry palmar skin low posterior hairline). Intelligence was normal.

JDMR-18-103 - Bazopoulou E Greece_F1

Figure 1. Absence of premaxillary area.

JDMR-18-103 - Bazopoulou E Greece_F2

Figure 2. Lateral cephalometric radiography Short Facial Height, concave profile.

JDMR-18-103 - Bazopoulou E Greece_F3

Figure 3. Posterior-front cephalometric radiography. Absence of premaxillary area, infraorbital bony distance.

JDMR-18-103 - Bazopoulou E Greece_F4

Figure 4. Concave profile.

His karyotype was normal, 46, XY (G-bands).

Panoramic radiograph

Absent teeth

52, 51, 61, 62
18 13, 12, 11, 21, 22, 23 28
48 45, 43, 41 31 33 35 38

Cephalometrics

Patient 10.5 -year-old                 Father 35-year-old

Cranial base

S-N 71.8 mm (-2.2 SD)                           70 mm -3.5 SD
S-Ba 44 mm (-0.6 SD)                            48 mm norm
S-N-Ba 129.6 dg (0.1 SD)                       126 dg norm
SN-FH 151 dg (3.1 SD)
ANS-PNS 43 mm (-5.4 SD)                      50 mm -3.0 SD

JDMR-18-103 - Bazopoulou E Greece_F5

Figure 5. Surgically corrected congenitally absent philtrum.

Skeletal Relations

Facial Angle 90.6 dg (2.3 SD)                88 dg 3.0 SD
(PN-FH)

Lande’s Angle 81.0 dg (-1.2 SD)           91 dg 3.0 SD
(AN-FH)

Convexity -17.8 dg (-5.6 SD)
180-(NAP)

Vertical Analysis

Mandibular Plane         20.2 dg (-1.9)              23 dg
Y-Axis                        51.8 dg (-2.5)
UFH (N-ANS)              47.1 mm (-2.0)            61 mm norm
TFH (N-Me)                 106.7 mm (-3.0)          132 mm norm
UFH/TFH                     44.2%   43.93%          46.21% SNA 82 dg norm
SNB 80 dg norm
ANB 2 dg norm

Anterior Cranial Base:
Moderate Short

Severely short

Posterior Cranial Base:
Normal

  normal

Saddle Angle:
Normal

  normal

Palatal Plane:
Severely short

 Severely short

Maxilla:  Mildly retruded to forehead severely protruded to forehead well related to anterior cranial base

Mandible: Prognathic to forehead severely protruded to forehead well related to anterior cranial base

Convexity: Severely decreased; concave skeletal profile Overclosure tendency Maxilla and mandible well related to each other Bony interorbital Distance: 18 mm 23 mm

JDMR-18-103 - Bazopoulou E Greece_F6

Figure 6. Lateral MRI tomography showing posterior displacement of maxillary sinuses.

Reference

  1. Gorlin RJ, Cohen Jr, MM Hennekam RCM (2001) Syndromes of the Head and Neck, OXFORD Universal Press. Rieger syndrome (hypodontia and primary mesodermal dysgenesis of the iris). Pp: 1181–1183.

Male Circumcision has Health Advantage

DOI: 10.31038/AWHC.2018112

Abstract

Male circumcision has confirmed health benefits. Male circumcision also affects health of women. The discussion of male circumcision should be scientific, not emotional. Studies do clearly indicate that male circumcision has essential health benefits. Circumcision/genital mutilation/cutting of fe-males is harmful and globally condemned.

Introduction

Contemporary research

Current research strongly indicates that male circumcision has health benefits. We Jews circumcise only our sons – we are firmly against female genital mutilation/cutting/circumcision. In a personal communication to me (2016), Harald zur Hausen (Medicine Nobel Prize 2008) states that the effect of male circumcision in protecting against sexually transmitted diseases (STDs) is at best moderate. Morris et al. [1] evaluated in their systematic review 140 published relevant papers regarding early infant male circumcision – the risks versus the benefits. Early infant male circumcision protects against urinary tract infections (UTIs), phimosis and painful erections. It is also protective against inflammatory skin diseases as well as sexually transmitted infections (STIs) in females and in males. Infant male circumcision has a protective effect against cancer of the cervix, penile cancer and cancer of the prostate gland – it improves penile hygiene.

The Second Vatican Council has stated that God’s agreement with Jews is in effect and has never been cancelled – it does include circumcision of infant males which is not condemned as genital mutilation. Current research indicates that infant male circumcision gives benefits of health. (Jones 2018). According to Schenker (2018), circumcision of males is executed for religious and medical grounds – it could cut the heterosexual transfer of human immunodeficiency virus (HIV) infection by more than 60%. This very fact has been confirmed in several studies. It is calculated that Operation Abraham is able to prevent at least 500,000 cases of HIV infections in Africa by the year 2030. In sub-Saharan Africa, a multinational programme intends to circumcise 27 million men by the year 2021 – in this effort Israel is co-operating with Senegal and South Africa. Voluntary medical male circumcision is a highly imposing operation in order to globally stop HIV infections.

Human papillomavirus (HPV) and male circumcision

General considerations

Castellsagué et al. [3] underline that male circumcision is linked to a decreased risk of HPV infection of penis and also to reduced risk of cervical cancer in the female sexual partners of the men in question. The role of HPVs in the development of anogenital cancer is discussed in detail in the exceptional 2011 book of Harald zur Hausen [4]. This volume has a very special place in my personal collection of medical writings. In Sweden, I confered with Harald about HPV infections and their complications. His knowledge in this important subject has been many years highly impressive. Morris et al. [5] do refer to the statement of the Cancer Council of Australia on infant male circumcision and prevention of cancer. The encouragement of HPV vaccination of boys as well as male circumcision will together maximise the prevention of genital cancer. Li (2017) discusses HPV infection as well as male reproductive health. The author states that this very infection is globally one of the sexually transmitted diseases (STDs) existing in genitalia of both women and men. The author also writes that male HPV infection is linked to tumours in the reproductive organs, infertility and infection in sexual partners. Male circumcision, the use of condoms as well as fewer sexual partners are essential steps in order to fight HPV infections. The systematic review and meta-analysis of Zhu et al. (2017) including 30 published papers does indicate that male circumcision cuts the prevalence of genital HPV infection. Wei et al. (2018) evaluated the effect of male circumcision on the natural history of HPV infection in genitalia. The authors found that the clearance of HPV infection in 113 circumcised men was significantly higher compared to 560 uncircumcised ones. All the patients were followed up two times – the interval of the investigations was six months. During the examination, genital specimens were picked up as well as typed for HPV DNA.

Penile intraepithelial neoplasia

HPV DNA is found in 70 to 100% in cases of penile intraepithelial neoplasia – infant male circumcision decreases the risk of penile cancer 3-foldly (Dillner et al. 2000). Wollina et al. (2018) do describe a case of phimosis with penile carcinoma in situ in a 68 years old man. The patient was treated with success by using circumcision.

Self-testing & low-risk HPVs

I discussed [6] HPV self-testing in 2008 and in the year 2013 the low-risk HPVs in the development of malignant tumours in the anogenital tract five years later. The above paper of Zhu et al. (2017) regarding male circumcision is highly important.

Human immunodeficiency virus (HIV) and male circumcision

The 2007 declaration of World Health Organization (WHO)

WHO supports male circumcision in order to prevent HIV infections – to be uncircumcised is a risk factor.

The statements of Glick & the Tobian team

Glick (2013) underlines that controlled investigations show the significant health benefits of infant male circumcision in reducing the number of HIV infections. Tobian et al. (2014) point out that male circumcision is an underutilised method in order to prevent sexually transmitted infections (STIs). In an earlier paper (2010), Tobian et al. stated that circumcision of infant males did cut the acquisition of HIV by 53–60% – as well as the prevalence of human papillomavirus (HPV) by 32 to 35%.

HIV in sub-Saharan Africa

George et al. (2014) stress that the more effective voluntary medical male circumcision in areas with high prevalence of HIV infection could result in substantial reduction of HIV incidence in South Africa. Peltzer et al. (2014) found in their study acceptability of high degree regarding male circumcision in South Africa. The self-reported prevalence of male circumcision was 42.8%. It is essential to inform about the health benefits of male circumcision in the prevention of HIV infection. Abuelazam et al. (2016) do state that widespread male circumcision in South Africa has resulted in a 21% reduction in the incidence of HIV infection. Grund et al. (2017) declare that male circumcision does diminish the risk of obtaining HIV infection as well as some other STIs in heterosexual relationships, and is vital in order to prevent HIV. In Uganda, voluntary medical male circumcision does cut the risk of HIV infection. In sub-Saharan Africa, the participation is not optimal in some age groups as well as areas. It is important to inform about the benefits of medical male circumcision regarding the prevention of HIV infection (Gilbert et al. 2018).

In Uganda and South Africa, the programme of preventing HIV infection does include medical circumcision, antiretroviral treatment as well as prophylaxis given before exposure. Suppliers working in health care do need training as well as help in order to understand the details of the discordant HIV infection (Greener et al. 2018).

Hinkle et al. (2018) write that male circumcision decreases the risk of HIV transfer from females to males by roughly 60%. In Uganda, voluntary medical male circumcision is encouraged as a method to prevent HIV infection. It is essential to follow up the quality of this operation as well as to improve the teaching of those workers who are involved in the HIV prevention programme (Broughton et al. 2018).

HIV in western Kenya

In western Kenya, the participation in voluntary medical male circumcision has increased from 45% in the year 2008 to 72% six years later. This increasing involvement has cut considerably the HIV incidence between the years 2011 and 2016 in Siaya County (Borgdorff et al. 2018).

The statement of the Kabwama group

Kabwama et al. (2018) point out that male circumcision does save from HIV infection. This fact is well accepted.

The statement of the Carrasco team

Carrasco et al. (2018) state that voluntary medical male circumcision is a successful method in the prevention of HIV infection.

Women and HIV

Greevy et al. (2018) underline that women do have an essential responsibility in order to reduce the transfer of HIV infection. In South Africa, male circumcision is encouraged in programmes of HIV prevention. In Rakai (Uganda), all 27 the interviewed women did favour circumcised men regarding the decreased risk of HIV infection and of other STIs, as well as of better penile hygiene and of more intense sexual pleasure (Nakyanjo et al. 2018).

Safer conception

Davey et al. (2018) write that in sub-Saharan Africa, safer conception programmes for heterosexual husband and wife do include voluntary medical male circumcision, prophylaxis before exposure for HIV infection as well as antiretroviral therapy. The authors evaluated in their systematic analysis 41 acceptable surveys – 15 quantitative & 26 qualitative reviews published after the year 2007 in sub-Saharan Africa. In this study, the couples stated that they wanted to get more information about plans regarding safer pregnancy. In Africa, these strategies in question are not so far widely obtainable.

Complications following male circumcision

The risk of complication is low

El Bcheraoui et al [7] analysed 41 complications possibly caused by male circumcision. Totally, 1 400,920 patients were studied – 93.3% of them were newborn males. The authors do underline that the risk of complications following male circumcision is low. The incidence was vaguely below 0.5% in their study. It is important to note that the risk incidence rose ten-fold to twenty-fold when this very operation was performed after infancy. Brian Morris (2015) does state that the risk of adverse events following circumcision is low when infant males are operated. According to Sneppen & Thorup (2016), the risk of complications before the age of 18 is 1.7%. A group of 235 male patients were circumcised by using a new disposable ring. These patients were compared with the same number of males circumcised by using the suture device method. Post-operatively, no case of infection was observed – however, three cases of splitting of the wound were recorded in the total group of 470 circumcised males (Zhao et al. 2017).

Indistinct prevalence of complications

In the study of Adekanye et al. (2017), the prevalence of harmful events following circumcision of Nigerian primary school boys is 15.4%. This prevalence does include both excessive remainding and abolition of skin, as well as skin bridges and stenosis of meatus. My opinion is that meatal stenosis is a true complication following male circumcision – but not the harmless damages of skin.

Ethical questions

Ethical questions are essential to discuss

The discussion on male circumcision should be scientific, not emotional. One striking example of blurred writing is the paper of Kassab et al. (2018) evaluating factors linked to pain severity of in-fants undergoing immunisation. The authors found that the presence of parents in the room did essentially cut the total time of crying – circumcised infants cried longer than the uncircumcised ones. Jacobs [8] points out that circumcision on infant males is ethical to perform when the parents ask for it – this operation should be executed by a physician. Jacobs & Arora (2015) write that the ritual circumcision of male infants may violate local rules but never human rights. Earp [9] asks whether the benefits of male circumcision are greater than the risks and critisizes the interim guidelines of the Centers for Disease Control and Prevention (CDC). Earp [10] underlines that children should have their sexual organs undamaged. Genin (2017) does stress that the discussion regarding male circumcision has been and will be deeply intense – medically as well as politically. Svoboda (2017) concludes that ritual circumcision of infant males is common removing working and protective penile tissue. The author argues that this very operation violates the autonomy of the male child and it should be postponed until he can perform his own analysis. Di Pietro et al. (2017) claim that newborn male circumcision does cut in a very limited way the incidence of urinry tract infections (UTIs) and sexually transmitted infections (STIs) – Tobian et al. (2010) and Alkherizan & Elabd (2016) do have an opposite opinion. Harald zur Hausen (2016), as earlier mentioned, states that the effect of male circumcision in protecting against sexually transmitted diseases (STDs) is at best moderate.

Cultural considerations

In South Africa, traditional male circumcision is a cultural tradition indicating the progress from child to adult. Medical male circumcision and the traditional one should be integrated in order to improve the collaboration between members in local communities (Siweya et al. 2018). In Judaism, male circumcision is a religious and cultural tradition – and also a medical one.

Benefits and harms of ritual circumcision

Danish register

In Denmark, the Danish Minister of Health initiated in the year 2013 a register which collects information on all religious circumcisions of male children in the country. It makes future research possible focusing benefits as well as harms of ritual circumcision in childhood (Ploug & Holm 2017). In my opinion, the Danish register is important to obtain scientific information about benefits and complictions regarding this very operation.

New essentials discussing male circumcision

Male circumcision in South Africa

In South Africa, medical male circumcision is introduced in order to cut the incidence of human immunodeficiency virus (HIV) infection. A selected programme of intervention targets men in ages 25 to 49 years and has been valuable (Grund et al. 2018).

Male circumcision in Zambia

Jones et al. (2018) state that voluntary medical male circumcision is estimated to inhibit 3.4 million cases of HIV infection in 10 years in Africa. In Zambia, about 80% of uncircumcised males are not interested to be circumcised. It is essential to increase the acceptability as well as the uptake of this preventive operation.

Male circumcision in Zimbabwe

In Zimbabwe, voluntary medical male circumcision is taken up as the most important programme in order to prevent HIV infection since 2007. It is calculated that voluntary medical male circumcision will significantly affect the HIV epidemic in the country and save money (McGillen et al. 2018).

Circumcision and chronic prostatitis

According to Franco et al. (2018), early male circumcision does in all likelihood vaguely lessen the symptoms of chronic prostatitis, and is safe.

Cells of Langerhans

In sub-Saharan Africa, male circumcision is practised as a vital part in preventing HIV infection. It does give men protection against HIV in heterosexual relationships – the effect of this barrier is about 60%. Inside the foreskin, there are numerous Langerhans cells which decrease the local vulnerability of HIV infection. The second factor is that the inflammatory anaerobic milieu around the preputium is removed (Davis et al. 2018).

Male versus female circumcision

Manipulation of facts

Health care professionals do manipulate facts regarding Jewish cirumcision. They do indicate that we circumcise also our females. This trend is alarming. Contemporary studies clearly indicate that male circumcision has essential health benefits which is described in the preceding pages. Female circumcision/genital mutilation/cutting is a very harmful operation. It is globally condemned.

Female circumcision in Nigeria

A total of 8,111 men participated in the study of Titilayo et al. (2018). In one group, 29% of males stated that their religion demanded female circumcision. In a second one, 89.4% wanted to stop it – their religion did not ask for female genital cutting. The authors conclude that religious beliefs are essential when we want to fight female genital cutting.

Early deaths following neonatal male circumcision

About early US deaths

Only 200 early US deaths were found following neonatal male circumcision during the years 2001 to 2010 among 9 833,110 patients – i.e. 1/49,166 operations. Newborns who died after circumcision had probably other related severe conditions – cardiac, pulmonary or fluid & electrolyte disorders, or coagulopathy as the cause of death (Earp et al. 2018).

Young circumcised men are safer sexual partners

Circumcision should be performed early

Voluntary male medical circumcision is very effective in order to prevent human immunodeficiency virus (HIV) infection in men. According to reliable studies, circumcised men are safer sexual part- ners than uncircumcised ones. This fact, however, is not relevant when older males (aged 40 years or older) are discussed – male cirumcision should thus be performed in early ages.(Rosenberg et al. 2018).

Prophylactic treatment & voluntary medical male circumcision

Two methods to prevent human immunodeficiency virus (HIV) infection

According to Reed et al. (2018), oral prophylaxis before exposure to HIV infection and voluntary medical male circumcision have much the same challenges – both methods are effective.

References

  1. Morris BJ, Kennedy SE, Wodak AD, Mindel A, Golovsky D, et al. (2017) Early infant male circumcision: Systematic review, risk-benefit analysis, and progress in policy. World J Clin Pediatr 6: 89–102. [crossref]
  2. Jones DA (2018) Infant Male Circumcision: A Catholic Theological and Bioethical Analysis. Linacre Q 85: 49–62. [crossref]
  3. Castellsagué X, Bosch FX, Munoz N, Meijer CJ, Shah KV, et al. (2002) Male circumcision, penile human papillomavirus infection, and cervical cancer in female partners. N Engl J Med 346: 1105–1112. [crossref]
  4. Zur Hausen H (2011) Infections Causing Human Cancer. Wiley-VCH Verlag & Co. KgaA.
  5. Morris BJ, Mindel A, Tobian AA, Hankins CA, Gray RH, et al. (2012) Should male circumcision be advocated for genital cancer prevention? Asian Pac J Cancer Prev 13: 4839–4842. [crossref]
  6. Rubinstein E (2008) [Women positive to HPV self-test]. Lakartidningen 105: 467–468. [crossref]
  7. El Bcheraoui C, Zhang X, Cooper CS, Rose CE, Kilmarx PH, et al. (2014) Rates of adverse events associated with male circumcision in U.S. medical settings, 2001 to 2010. JAMA Pediatr 168: 625–634. [crossref]
  8. Jacobs AJ (2013) The ethics of circumcision of male infants. Isr Med Assoc J 15: 60–65. [crossref]
  9. Earp BD (2015) Do the benefits of male circumcision outweigh the risks? A critique of the proposed CDC guidelines. Front Pediatr 3: 18. [crossref]
  10. Earp BD (2016) In defence of genital autonomy for children. J Med Ethics 42: 158–163. [crossref]

The Primary Low Grade Ovarian Endometrioid Stromal Sarcoma – A rare entity in Gynecologic Surgical Pathology – A case report

DOI: 10.31038/IGOJ.2018124

Summary

Rare case of primitive stromal endometrioid sarcoma of the ovary in a 57-year-old woman was presented. Lesion of 17 cm x 16 cm x 9 cm size located in the right ovary. At the uterine level are some foci of adenomyosis. Epidemiology and histogenesis of these neoplasms and their immunophenotypic profile are discussed.

Case Report: A woman of the 50s has been suffering from abdominal pain and intestinal transit disorders for several months. An abdominal ultrasound shows the presence of a mass at the right half of the abdomen. At the intervention, there is a mass in correspondence of the right ovary. The patient undergoes bilateral hystero-salpingo-oophorectomy.

Macroscopic: The surgical sample of the right ovary consists of a mass of 17x16x9 centimeters. The sectioned surface presents cystic areas with citrine liquid content alternating with areas of solid tan yellow appearance. The left ovary and the uterus do not show significant macroscopic alterations

Material and Methods: Several fragments are taken in various areas of the right ovarian tumor mass. Fragments are taken from the left ovary, fallopian tubes, cervix, and the body of the uterus. The material was fixed in formalin and in paraffin embedded. The sections were colored with H & E and subjected to a panel of antibodies for immunohistochemistry. (Table 1)

Microscopic: The normal structure of the ovary was no longer recognizable. Wide bands of fibrous tissue reminiscent of ovarian fibroma, delimit irregular areas in shape and size. In the context of these areas, it is present. a massive proliferation of roundish, small mononuclear cells (Figure 1a).The elements are aggregated in a diffuse manner, usually compact, sometimes with aspects of a honeycomb (Figure 1b). The proliferation winds between the fibrous bands with tongue-like extensions (Figure 1 c, d).

There is also an abundant vascular component of the arteriolar type reminiscent of the spiral arterioles of the endometrial stroma (Figure 2 a, b, c, d).The results of the immunohistochemical investigations are shown in (Table 2)

Table 1.

CKAE1-AE3

Monoclonal 1: 50 DAKO

VIM

Monoclonal 1: 50 DAKO

EMA

Monoclonal 1: 50 DAKO

CD10

Monoclonal 1: 50 DAKO

PGR

Monoclonal 1: 50 DAKO

ER

Monoclonal 1: 40 DAKO

SMA

Monoclonal 1: 50 DAKO

DESM

Monoclonal 1: 50 DAKO

INIB

Monoclonal 1: 50 DAKO

WT1

Monoclonal 1: 50 DAKO

Cyclin D1

Monoclonal 1: 50 DAKO

PAX8

Monoclonal 1: 50 Biocare

CD117

Polyclonal 1: 400 DAKO

P53

Monoclonal 1: 50 DAKO

Ki67

Monoclonal 1: 75 DAKO

IGOJ 2018-110-MFiloTicoItaly_F1

Figure 1. (a) Massive proliferation of roundish, small mononuclear cells, (b) Sometimes with aspects of a honeycomb, (c, d) The proliferation winds between the fibrous bands with tongue-like extensions

Table 2.

KAE1-AE3

VIM

EMA

CD10

PGR

ER

SMA

DESM

INIB

WT1

CYCLD1

PAX8

CD117

P53

KI67

+–

Fig.5b

+

Fig.5a

+

Fg.3a

+

Fig.3b

+

Fig.3c

+–

Fig.3d, 4a,b

–+a

Fig.5c

+–

Fig.4c,d

>10%

Fig.5d

a =in the fibrous bands

IGOJ 2018-110-MFiloTicoItaly_F2

Figure 2. (a), (b), (c), (d) Abundant vascular component of the arteriolar type reminiscent of the spiral arterioles of the endometrial stroma

The morphological pattern and immunohistochemical profile favor the diagnosis endometrioid stromal sarcoma low grade of the ovary. The absence of a similar lesion at the uterine level or elsewhere allows the term primary to be added to the diagnosis.

Discussion

Ovarian neoplasms presenting the morphological characters of the endometrial stroma has been reported since the 1960s [1], and later in the early 80s [2]. Only in 1984, in a series of 23 cases studied by Scully et al. did the term Endometrioid Stromal Sarcoma of the ovary (ESS) appeared in the literature. Under this term in the article, are included both lesions with exclusively ovarian localization, but also those associated with a similar synchronous or metachronous uterine lesion [3]. In this publication, the morphological characters of the lesions are defined as completely superimposable to those of the uterine counterpart. The largest primitive ESS series of the ovary report the study of 27 cases and to our knowledge, represents, to date, the most detailed study on the subject [4].

The WHO 2003 classification of Ovarian Tumors poses these neoplasms between the Surface Epithelial- Stromal tumors and precisely among Endometrioid tumors giving them the following definition: “Endometrioid stromal sarcoma (ESS) is a monophasic sarcomatous tumour characterized by a diffuse proliferation of neoplastic cells similar to stromal cells of the proliferative endometrium. At its periphery, the tumour exhibits a typical infiltrative growth pattern.”[5]. The WHO 2014 classification includes these neoplasms between Mesenchymal Tumors, giving the following definition: “A Mesenchymal Tumour identical to low-grade uterine endometrial stromal sarcoma” [6].

In terms of nosographic precision, the definition of 2003 seems to us more appropriate as the endometrial stroma is a Mullerian derivative which, in turn, originates from the celomatic mesoderm and not from the mesenchyme which, as is known, is that part of the mesoderm from which originate the connective tissues, bone, cartilage, blood vessels, and lymphatics and not the organs of the urogenital system. In a series of 20 primary extrauterine ESS we can see how the case series is distributed on all the organs of the celomatic area: ovaries, salpinges, pelvic cavity and abdominal wall [7].The same area of distribution of endometriosis. An association with endometriosis has been reported in about 50% of cases. But for this, a mandatory interrelationship between the two phenomena cannot be inferred [1, 2, 7,] [8–11].

The extensive and detailed description of the morphologic pattern of these lesions reported in the aforementioned publication [4] can be summarized as follows: The most frequent pattern is that of a widespread proliferation of small roundish elements with scant cytoplasm, closely packed. The proliferation is often intersected by a band of fibrous tissue reminiscent of the ovarian fibroma; Sex cord differentiation is present in about 25% of cases. Smooth muscle differentiation is present in about 20% of cases. The characteristic tongue-like infiltration and intravascular penetration are rarely seen in ovarian localization. Small vessels with the spiral arterioles characters of the proliferative phase, with an often dilated lumen and curvilinear trend (low-grade fibromixosarcoma-like), are disseminated in the proliferation.

The recommended Immunohistochemical panel is comparable to that adopted for similar uterine neoplasms :

CD10

SMA

DESM

hCALDESM

PGR

ER

VIM

Wt1

AR

CALP

βCAT

KAE1-AE3

+

+

–or+

+

+

+

+or–

+or–

+or–

–or+

[12] From the biomolecular point of view, there are two subsets of ESS, JAZF1-SUZ12 or equivalent genetic rearrangements and another characterized by YWHAE-FAM22 genetic fusion histologically of higher grade and clinically more aggressive. This second subset expresses consistently Cyclin D1, with coexistent negativity for CD10 and PGR [13]. A wide range of primitive and secondary ovarian lesions (fibroma, thecoma, fibrosarcoma, mesodermal adenosarcoma, metastatic Gist) should be placed in differential diagnosis of these lesions, which in addition to being particularly rare, may contain aspects related to other entities (sex cord, thecoma ) of the neoplastic ovary pathology.

A recent survey of 14 patients yielded the following results. The average age of patients is around 49 years with a median of 51. Nine (64%) was classifiable as low-grade and 5 (36%) as high- grade. After a 65 months F.U., all low-grade Pts were alive. 33% of them had developed a relapse. Of high-grade Pts was alive without recurrence only 1 Pt, the other 4 develops relapses and two died due to the progress of the disease [14]. The case observed by us can rightly be numbered in the rare case of this neoplasm that according to a recent review of the literature amounts to, to date, less than 100 [14].

In fact, the morphological parameters are respected both as regards the cellular morphology and its organization (Figures1a-b), the tongue-like character of the infiltration (Figures 1c-d), the vascular component with the characteristic appearance of the spiral arterioles (Figures 2a-b-c-d), and the fibrous component with the aspects of the ovarian fibroma (Figure.1c). Immunohistochemistry showed diffuse and intense positivity for Vimentin (Figure 5a), CD10 (Figure 3a),, PGR (Figure 3b), ER (Figure 3c), Focal and sporadic for CK(5b), positive SMA on the level of the muscular tunics of the vessels, even just sketched out ( Figures 3d,4a-b), WT1 is weakly positive in scattered elements while exhibiting strong positivity in the muscular tunics of the spiral arterioles (Figures (4c.d). Scattered elements from fibroblastic morphology exhibit positivity for INIBIN in the context of the fibrous bands (Figure.5c) The Ki67 proliferation index stands at values below 10% (Fig.5d). The morphologic pattern and the immunohistochemical profile suggest considering this case as a low grade.

IGOJ 2018-110-MFiloTicoItaly_F3

Figure 3. a) CD10, b) PGR, c) ER, d) SMACT

IGOJ 2018-110-MFiloTicoItaly_F4

Figure 4. a) SMACT, b) SMACT (arteriole), (c, d) WT1 (arteriole)

IGOJ 2018-110-MFiloTicoItaly_F5

Figure 5. a) Vim, b) Keratin AE1-AE3, c) INIBIN, d) KI67

References

  1. Koller, Rygh (1960) A case of stromal endometriosis originating from ovarian endometriosis. Aciu Obstei Gynecol Scund 39: 178–183.
  2. Silverberg SG, Fernandez FN (1981) Endolymphatic stromal myosis of the ovary: a report of three cases and literature review. Gynecol Oncol 12: 129–138. [crossref]
  3. Young RH, Prat J, Scully RE (1984) Endometrioid Stromal Sarcomas of the Ovary A Clinicopathologic Analysis of 23 Cases. Cancer 53: 1143–1155. [crossref]
  4. Oliva E, Egger JR, Young RH (2014) Primary Endometrioid Stromal Sarcoma of the Ovary A Clinicopathologic Study of 27 Cases With Morphologic and Behavioral Features Similar to Those of UterineLow-grade Endometrial Stromal Sarcoma. Am J Surg Pathol 38: 305–315.[crossref]
  5. WHO (2003) Classification of Tumours – Pathology & Genetics-Tumours ofbthebreast and Femalegenital Organs- IARC Press, Lyon
  6. WHO (2014) Classification of Tumours – Pathology & Genetics Tumours of the breast and Female genital Organs- IARC Press, Lyon
  7. Chang KL, Crabtree GS, Lim-Tan SK, Kempson RL, Hendrickson MR (1993) Primary extrauterine endometrial stromal neoplasms: a clinicopathologic study of 20 cases and a review of the literature. Int J Gynecol Pathol 12: 282–296. [crossref]
  8. Baiocchi G, Kavanagh JJ, Wharton JT (1990) Endometrioid stromal sarcomas arising from ovarian and extraovarian endometriosis: report of two cases and review of the literature. Gynecol Oncol 36: 147–151. [crossref]
  9. Lan C, Huang X, Lin S, Cai M, Liu J (2012) Endometrial Stromal Sarcoma Arising from Endometriosis: A Clinicopathological Study and Literature Review. Gynecol Obstet Invest 74: 288–297. crossref]
  10. Usta TA, Sonmez SE, Oztarhan A, Karacan T (2014) Endometrial stromal sarcoma in the abdominal wall arising from scar endometriosis. J Obstet Gynaecol 34: 541–542. [crossref]
  11. Ju A Back, Myeong Gyune Choi, U Chul Ju, Woo Dae Kang, Seok Mo Kim (2016) A case of advanced stage endometrial stromal sarcoma of the ovary arising from endometriosis. Obstet Gynecol Sci 59: 323–327.
  12. Prichard J, Kaspar H.G (2015) Handbook of Practical Immunohistochemistry: Frequently Asked Questions (positions in Kindle 20288–20289). Kindle Ed, Springer New York.
  13. Lee CH, Ali RH, Rouzbahman M, Marino-Enriquez A, Zhu M, et al. (2012) Cyclin D1 as a diagnostic immunomarker for endometrial stromal sarcoma with YWHAE-FAM22 rearrangement. Am J Surg Pathol 36: 1562–1570. [crossref]
  14. Xie W, Bi X, Cao D, Yang J, Shen K, et al. (2017) Primary endometrioid stromal sarcomas of the ovary: a clinicopathological study of 14 cases with a review of the literature. Oncotarget 8: 63345–63352. [crossref]

Psychoanalytic Understanding of Repeated In-Vitro Fertilization Trials, Failures, and Repetition Compulsion

DOI: 10.31038/IGOJ.2018123

Case Report

Recent advances in reproductive technology and the increased use of techniques based upon it have created a need for psychoanalytic thinking and understanding of the psychological implications of in-vitro fertilization (IVF) and other similar procedures. The recent and rapid advances in medical technologies confront us with the mandate to understand their complex impact on women and their children. As a physician and psychoanalyst, I became aware of my patients’ trouble accepting their infertility after drawn out, continued attempts to have their own children. The acceptance of their failure in conceiving is more of a challenge for some patients than others, although there can never be a final acceptance. The denial of their failure as a couple to conceive can become a long process with unfinished mourning throughout their life cycle.

The two cases in this paper in particular illustrate how infertility traumata were re-experienced. The unconscious self-induced traumatization resulted from the compulsion to repeat an earlier repressed trauma. Freud inferred the existence of motivation beyond the pleasure principle. In 1919 he postulated “the principle of Repetition Compulsion the unconscious mind, based upon instinctual activity and probably inherent in the very nature of the instincts a principle powerful enough to overrule the pleasure-principle.” Building on his 1914 article Recollecting, Repeating and Working Through, Freud highlighted how the “patient cannot remember the whole of what is repressed in him, and is obliged to repeat the repressed material as a contemporary experience instead of…remembering it as something belonging to the past: a compulsion to repeat.”

Those individuals who can better accept their infertility without significant psychological complication resort to other methods of becoming parents to fulfill their life-long expectation. Some may take an alternative step and adopt someone else’s child. Some infertile individuals whose infertility is related to their advanced age use alternative procedures such as In-Vitro Fertilization (IVF). In today’s world, many women want to establish themselves in their careers and choose to postpone reproductive goals until later. When they face reproductive failure, they become extremely anxious, especially when the biological clock is ticking away faster and faster. The narcissistic injury is deep and debases their belief system about self- representation and their body image. Women are affected profoundly by infertility failure. They carry with them the identification linkage with their primary pre-oedipal maternal object, wanting to become a parent. We see clinically girls who play mother roles in fantasy. Once a woman’s pregnancy wishes are frustrated, the denial of an infertile self-image could potentially lead to crisis. The way in which these women react to the trauma of their infertility will determine a number of factors, including how they choose to use a donor egg, donor sperm, or surrogate mother. The character of their traumatic experience also depends upon the process of deciding who will donate their egg, their sperm, or their womb. Though the reasoning varies among theories, experts agree that the ability to become a mother is essential to believing that one is viable as a woman. Freud [1] made passing reference to the subject of human reproduction and pregnancy. The primacy of sexuality in human life for Freud is reflected in his belief that the wish for a child in the woman represents the symbolic substitution for the missing penis; a wish for reparation and completion.

Helene Deutsch [2] questioned the reparative function of the woman procreative life. She made it clear that the woman’s urge to become pregnant and bear a child represents the essentially feminine quality of receptiveness, a bio-physiological concept, the bedrock of femininity.

Benedek and Bibring et al. [3,4] , pioneers in the study of women’s reproductive drive, saw pregnancy as a developmental crisis, and subsequent writers seem to accept this view [5].

In severely traumatized women the wish to be pregnant is not necessarily connected to the wish for a child, as seen by Pines [6]. Pregnancy, instead, is simply seen as an effort to repair the narcissistic injury of early life.

Pines elaborated on mother-daughter relationship as the locus of psychic conflict in women who abort habitually. Pre-oedipal dynamics were discussed and identified by Lester & Notman [5,7] as causing anxieties during the early stages of pregnancy.

In her paper “Infertility in the Age of Technology” [8] Zallusky highlighted the effect of infertility on analytic process. She elaborates on the permeability of the boundaries between analyst and patient and between fantasy and action in psychoanalytic work with women who are infertile and resort to Assisted Reproductive Technology (ART). The immense stress of infertility can trigger regressions to earlier stages of psychological development. Intense feelings of envy and shame felt currently, conflict with their roots in childhood, bringing about a disturbance to the person’s sense of self-identity. As Freud stated, the ego “is first and foremost a body ego” [9]. The earliest way in which we know ourselves is through our body. Kite (2009) emphasized the importance of keeping the emotional reality of the patient in view in a panel on “Current Perspective on Infertility,” in which the motivations for childbearing were discussed in relation to ART.

The entry of a third person-the doctor-into the sexual relationship, as if into the primal scene, is another theme in some of the literature. Also in the context of surrogate mothers and/or sperm donation, Ehrensaft [10] described the feelings and fantasies of parents in relation to having another, outside party involved in conception. She described a stirring up of fantasies of a ménage a trois. She observed that the egg donation or the surrogate could stir up fantasies of the other. Thinking of the sperm as sperm may be defensive against thinking of the sperm as coming from another whole person. Ehrensaft also pointed out the importance of telling children about their origins. Coming to terms with infertility or mourning can manifest as a problem not only for women, but also for both partners as well as primarily for men.

In-Vitro Fertilization

In-vitro fertilization means “fertilization under glass,” ie: in a test tube. IVF is a technique for removing eggs from a woman, fertilizing them outside her body, and placing the fertilized egg, or embryo, directly into the uterus. All IVF procedures have four steps: ovarian stimulation, egg retrieval, fertilization, and embryo transfer.

Overcoming infertility was unimaginable just a generation or two ago. Since then, scientists have devised a way to remove the sperms and eggs and combine them. Eggs are fertilized, and then frozen for future use; sperm strength can be boosted; and even women who lack ovaries may find themselves pregnant. These procedures arouse much curiosity within the general public and within the broad community of infertility and mental health experts.

The first “test tube baby,” was born in 1978. Louise Brown was the first child to be conceived by in-vitro fertilization and was delivered after a full-term pregnancy. In the few years since, IVF has become an important element in the vocabulary of infertility. It has become the cutting edge of modern reproductive treatment and research. In-vitro fertilization requires intact fecundity, normal production of ova. Today, a number of women in mid- to late thirties and early forties, in spite of their intense desire to conceive, remain infertile. Fecundity is intact in many of these subjects, and advances in reproductive technology makes it possible to overcome infertility in some of these cases. New ground continues to be broken as research continues.

Regardless of the cause of infertility, the treatment that leads to the highest pregnancy rate per cycle is in-vitro fertilization. Since its inception in 1978, there has been a remarkable increase in the numbers of IVF cycles worldwide. Approximately one in fifty births in Sweden, one in sixty births in Australia, and one in 80–100 births in the United States now result from IVF. In 2003, more than 100,000 IVF cycles were reported from 399 clinics in the United States, resulting in the birth of more than 48,000 babies. IVF is now the treatment that leads to the highest pregnancy rate per cycle (New England Journal of Medicine, 2007).

Egg donation was introduced in the 1980s, increasing the possibility of pregnancy and child bearing to many women. Many of the women receiving these donations were older and had delayed child bearing for reasons such as establishing careers, personal conflict, and ambivalent feeling about becoming mothers. These women, and those who had illnesses the treatment of which affected their fertility, were then able to have children. Still, egg donation brought up a great deal of controversy. In addition to ethical dilemma, egg donation presents issues such as parental identity confusion and compromised sense of social group belongingness. I have encountered many clinical examples of this but expounding upon them would be beyond the scope of this paper.

The use of surrogates-women who carry a pregnancy for another individual or couple – generates further possibilities for women unable to conceive. The baby can have the genetic identity of the couple -that is, the ovum can be obtained from the woman in the couple and be fertilized by the man’s sperm and then implanted in the woman who has agreed to be the surrogate – or the surrogate can supply the ovum and the sperm can be the husband’s or come from a donor. This has made having a genetically related baby possible for gay couples, as well for women who for some reason, such as repeated pregnancy loss, cannot carry a baby to term but have viable ova. It is possible to freeze sperm, eggs, or embryos for later use.

Implanting more than one embryo increases the likelihood of having a viable pregnancy. It also increases the likelihood of multiple births, which carries greater risks. The decision to reduce one or more embryos in the lieu of multiple implantations is a difficult one. In this article, I do not focus on the traumatic effect of infertility. Instead I discuss the use of multiple IVF trials despite repeated failures. One of the cases I discuss, for example, presents a serious narcissistic injury and disappointment at the discovery of infertility, which in turn affected the decision and the process of assisted reproductive technology. The delay in decision-making created medical risks during this woman’s pregnancies. She insisted on going through a second pregnancy using her own uterus to carry a fetus that came from the union of her husband’s sperm and an egg donor, her niece.

Unexplained Infertility

No matter how sophisticated the technique used to combat infertility, there are cases in which a woman remains infertile. Some causes of infertility remain beyond our understanding, even in these days of enlightened biological technology and modern-day high-tech reproductive procedures. These as-yet unsolved mysteries are very frustrating to those trying to understand why some people can conceive and others cannot. Unexplained infertility is a “diagnosis of exclusion.” This means that all other known diagnoses must be eliminated before the infertility can fairly be called “unexplained.” Making claims about the causality of infertility and the concept of psychogenic infertility is not a useful argument for us as psychoanalysts. Conscious and unconscious hostility toward a defective male sibling [11], and a woman’s unconscious repudiated femininity or motherhood can be important dynamics. However, there are couples who are able to conceive naturally in spite of similar dynamics. We need to be careful not to confuse the correlational data with causality.

In recent years, infertility treatment has undergone a genuine revolution, which has raised the possibilities for empirical treatment. Today’s infertility treatment is referred to as “assisted reproductive technology;” most simply stated, ART represents the joining of a hormonal therapy with a form of artificial insemination. ART is most commonly represented by intra-uterine insemination, IVF, and IVF’s variations.

Case #1: Jean

Jean, a married forty-eight year old woman, came to see me for analysis after a hiatus in her psychotherapy. During her previous years of treatment with me when she was in her early forties, she saw me twice a week. She worked in a demanding professional field and did not know why she could not conceive. She decided to wait and try natural methods to get pregnant. She made many attempts over a long period of time to conceive without any success. Jean’s professional life was a trying and challenging one and kept her very occupied to the point that she lost track of passing years. She did take pride in her work and wanted to appear to her colleagues as “perfect” and “flawless.”

Jean’s inability to conceive was very difficult for her to accept, since she thought nothing was physically wrong with her. Male factors for infertility were ruled out. It meant to her that she was defective. Jean’s husband, who was in a similar professional field, was very supportive of her; and he was willing to adopt or even be childless if Jean chose not to have any children. Jean was shame ridden about being defective and not being able to have children as her mother did. She felt intense envy toward her mother and especially her sister who was five years her senior and had one son. Her envy of pregnant women was very intense, making her angry when she encountered pregnant women. Jean came from a deprived background both emotionally and financially. She had memories of not having food and going hungry to school. She was not sure if she was conceived out of wedlock. She believed her sister was so conceived, and in her fantasy she thought her father never married her mother.

Jean’s brother was born when she was eight years old. She remembers her parents were overjoyed because they finally had a son after so many years. Jean devalued her mother for her emotional detachment, but would also show guilty feelings for her rage toward her mother. In her day-to-day interactions, Jean lacked emotional responsiveness. She tried hard to be friendly with her colleagues, as long as they praised her at work. She had many superficial friendships, but she could not go beyond the surface level in relationships. At the beginning of our work, this patient had immediate realistic concerns about dying before she could fulfill her dream of becoming a mother. Her resistance to becoming fully involved in the transference was expressed in the form of overvaluing her job, dealing with life and death issues, and considering her analysis “just talking,” a process in which “not much important action was happening.”

Jean related that no matter how much insight she would gain through our work, she still needed to take action by hurrying to have children from her own eggs before it was too late. She wanted her gynecologist to give her strong fertility medication like Lupron and other infertility medications to make her fertile. She went through multiple IVF procedures during this period. Each time they harvested her eggs, she would come in and boast about how many of her own eggs they were able to harvest. She turned a blind eye to the factual comments that several experts made to her about her age factor, which made her eggs unsuitable for IVF. She knew that the probability of getting a viable embryo out of her ovum was very low. She vehemently defended her decision and said, “I just do not want to borrow another woman’s eggs.”

“Borrowing” another woman’s eggs would mean that Jean was inferior to egg donors. After her husband suggested that perhaps they could consider an anonymous donor, though, she assented. Yet she waffled. If she could only find an anonymous donor from another country, perhaps she would follow through. In the end, Jean turned away from making the decision.

At this stage of our work, she was obsessed with going through many cycles of IVFs without showing much interest in exploring the meaning of her desperate actions. Only after many failures in conceiving did Jean begin to wonder why she could not get pregnant. She thought she was either being punished or she was just flawed. Her almost total absence of fantasy material toward me gradually gave way to being intensively curious about my personal life after she inadvertently learned that I had a daughter. Having found out through a friend who attended a fund-raising event where I was participating with my daughter, Jean imagined that I must be an attentive mother myself and not like her own mother who was aloof and detached. She would use technical terms to show me that she was psychologically minded and a well-read, intellectual woman. However, she would mispronounce or misuse words and quickly apologize to me for not having used the word accurately.

Jean would come to her sessions punctually, and she would get anxious when I took a break for a holiday or professional travel. She worried that I would never come back and that some disaster would separate us forever.

Gradually, the intense fear of her rage and somatic complaints gave way to uncovering the meaning of her dread over anything emotionally valuable in her life. She had intense envy of me as her analyst, and in fantasy wanted to exchange my rich and fulfilling life as a mother for her own barren existence.

In one of our sessions, after complaining that she had spent so many years of life in analysis without much change in her grief over being flawed (she still believed she was flawed), she agreed with my comment that I, too, must have failed her not to have given her the wisdom of my knowledge and experience; like her mother I, too, have given birth to a barren analytic child who was infertile. She acknowledged that although she agreed with much of what I said, she still had not given up on going through yet another IVF trial at her age. She was sure I could be not happy with her inability to conceive and that I would interpret it as if we both had failed.

Jean’s conflict around unconscious envy of me emerged as an expression of hatred and distrust of her mother. Her sense of competitiveness also emerged as she wished to have a sense of triumph instead of missed opportunities. Her denial of reality regarding her advanced age for a successful IVF outcome continued to take the center stage of our analytic work. Jean continued to seek the creation of a baby from her own eggs fertilized by her husband’s sperm. After seven trials without any success, she regretted putting herself through such vigorous procedures for a woman her age. She became more interested in the meaning of her loss. Finally she had to face it and go through the grief stage. She realized that she could no longer hold on to her dream.

At the end Jean realized that she could neither have a genetically related child, nor could she accept another woman’s egg. After all, she could not picture herself as a nurturing mother, and she concluded that it may be for the best not to become a mother. She could not be like her own fertile mother and had to accept the reality of growing old. Finally, she was able to face her ambivalence. Jean could learn to be more nurturing to the vulnerable part of herself.

At this point, the memory of her brother’s birth came up and her rivalry with him became a central theme in our work. The following is an example of how Jean characterized her envy:

Patient: I have all these mean thoughts and I feel really bad.

Analyst: Carrying the mean thoughts makes you feel guilt.

P: It is very harmful to be occupied with them.

A: In our last hour you mentioned how hard it was to deal with jealousy at your brother’s birth.

P: Yes, Mom was mad at me for being jealous of my brother. I am never good enough. Other people have talents and value, not me. There is this other part of me that is irrational and unkind.

There was always a feeling about my chance of getting pregnant with IVFs. How many attempts I made to give birth was like pushing a pickle through a straw. How many mean thoughts I would have! I am trying to make sense of these feelings. I am flawed, but I want to be saintly and have power to make these women lose their babies or relinquish them when they are born. I have those mean, evil thoughts. I am torn again all the time.

It ran through my mind that if I had special power, the technology would have worked for me. I would have gotten pregnant by now. Technology is amazing and works for others, but not me. There is a zinger in that. I did not want to have a flawed child, so maybe it was for the best that I did not get pregnant.

After many years of attempts, Jean was in a place to make a decision to adopt a one-year-old girl from China. This was a reasonable compromise for her after so many years of struggling with her desire to have her own biological child. Our analytical work had helped her to work through her early mother-daughter and Oedipal conflicts.

Case#2: Fran

Fran was a forty-eight year-old lawyer who came to see me because of depressive symptoms and romantic disinterest in her husband. She was hurt and angry because her husband became emotionally involved with a woman at his work. She thought her husband had become detached because she was putting all of her effort into using reproductive technology to get pregnant.

Before her current marriage, she had been briefly married to a man who was very critical of her weight even though she was a woman of normal weight. They divorced after one year. She remarried at age forty after four years of a long-distance relationship with the man who became her husband. Her husband is an architect whom she met while she attended law school. Their sexual attraction and their individual interests in sexual activity diminished over time until it became non-existent.

Fran was interested in having children and tried without success to get pregnant in the earlier years of her marriage. She and her husband went through a reproductive/fertility work up and did intra-uterine insemination without success. In the same year, it was discovered that her uterus had three large myoma. She underwent a myomectomy and then tried to get pregnant naturally. After many months without success, she went through six IVF procedures. Each time, Fran repeated the cycle of overstimulation of the ovaries, harvesting the eggs, in-vitro fertilization, and freezing of the viable embryos. She would become very hopeful and when the transfer failed, she would come to her sessions, crying in silence and going through another cycle of unfinished grief work. Fran then quickly bounced back and wanted to try IVF again. Her denial about the loss of her youth, wanting to remain a young fertile woman forever, was unshakable, and her sense of omnipotence governed her fantasy.

Fran came from a family of eight children. Her father was a professor and her mother a nurse. After the first three children became school age, her mother decided to have a second set of five children. Fran is the eldest of the second set. Fran’s father was overcritical and was frequently away traveling. Her mother was nurturing to the younger children, but the older ones were neglected. Fran had to take care of her younger siblings and did not have much private time for herself. She grew angrier each time her mother got pregnant. Her mother’s fertility was the topic of Fran’s conversations with her friends and in her therapy. Fran’s conflict about motherhood was significant during the early years of her marriage. There were psychological as well as physical factors in her infertility that interfered with her becoming pregnant. She dis-identified with her mother who was “fruitful and multiplied.”

As time progressed, Fran became aware of time’s passage and questioned her childlessness. She became anxious and rushed to remedy her infertility by choosing to become a mother despite her inability to conceive naturally. Fran was influenced by unconscious psychological factors. Her unconscious repudiation of her femininity played an important role in her difficulty conceiving.

During her psychoanalytic treatment, Fran’s developmental achievement of greater autonomy helped her “own” her femininity more fully. This enabled her to see herself more as a mature woman who needed to embark on the motherhood phase of her life despite her advanced years.

Fran and her husband tried to get pregnant for over ten years. She was almost fifty when she went through her first IVF. Her doctor said the chance of success was very slim, but she wanted to go through with it anyway. When it failed, she became depressed and had to deal with the loss of a dream to have a child with her own egg. She was struggling with her own sense of omnipotence – with issues of creating life – in an ambivalent way, destroying life via denial of the reality of her advanced age. Through our analytic work, she gradually became aware of her intense repetition compulsion, accepting the reality of her aging ovum and ushering her body into the menopause phase of life. With reluctance, Fran considered going through a search for an egg donor. She decided to ask her niece to become her donor. Her niece was a young woman in her early twenties. Her niece agreed to go through the procedure for Fran with Fran’s husband’s sperm.

The IVF was successful and the healthy fetus was implanted in Fran’s uterus. The clinic kept three more embryos for possible future pregnancies. Fran’s pregnancy was normal and her delivery uneventful. When her baby girl was born, Fran brought her to show me in my office. The girl had faint resemblance to her mother and Fran admitted that she looked like her niece more than her. She was thankful that her daughter was physically healthy.

This case shows a happy ending in certain respects and yet, there are many unanswered question about Fran’s family dynamics. What will happen when the child asks where she came from? When the little girl became a school-aged child, Fran was not ready to disclose the reality of her origin. She is working in treatment to understand the underlying meaning of her decision of keeping it secret despite the fact that the rest of her family knows the child’s origins.

Discussion

The two cases I described have a few psychological factors in common. Both women started rather late in their reproductive years to get pregnant. Their denials of their advanced age factor motivated both women to resort to repeated IVF trials without success. Both women had trouble accepting their infertility and insisted on having their own biological children. Jean felt deficient and deprived. She felt it was her right to have a baby. She was envious of her mother, sister, and sister–in-law’s abilities to have their own children, and she wondered why not her. Jean was told her eggs may be defective, and her doctor advised her to use an egg donor. She was in despair and felt envious of her mother who did not have to go through a fertility work up. Jean attributed her difficulty conceiving to her mother’s belief that she could not carry a baby because of her delicate body frame. After all, her mother’s prophesy must have come true. At last Jean faced her infertility while she was going through her analytical work with me. With Fran, once her pregnancy wishes were frustrated, the denial of her infertile self-image pushed her to a potential crisis level. Her repetition compulsion is related to her unconscious envy of her mother who was “fruitful and multiplied,” having eight children, unlike her. After multiple trials, Fran accepted that the only way she could become pregnant was through a donor egg. She has not fully thought through the pros and cons of selecting a family member as her egg donor.

Both patients’ narcissistic injuries were deep, and this debased their belief system about their self-representations and their body images. They carry with them the identificatory linkage with their primary pre-oedipal maternal object, wanting to become parents. As we see clinically, girls play mother roles in fantasy. In reality once their wishes are unfulfilled, the desire to get a different result than the one they face reaches a critical level. These conflicts propel them to try repeatedly to master the traumatic impact of their infertility.

Both cases suffered from the trauma of having to go through reproductive technology. Jean took an alternative step and adopted a child, while Fran got pregnant with a donor egg. Freud introduced the concept of repetition compulsion in Remembering, Repeating and Working-Through and Beyond the Pleasure Principle [12,13]. These essays marked a major turning point in Freud’s theoretical approach. Previously, he had attributed most human behavior to the sexual instinct (libido). He went “beyond” the simple pleasure principle, developing his theory of drives with the addition of death drive (referred to “Thanatos”).

Freud examined the relationship between repetition compulsion and the pleasure principle. Although compulsive behaviors evidently satisfied some sort of drive, they were a source of direct un-pleasure. Somehow, “no lesson has been learnt from the old experience of these activities having led only to un-pleasure. In spite of that, they are repeated, under pressure of a compulsion.” Freud concluded that the human psyche includes a compulsion to repeat that is independent of the pleasure principle.

In my clinical experiences working with a small group of women who have tried using IVF multiple times without any success, I saw clear evidence that unconsciously they resort to repeating a self-induced traumatic event. A compulsion to repeat was evident in my analytical work with women who went through multiple IVFs without a successful outcome.

One of the important factors in Jean’s case – repeating the use of procedure – illustrated her attempt to repair her early childhood neglect and abandonment. What is particular in Jean’s case is her nonchalant attitude about the doctor’s repeated warnings against using her aged eggs. Her denial was persistent, yet through our work she could finally face the reality of her infertility. Jean’s fertility process required her to be away from her analysis for a prolonged period. Though on one level this was a matter of time, on another it was psychological; the reason she needed to be away was as a defense against intimacy with her analyst. One might think of her transference as a particular form of unconscious communication as appears in the projective identification process. She was abandoning me to fulfill her very important procreative goal– leaving a pre-oedipal mother.

Fran’s case showed her significant conflict throughout her marriage. Aside from the physical factors that prolonged her attempts to get pregnant, she also had unconsciously dis-identified with her mother for fear of repeating her mother’s fruitfulness in procreation. Freud’s repetition compulsion concept applies to these two cases in which the clinical phenomenon manifests with repetitive quality. However, analysis helped these two patients immensely with their aggressive conflicts as well as with the uncovering of their past trauma.

Freud cited four empirical observations as the basis for his theories and speculations: first, dreams occur in the traumatic neuroses in which patients repeat a traumatic situation. Second, there is a tendency on patients’ part to repeat painful experiences from the past during their analyses. Third, the fate neuroses were an important notion. And fourth, certain types of children’s play supports the concept of repetition.

In Moore and Fine’s Psychoanalytic Terms and Concepts (1990), the meaning of the term “repetition compulsion” was extended to include drives for mastery as well as other adaptational and maturational processes. In Freud’s speculations in Beyond the Pleasure Principle (1922), the repetition compulsion is presented as an explanatory concept, inextricably tied to the death instinct. It functions as a regulatory principle, primitive in its origin and mechanisms, biologically based, and capable of overriding the pleasure/un-pleasure principle. Kubie [14] stated that analysts after Freud have offered such diverse interpretations of the concept “as to render it almost meaningless” (p. 390).

Some contemporary authors believe that Freud’s early concept of repetition compulsion is non-dynamic, negativistic and fatalistic; Lawrence B. Inderbitzin MD and Steven Levy, MD [15] (Psychoanalytic Quarterly. 67: 32–53 Repetition Compulsion Revisited: Implication for Technique).

There are many references to the repetition compulsion in psychoanalytic and psychiatric literature; I will list a selection that refers to the origin of the concept of compulsion to repeat and where it belongs in psychic structure.

Inderbitzin and Levy (1998) believe that one has to pay close attention to a more meaningful dynamic formulation, which includes a consideration of the intense frustration and ensuing aggression that trauma generates, and the opportunities for aggression provided by “re-experiencing trauma.” Trauma appears to take on an instinct-like role that really belongs to the aggression created by the trauma. The re-experiences of trauma contain hidden aggressive aims and gratifications (often based on identification with the aggressor), including punishment of perpetrators by inducing guilt, demand for reparation, expression of entitlement, exploitation of others, magical “control” of helplessness, and purposeful self-defeat (self-directed aggression).

A woman’s failure to conceive may be related to the traumatic and unsatisfactory relationship to her mother. The re-experience of trauma by repeated use of Assisted Reproductive Technology such as IVF, contains masked aggression, which is turned against self or others. The aggression may take the form of a demand for reparation and a magical solution to her age-induced infertility. Two clinical illustrations show how infertility traumata were re-experienced as a new version of an earlier trauma with self-induced traumatization through a compulsion to repeat.

References

  1. Freud S (1940) An outline of psychoanalysis. S.E 23.
  2. Deutsch H (1945) The Psychology of women. Grune and Stratton, Vol II, New York.
  3. Benedek T (1952) Psychosocial Functions in Women. Ronald Press, New York.
  4. Bibring G ET (1961) A study of psychological process in pregnancy and of the earliest mother and child relationship. Psychoanl Study Child 16: 9–72.
  5. Notman M, Lester EP (1988) Pregnnacy: theoretical considerations. Psychoanl Inq 8: 139–160.
  6. Pines D (1982) Relevance of early development to pregnancy and abortion. Int J Psychoanal 61: 311–331.
  7. Lester EP, Notman M (1986) Pregnancy, developmental crisis and object relations: Psychoanalytic considerations. Int J Psychoanal 62: 357–366.
  8. Zalusky S (2000) Infertility in the age of technology. J Am Psychoanal Assoc 48: 1541–1562. [crossref]
  9. Freud S (1923) The Ego and the Id. S E 19; 12–66.
  10. Ehrensaft D (2008) When baby makes three or four or more, Psychanal. Study Child 63: 3–23.
  11. Allison GH (1997) Motherhood, motherliness, and psychogenic infertility. Psychoanalytic Quarterly 66: 1–17.
  12. Freud S (1914) Remembering, repeating and working-through. (Further recommendations on the technique of psycho-analysis II.) S E 12.
  13. Freud S (1920) Beyond the pleasure principle. SE 18.
  14. Kubie LS (1939) A critical analysis of the concept of a repetition compulsion. Int J Psycho-Anal 20: 390–402.
  15. Inderbitzin L B, Levy S (1998) Repetition Compulsion revisited: Implication for Technique, Psychoanalytic quarterly 67: 32–53.

Studies on the Evaluation of Preservative Efficacy of 2-Pyrrolidone for Oral Paediatric Formulations

DOI: 10.31038/JPPR.2018114

Abstract

Pharmaceutical oral dosage forms intended to children have to be administered under liquid dosage forms. These oral liquid formulations contained into multidose containers require the addition of antimicrobial agents to avoid the growth of microorganisms. Moreover, the oral administration of poorly water soluble drugs requires the use of excipients (organic solvent, cyclodextrins, surfactants, polymers) able to improve their water solubility. 2-pyrrolidone (Soluphor® P) a co-solvent usually used to dissolve drugs for the manufacture of parenteral dosage forms and suggested also for other administration routes, showed antimicrobial activity. To study the extent of its preservative efficacy, we determined the minimum inhibitory concentration (MIC) and the minimum bactericidal concentration (MBC) first, for bacteria (Staphylococcus aureus, Pseudomonas aeruginosa, Escherichia coli, Enterococcus faecalis, Staphylococcus epidermidis, Staphylococcus capitis) and for bacterial spores (Bacillus cereus, Bacillus sphaericus, Bacillus subtilis), then for yeast and mould (Candida albicans, Aspergillus niger). The results showed that 2-pyrrolidone has a bactericidal and fungistatic efficacy. Challenge tests were realized on oral aqueous paediatric formulations of vitamin D3 containing 2-pyrrolidone as a co-solvent and all known micro-organisms in such formulations were studied. The preservative efficacy of 2-pyrrolidone was observed at a dosage level of 75 mg/mL.

Keywords

preservative efficacy, antimicrobial, bactericidal, sporistatic, paediatric dosage forms, 2-pyrrolidone, challenge test, micellar solution, Vitamin E TPGS®.

1. Introduction

Beside the issues of immaturity of enzymes or reduced organ functions, encountered by the neonates and infants, which may determine the pharmacokinetics of the administered drugs, children [1] show difficulties in swallowing solid dosageforms for oral use. Fot this reason, for this patient group, small sized particulates or liquid dosage forms are preferred to classic tablets or capsules [2]. The main problems occurring using liquids are (i) the palatability of the solution [3,4], especially when the taste sensation differs interindividually, (ii) the poor water solubility of many drugs, (iii) the shelf stability of the final liquid dosage forms, often prone to degradation reactions (oxidation, reduction, epimerization, hydrolysis, …) and (iv) the microbiological safety of the product, namely its protection from microbial contaminations occurring from consumer use [5] Amongst the different techniques used to increase the water-solubility of drugs [6], the ones using co-solvents and surfactants are the easiest to use industrially. Unfortunately, for the formulations and developments of paediatric medicines [7,8] the use of co-solvents (e.g. ethanol, glycerol) is not recommended at high levels due to their neurological and laxative effects. Furthermore, the addition of surfactants into multidose dosage forms, necessitating the need of preservatives, can lead to the formation of complex of molecules with these compounds and also to a decrease of their activity [9–11]. Amongst solubilising excipients used in oral and injectable formulations, 2-pyrrolidone is a pharmaceutical FDA-approved solvent found in many marketed forms of poorly soluble drugs. Nevertheless, even if 2-pyrrolidone is recommended by suppliers to be used to construct oral dosage forms, only few studies have been conducted on this excipient. Beside the well-known solubilizing property on this excipient, we found also an antibacterial activity. To validate this new concept in the paediatric field, we used an antirachitic lipophilic model drug such as vitamin D3 and its antioxidizing agent, propyl gallate and sodium fluoride as hydrophilic drug. To prove the extent of this new antimicrobial activity, we determined the minimum inhibitory concentration (MIC) and the minimum bactericidal concentration (MBC) first for gram-positive bacteria (Enterococcus faecalis, Staphylococcus aureus, Staphylococcus epidermidis, Staphylococcus capitis) gram-negative bacteria (Pseudomonas aeruginosa, Escherichia coli) spore-forming gram-positive rods (Bacillus cereus, Bacillus sphaericus, Bacillus subtilis) and then for yeast (Candida albicans) and fungus (Aspergillus niger). Then challenge tests were realized according to European Pharmacopeia 9.0 (EP) criteria on oral aqueous paediatric formulations containing 2-pyrrolidone as a co-solvent of vitamin D3. The results presented below suggest that 2-pyrrolidone could find very interesting applications as a potent excipient with antimicrobial activity into liquid dosage forms.

2. Methods and Materials

2.1. Solubility determinations

The phase-solubility method developed by Higuchi and Connors [12] was used to determine the solubility for vitamin D3 (cholecalciferol, Fluka, Saint Quentin Fallavier, France). Sample vials were prepared in triplicate by adding an excess amount of vitamin D3 to vials containing either 100 g of 2-pyrrolidone aqueous solutions at various concentrations (w/w: 1, 5, 10, 20, 30, 40, 50%); or 100 g of 2-pyrrolidone aqueous solutions at 40% (w/w) containing also 1.50 or 3.0% (w/w) of d-α-tocopheryl polyethylene glycol 1000 succinate (Vitamin E TPGS® NF Grade, Eastman, Anglesey, United Kingdom). The precipitates were removed through 0.45-µm TEFE syringe filters (Millipore, Molsheim, France). The vials were then closed withTEFE-lined rubber-stoppers and were rotated at 40 rpm using an end-over-end mechanical rotator (Vankel, VK 750D) at 25°C for 30 minutes. The drug solubility in aqueous solutions at various 2-pyrrolidone/Vitamin E TPGS® ratio was determined using a high performance liquid chromatography (HPLC) assay as stated below.

2.2. Preparation of micellar solutions

The micellar solutions were prepared according to a standard method employing a room temperature homogeneization [13]. The three tested compositions of micellar solutions are presented in
(Table 1). Briefly, d-α-tocopheryl polyethylene glycol 1000 succinate and 2-pyrrolidone were heated at 40°C and then the mixture was cooled at 20°C. The vitamin D3 and propyl gallate (Fluka, Saint Quentin Fallavier, France) were dissolved and homogeneized into this solution. This solution was added and homogenized with an aqueous solution constituted of a mixture of sodium fluoride, saccharin sodium, aroma of red fruits without vanillin and liquid maltitol (Lycasin® 80/55-sirup, Roquette, Lestrem, France).

Table 1. Compositions of the micellar solutions.

Compounds

Composition (g)

Formulation A

Formulation B

Formulation C

Vitamin D3

0.0080

0.0080

Sodium fluoride

0.2200

0.2200

0.2200

Propyl gallate

0.0200

0.200

Vitmain E TPGS®

1.5000

1.5000

Saccharin sodium

0.5000

0.5000

0.5000

Aroma without vanillin

0.4000

0.4000

0.4000

2-pyrrolidone

40.00

40.00

40.00

Lycasin® 80/55-sirup

40.00

40.00

40.00

Purified water

QSP 100.00

QSP 100.00

QSP 100.00

2.3. Granulometry analyses

The average size and distribution of surfactant micelles were determined by light scattering (DLS) using a Zeta Sizer Nano Zs (Malvern) with a He-Ne laser light (λ= 633 nm) and a detection angle of 90°. The viscosities of the micellar solutions were comprised between 0.65 and 0.90 cP.

The measurements were carried out at 25°C. The final sample of micellar solution was diluted in water (MilliQ) to bring the concentration to 0.1mL/1mL. Measurements were made in conventional cuvettes, eliminating the possibility of sample cross-contamination. The intensity average diameter was computed from the intensity autocorrelation data using the cumulate analysis method. Micelle size measurements were performed 5 times for each sample.

2.4. Quantitations of vitamin D3 and sodium fluoride

2.4.1. Quantitation of vitamin D3

2.4.1.1. Equipment

Vitamin D3 was quantified by HPLC. The chromatographic system consisted of a model LC-126 programmable pump, a model LC-507 automatic injector, and a model LC-166 variable wavelength UV – Vis detector. All items were purchased from Beckman System Gold (Villepinte, France). HPLC analysis was carried out at a temperature of 20 ± 2°C using a Macherey-Nagel C8 5 μm (125 x 4.0 mm I.D.) reversed-phase column with spherical particles having pores diameter of 10 nm. Chromatographic data were analysed by Karat Software Version 32.0.

2.4.1.2. Chromatographic conditions

The mobile phase consisted of 100 volumes of a 0.11% (v/v) solution of phosphoric acid (Merck, Darmstadt, Germany) and 900 volumes of acetonitrile (Sigma-Aldrich, Saint Quentin Fallavier, France). The flow rate was 1.4 ml/min and detection wavelength was set at 268 nm. Aliquot of 20 µl were injected onto reversed-phase Lichrospher C8 column. All the solvents used in chromatography were of HPLC grade and deionized water used for the preparations of the micellar solutions and for HPLC was obtained from a synergy UV water purification system (Millipore, Molsheim, France). All other chemicals were of analytical reagent grade and used as received.

2.4.1.3. Preparation of standard solutions

Vitamin D3 (≥99.0%) was used for preparing standard solutions in Methanol. The concentrations of these solutions were approximately 8.0 mg per 100 mL; they were stored at +4°C in the dark. Serial dilutions for the analytical HPLC were made in methanol/water (70/30, v/v) to obtain concentrations ranging from 11.50 to 26.83 µg/mL. All procedures were performed in a darkened container. In addition, glassware used in this assay was rinsed with acetone before use. The samples of vitamin D3 in 2-pyrrolidone (solubility determinations) and in micellar solutions (see below) were diluted with a mixture of methanol/water (70/30, v/v) before to be analysed.

2.4.1.4. Method validation

The method was validated for parameters such as linearity, precision, accuracy, and stability following the analytical validation guidelines defined by Caporal et al. and Chaminade et al. [14–17] three different blank samples were processed and injected into the HPLC system to investigate whether the components of the micellar solutions interfere with analytes. Three calibration curves were constructed according to section 2.4.1.3 and analyzed on 3 consecutive days.

The accuracy and precision were evaluated using samples at five concentration levels. Three replicate samples at each concentration were analyzed in a sequence to evaluate within-day variation. For evaluation of the between-day variation, three replicate samples at each concentration were analyzed on 3 different days. The accuracy was expressed by [(mean observed concentration)/(spiked concentration)] × 100% and the precision by relative standard deviation. The recoveries of vitamin D3 were evaluated by comparing the mean peak area of samples to the mean peak area of pure standards of equivalent concentrations.

2.4.2. Quantitation of sodium fluoride

2.4.2.1. Equipment

An ion analyzer (CyberScan ion 510 Meter, Eutech Instruments, Nijkerk, Netherlands) was used to measure the fluoride concentrations using a fluoride ion-specific combination electrode (Fischer Bioblock Scientific, Illkirch, France). The instrument was calibrated to measure fluoride concentrations between 0.02 ppm and 10 ppm.

2.4.2.2. Preparation of standard solutions and method validation

The fluoride concentrations in micellar solutions were determined after dilution. A set of fluoride standard solutions (ranging between 0.025 and 3.200 μg F/mL) was prepared, using serial dilutions from 100 μg F/mL NaF stock solution (Fischer Bioblock Scientific, Illkirch, France). The multivoltage potentials were converted to μg F /g using a standard curve with a coefficient correlation of r ≥0.99. The mean repeatability of the readings, based on duplicate samples, was 92.3%. The total amount of fluoride (mg) in the micellar preparations was calculated from the amount of fluoride in the sample and the total volume of the sample after homogeneization.

2.5. Determination of the minimum inhibitory concentration (MIC) and of the minimum bactericidal concentration (MBC) of 2-pyrrolidone

2.5.1. Bacterial, yeast and mould strains culture conditions

Bacterial strains Pseudomonas aeruginosa (ATCC 9027), Staphylococcus aureus (ATCC 6538), Escherichia coli (ATCC 8739); yeast strain Candida albicans (ATCC 10231) and mould strain Aspergillus niger (ATCC 16404) all recommended by the EP have been used. Furthermore, wild bacterial strains such as Enterococcus faecalis, Staphylococcus epidermidis, Staphylococcus capitis provided from our laboratory and spores from Bacillus subtilis, Bacillus cereus and Bacillus sphaericus have been also tested. Before use, the bacteria were kept frozen at -80°C in brain-heart infusion broth (bioMérieux, Marcy l’Etoile, France) supplemented with 20% glycerol.

Bacterial cultures were grown on trypticase soy agar (TSA) (bioMérieux, Marcy l’Etoile, France) at 37°C. Yeast and mould cultures were grown on Sabouraud agar medium (SAB) (bioMérieux, Marcy l’Etoile, France) at 30°C. The inoculum was prepared by suspending overnight cultures at 37°C in Mueller-Hinton (bioMérieux, Marcy l’Etoile, France) broth and adjusting to an OD620 of 0.15–0.16 corresponding to 1–3×10⁸ colony-forming units (CFU)/mL. C. albicans (ATCC 10231) (6.7×10⁷ CFU/tablet) and A. niger (ATCC 16404) (5.4×10⁶ CFU/tablet) were provided by AES laboratoire (Combourg, France). MIC for C. albicans and A. niger has been realised in Sabouraud medium broth (bioMérieux, Marcy l’Etoile, France).

B. sphaericus and B. cereus spores were isolated from growth culture on specific medium (meat extract 2.4g; peptone 2.4g; NaCl 1.2g; MnSO4.4 H2O 0.03g; KH2PO4 0.25g; agar 13g; water 1000 mL) while B. subtilis spores (106 spores/tablet) was purchased from AES laboratoire, Combourg, France. Briefly, B. sphaericus and B. cereus spores were obtained after 48h culture at 37°C on a slant of specific medium. Specific medium was flooded with 2 mL of sterile water and shaked 15 s. The water was transferred in a sterile tube and heated 15 min at 80°C. Serial 10-1 dilutions of the spore solutions were enumerated by the plating method on TSA medium. MIC determination has been done in Mueller-Hinton broth (bioMérieux, Marcy l’Etoile, France).

2.5.2. Preparation of the samples

The experiments for the determinations of MIC and MBC have been carried out under aseptic conditions and precautions have been taken against microbial contamination. Nevertheless, experimental conditions were such that they do not affect any micro-organisms which were to be revealed in the test. The working conditions in which the tests were performed were monitored regularly by appropriate sampling of the working area and by carrying out appropriate controls (such as those indicated in those indicated in the appropriate European Community Diretives and associated guidance documents on GMP).

2-pyrrolidone and water were sterilized by filtration (0.45 μm pore size filters, Dutscher, Brumath, France) before use. First of all, a solution containing 800 mg/mL was prepared by adding 2.75 mL of deionized water to 7.25 mL of 2-pyrrolidone.

In a first step, a series of test tubes containing different concentrations in descending order of 2-pyrrolidone into Mueller-Hinton broth were inoculated with a same amount of bacteria or spores (106 CFU/ml) or into Sabouraud broth for yeast and mould strains. A broth not containing antimicrobial agent was inoculated as a control for organism viability. After 18-24 h of incubation at 37°C, the test tube of the highest concentration in which no microbial growth was observed gives the MIC value (mg/mL). In a second step, 100 μl of samples were taken from each test tube in which no growth was observed. Serial 10-1 dilutions of the samples were enumerated by the plating method on Mueller-Hinton agar or Sabouraud agar. After 24h of incubation at 37°C, or 48h at 30°C for C. albicans and A. niger the numbers of surviving micro-organisms were counted and were compared to the standard ranges (106 CFU/mL). MBC value (mg/mL) corresponds to the concentration of the sample tube in which surviving micro-organisms were equivalent to 0.01%. The ratio MBC/MIC allows determining the antibacterial activity as follows:

MBC/MIC < or = 4 characterize a bactericidal, fungistatic or sporicidal activity

MBC/MIC > 4 characterizes a bacteriostatic, fungistatic or sporostatic activity.

2.6. Test for efficacy of antimicrobial preservation

The official EP Test for the efficacy of antimicrobial preservation is usually applied to preserved oral liquid formulations. Challenge testing was performed using micro-organisms selected from those listed in section 5.1.3. of the EP (S. aureus (ATCC 6538)), P. aeruginosa (ATCC 9027), E. coli (ATCC 8739), C. albicans (ATCC 10231), and A. niger (ATCC 16404)). Containers of the product to be examined were inoculated with a suspension of one of the test organism to give an inoculum at 106 CFU/g.

Briefly, after micro-organism inoculation, the inoculated product (30g) was maintained at 20°C-25°C in the dark. One g aliquots of the inoculated product were removed at 0, 14 and 28 days. To each was added 9mL of a neutralizing solution (Polysorbate 80, 30g; lecithin, 3g; histidine monohydrochloride, 1g; sodium chloride, 4.4g; potassium phosphate dibasic, 3.6g; sodium phosphate dibasic, 7.2g; water,
1000 mL). After being allowed to neutralize for 0.3 h at room temperature, broths were diluted until 10-5 into the neutralizing solution and filtered through 0.45 μm filters 47 mm (Millipore, Molsheim, France). Each membrane filter was rinsed five times with 10 mL of the neutralizing solution. Finally, each membrane was plated on an appropriate agar plate. Bacterial plates were incubated at 30°C for 24h, while yeast and moulds plates were incubated 48 h at 30°C and the CFUs were counted. The control preparations were similarly sampled at 0 h to determine the viable counts of the cultures used and to confirm the ability of the unpreserved formulation to support the viability and/or the microbial growth and also the effectiveness of the neutralizing medium for the inoculum recovery.

3. Results and discussion

3.1. Solubility of vitamin D3 and its formulation

The vitamin D3 solubility in water in the presence of 2-pyrrolidone at various concentration is shown in (Figure 1). In addition, the solubility enhancement of the drug in the presence of Vitamin E TPGS® is also shown. Vitamin D3 has a solubility ranging from 0.01 μg/mL in pure water to 77 μg/mL in aqueous olutions containing 40% [w/w] of 2-pyrrolidone and 1.5 % [w/w] of Vitamin E TPGS®. The use of other excipients in the 2-pyrrolidone and Vitamin E TPGS® formulations resulted in only a slight solubility hancement (data not shown).

JPPR 2018-103-ThierryFVandammeFrance_F1

Figure 1. Solubility of vitamin D3 in various media: water, water + 2-pyrrolidone and water + 2-pyrrolidone + vitamin E-TPGS®

These results suggest that the selection of an adequate mixture of a co-solvent/surfactant can lead to a suitable formulation of a poorly soluble neutral drug candidate such as vitamin D3. As depicted on the Figure 1, the addition of Vitamin E TPGS® in the 2-pyrrolidone formulation was not efficient to improve the water solubility of vitamin D3. Nevertheless, previously, we observed that this excipient could improve the water solubility of propyl gallate, the antioxydizing agent, which is poorly soluble in a 2-pyrrolidone aqueous solution (data not shown). Therefore, in this case, the concomitant use of an excipient and a co-solvent was justified by the solubilities and the physicochemical natures of the drug, vitamin D3 and its antioxydizing agent, propyl gallate, used in the formulation (see formulation B and C below).

3.2. Granulometry analyses

DLS method has been extensively used for particle size analysis in the submicrometer range. It covers the size range of about 1 nm to 1 μm. We applied DLS method to calculate the size distribution of the surfactant micelles formed in aqueous solution with Vitamin E TPGS® micelle for three formulations (A, B, C) are presented in (Table 2). The average size for the formulations A, B and C was respectively 6.02 ± 0.4 (by number) and 11.54 nm (by intensity); 7.69 ± 0.4 (by number) and 13.20 nm (by intensity); 6.54 ± 0.4 (by number) and 13.70 nm (by intensity).

Table 2. Average size of Vitamin E TPGS micelles in formulations at 25°C.

Sample

Size distribution intensity (nm)a

Size distribution by Volume (nm)a

Size distribution by Number (nm)a

Formulation A

11.54±0.5

7.97±0.3

6.02±0.4

Formulation B

13.20±0.7

8.20±0.4

7.69±0.4

Formulation C

13.70±0.9

9.18±0.3

6.54±0.4

aMean of 5 values ± SD

(Figure 2) shows the typical graphs for granulometry analyses for formulation B (formulation C shows a similar graph). This graph shows the size distribution by intensity of micelles formed with 1.5% [w/w] Vitamin E TPGS® in the final formulation.

As shown in Figure 2, by intensity, there is a wide distribution size for the micelles, ranging from 1.05 nm to 13.2 nm. However, micelles of dimension up to 13 nm constitute 94.8% of the total micelle population, with the maximum number of micelles observed at a diameter of 0.866 nm.

3.3. Method validation

3.3.1. Vitamin D3

Analytical separation of vitamin D3 from the excipients present in the formulations is exemplified in (Figure 3). This figure shows the method specificity as none of the added excipients interfered with vitamin D3 which retention time was 4.9 min. Calibration curves were derived from injections at 5 concentrations of vitamin D3 (11.85, 15.80, 19.75, 23.70 and 27.65 μg/mL). The following regression equation was obtained: [vitamin D3]mg/mL= 35884 (peak area)UA + 14265 with r2= 0.999 for vitamin D3. All calibration curves were found to have a good linear regression fit (r2>0.99) within the test range. The limit of detection and quantitation were respectively 0.36 ng/mL and 1.20 ng/mL for vitamin D3. The corresponding relative standard deviation (RSD) was less than 5% for this drug. The limit of detection was calculated on the basis of 3σ and the limit of the quantitation on the basis of 10σ, according to Miller JC and Miller JN [18].

The experiment reproducibility was assayed by performing six replicate injections of a standard mixture of vitamin D3 at 19.16 μg/ml, leading to calculated peak areas in the range of 0.32% and 0.93% (expressed as coefficient of variation).

3.3.2. Sodium fluoride

Using an ion analyzer, quantitation of sodium fluoride was performed. The calibration linearity was obtained over the test range of 12.0–28.2 μg/mL with coefficients of correlation being over 0.999. The mean repeatability of duplicated samples was 92.3%. For the reproducibility, three groups of six replicate injections of a standard mixture containing 19.3 or 19.8 or 19.9 ppm of sodium fluoride resulted in reproducibility of readings expressed as coefficient of variation comprised between 0.29% and 0.62 %.

3.4. Microbiological properties of 2-pyrrolidone

The observed MICs and MBCs values obtained for 2-pyrrolidone varied from one micro-organism to the other (Table 3) respectively in the range of 20 mg/L to 75 mg/L and of 75 mg/L to 200 mg/L. For MIC, the most sensitive strains were respectively S. capitis, A. niger and E. coli while Bacillus spores were the most resistant organism with MIC around 50–75 mg/L. On the other hand, the lowest MBC values were obtained for P. aeruginosa and E. coli, gram negative bacteria, while the others strains displayed higher values around 200 mg/L. 2-pyrrolidone was a bactericidal compound against gram negative bacteria and S. aureus, but was a bacteriostatic or a fungistatic compound for all the others strains tested.

JPPR 2018-103-ThierryFVandammeFrance_F2

Figure 2. Statistics graph of size distribution (by intensity) of the micelles contained into the final formulation after 5 measurements.

JPPR 2018-103-ThierryFVandammeFrance_F3

Figure 3. RP-HPLC chromatogram of a standard mixture containing Vitamin D3 (Rt= 4.9 min).

Table 3. MICs and MBCs values (mg/mL) of 2-pyrrolidone for different micro-organisms strains.

Strains

MIC

MBC

MIC/MBC

Activity

E. coli

30-50-30

75-75

< 4

bactericidal

S. aureus

40-50-50

100-200

< 4

bactericidal

P. aeruginosa

50-30

75-50

< 4

bactericidal

E. faecalis

50-50

200-200

< 4

bactericidal

S. epidermidis

40-40

200-200

> 4

bacteriostatic

S. capitis

20-20

75-100

> 4

bactericidal

B. cereus spores

50-75-75

>200->200->200

> 4

sporostatic

B. sphaericus spores

50-50-75

>200->200->200

> 4

sporostatic

B. subtilis spores

75-75-75

>200->200->200

> 4

sporostatic

C. albicans

40-40-30

200-200-200

> 4

fungistatic

A. niger

40-30-30

>200->200->200

> 4

fungistatic

In addition to bacterial strains described in the EP, we have also used different bacterial species which can be found in oral pharmaceutical preparations.

Coagulase-negative staphylococci such as S. epidermidis and S. capitis belong to the microflora of human skin and mucous membranes; they are easily dispersed by skin scales. They are considered opportunistic pathogens and, in immunocompetent adults, are mostly associated with endocarditis, osteomyelitis, surgical site and foreign body infections [19]. S. epidermidis is one of the major causes of nosocomial infections, especially nosocomial bacteraemia. It expresses several virulence factors including those involved in the ability to adhere to and accumulate as a biofilm on a variety of surfaces, including prosthetic devices and transcutaneous catheters [20]. Enterococcus species are natural members of the human and warmblood animal intestinal flora. E. faecalis is the dominant species found in human feces [21]. Furthermore, enterococci are frequently isolated in soil, plants, vegetables, and in various foods. Because of their high concentrations in feces and their long survival period in the environment, enterococci have been proposed as water fecal contamination indicators [22]. Bacillus species are capable of undergoing sporulation, producing a dormant endospore. These spores are resistant to environmental stresses, including heat, desiccation, toxic chemicals, and extremes of ionic strength. Bacterial spores are the last organisms to remain viable during sterilization processes and environmental extremes that readily kill vegetative bacteria. For that reason, they are employed as biological indicators for monitoring the effectiveness of sterilization processes, such as vaporized hydrogen peroxide treatments [23] autoclaving, and UV irradiation [24].

3.5. Efficacy of antimicrobial preservation

EP (9th Edition, 2017. 5.1.3. Efficacy of antimicrobial preservation 577-579 and 2.6.13. Microbial examination of non-sterile products: test for specified micro-organisms) gives official quantitative methods for testing the efficacy of antimicrobial preservation in oral preparations. EP requires a log 3 reduction at 14 days in the case of bacteria and a log 1 reduction in the case of fungal count. At 28 days, EP requires that there is “no increase” in bacterial and fungal counts compared to the 14 days count.

Colony counting is not a precision method and for this reason, the criteria are given in integer logarithmic reduction values, a half log reduction value was taken to specify the requirement of “no increase”.

The EP criteria for evaluation of antimicrobial activity for oral preparations are given in terms of log reduction in the number of viable micro-organisms against the value obtained for the inoculum, and are summarised in (Table 4).

Table 4. The logarithmic reduction of bacterial cell number for 3 formulations evaluated by the official EP “test for the efficacy of antimicrobial preservation”.

Log reduction

14 days

28 days

Expected

Obtained

Expected

Obtained

Formulations


A

B

C

A

B

C

Strains

S.aureus

3

5.57

5.7

5.32

3

5.2

5.13

6.43

P.aeruginosa

3

5.43

5.76

6.06

3

5.28

>5.00

6.65

E. coli

3

5.56

5.91

4.56

3

4.96

>5.00

6.08

S.albicans

1

5.73

3.96

>5.00

1

>5.00

5.71

>5.00

A.niger

1

>5.00

1.76

2.44

1

5.74

4.83

3.29

B.cereus

N.C.

<1.00

<1.00

<1.00

N.C.

<1.00

<1.00

1.96

B.sphaericus

N.C.

<1.00

<1.00

<1.00

N.C.

<1.00

<1.00

<1.00

B.subtilis

N.C.

<1.00

<1.00

<1.00

N.C.

<1.00

<1.00

-2

N.C.: no criterion

According to the EP criteria for S. aureus, P. aeruginosa, E. coli, C. albicans and A. niger, 2-pyrrolidone preserved all 3 different oral preparations as well as 14 days and 28 days of microbial contaminations. The highest preservative effect was obtained with the formulation A. In this case, all the micro-organisms tested, even yeast and mould, showed a high logarithmic reduction, around log 5. Formulations B and C had a similar effect against bacterial strains tested, but were less effective against yeast and mould strains specially at 14 days.

The main difference between the 3 formulations is the presence of propyl gallate in the formula B and C. It is well known that propyl gallate, have antioxidant properties [25]. The lower efficiency of the antimicrobial activity of 2-pyrrolidone against fungus in formula B and C could be due to by the presence of propyl gallate which reduces the oxidative stress against lipid cellular membranes.

There is no criterion for bacterial spore reduction in the EP. No spore number reduction was detected within 14 days and 28 days for B. cereus spores with the formulation C in which we observed around a log 2 reduction. Such as for EP bacterial criteria at 28 days, there was “no increase” in spore count compared to the 14 days count, excluded for B. subtilis spores. In this case, a bacterial growth around log 2 was observed after 28 days contact.

Some other antimicrobial preservative compounds are used in pharmaceutical products. Parabens, especially propyl paraben, and p-hydroxybenzoic acid (pHBA) are the most frequently employed in cosmetic and pharmaceutical preparations [26]. Due to their wide antibacterial properties, low toxicity and chemical stability they have been used in food, drugs, and cosmetic for over 50 years. Parabens are antimicrobially effective in a dosage of 0.1 to 0.2%. Concentrations of use vary from product to product but seldom exceeds 1%. The main drawback is their unsatisfactory action against gram-negative bacteria, especially Pseudomonas genus which are capable of metabolising parabens as sources of nutrient materials [27]. Furthermore it has been shown that Enterobacter cloacae and nterobacter gergoviae produced an esterase involved in the hydrolysis of parabens [28]. In the same way, Van Dyk et al. [29] described that the treatment of E. coli with pHBA acid, induced an over expression of an efflux system involved in pHBA resistance. While Ramos-Gonzalez et al. [30] showed that the mechanism of pHBA tolerance in Pseudomonas putida DOT-T1E was due to an increase of the cell membrane rigidity. On the other side, it has been shown more recently, that parabens had an endocrine activity and had implications for potential risk to human health [31]. For these reasons, 2-pyrolidone could be used as new and safer antimicrobial preservative compound. The main drawbacks of this excipient is its higher MCI and MCB values compared to pHBA MCI, which is approximately 30-40 times more efficient [32]. But, unlike parabens, 2-pyrrolidone has bactericidal activity against gram negative bacteria. Moreover, 2-pyrrolidone is a cyclic amide which lacks mutagenic or genotoxic activity and its oral LD50 is very high in rats with values greater than 5000 mg/(Kg-body weight) in rats being reported [33,34].

For dissolving drugs, 2-pyrrolidone can be used in high concentrations in oral preparation (400 mg/mL). This concentration is greatly higher than the MICs measured against all micro-organims tested. For that reason we propose to use 2-pyrrolidone as the sole preservative agent in oral paediatric formulations in the absence of other preservative compound such as parabens or pHBA.

4. Conclusion

The concomitant use of 2-pyrrolidone and vitamin E TPGS® was beneficial to enhance aqueous solubility of vitamin D3 and propyl gallate, the antioxydizing agent. By comparison with conventional antimicrobial agents commonly used for oral formulations, MIC and MBC of 2-pyrrolidone were determined to be high, necessitating large amounts of this compound to provide antimicrobial efficacy for the formulation of a liquid oral drug delivery system. Therefore, the use of 2-pyrrolidone could be justified only in formulations of oral liquid drug delivery containing surfactants and it should not be used for liquid oral solutions or suspensions for which common antimicrobial agents are more suitable. To conclude, for formulations containing surfactants, 2-pyrrolidone can be promisingly considered, especially in the field of oral paediatric formulations.

References

  1. Tuleu C, Gangé J, Seurin S (2005) The need for paediatric formulation: oral administration of nifedipine in children, a proof of concept. J Drug Delivery Sci and Techn 15: 319–324.
  2. Nunn T, Williams J (2005) Formulation of medicines for children. Br J Clin Pharmacol 59: 674–676. [crossref]
  3. Smola M, Zhao M, Vandamme TF, Sokolowski A (2007) Design and development of oral paediatric reverse water-in-oil microemulsions as carriers for ranitidine hydrochloride, Minerva Biotechnologica 19: 7–16.
  4. Smola M, Vandamme TF (2007) Taste masking of unpleasant oral drugs. In: Boris O. Mashkevich (Ed). 2007 Chap4 in Drug Delivery Research Advances. Nova Publishers, New York, pp: 65–84. (Book Reference)
  5. Bloomfield SF (1990) Microbial contaminations: spoilage and hazard. In: Danyer, S, Blair R. (Eds.). Guide to micobiologigical Control in Pharmaceuticals. Chichester: Ellis Horwood, pp: 29–52. (Book Reference)
  6. Liu R (2000) Introduction, Chapter 1 in Water insoluble drug formulation. In: Rong Liu (Ed). Interpharm CRC Press, pp: 1–4. (Book Reference)
  7. Breitkreutz J (2005) Kindgerechte arzneiformen. Monattsschrift Kinderheilkunde 8: 726–34.
  8. Breitkreutz J, Boos J (2007) Paediatric and geriatric drug delivery. Expert Opin Drug Deliv 4: 37–45. [crossref]
  9. Chakravarty D, Lach JL, Blaug SM (1957) Study of complex formation between polyoxyl 40 stearate and some pharmaceuticals. Drug standard 25: 137–140.
  10. Sunderland VB, Watts DW (1984) Kinetics of the degradation of methyl, ethyl and n-propyl 4-hydrixybenzoate esters in aqueous solution. Int. J. Pharm 19: 1–15.
  11. Watrobska-Swietlikowska, D, Sznitowska M (2006) Partioning of parabens between phases of submicron emulsions stabilized with egg lecithin. Int. J. Pharm 312: 174–178.
  12. Higuchi T, Connors K (1965) Phase-solubility techniques. Adv. Anal. Inst 4: 117–212.
  13. Florence AT (1981) Drug solubilisation in surfactant systems. In: Yalkowsky SH (Ed). In Techniques of solubilisation of drugs, Marcel Dekker, Inc, New York (Book Reference)
  14. Caporal-Gauthier J, Nivet JM, Algranti P, Guilloteau M, Histe, M, et al. (1992a) Guide to analytical validation. Report of an SFSTP commission. I. Methodology. S.T.P. Pharma Pratiques 1992a, 2: 205–226.
  15. Caporal-Gauthier J, Nivet JM, Algranti P, Guilloteau M, Histe, M, et al. (1992b) Guide to analytical validation. Report of an SFSTP commission. II. Examples of applications. STP Pharma Pratiques 2: 227–239.
  16. Caporal J, Capuzet E (1997) Analytical validation: from protocol to report. STP. Pharma Pratiques 7: 360–363.
  17. Chaminade P, Feraud S, Baillet A, Ferrier D (1995) Validation of a chromatographic analysis method by HPLC. Ruggedness test and validation of the technique. S.T.P. Pharma Pratiques 5: 17- 35.
  18. Miller JC, Miller JN (1993) Statistics for analytic chemistry. (3rd edn). Chichester Ellis Horward.
  19. von Eiff C, Peters G, Heilmann C (2002) Pathogenesis of infections due to coagulase-negative staphylococci. Lancet Infect Dis 2: 677–685. [crossref]
  20. Gemmell CG (2001) Coagulase negative staphylococci and their role in infection. In: Sussman, M. (Ed.), Molecular Medical Microbiology. Academic Press, London, UK, pp: 889–899.
  21. Murray BE (1990) The life and times of the Enterococcus. Clin Microbiol Rev 3: 46–65. [crossref]
  22. U.S. EPA (1986) Bacteriological Ambient Water Quality Criteria for Marine and Freshwater Recreational Waters. PB86-158-045. Springfield, VA: United States Environmental Protection Agency.
  23. Johnston MD, Lawson S, Otter JA (2005) Evaluation of hydrogen peroxide vapour as a method for the decontamination of surfaces contaminated with Clostridium botulinum spores. J. Microbiol. Methods 60: 403–411.
  24. Mamane-Gravetz H, Linden KG (2004) UV disinfection of indigenous aerobic spores: implications for UV reactor validation in unfiltered waters. Water Res 38: 2898–2906.
  25. Pezzuto JM, Park EJ (2002) Autoxidation and antioxidants. In: Swarbrick J, Boylan JC (Eds.). Encyclopedia of Pharmaceutical Technology, volume 1. New York, Marcel Debber. Inc., 2002, 97–113.
  26. Soni MG, Burdock GA, Taylor SL, Greenberg NA (2001) Safety assessment of propyl paraben: a review of the published literature. Food Chem Toxicol 39: 513–532. [crossref]
  27. Nowak GA (1985) Microbiology, GMP, Disinfection, water treatment, preservation, 109–196 in Cosmetic Preparation Volume 1; Verlag für Chem Industrie H. ZiolkowskyKG. Augsburg, Germany.
  28. Valkova N, Lépine F, Labrie L, Dupont M, Beaudet R (2003) Purification and characterization of PrbA, a new esterase from Enterobacter cloacae hydrolyzing the esters of 4-hydroxybenzoic acid (parabens). J Biol Chem 278: 12779–12785. [crossref]
  29. Van Dyk TK, Templeton LJ, Cantera KA, Sharpe PL, Sariaslani FS (2004) Characterization of the Escherichia coli AaeAB efflux pump: a metabolic relief valve? J Bacteriol 186: 7196–7204. [crossref]
  30. Ramos-González MI, Godoy P, Alaminos M, Ben-Bassat A, Ramos JL (2001) Physiological characterization of Pseudomonas putida DOT-T1E tolerance to p-hydroxybenzoate. Appl Environ Microbiol 67: 4338–4341.
  31. Golden R, Gandy J, Vollmer G (2005) A review of the endocrine activity of parabens and implications for potential risks to human health. Crit Rev Toxicol 35: 435–458. [crossref]
  32. Cho JY, Moon JH, Seong KY, Park KH (1998) Antimicrobial activity of 4-hydroxybenzoic acid and trans 4-hydroxycinnamic acid isolated and identified from rice hull. Biosci Biotechnol Biochem 62: 2273–2276. [crossref]
  33. BASF AG, Abteilung. Toxikologie, unveroeffentlichte Untersuchung,(XI/407), 07.11.1961
  34. BASF AG, Abteilung Toxikologie; unveroeffentliche Untersuchungen (79/409), 09.04.1981