Currently we are forming the editorial board
Leave a reply
DOI: 10.31038/CST.2018331
Abstract
Introduction
Malignant pleural effusion is a sign of advanced disease with poor prognosis. The function of natural killer (NK) cells is to identify and destroy target tumor cells. This study aims to evaluate the role that cytotoxic NK subpopulations play when diagnosing malignant pleural effusion.
Methods
NK subpopulations were determined in pleural fluid and peripheral blood by flow cytometry in 71 patients who had suffered pleural effusion of unknown etiology. They were classified into three groups according to their final diagnosis: malignant, paramalignant and benign.
Results
The NK CD56 dim CD16- subpopulation in peripheral blood was the highest subpopulation in benign than in malignant or paramalignant cases (18.5% vs. 5.5% or 5.6%; p<0.001). Cytotoxic subpopulations NK CD56 dim CD16 + and NK CD16+ were higher in malignant and paramalignant than in benign cases (NK CD56 dim CD16+: 90.7% and 90% vs. 81.4%; p<0.001; NK CD16+: 95% and 95.6% vs. 86.5%; p<0.002). No differences were found in any cells studied in pleural fluid.
Conclusions
The data from this study suggested that determining the percentage of subpopulations NK CD56 dim CD16+ and NK CD16+, which perform an antibody-dependent cytotoxic function in peripheral blood, can be useful to diagnose malignant pleural effusion.
Keywords
diagnosis; flow cytometry; natural killer cells; natural killer subpopulations; pleural effusion; malignant
Introduction
Malignant pleural effusion (MPE) is a common clinical problem among patients with neoplastic disease. It is a sign of advanced disease associated with symptoms deteriorating and worse quality of life, with mean survival varying between 3 and 12 months [1]. Given its poor prognosis and clinical involvement, diagnoses must be made early. However, a malignancy diagnosis is not always possible with cytology, whose sensitivity range is 40–87% [2]. Hence the need to resort to complementary methods to identify tumor cells within pleural effusions (PE), [3] and to start early therapeutic interventions in an attempt to reduce these patients’ morbimortality.
MPE are characterized by a high percentage of mononuclear cells involved in immunological defense mechanisms, natural killer (NK) cells being one of the main components of the immunological system that participate in anti-tumoral defense mechanisms [4]. In theory, the presence of a high percentage of NK cells in pleural fluid could help establish its neoplastic nature. However, total NK (CD3- CD56+) quantification in pleural effusions has provided contradictory results in former studies [5–9].
Nowadays, there is very little information about the different NK cell subpopulations which can be found in MPE. However, it is known that the function of these subpopulations can be identified using the intensity of the expression of CD56 and CD16 surface antigens [10]. NK CD56 bright are considered regulator cells given their high capacity of producing pro-inflammatory and anti-inflammatory cytokines, [11] while NK CD56 dim [12] are cytotoxic given their high lytic activity. If the latter are also accompanied by a high CD16 expression, this makes them efficient mediators of antibody-dependent cell cytotoxicity [13]. CD57+ expression is a marker with a strong cytotoxic potential [14,15]. However, there is no data available on CD57+ expression in MPE. Therefore, the already available data seems to indicate that determining only total NK cells is not enough to identify MPEs differentiate them from benign ones. As NK subpopulations are characterized by performing more specific functions, the objective of this study was to study NK cell subpopulations, mainly those with a cytotoxic function, and their discriminative power in early differentiation of MPE, paramalignant pleural effusions (PPE) and benign pleural effusions (BPE).
Methods And Materials
Subjects
This two year (January 2013 to February 2015) prospective observational cohort study included 73 patients who had suffered pleural effusion of unknown etiology and were to undergo diagnostic thoracentesis. The final sample included 71 patients, two patients were excluded as no cellularity was obtained in pleural fluid. Patients were classified into three well differentiated groups according to their PE diagnosis: MPE, PPE and BPE (Figure 1).
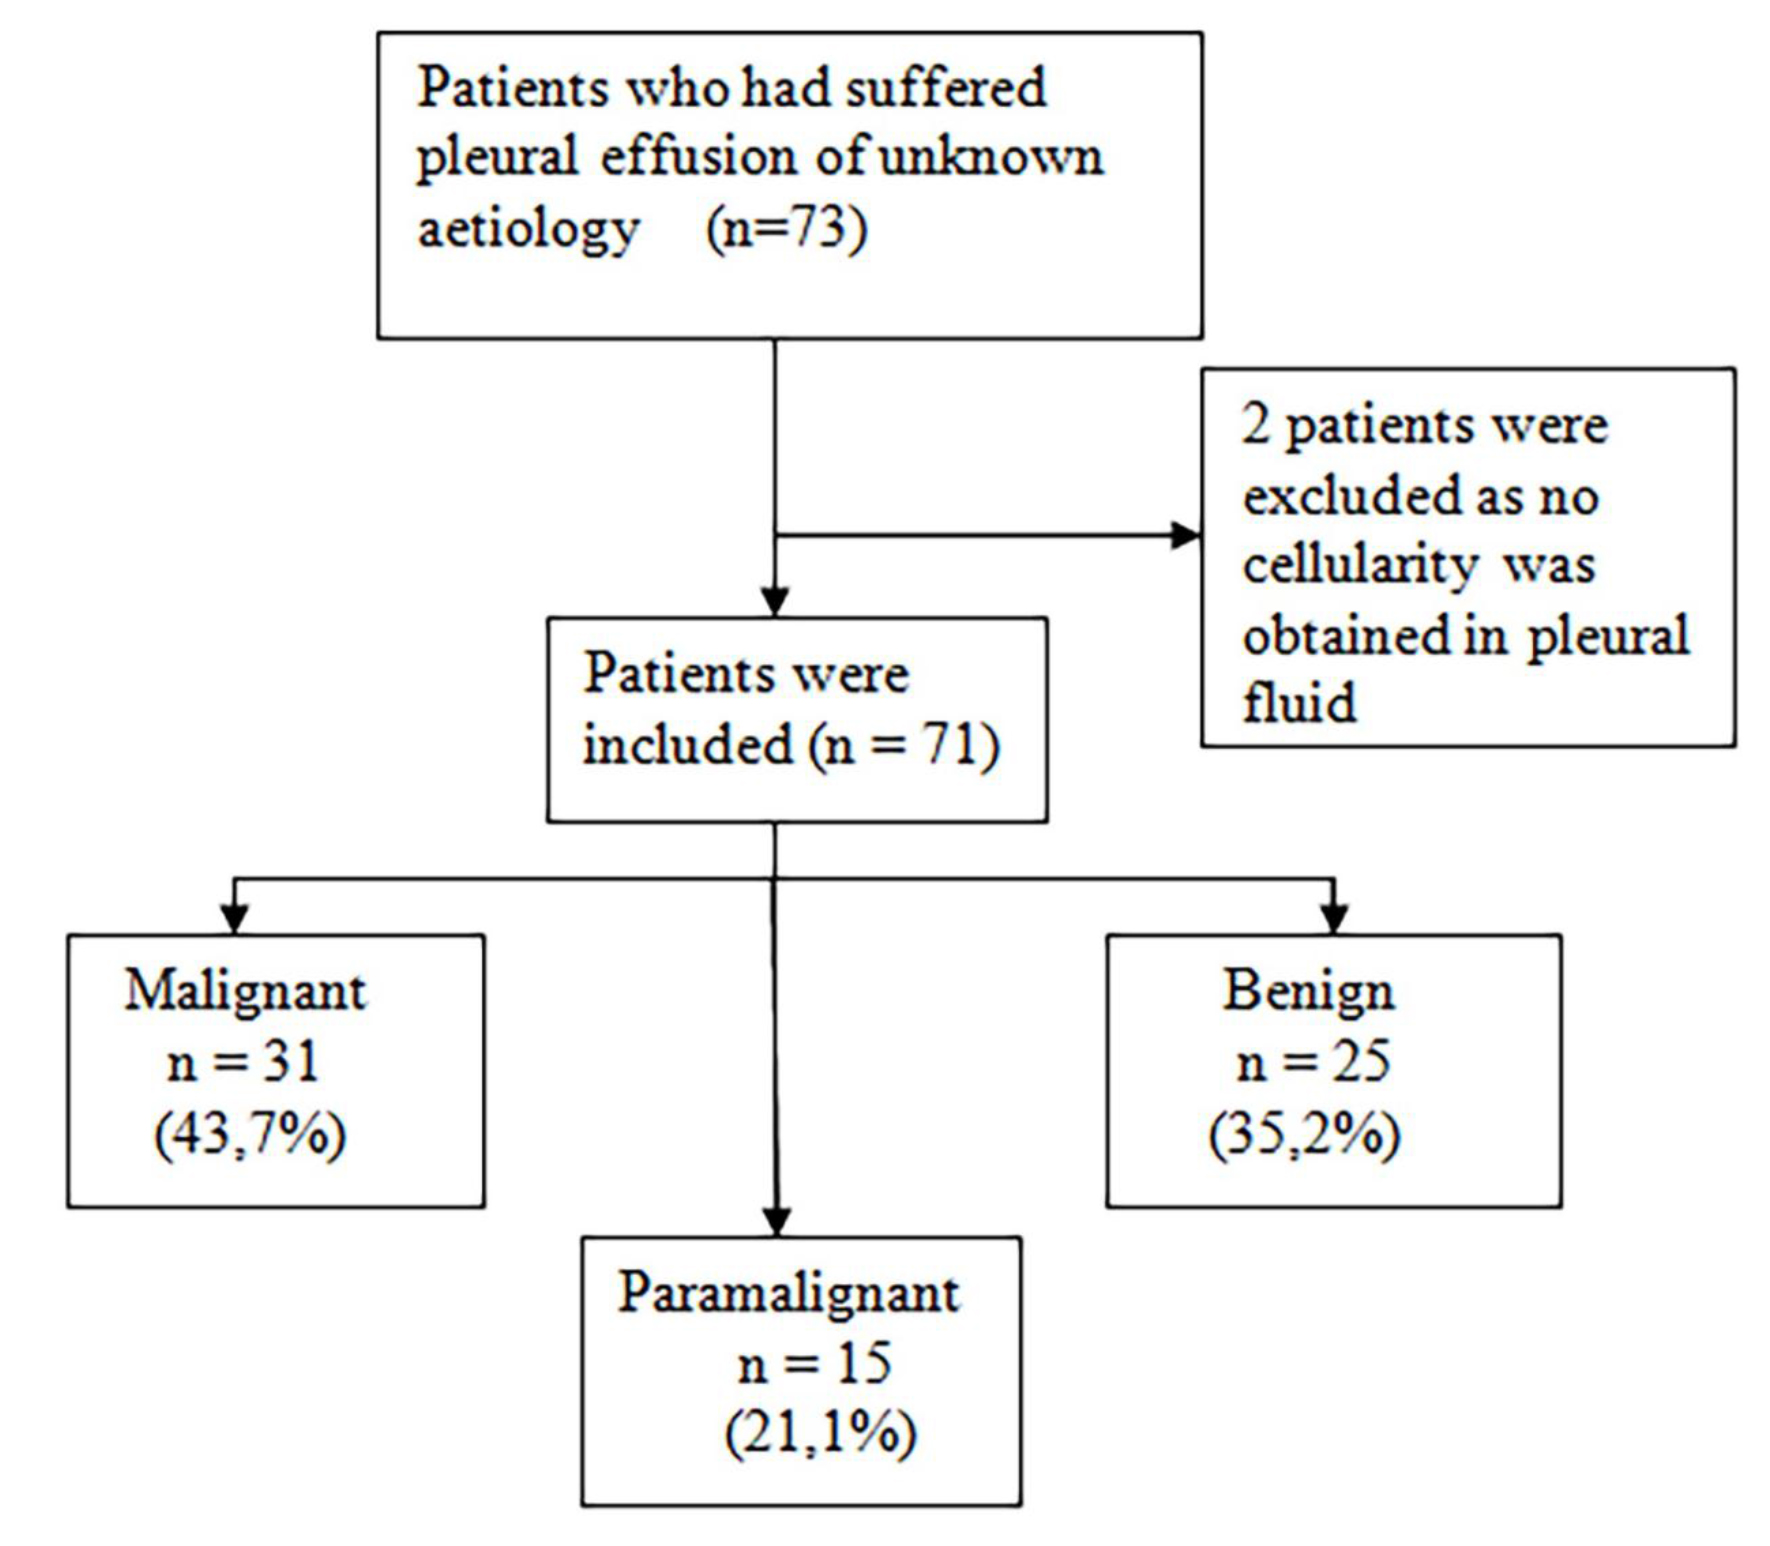
Figure 1. Flow of patients included in the study
Diagnosis of the type of PE was done according to the following criteria:
MPE was diagnosed if the presence of tumor cells in the pleural cavity was confirmed by a cytological study of pleural fluid, or in pleural tissue obtained by blind pleural biopsy, thoracoscopy or thoracotomy.
PPE (16) is due to a tumor process, but with no direct pleural infiltration by the tumor, and no tumor cells in the pleural fluid or tissue can be determined.
A PE is considered a BPE or as non-specific, when tumor etiology has been reasonably ruled out by imaging techniques, previous examinations, medical history and patient follow-up.
This study complies with the principles of the Declaration of Helsinki. Ethical approval of the study was given by Committee of Ethics and Clinical Trials (CEIC) of the Dr. Peset University Hospital in Valencia, with CEIC code: 10/12 on 29 February 2012. All the participating patients received written information about the nature and purposes of the study and gave their informed consent. A prospective follow-up of patients’ progress was done until they died or the study ended. All patients who were asked to be included in the study agreed to participate.
Measuring Natural Killer Cells
The lymphocyte populations in both the pleural fluid obtained from the first diagnostic thoracentesis performed on each patient and in the peripheral blood taken on the same day were analyzed.
After extraction, homogenization of the peripheral blood sample is immediately performed by the stirrer and mixer The Coulter Mixer (Coulter Electronics Limited, Northwell Drive, Luton, Bedfordshire, LU3 3RH, England®). Then, in a polypropylene tube, 100 μl of sample is introduced with 10 μl of each of the chosen monoclonal antibodies: CD45, CD19, CD3, CD56, CD16 and CD57. The mixture will be incubated for 15 minutes in the dark at room temperature. 0.5ml of the erythrolytic solution OptiLyse® are added, vortexed (Super-Mixer, Lab-Line Instruments Inc.®) and re-incubated in the dark at room temperature for another 15 minutes. After incubation, 2 ml of phosphate-buffered saline are added, centrifuged for 5 minutes at 300 x g (~1,600 r.p.m.) in a Microcen 21® and finally the supernatants are decanted and the cells re-suspended in 1 ml of phosphate-buffered saline and then introduced into a Navios® flow cytometer (Beckman-Coulter).
As in peripheral blood, the pleural fluid sample requires homogenizing the sample after extraction performed using the stirrer and mixer The Coulter Mixer (Coulter Electronics Limited, Northwell Drive, Luton, Bedfordshire, LU3 3RH, England®). However, the pleural fluid sample must be enriched prior to incubation. To do this, 2 ml of phosphate-buffered saline are added to 2 ml of pleural fluid, shaken and centrifuged at 300 x g (~1,600 r.p.m.) in a Microcen 21® for 5 minutes. The supernatants are then decanted and the cells are re-suspended in 0.5 ml of phosphate-buffered saline. After this process, the incubation with the monoclonal antibodies and procurement of the sample to be introduced in the flow cytometer can be performed following the same steps as in the peripheral blood.
A blind analysis of the diagnosis was run with the Kaluza 1.3 software (Beckman-Coulter). The sensitivity of the technique was 10-2 –10-3. After the expression of CD45, B (CD19+ CD3-) and T (CD3+ CD19-) lymphocytes as well as NK cells (CD3- CD56+) were studied first and compared to the 100% total lymphocytes. After and according to the intensity of the expression of antigens CD56 and CD16, the following subpopulations were differentiated: NK CD56 bright (++) CD16-, NK CD56 bright (++) CD16+, NK CD56 dim (+) CD16-, NK CD56 dim (+) CD16+ and NKCD16+ (CD56+/++ CD16+). NKCD57+ (CD56+/++ CD57+) were also determined and percentage quantification was done of all the NK subpopulations compared to the percentage of total NK cells.
Statistical analysis
All the results obtained were analyzed using the Kolmogorov-Smirnov test for a sample to determine if they followed a normal distribution pattern. Results were compared using the chi-square test for qualitative variables, the Student’s t-test for parametric quantitative variables and the Mann-Whitney U test for non-parametric quantitative variables. When comparing more than two groups, a one-way ANOVA (analysis of variance) was applied to the parametric variables and the Kruskal-Wallis test to the non-parametric variables.
The diagnostic efficacy of the analysis of the cells from pleural fluid and peripheral blood which presented differences considered significant enough to discriminate between MPE/PPE and BPE was determined by a receiver operating characteristic (ROC) curve analysis with the area under the ROC curve (AUC). A p-value <0.05 was considered significant and their 95% confidence intervals (95% CI) were calculated by standard techniques. The statistical package IBM SPSS Statistics for Windows (version 21.0. Armonk, New York: IBM Corp., USA) was employed.
Results
Demographics
This study took place at the University Dr. Peset Hospital in Valencia from 2013 to 2015 and analyzed 71 patients who had suffered PE of unknown etiology. The study population’s mean age was 69.1 years, and no differences were observed among groups. Male gender clearly predominated among the MPE and PPE cases (Table 1). According to the final PE diagnosis made, three groups were formed: MPE, PPE and BPE (Figure 1). All the MPE were exudates as well as 93.3% of PPE and 80% of the BPE (p=0.027) Adenocarcinoma was the most frequent histology found among the MPE (Table 1).
Table 1. Characteristics of the patients with malignant, paramalignant and benign pleural effusions.
|
Malignant (n=31) |
Paramalignant (n=15) |
Benign (n=25) |
p-valueb |
|
|
Age (years) 95% CI |
69.2±8.9 65.9–72.4 |
69.8 ±11.1 63.6–76 |
68.7 ±12.2 63.6–73.7 |
0.949
|
|
Gender |
0.133 |
|||
|
Male |
19 (61.3%) |
12 (80%) |
12 (48%) |
|
|
Female |
12 (38.7%) |
3 (20%) |
13 (52%) |
|
|
Diagnosis |
||||
|
Adenocarcinoma 22 (71%) |
Non-specific 12 (48%) |
|||
|
Lymphoma 4 (13%) |
CHF 4 (16%) |
|||
|
Mesothelioma 2 (6.5%) |
Infectious 3 (12%) |
|||
|
Epidermoid 1 (3.2%) |
TBC 2 (8%) |
|||
|
Microcytic 1 (3.2%) |
Exp. to asbestos 2 (8%) |
|||
|
Myxoid sarcoma 1 (3.2%) |
Cirrhosis 1 (4%) |
|||
|
RA 1 (4%) |
||||
Abbreviations: CI (confidence interval), CHF (congestive heart failure), TBC (tuberculosis), Exp. (exposure), RA (rheumatoid arthritis).
aData expressed in absolute values and percentages or mean±SD.
bChi-square test or ANOVA.
Lymphocyte populations in pleural fluid and peripheral blood
Lymphocyte populations were studied by determining B and T lymphocytes and NK cells in pleural fluid and peripheral blood. No differences between the expression of any cell line of the different groups was observed; that is, NK cells showed no higher expression in any pleural effusion type.
NK subpopulations in pleural fluid and peripheral blood
NK subpopulations were analyzed according to the intensity of the expression of surface antigens CD56 and CD16. No differences were found between the MPE, PPE and BPE groups in any cells studied in pleural fluid. Surprisingly, in peripheral blood, significant differences between the groups in the NK subpopulations were found. Subpopulation NK CD56 dim CD16- was higher in BPE cases than in the MPE or PPE ones (18.5% vs. 5.5% or 5.6%; p<0.001). Cytotoxic subpopulations NK CD56 dim CD16 + and NK CD16+ were higher in the MPE and PPE cases than in BPE ones (NK CD56 dim CD16 +: 90.7% and 90% vs. 81.4%; p<0.001 and NK CD16+: 95% and 95.6% vs. 86.5%; p<0.002) (Table 2).
Similarly, NK subpopulations analysis in peripheral blood showed that subpopulation NK CD56 dim CD16- was higher in BPE cases (18.5% vs. 5.5%; p<0.001), and subpopulations NK CD56 dim CD16 + and NK CD16+ appeared mostly in the combined MPE and PPE group, and in the isolated MPE cases (NK CD56 dim CD16 +: 90.7% vs. 81.4%; p<0.001 and NK CD16+: 95% vs. 86.5%: p<0.002) (Table 3).
Table 2. Natural killer subpopulations in peripheral blood.
|
Malignant (n=31) |
Paramalignant (n=15) |
Benign (n=25) |
p-valueb
|
|
|
NK (CD3-CD56+) |
11.6 (0.7–73.2) |
9.6 (1.7–16.2) |
7 (0.7–31.3) |
0.520 |
|
NK CD56 bright |
0.5 (0–12.7) |
1.4 (0–9.1) |
0.5 (0–31) |
0.479 |
|
CD56 bright CD16- |
0.2 (0–2.7) |
0.4 (0–2) |
0.3 (0–17.8) |
0.720 |
|
CD56 bright CD16+ |
0.1 (0–11.4) |
0.7 (0–8.1) |
0 (0–13.2) |
0.155 |
|
NK CD56 dim |
98.6 (81.5–100) |
96.9 (91.6–100) |
99.4(65.9–100) |
0.189 |
|
CD56 dim CD16- |
5.5 (0.3–92.1) |
5.6 (0.3–24.4) |
18.5(2.5–100) |
0.001*** |
|
CD56dim CD16+ |
90.7 (7.4–99) |
90(70.7–99) |
81.4 (0–95.4) |
0.001*** |
|
NK CD16+ |
95 (7.8–99.6) |
95.6 (76.1–99.5) |
86.5 (0–97.1) |
0.002** |
|
NK CD57+ |
48.6±20 |
49.2±17.4 |
54.4±14.5 |
0.454 |
Abbreviations: NK (natural killer).
aPercentage data expressed as mean±SD or median (minimum-maximum).
bANOVA or Kruskal-Wallis test.
*p<0.05; **p<0.01; ***p<0.001
Table 3. Cytotoxic natural killer subpopulations in peripheral blood.
|
Malignant (n=31) |
Benign (n=25) |
p-valueb
|
|
|
CD56dim CD16- |
5.5 (0.3–92.1) |
18.5 (2.5–100) |
0.001*** |
|
95%CI |
2.3–13 |
11.8–28.1 |
|
|
CD56dim CD16+ |
90.7 (7.4–99) |
81.4 (0–95.4) |
0.001*** |
|
95%CI |
87–97.7 |
71.9–88.2 |
|
|
NK CD16+ |
95 (7.8–99.6) |
86.5 (0–97.1) |
0.002** |
|
95%CI |
92.8–99.8 |
78.8–92.9 |
Abbreviations: NK (natural killer) CI (confidence interval).
aPercentage data expressed as median (minimum-maximum).
bStudent’s t-test or Mann-Whitney U test.
*p<0.05; **p<0.01; ***p<0.001
Diagnostic efficacy of cytotoxic NK subpopulations
These results reveal that, despite there being no differences in the NK subpopulations in pleural fluid to differentiate malignant cases from benign ones, differences appeared in the following NK subpopulations in peripheral blood: NK CD56 dim CD16-, NK CD56 dim CD16 + and NK CD16+. In order to determine the diagnostic efficacy of the analysis of these subpopulations in blood, a ROC curve analysis with AUC was performed. The isolated determination of the percentage in peripheral blood of subpopulation NK CD56 dim CD16- had an AUC of 0.777 to discriminate a BPE from a MPE (95%CI: 0.653–0.901; p<0.001). If the cut-off point was 9.82%, sensitivity would be 76% and specificity would be 71%. In order to differentiate a BPE from a MPE/PPE, the AUC was 0.784 (95%CI: 0.671–0.897; p<0.001), with a sensitivity of 76% and a specificity of 72% with the same cut-off point (Figure 2).
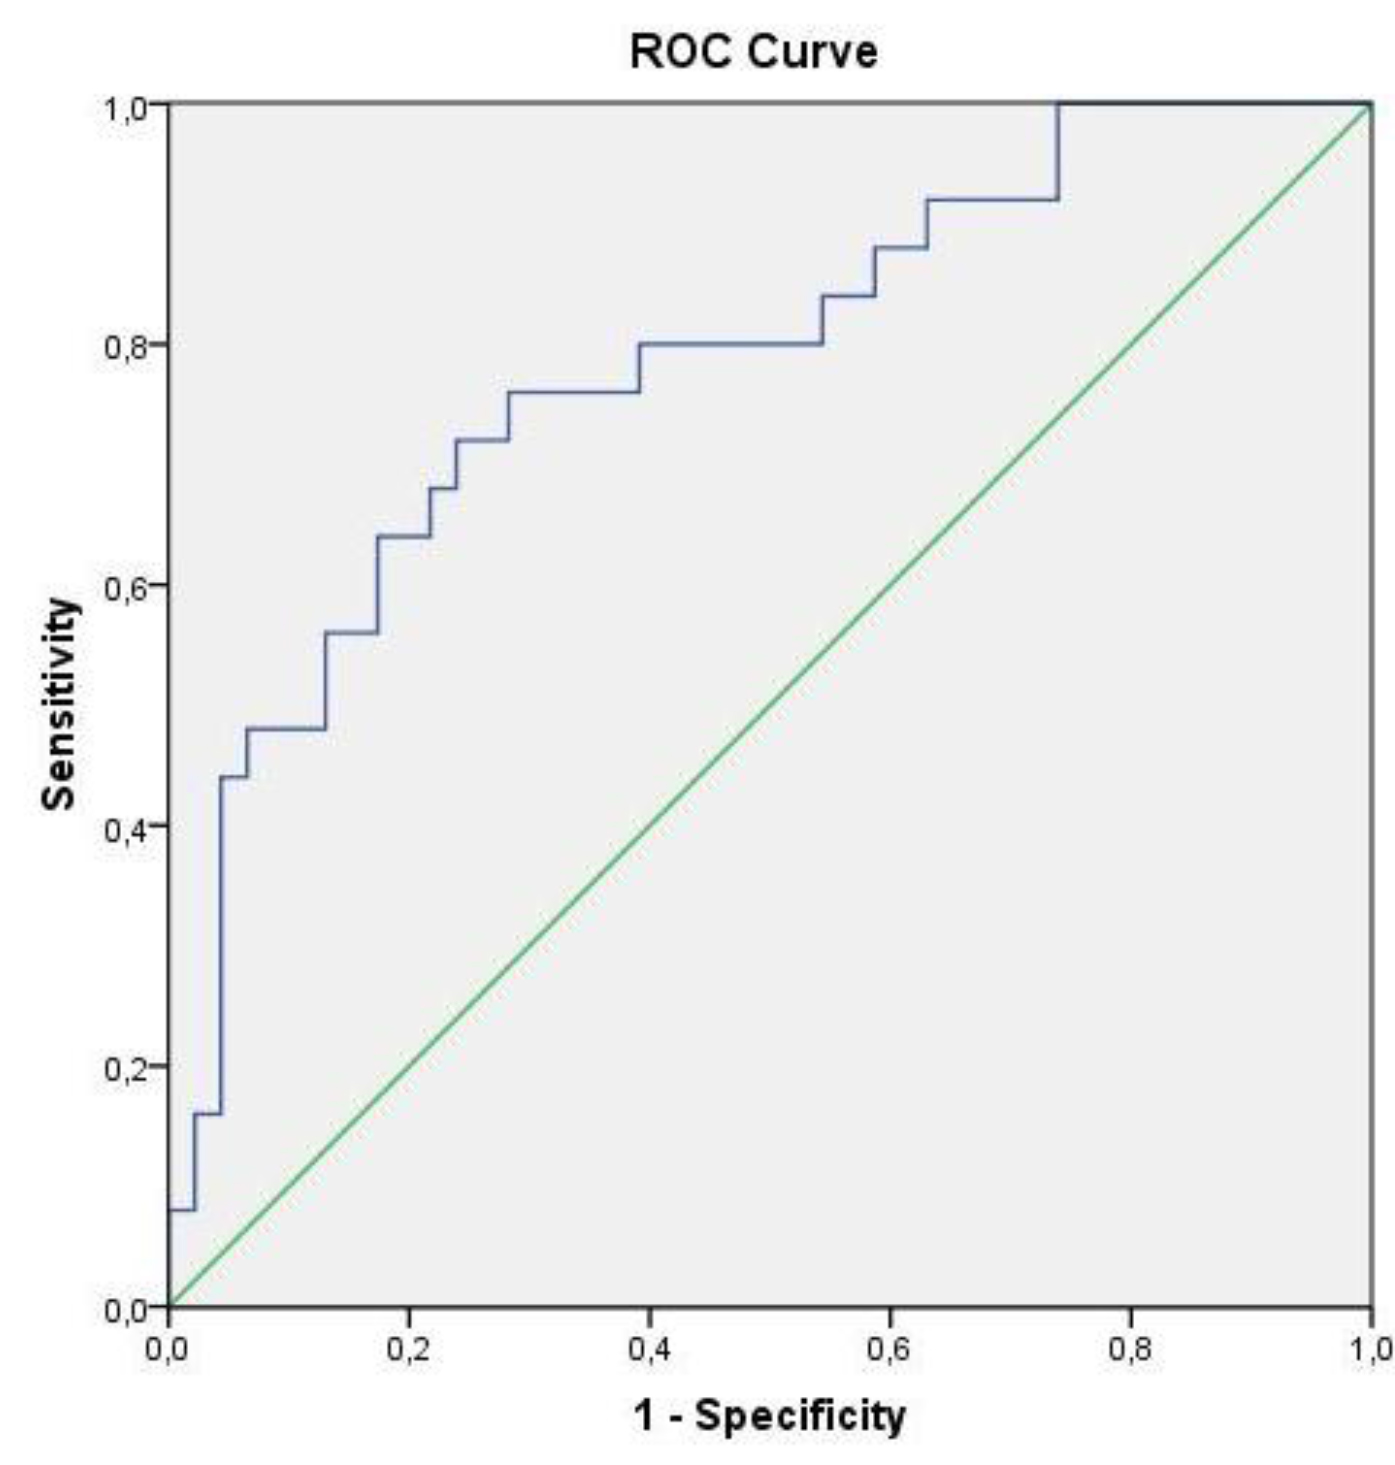
Figure 2. ROC curve of subpopulation NK CD56 dim CD16- to differentiate benign pleural effusions from malignant and paramalignant ones
Subpopulations NK CD56 dim CD16 + and NK CD16+, which have an antibody-dependent cytotoxic function, allow for discrimination of a patient with MPE from one with a BPE with an AUC of 0.761 (95%CI: 0.637–0.885; p=0.001) and 0.747 (95%CI: 0.619–0.876; p=0.002), respectively. In order to differentiate a MPE and PPE from a BPE, the AUC was 0.774 (95%CI: 0.663–0.885; p<0.001) and 0.753 (95%CI: 0.640–0.867; p<0.001), respectively (Figure 3).
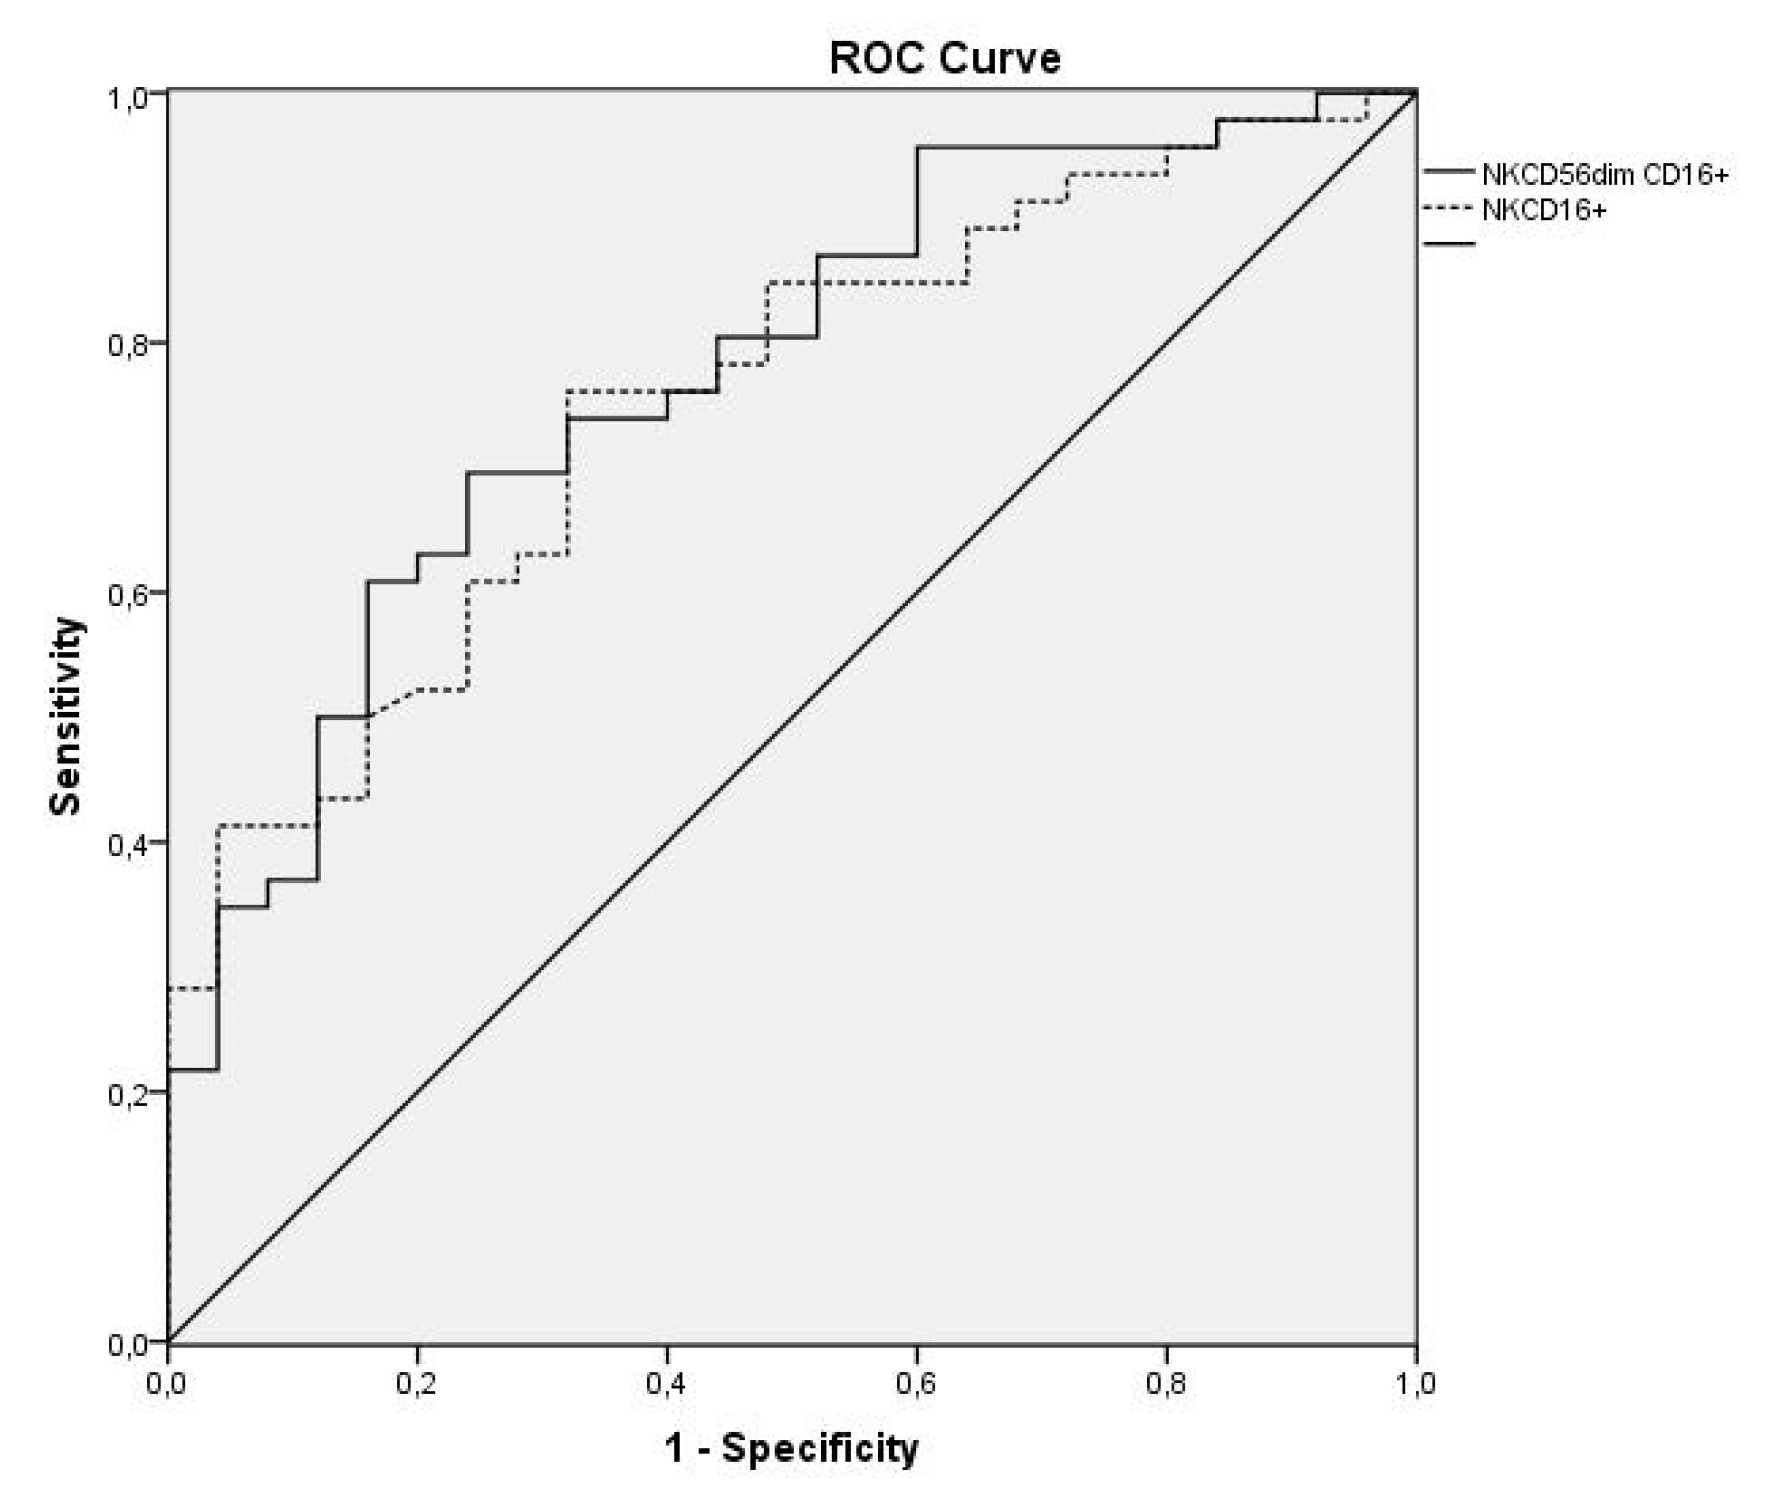
Figure 3. ROC curves of subpopulations NK CD56 dim CD16 + and NK CD16+ to differentiate malignant and paramalignant pleural effusions from those of a benign type
Discussion
MPE is a sign of advanced neoplastic disease which implies the pleural space has been affected by this malignant process. Given these patients’ poor prognosis, its diagnosis is therefore essential, and it would be very useful to identify markers that increase the possibility of diagnosing this malignity. Here, NK cells can play a key role in the defense against neoplastic invasion of the pleural cavity. In theory, detecting a high percentage of NK cells in MPE could help establish their tumoral nature. Despite some authors having observed a higher NK cell percentage in MPE, [5–7] others have reported a lower percentage, [8] and some groups, including our own, have not even found any differences [9]. It would appear that published data may indicate that determining only total NK cells is not sufficient to distinguish MPE from BPE. Therefore, we have centered our research on the NK subpopulations characterized by playing a cytotoxic function as presence of neoplastic cells in pleural fluid or tissue should reflect increased cytolytic activity in MPE compared to those of other etiologies. Apart from the subpopulations that explain the intensity of the expression of CD56 and CD16, potentially cytotoxic subpopulation NK CD57+ was also evaluated in differentiating a MPE from a BPE. Our data demonstrated that although no differences between groups or between malignant and benign cases were found in any of the studied cells in pleural fluid, differences appeared in peripheral blood: subpopulation CD56 dim CD16- was higher in BPE cases, and subpopulations CD56 dim CD16 + and NK CD16+ were higher in MPE and PPE ones. This indicated that a high CD16 expression made them efficient mediators of antibody-dependent cell cytotoxicity [13] with expressions in blood, but not in pleural fluid. These findings led us to wonder if there was a more relevant systemic response than the local one in patients with MPE. No published works have analyzed the diagnostic value of NK subpopulations in peripheral blood to distinguish between MPE and BPE. Moreover, information about pleural fluid is scarce. Scherpereel et al.[17] found increased CD16+ in pleural fluid in all PE except for BPE. Cornfield et al.[4] analyzed 30 malignant (pleural, pericardial and ascitic) effusions and 30 benign ones, and found no differences in the percentage of any subpopulation they studied. These authors only reported an increase in the absolute value of NK CD16+ in malignant effusions. Pace et al.[18] encountered that NKCD16+ percentages in patients with MPE and BPE were similar. The comparison made of the findings from this work with the few existing studies is complicated due to the different methodologies employed. Our data coincide with those reported by Cornfield et al. [4] The work by Pace et al. [18] only included 19 patients with MPE, while the BPE group differed (due to heart failure) to that herein studied as they were effusions of unknown etiology suspected of malignity, which pose a problem in diagnosing MPE. Moreover, although NKCD57+ displayed high cytolytic activity, [14,15], no published studies have been conducted on this marker in MPE, and this is the first work to analyses it.
In order to determine the diagnostic efficiency of the analyses of these subpopulations in blood, a ROC curve analysis was carried out. The subpopulation with the largest AUC to differentiate BPE from malignant ones was NK CD56 dim CD16- (0.777), which increased to 0.784 when the discrimination was between BPE and both MPE and PPE. When distinguishing between malignant and benign cases, subpopulations NK CD56 dim CD16+ and NK CD16+ had an AUC of 0.761 and 0.757, respectively. When MPE and PPE were distinguished from BPE the AUC increased to 0.774 and 0.753. This result has never been previously reported.
The main limitation of this study was that 21.1% of the included effusions were of the PPE type. Other studies[4,18] did not include this type. However, as the PPE type has its typical characteristics and is associated with poor prognosis, we decided to include it to well reflect the usual clinical reality.
By way of conclusion, determining the percentage of NK cells in pleural fluid of PE of unknown etiology does not allow malignant cases to be differentiated from benign ones. However, determining the percentage of subpopulations NK CD56 dim CD16+ and NK CD16+ that perform an antibody-dependent cytotoxic function in peripheral blood was identified as a diagnostic test whose capacity helps to early discriminate a patient with a MPE.
Author Contributions: All authors have been involved in the conception and design, or analysis and interpretation of data, as well as in drafting the article or revising it critically for important intellectual content. Maria Morales-Suarez-Varela has been designated as guarantor for the article.
Acknowledgements: The authors would like to thank the Pulmonology Foundation of the Valencian Community for the grant this work was awarded with, and with which the monoclonal antibodies employed were obtained. They would also like to thank everyone who has collaborated either directly or indirectly in this research.
Ethical Approval: All procedures performed in studies involving human participants were in accordance with the ethical standards of the institutional and/or national research committee and with the 1964 Helsinki declaration and its later amendments or comparable ethical standards.
Informed Consent: Informed consent was obtained from all individual participants included in the study.
Competing Interest: The authors declare that they have no competing interest.
Funding Information: Dr. Herrera Lara has received research scholarship support from the Pulmonology Foundation of the Valencian Community.
References
Abstract
The present study aimed at identifying the gastro-intestinal Strongyles of cattle and to evaluate the effect of albendazole on their population dynamics throughout the year. Three cattle farms located in the village of Velambai were used for the study. 175 animals were screened through coprological examination to assess their infection rate (IR) with gastro-intestinal nematodes. 50 Goudali were monitored from April 2015 to March 2016. Of these animals selected, 25 of them received albendazole on day 0 (D0) and constituted the treated group while the other 25 received nothing and stood for the non-treated group. Faeces were examined using the McMaster method to evaluate the efficacy of treatment and to monitor changes in faecal shedding of Strongyles. Faeces from animals were cultured to recover the infective L3 larval stage of Strongyles by the Baermann method. The survey revealed that Strongyles, Strongyloides and Toxocara were the main gastro-intestinal helminths infecting cattle with IRs of 64.5%, 15% and 24.1% respectively. Deworming at the beginning of the rainy season reduced the shedding of helminth eggs (EPG < 400) throughout the season. Percentage reduction in the number of eggs per gram of faeces (EPG) from Strongyles was 68% at day 30. Stool culture revealed the presence of four types of Strongyles with varying abundance depending on the genus (Trichostrongylus, Haemonchus, Cooperia and Oesophagostomum), animal group and month. The genera Trichostrongylus and Haemonchus were dominant throughout the year. Haemonchus spp were significantly sensitive to albendazole between D30 to D90. On D120, albendazole lost its effect with the genus Haemonchus which resulted in the re-infection of the animals, whereas this effect was rather late for the genus Oesophagostomum (from D270).
Key words
Gastro-intestinal helminths, stool culture, deworming, Albendazole, Ngaoundere, Cameroon.
Introduction
Livestock is an important source of income in most developing countries and contributes to food security. In Africa, it contributes upto 10–20% of the gross domestic product (GDP) [1]. However, in the Adamawa Region of Cameroon like in other African regions, this sector is subject to several constraints including diseases [2] for instance gastro-intestinal cattle strongylosis [1]. Strongylosis contributes to emaciation especially at the end of the dry season [3] and leads to production loss. The control of these pathologies in order to improve the individual productivity of cattle is therefore a necessity in a context already marked by the rapid growth of the human population and the increasing demand for animal protein, both in Cameroon and in all developing countries. In Cameroon, particularly in the Adamawa region, deworming has become a common practice by Veterinarians, but most often by breeders themselves and in most cases without seeking for medical advice [1–4]. For almost two decades now, the anti-parasitic pharmaceutical industries have made tremendous advancements in terms of developing new molecules with improved anthelminthic properties, but parasitism still prevails [5]. Just of recent, albendazole was introduced as an essential anthelmintic, but its usage is sometimes abused [6]. In a context where modern breeding is increasingly confronted with problems related to chemical residues (food safety) and the appearance of parasitic resistant strains to the main families of pharmaceuticals around the world, this has exposed the limitations of a systematic deworming and makes the implementation of treatment protocols essential [3–7]. Studies on the efficacy of albendazole on gastrointestinal parasites in calves in the dry season in vina by Sakativa [8] and Sassa et al. [9] in sheep in Mbé in the Adamawa region, revealed the significant impact of gastro-intestinal parasitosis on the productivity of ruminants in the respective areas. But a longitudinal follow-up study on the effect of deworming on the dynamics of gastro-intestinal Strongyles of adult cattle in Vina is lacking. The purpose of this study was to determine the prevalence of cattle helminths and to evaluate the impact of albendazole treatment on faecal egg counts.
Material and Methods
Study zone
This field trial was carried out in Velambai, geographically located between latitude 6° and 8° North and between longitude 11° and 15 ° East. This area is called the ‘Castle of water’ because large number of rivers in the country originates from this locality. Resulting from the emergence of the old crystalline basement, the department of Vina is elevated at an altitude between 1000 and 1300 meters [10]. The high altitude of this region provides a relatively cool climate with temperatures ranging between 22–25°C [11]. The climate is of the Sudanese tropical type with two seasons: the dry season that occurs from November to March, followed by the wet season. The average annual rainfall is 900 mm to 1500 mm. This area is covered by discontinuous vegetation consisting of savanna grasses such as Hyparrheenia, Panicum and Sporobolus. Three cattle farms were randomly selected from the Velambai locality, where 175 animals of the Goudali cattle breed of both study groups received food supplements such as molasses and cotton seed cake (two to three times a week) during the dry season. Coprological assays were carried out on day zero (D0). A study on the prevalence of gastrointestinal parasites was performed on all the 175 selected animals. Faeces was collected from the rectum, stored in a cooler and transported to the Wakwa Agricultural Research Institute for Development (IRAD) Parasitology laboratory for analysis using the McMaster method. The egg per gram of faeces (EPG) ≥ 50 was noted [12–13].
To evaluate the impact of deworming using albendazole on the population dynamics of gastrointestinal strongyles, two groups of cattle were used to monitor the variation of gastro-intestinal Strongyles for 12 months post albendazole administration. 50 cattle of both sexes were selected from the 175 cattle initially selected. These 50 animals were divided into two groups: treated group of 25 cattle including 8 males and 17 females and an untreated group of 25 cattle including 11 males and 14 females. Only the animals in the experimental group (treated group) had undergone deworming with albendazole in bolus (7.5mg / Kg per os).
Fecal samples were taken once a month for 12 months (from April 2015 to March 2016), ie D0, D30, D60, D90, D120, D150, D180, D210 D240, D270, D300 and D330 after the administration of albendazole. Faecal samples of the animals were cultured in a saturated salt solution and larvae were isolated using the Baermann method [14]. Larval identification was carried out using the identification key of [15].
Data Analysis
The One-way analysis of variance (ANOVA) was performed to compare the effect of age, sex, type with infection prevalence. To compare different infection rates of nematodes, the X2 test was performed. The EPG averages of the two groups of cattle were compared using the Student t-Test. These different statistics were carried out using the R version 3.2 software. The efficacy of the treatment with albendazole was calculated at day 30 using the method of Presidente [16].
Results
The identification of gastro-intestinal helminths in cattle led to the identification of helminth eggs of veterinary importance i.e. strongyles; Strongyloides papillosus and Toxocara vitulorum. Strongyles were the most common (64.7%) (170.65 ± 7.67). Age and sex were statistically significant (p ≤ 0.05) with infection prevalence. Young animals (1–2 years) were the most infected (85%) and males (76.92%) were more infected than females (60.29%) (Table 1). The prevalence of Toxocara vitulorum was 24.1% (20.3–28). The young recorded a prevalence of 24.28% more infested than adults with a significant difference (p ≤ 0.05) (Table 1). The prevalence of Strongyloides was 12.3% (8.6–16) (Table 1).
Table 1. The prevalence of gastro-intestinal nematodes
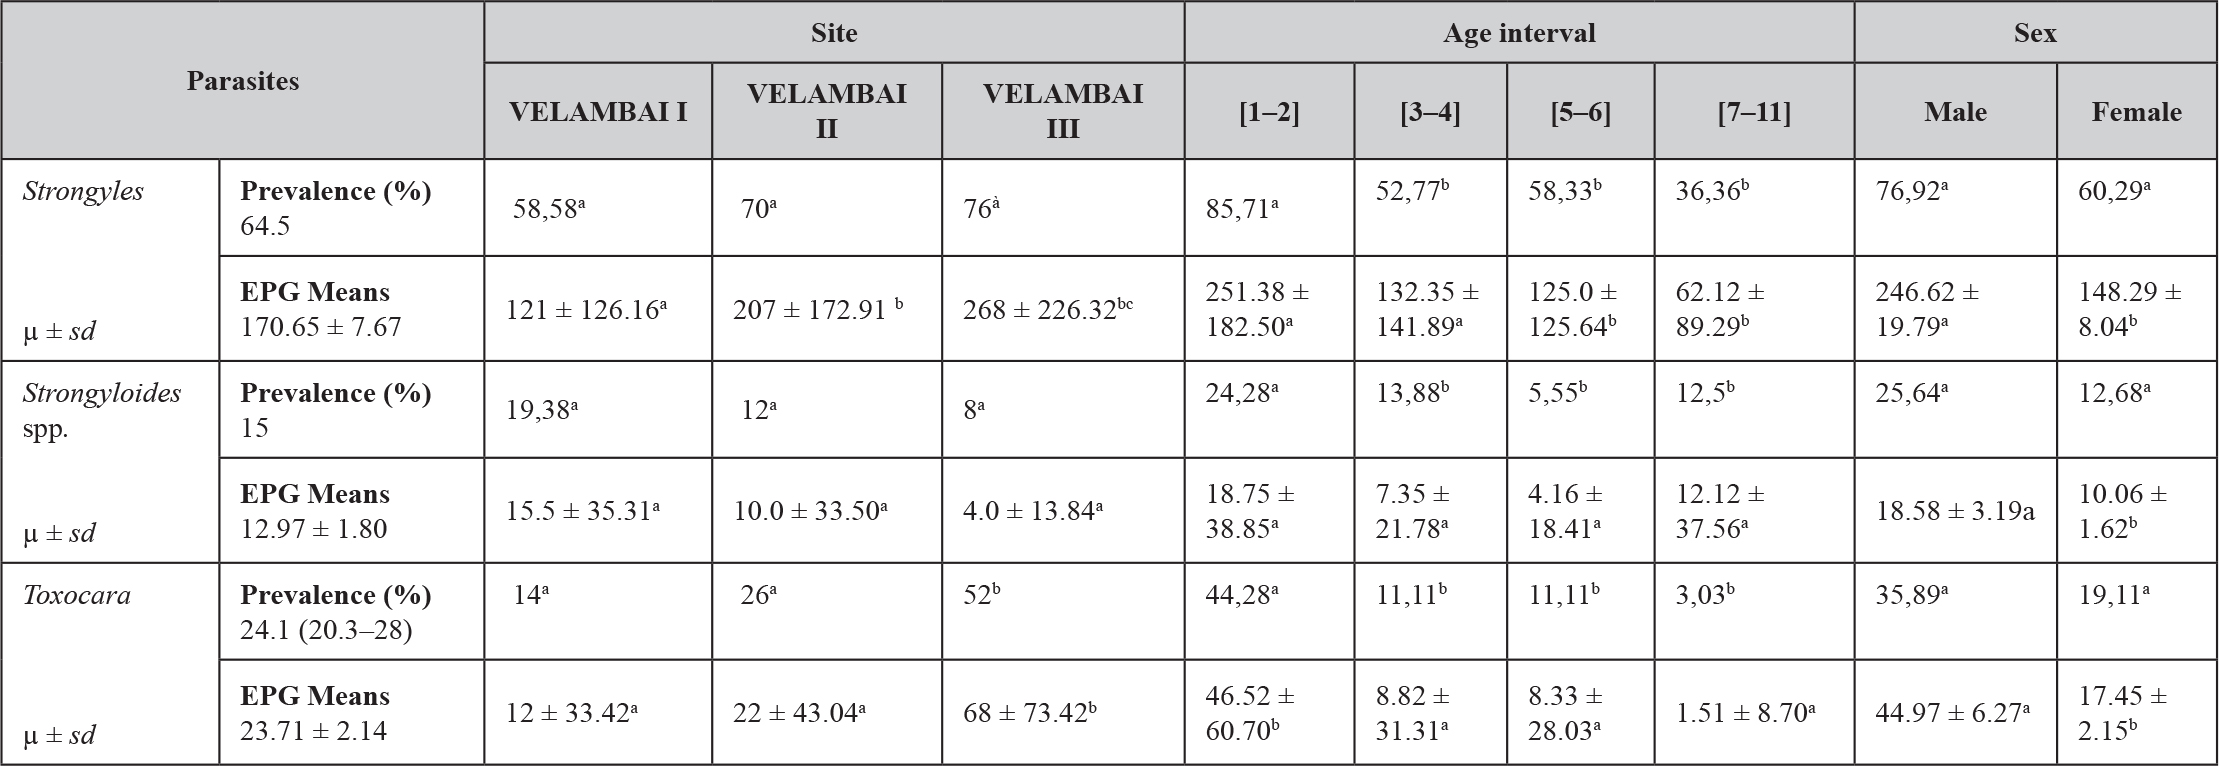
a, b, c, d: values with different superscript letters on the same line are significantly different (p < 0.05). µ: mean. sd: standard deviation, EPG: egg per gram
Effect of albendazole on the EPG of gastro-intestinal Strongyles
From D30 to D120 after treatment with albendazole, there was a significant decrease (p < 0.001) in faecal excretion of Strongyles eggs in the treated group (Table II). The EPG’s percentage reduction was 67.15%. In the untreated group, monthly EPG averages were moderate (EPG < 400) throughout the study period. Mean faecal egg shedding variations with respect to Strongyles revealed a peak on D90, but decreased to 68EPG on D330 (Table 2).
Table 2. Effect of albendazole on the EPG of gastro-intestinal Strongyles
|
Period |
Treated group (µ ± sd) |
Non-treated group (µ ± sd) |
P-value |
Significant levels |
|
April (D0) |
204 ± 170.73 |
268 ± 226.33 |
0.265 |
NS |
|
May (D30) |
86 ± 65.38 |
344 ± 162.86 |
0,000 |
*** |
|
June (D60) |
180 ± 139.19 |
330 ± 158.77 |
0.000 |
*** |
|
July (D90) |
179.17 ± 207.95 |
381.25 ± 181.67 |
0,000 |
*** |
|
August (D120) |
202.17 ± 188.58 |
360.41 ± 174.44 |
0.004 |
*** |
|
September (D150) |
190.91 ± 243.80 |
291.67 ± 155.11 |
0.106 |
NS |
|
October (D180) |
204.35 ± 180.22 |
277.08 ± 129.36 |
0.121 |
NS |
|
November (D210) |
46.87 ± 71.81 |
127.08 ± 141.41 |
0.024 |
* |
|
December (D240) |
33.33 ± 48.80 |
147.83 ± 154.83 |
0.003 |
*** |
|
January (D270) |
60.00 ± 91.03 |
135.29 ± 125.95 |
0.06 |
NS |
|
February (D300) |
75.00 ± 106.46 |
68.18 ± 83.87 |
0.833 |
NS |
|
March (D330) |
103.13 ± 107.19 |
145.24 ± 108.29 |
0.247 |
NS |
*: significatif; **: more significatif; ***: most significatif; µ: mean; sd: standard deviation, NS: no significant difference.
After the coproculture of the L3 nematode larval stages, the following nematodes: Haemonchus spp., Trichostrongylus spp., Cooperia spp., and Oesophagostomum spp were identified at the beginning of the rainy season. The proportion of the nematodes recovered from the different parts of the gastro-intestinal tract was: Abomasum parasites: Trichostrongylus spp. (42%) and Haemonchus spp. (28%), Parasite of the small intestine, of Cooperia spp. (18%), Parasite of the large intestine, Oesophagostomum spp. (12%). These four genera were present throughout the study in all the sampled herds. The variations of the average monthly intensities of the L3 of the Strongyles showed an overall monthly variation of Strongyles. Trichostrongylus sp. was the most common species from April to October with the lowest infection rate (IR) in January. Haemonchus sp. had two peaks: the first one in August and the second higher rate (56%) in January. Cooperia sp peaked in September while Oesophagostomum presented two peaks, the first in October and the second in late January and declined with its lowest rate in March (Figure 1).
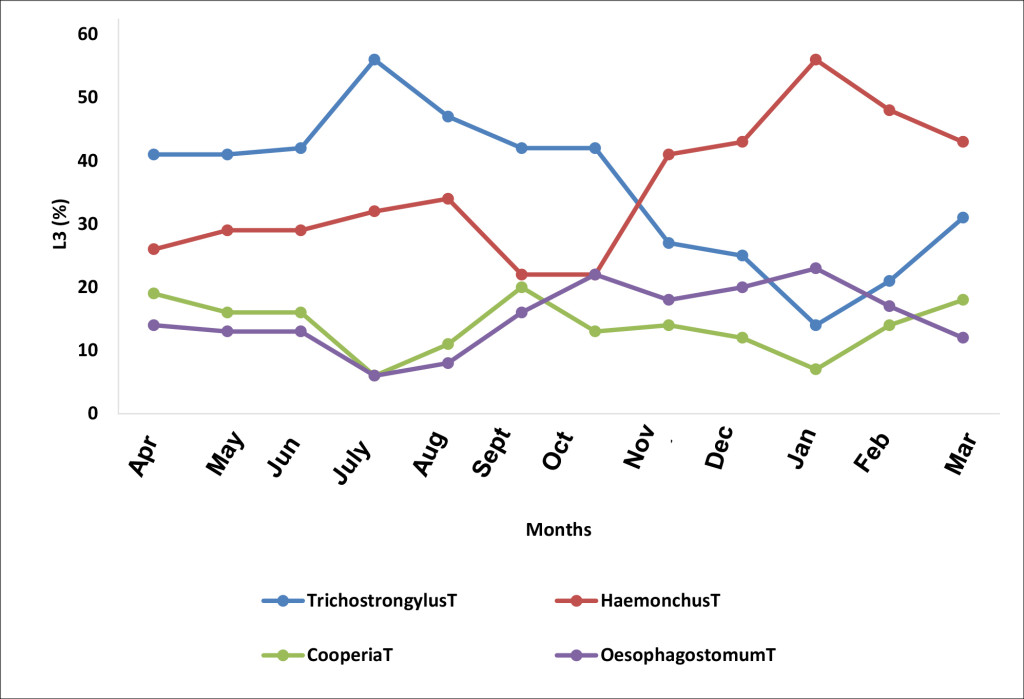
Figure 1. Monthly evolution of the L3 stages of the species of the genera of helminthes identified (T, non-treated animals)
The impact of deworming on Trichostrongylus sp. population was remarkable on D90 in the month of July and the percentage L3 shedding significantly declined in January (Figure 2).
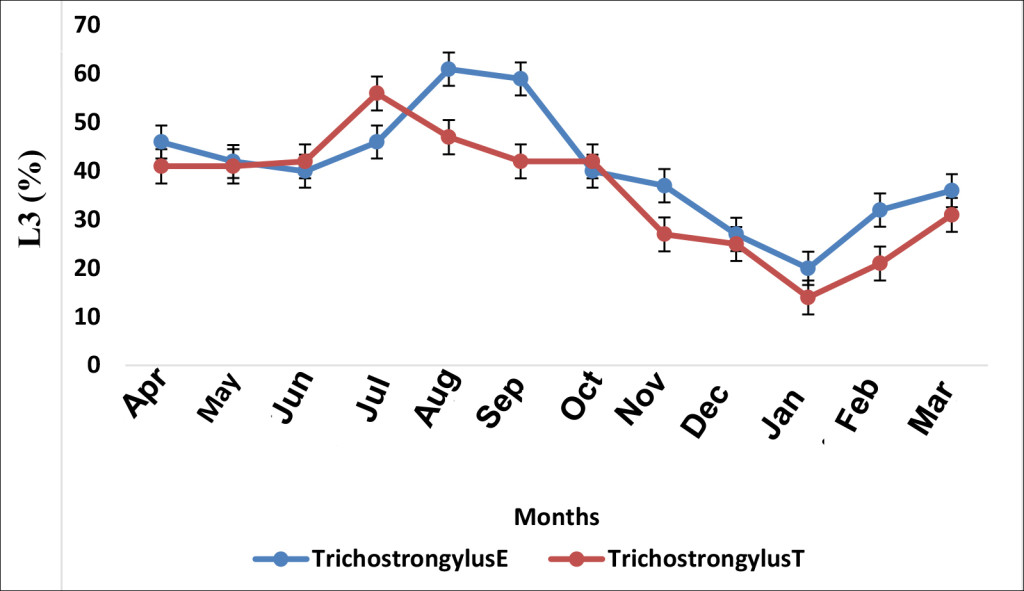
Figure 2. Effect of albendazole on Trichostrongylus sp. (E, treated group and T, non-treated group)
Haemonchus in the treated group responded to treatment by recording an L3 reduction from 29% (April-D0) to 12% in May (D30) post albendazole administration (p.a.a). A statistical significant difference (p ≤ 0.05) was observed between the two groups (treated-E and untreated-T) on days 30 and 60 (Figure 3).
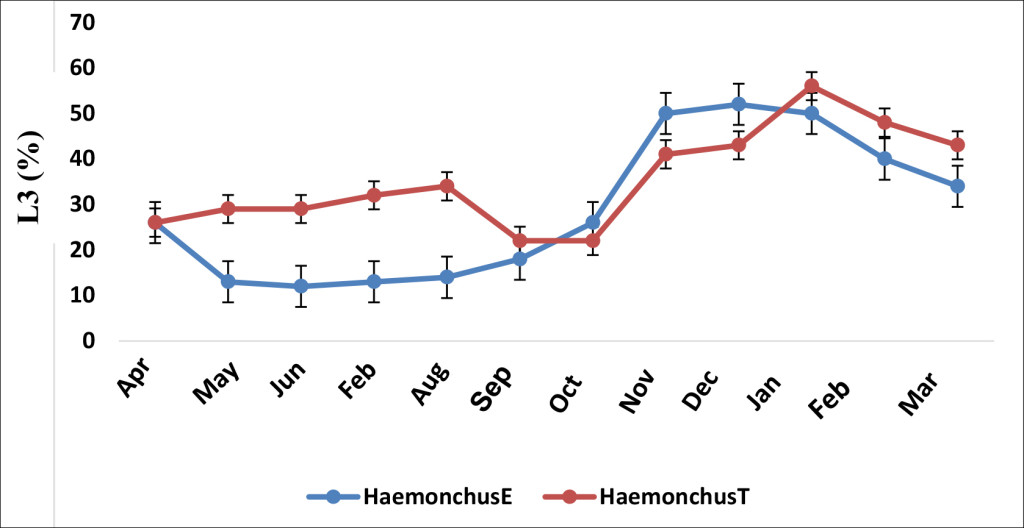
Figure 3. Effect of albendazole on Haemonchus sp. (E, treated group and T, non-treated group)
The mean infection prevalence of Cooperia was 12.1% in the treated group and 13.4% in the untreated counterpart. This frequency in the treated group significantly decreased (p ≤ 0.05) at D30 as compared to the untreated group (Figure 4). The occurrence peak of Cooperia sp. in the treated group was observed on D30, > one month after that of the untreated group (Figure 4).
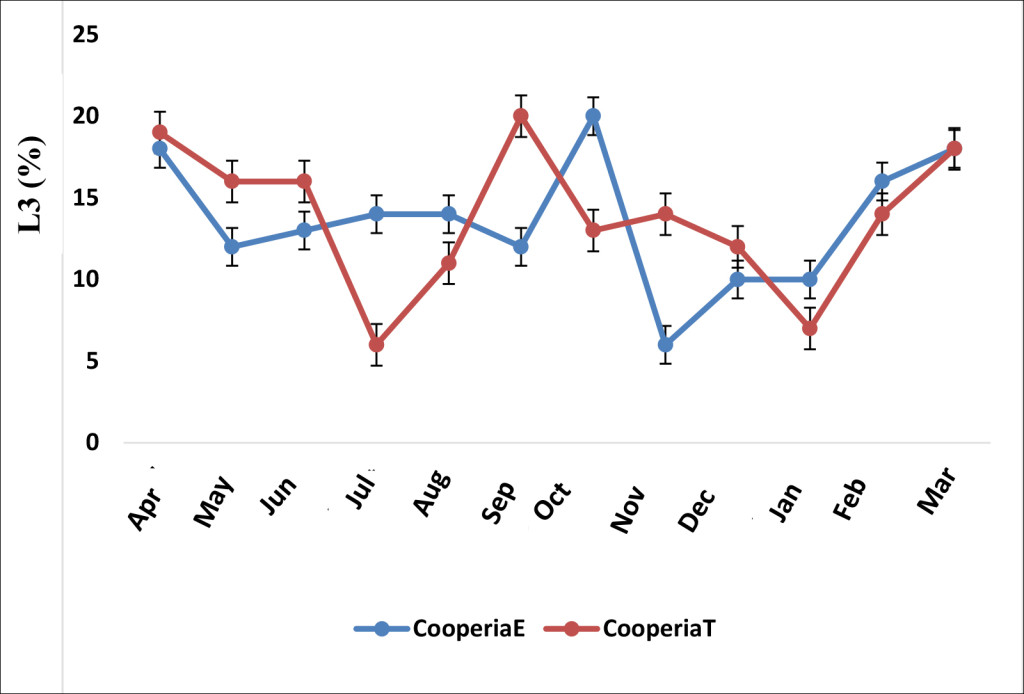
Figure 4. Effect of albendazole on Cooperia sp. (E, treated group and T, non-treated group)
Oesophagostomum sp in the treated group decreased more than that of the untreated group from September (Figure 5). Its peak in the treated group was observed in May. In the untreated group, two L3 occurrence peaks were noticed, the first one in October and the second in January (Figure 5).
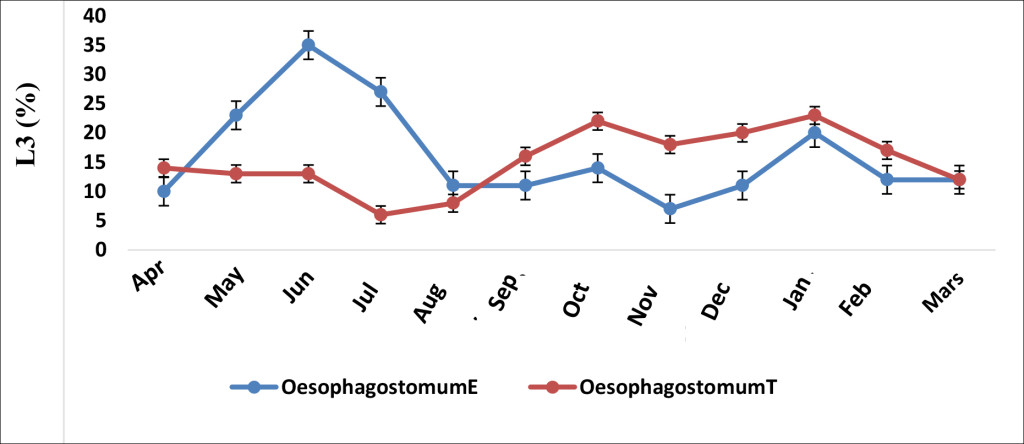
Figure 5. Effect of albendazole on Oesophagostomum sp. (E, treated group and T, non-treated group)
Discussion
Prevalence of gastrointestinal nematodes
Of the 175 cattle sampled in three farms in Velambai, 113 (64.5%) shedded Strongyle eggs (mean: 170.65 ± 7.67). This low average EPG observed could be justified by the extreme weather conditions of the dry season which might have limited the survival of the infestive larvae and consequently the parasite load [17], although the effect of larval hypobiosis cannot be ruled-out [18]. This result is close to the 69.57% observed in calves in the Vina by Sakativa [8]. The prevalence of Strongyles was higher in the Velambai 1 farm (76%) than in the Velambai 2 and Velambai 3 farms (70% and 58.58% respectively) with a statistically significant difference between the three farms. These results are due to pasture management. Indeed, the animals of Velambai l and 2 were regularly dewormed which could have reduced the parasite load in these sites. This finding is similar to that of Sassa et al., [9] in small ruminant farms in Vina. Our results show that Toxocara sp. was frequent in the young animals (24.28%). Age and sex had statistically significant (p ≤ 0.05) effects on Toxocara sp occurence. The prevalence of Strongyloides was 12.3%. This prevalence is close to the 9% observed by Ntonifor et al., [4] in the Jakiri area, but far below the 75.5% obtained by Chollet et al., [3] in calves 0–12 months of age in the North and Far North of Cameroon. The low IR here could be due to the average age of the animals (three years six months). Indeed, with Strongyloides there was a strong immunity against this parasite in cattle from the age of 6–9 months [13].
Effect of albendazole on faecal shedding of Strongyles
After one month of treatment, there was a significant decrease (p ≤ 0.05) in the level of faecal egg shedding of Strongyles eggs in cattle receiving albendazole. This result corroborate with those observed in some studies on the resistance of gastro-intestinal Strongyles of ruminants to anthelmintics [19–9]. The percentage response to treated by this group was 68.7%, revealing a form of resistance to albendazole. In fact, in this study, 60% of the animals were adult cattle (more than two years old). These animals could have received several treatments with albendazole, resulting in Strongyles resistance to this molecule [13]. In the untreated group, OPG monthly averages were maintained at a moderate level (EPG < 400) throughout the year. This result confirmed the effect of the rainy season on the variation of Strongyles eggs. Chiejina and Behnke [20] showed that small rains at the end of the dry season resulted in the development of the infective larvae on the pasture. Acquired immunity might have maintained a moderate level of EPG since the group of cattle examined consisted of 60% of animals over two years old. This finding corroborates with that of Elele et al., [21] on cattle in Port Harcourt, Nigeria.
Variation of the larval population of Strongyles
This study revealed multiple infections in cattle in the Adamawa region of Cameroon and this parasitism was similar to that already reported in cattle in many countries in Africa including Burkina Faso [22], Senegal [18] and Cameroon in small ruminants [9]. Similar results with the predominance of Haemonchus and Trichostrongylus genera were also obtained in sheep in Brazil by Klauck et al., [23]. The antagonistic variation between Trichostrongylus sp and Haemonchus could be due to ecological niche competition as the two parasites share the same habitat (abomasum) [24]. On the other hand, this variation on the genera Cooperia (parasite of the small intestine) and Oesophagostomum (parasite of the large intestine) was rather due to an indirect mechanism occuring through the stimulation of the immune reaction of the host or non-specific inflammatory reactions [24]. The effect of deworming on Trichostrongylus sp was observed on the treated group on D90. But this difference was not statistically significant (p > 0, 05). Roeber et al., [25] and Demelash et al., [26] both observed this low sensitivity of Trichostrongylus sp to albendazole in sheep in Australia and cattle in Ethiopia respectively. The percentage of L3 of Trichostrongylus sp was lower at the end of the rainy season in both treated and untreated groups. Pfukenyi and Mukaratirwa [27] also observed low Trichostrongylus sp. L3 levels at the end of the rainy season, which according to these authors could be low due to the transition in climatic factors of the late seasons (rainy and dry). The percentage of L3 Haemonchus sp in the treated group dropped from 29% to 12%, one month (D30) p.a.a. Statistical significant differences (p ≤ 0.05) were observed between treated and untreated groups from D30 to D90. The susceptibility of Haemonchus sp to albendazole was also observed in cattle and equines in Morocco by Zoutien et al., [28] and sheep of Mbé in the Adamawa region of Cameroon [9]. The effect of albendazole on Haemonchus sp from D120 in the treated cattle group was reported to witness some sort of re-infection, especially with the presence of untreated animal faecal material reservoirs on the pasture land. The percentage of the L3 stage of Cooperia was average in both groups throughout the duration of the study (12.1% in the treated group and 13.4% in the untreated group). This may be due to its high resistance to extreme climatic conditions, despite its low fertility [3–29–27]. The effect of treatment with albendazole was significantly ((p ≤ 0.05) different from the untreated group only at day 30. The percentage of L3 of Oesophagostomum sp in the treated group decreased more than that in the untreated group from D90. This could be related to their sensitivity to albendazole that appears to be related to the location of adult worms in the digestive tract of cattle. Indeed, Oesophagostomum is a worm of the large intestine, since albendazole was administered as a 500 mg bolus, this would have required some time for the dissolution in the rumen and thus a late maximum concentration in the large intestine. Holsback et al., [30] also noted this form of resistance of Oesophagostomum in calves in Paraná.
Conclusion
The objective of self-sufficiency in meat products especially in the reduction of the scramble for beef that Cameroon aims at, a new policy on the development of the livestock sector must be established. Our study of gastrointestinal parasites in cattle in Vina demonstrated the validity of the initial hypothesis that gastrointestinal helminths of cattle are predominant in Vina and that the deworming effect of albendazole has an impact on population variation. It showed two peaks in the infestation level during the rainy season with significant intensities, unlike other studies in the area and showed that animals from one to two years were mostly infected. We were able to show the presence of four genera of gastrointestinal Strongyles among which the genera Trichostrongylus and Haemonchus (parasites of the abomasum) were with frequent. Also, it should be noted that deworming at the beginning of the rainy season will keep the animals at a low infection level until the beginning of the dry season. In addition, this study showed that albendazole has a much greater effect on the population of Haemonchus sp and that this effect is late when referring to the population of Oesophagostomum. Treatments could be administered in mid-May (one month after the actual start of the rains) and in late July (second half of the rainy season). Deworming in mid-May will greatly target the genus Trichostrongylus, while doing so at the end of July will greatly target the genus Haemonchus. Finally, this study also revealed high levels of trematode infection that should also be included in control measures. Any proposal for a deworming schedule should be a subject to economic evaluation and should consider the risk of development of resistance to anthelmintics.
Acknowledgements: This work was supported by the vaccine project. We thank the Department of Parasitology and Parasitological Diseases for the material support. We thank IRAD Wakwa for technical and material assistance.
Conflict of interest: Authors declare no conflict of interest
References
Introduction
Diabetes affects more than 30 million people in the United States with type 2 diabetes accounting for 90–95% of cases (www.diabetes.org). Annual medical expense and disease-related societal burden from diabetes cost more than $245 billion. Most of the diabetic -related disabilities are from chronic diabetic complications in the cardiovascular, renal, retinal, and nervous systems. Among these, diabetic polyneuropathy occurs in approximately 60% of all diabetic patients [1, 2]. Diabetic polyneuropathy causes significant public health burden, serving as the leading cause of diabetes-related hospital admissions and non-traumatic amputations [1, 3, 4].
Patients with diabetic polyneuropathy frequently suffer from painful symptoms, termed as painful diabetic neuropathy (PDN) [2]. Clinically, PDN typically presents with length-dependent spontaneous pain with a combination of burning, tingling, electric-like, or achy sensations. It begins in the feet and extends proximally over time with bilateral and symmetric stocking distribution. Similar distal to proximal pattern of painful symptoms could develop at a later stage in the upper extremities. Patients with PDN also experience induced-pain, such as allodynia and hyperalgesia. Allodynia occurs when regularly innoxious stimuli, such as light touch, become painful, whereas hyperalgesia is increased nocuous sensitivity to painful stimuli, like pin prick. Despite the high morbidity of PDN [5, 6], the underlying molecular mechanisms of PDN are poorly understood [7]. Without targeting the key pathology that leads to the development of PDN, currently accepted medical approaches are only partially successful and are often ineffective [5, 8]. Inadequate control of PDN has significantly reduced quality of life for patients with diabetes [5, 6, 8]. In addition to suffering from painful symptoms, patients with PDN frequently develop insomnia, depression and anxiety, decreased mobility, psychomotor impairment and loss of work [5, 6, 8]. Clearly, more mechanism-specific therapies are urgently needed to effectively manage this common and important health problem.
Current treatment guidelines
Over the last three decades, basic science and clinical studies have generated significant amount of evidenced-based data to establish treatment guidelines for PDN. The 2006 and 2010 guidelines from the European Federation of Neurological Societies task Force (EFNS) [9, 10] and the 2011 guidelines from the American Academy of Neurology (AAN), the American Association of Neuromuscular and Electrodiagnostic Medicine, and American Academy of Physical Medicine and Rehabilitation [11] are the most thorough and up-to-date guidelines on this topic. Several class drugs including α2δ calcium channel antagonists (gabapentin, and pregabalin), anti-convulsants, tricyclic anti-depressants (TCAs), serotonin-norepinephrine reuptake inhibitors (SNRIs), opioids, and various other treatment modalities are discussed and recommended according to the quality of their supporting data. Each published clinical trial is classified according to its level of evidence, following guidelines such as the “AAN classification of recommendations” (www.AAN.com). Although there could be variations among these guidelines, trials deemed as class I are considered to have the highest quality of evidence with lowest risk of bias to support the application of the study drugs. The quality of evidence is decreased in high leveled classes; with class IV evidence has the highest bias potential and lowest supporting evidence for clinical use.
Level A treatments are strongly recommended with class I evidence or consistent findings from multiple studies of class II, III, or IV. They are recommended in clinical practice unless a clear and compelling rationale for an alternative approach is present. Level B treatments are with levels II, III, or IV evidence and findings are generally consistent. Generally, clinicians should follow this recommendation but should remain alert to new information and sensitive to patient preferences [12]. Level C, D, and U treatments do not have sufficient evidence to support their clinical practice.
The use of gabapentin, pregabalin, TCAs (such as amitriptyline), SNRIs (venlafaxine and duloxetine) are supported by EFNS with level A recommendation. In addition, controlled-release oxycodone is recommended by EFNS as effective with level A recommendation based on two class I studies. Tramadol alone or with acetaminophen were listed by the EFNS as level A effective treatments based on two class I studies. Level B recommendations from EFNS include Dextromethorphan (an agonist of N-methyl-D-aspartate receptor, 400 mg/d), Topical capsaicin 0.075% ointment that activates the transient receptor potential cation channel subfamily V member (TRPV) 1, isosorbide dinitrate spray (a vasodilator), type A botulinum toxin (BTX-A, blocks acetylcholine release) and levodopa (a dopamine precursor) [9, 10].
The guideline from AAN supports the use of pregabalin with level A recommendation. Gabapentin, sodium valproate (an anti-convulsant), venlafaxine, duloxetine, amitriptyline, dextromethorphan, morphine sulfate, tramadol, oxycodone, capsaicin 0.075% ointment, isosorbide dinitrate spray, electric stimulation and percutaneous nerve stimulation are presented as level B recommendations. Other anti-convulsants such as oxcarbazepine and lamotrigine; clonidine (an a2 adrenergic agonist), pentoxifylline (a xanthine derivative), magnetic field treatment, low-intensity laser therapy, and Reiki therapy are not recommended [11].
Emerging treatments
One of the most promising new gene therapies for PDN is a DNA-based therapy using a plasmid DNA that contains the human hepatocyte growth factor (HGF) gene (VM202). VM202 enhances local expression of HGF to promote microvasculature growth and regenerate peripheral nerves to improve symptoms of PDN. A phase 3 study showed that PDN patients receiving 8 mg of VM202 injection per leg improved in all efficacy measures with 48.4 % of the patients experienced at least a 50% reduction in mean pain score in the treated group compared with 17.6 % in the placebo group after 3 months [13]. However, this analgesic effect was not statistically significant at 6 and 9 months. The study also demonstrated significant improvement in the brief pain inventory and the questionnaire portion of the Michigan Neuropathy Screening Instrument. Interestingly, the researchers noted that the largest reductions in pain were found among patients not on pregabalin or gabapentin. In addition, there were no significant adverse events attributable to VM202 and this treatment was deemed safe and well tolerated [13].
A network meta-analysis accumulated 25 randomized controlled trials for studying the effects of capsaicin 179 mg cutaneous patch (capsaicin 8% patch) on PDN. It was concluded that capsaicin 8% patch was significantly more effective than placebo with ≥30% pain reduction in PDN patients. In addition, capsaicin patch was statistically more efficacious when compared with pregabalin and gabapentin. It had similar efficacy while being compared with duloxetine [14].
Nerve growth factor (NGF) has been established as an essential factor for the development of nociceptive nerves. It also mediates the development of mechanical allodynia in animal model of type 2 diabetes [15]. Clinical trials using NGF neutralizing antibodies, including tanezumab and fulnatumab, have been reported with positive results for treating PDN. In the study that examined the effects of tanezumab in PDN, test subjects received subcutaneous tanezumab 20 mg or placebo on Day 1 and Week 8. Mean PDN pain reduction from baseline to Week 8 was greater with tanezumab vs placebo. However, differences in Patient’s Global Assessment of DPN were not significant [16].
Fulranumab, a fully human monoclonal anti-NGF antibody was also tested for PDN. In a phase II, double-blind, placebo-controlled trial, patients with moderate to severe PDN were randomized to treatments with fulranumab (1, 3, or 10 mg) or placebo administered subcutaneously every 4 weeks. Because of early study termination (clinical hold by the US Food and Drug Administration), only 77 of the planned 200 patients were enrolled. The primary endpoint, the mean reduction of average daily pain at week 12 compared with baseline, showed a positive dose-response relationship. The pair-wise comparison between the 10-mg group and placebo was significant. An exploratory responder analysis revealed that a greater proportion of patients in the 10-mg group reported ≥30% reduction in the average pain intensity compared with placebo at week 12. During the combined efficacy and safety extension phases, the top 3 treatment-emergent adverse events in the combined fulranumab group were arthralgia (11%), peripheral edema (11%), and diarrhea (9%). No cases of joint replacement or death were reported [17]. Despite early study termination, fulranumab treatment resulted in dose-dependent efficacy and was generally well tolerated.
ARA 290 is a nonhematopoietic peptide designed from the structure of erythropoietin. In this trial, ARA 290 (4 mg) or placebo were self-administered subcutaneously daily for 28 days and the subjects followed for an additional months without further treatment. During the 56-day observation period, subjects with ARA 290 treatments had improvement in hemoglobin A1c (Hb A1c) and lipid profiles. Neuropathic pain from PDN improved significantly in the ARA 290 group. In addition, subjects with >1 standard deviation reduction in mean corneal nerve fiber density (CNFD) showed a significant improvement in CNFD compared with no change in the placebo group [18].
Botulinum toxins (BoNTs) are used for treating multiple painful conditions. However, BoNTs are not yet approved for treating PDN in the United States. Multiple small-scaled clinical trials have provided evidence to support the use of type A BoNT (BTX-A) injections for PDN. A meta-analysis selected and analyzed the data from a class I [19] and class II [20] studies to examine the efficacy of BTX-A on PDN [21]. Combining the two qualifying studies, there were a total of 58 patients receiving a sum of 76 treatments for PDN randomly allocated to placebo or BTX-A treatments. The injected areas were identical in each trial with a fixed protocol using a 3 × 4 grid that was equally spaced to demarcate the injection sites on the dorsum of each foot. The class 2 study used OnabotulinumA while the class 1 study used AbobotulinumtoxinA. It was concluded that there was an improvement of 1.96 visual analogue scale points following treatment with BTX-A [21]. The results were concluded as clinically significant improvement of “minimum change in pain.” No serious adverse effects were reported in both trials. The meta-analysis evaluated the significance, low overall risk of bias, and almost no statistical heterogeneity support a correlation between Botox and improvement of pain scores for treating PDN [21]. However, further large scale controlled trials are needed to further establish the clinical efficacy and safety for this potential new indication for BTX-A.
Future study strategies
As reviewed in the current article, promising evidence support that several emerging treatments could be available for treating PDN in the near future. Other novel strategies are also under extensive study for developing new PDN treatments.
Animal studies have provided evidence that neurogenic inflammation in skin could be an important pathomechanisms for the development of PDN [22]. In a mouse model of type 2 diabetes, skin inflammatory cells (such as macrophages and Langerhans cells) could be activated by NGF signaling to target intraepidermal nerve fibers and be responsible for the development of pain behaviors. New evidence suggests that cytokine dysregulation could contribute to these skin inflammatory phenomena and suggest using immuno-modulatory therapies could be a novel treatment strategy for PDN [23].
Sodium channel NaV 1.7, NaV 1.8, and NaV 1.9 (encoded by SCN9A, SCN10A, and SCN11A respectively) are preferentially expressed in peripheral sensory neurons for nociception. Sodium channel Nav1.7 antagonists, including Xenon 402, CNV1014802, and PF-05089771, are being tested as new therapies for PDN [24]. Taken together, accumulating data from evidence-based studies shine light to the promising future of PDN management.
References
DOI: 10.31038/JMG.2018111
Abstract
Fragile X-associated tremor/ataxia syndrome (FXTAS) affects individuals with 55-200 CGG repeats (premutation) in the 5’-untranslated region of the fragile X mental retardation 1 (FMR1) gene. FXTAS is a progressive neurodegenerative disorder associated with an action tremor, cerebellar ataxia, memory and executive function deficits, autonomic dysfunction and neuropathy. Females with the fragile X premutation are often affected by fragile X-associated primary ovarian insufficiency (FXPOI), and may have other medical conditions such as fibromyalgia, depression, anxiety, and immune-mediated disorders like hypothyroidism. Here we present a case of a 54-year-old woman with tremor, ataxia, average memory skills, and executive function deficits who meets criteria for FXTAS. She also has anxiety, Major Depressive Disorder, fibromyalgia, chronic pain and was treated chronically with opioids and she overdosed on fentanyl leading to significant CNS dysfunction.
Keywords
fentanyl, FMR1 premutation, fragile X syndrome, fragile X–associated tremor/ataxia syndrome, FXTAS
Introduction
Patients with the premutation (55-200 CGG repeats) in the fragile X mental retardation 1 (FMR1) gene have elevated FMR1 mRNA expression levels, which have been associated with neurotoxicity, potentially causing neurodevelopmental problems or neurological problems associated with aging in both males and females [1,2]. Women with the premutation face many physical and emotional challenges in their life especially when raising a child with fragile X syndrome (FXS) [3]. Women with the premutation are at risk for early menopause before age 40 (fragile X-associated primary ovarian insufficiency (FXPOI)), fibromyalgia, hypothyroidism, migraines, restless legs syndrome, depression, and anxiety [2,4]. The estimated carrier prevalence of the premutation in women in the USA is approximately 1: 178 [5,6] Premutation carriers may also develop fragile X–associated tremor/ataxia syndrome (FXTAS), a neurodegenerative disorder with increased prevalence with age [7]. FXTAS clinical features include progressive cerebellar ataxia and intention tremor in addition to autonomic dysfunction, peripheral neuropathy, and cognitive impairment [2,8]. Many individuals experience chronic pain and often opioids are prescribed to relieve pain [9]. However, anecdotal evidence suggests that those on long term opioid treatment may experience an increase in the white matter brain changes observed in those with FXTAS [10]. Here we report a case of a woman with FXTAS and autonomic dysfunction who experienced an overdose from fentanyl.
Materials and methods
The patient in this study was evaluated at the Fragile X Research and Treatment Center located at the UC Davis MIND Institute. The patient signed an IRB approved consent form for this research when she was seen. Data were acquired from the medical history obtained during study visits.
Clinical report
The patient is a 54-year-old Caucasian women with a normal allele of 30 CGG repeats and a premutation allele of 93 CGG repeats, with an activation ratio (AR) of 0.15 meaning that only 15% of her cells have the normal X chromosome as the active X. FMR1 mRNA level was 2.71 ± 0.15 times normal. She has a long history of anxiety beginning in childhood and intermittent depression in her adult life. She has a son with FXS who is relatively high functioning. She experienced onset of an intermittent intention tremor and postural tremor at age 49 bilaterally, but more pronounced in her right arm. Progressive balance problems began at age 48, which caused her to fall; her gait difficulties gradually worsened over the next few years.
Her memory problems began at age 47. Her stamina has decreased profoundly over the last few years. She had neuropathy with tingling and numbness in her legs beginning at age 39. Her medical history includes acid reflux, migraines with visual aura, chronic vertigo and chronic pain secondary to fibromyalgia. She started to smoke marijuana daily at age 34 to help her chronic pain. Her history also includes restless legs syndrome, ovarian cysts (which were treated by oophorectomy at age 27), orthostatic hypotension, insomnia (for many years), recurrent urinary tract infections, recurrent nausea and vomiting (treated for the past 10 years with ondansetron). She has a long psychiatric history including severe anxiety, major depression, mood swings, bulimia, and post-traumatic stress disorder (PTSD) (Table 1).
Table 1. FXTAS clinical and molecular findings.
|
Medical History/Clinical Findings |
Age at Onset of Symptoms (years) |
|
Generalized Anxiety Bulimia Migraines FXPOI Major Depressive Disorder Dizziness and vertigo Hypothyroidism Fibromyalgia Chronic Pain Tingling and numbness Memory problems Handwriting problems Balance problem Swallowing problem Tremor Hearing loss |
10 14 16 27 30 34 34 34 34 39 47 47 47 47 48 53 |
|
Neurological Exam |
Severity of Symptoms |
|
Right upper extremity Left upper extremity |
Intention tremor (+++) Postural tremor (++) Intention tremor (+) Postural tremor (+) |
|
Molecular Tests |
Results |
|
Fragile X DNA test (CGG repeats) FMR1 mRNA level (times normal) |
93 2.71 |
|
Diagnosis |
|
|
FXTAS diagnosis FXTAS stage |
Probable 4 |
Due to chronic pain from the fibromyalgia, she started using hydrocodone which made her sick and sleepy. Therefore she discontinued the use of hydrocodone and started fentanyl patches at age 51, with a 75 mcg/hour patch two to three times per day. She was found passed out at home after using a fentanyl patch and she was taken to the emergency room and then the intensive care unit for four days. She was found to have a 95% blockage of her right carotid artery and she suffered from a serious episode of hypoxia from the fentanyl overdose. After this hospitalization she felt much weaker with worsening of the tremor and ataxia, and she could not walk without crutches. She subsequently underwent surgery to alleviate the carotid blockage and a stent was placed in her carotid artery at age 55.
Her current medications include fentanyl patches (25 mcg/hour patch) for pain control, hydrocodone (10-25 mg), diazepam, pitavastatin (4 mg) for pain control, ondansetron (4 mg) for nausea, topiramate for migraine, meclizine for dizziness, paroxetine hydrochloride (40 mg), clopidogrel (75 mg) after stent replacement, probiotics, levothyroxine sodium (0.125mg per day), and cyanocobalamin (1000 mcg/ml).
Her family history includes her father who died of FXTAS, and she has a son with FXS who is 35 years old.
At age 54 before her stent was placed but after her overdose her examination demonstrated: occipital frontal circumference 56.5 cm, height 165.3 cm, weight 66.1 kg, blood pressure was 131/80, and heart rate was 59 bpm. The patient’s neurologic examination included a severe intention tremor with right hand worse than the left hand and dyskinesia in her movements, a positive snout reflex, and a positive palmomental reflex. She had allodynia (pain to touch), and was ataxic with gait. She could not tandem walk.
Her deep-tendon reflexes were 2+ in the upper extremities, 4+ at the knees, and 2+ at the ankles but she often jerked her whole upper body with the tap of the reflex hammer. Her gag reflex was exaggerated and she had bilateral skin nodules around her proximal metacarpal joints. The patient underwent numerous neuropsychological and neuropsychiatric assessments, including the Wechsler Adult Intelligence Scales, 4th edition (WAIS-IV) [11], the Wechsler Memory Scales, 4th edition (WMS-IV) [12], and the Mini-Mental Status Exam (MMSE) [13] to test cognitive status, and the Structured Clinical Interview for DSM-IV Axis 1 Disorders, Research Version, Non-patient Edition(SCID-I/NP) [14] to diagnose psychiatric disorders. Self-reported psychological problems and symptoms of psychopathology were assessed through the Symptom Checklist-90-R (SCL-90-R) [15]. The SCL-90-R scores are reported in T-scores, which have an average range between 40 and 59. For the assessment of executive function, the Behavioral Dyscontrol Scale 2 (BDS-2) [16] was administered. Her scores on the above mentioned assessments are seen in Table 2.
MRI of the brain at age 54 years after overdose and before vascular surgery demonstrated mild atrophy, increased T2 signal intensity in the pons, and severe diffuse increased T2 signal intensity in the deep white matter of the cerebrum. White matter damage was greater on the right side of the brain compared to the left side, suggesting hypoxic damage secondary to the carotid blockage (Figure 1).
Discussion
In this study we report on a woman who has the FMR1 premutation, FXTAS, chronic pain secondary to fibromyalgia and a fentanyl overdose that led to hypoxia because of a carotid artery blockage secondary to atherosclerosis. Opioids are commonly used for pain associated with neuropathy or fibromyalgia in individuals with FXTAS, however there is anecdotal evidence that those on opioids can have faster progression of their FXTAS symptoms [10]. Premutation neurons die more easily in cell culture compared to normal neurons without the premutation so these neurons are considered to be more vulnerable to environmental toxins [1, 17]. This case points out another danger, specifically the high risk of an overdose from opioids such as fentanyl, which in this carrier led to hypoxic damage. Autonomic dysfunction is often seen in FXTAS and fainting or loss of consciousness from cardiac arrhythmias can also be seen in FXTAS [9] but are two separate disorders that affect different patient groups and have different molecular aetiologies. Thus, in this patient, it is possible that the overdose of the fentanyl may have exacerbated the autonomic instability, which with the combined effect of the carotid blockage, led to significant hypoxia which worsened her FXTAS symptoms.
Table 2. Neuropsychological/neuropsychiatric assessments
|
Assessment |
Index Score |
Percentile |
Results |
|
WAIS-IV |
|||
|
Verbal comprehension |
93 |
32 |
Average |
|
Perceptual reasoning |
88 |
21 |
Low average |
|
Working memory |
86 |
18 |
Low average |
|
Processing speed |
76 |
5 |
Borderline |
|
Full scale IQ |
83 |
13 |
Low average |
|
WMS-IV |
|||
|
Auditory memory |
107 |
68 |
Average |
|
Visual memory |
86 |
18 |
Low average |
|
Visual working memory |
80 |
9 |
Low average |
|
Immediate memory |
94 |
34 |
Average |
|
Delayed memory |
98 |
45 |
Average |
|
MMSE |
29 |
Preserved orientation and short term memory skill |
|
|
BDS-2 |
16 |
Moderate difficulties in executive functioning skills |
|
|
SCID-I/NP |
Current Major Depressive Disorder |
||
|
SCL-90-R (T-scores) |
|||
|
Somatization |
81 |
Clinically Significant |
|
|
Obsessive-compulsive symptoms |
80 |
Clinically Significant |
|
|
Interpersonal sensitivity |
64 |
Clinically Significant |
|
|
Depression |
69 |
Clinically Significant |
|
|
Anxiety |
66 |
Clinically Significant |
|
|
Hostility |
69 |
Clinically Significant |
|
|
Phobic anxiety |
70 |
Clinically Significant |
|
|
Psychoticism |
69 |
Clinically Significant |
|
|
Global symptom index |
72 |
Clinically Significant |
|
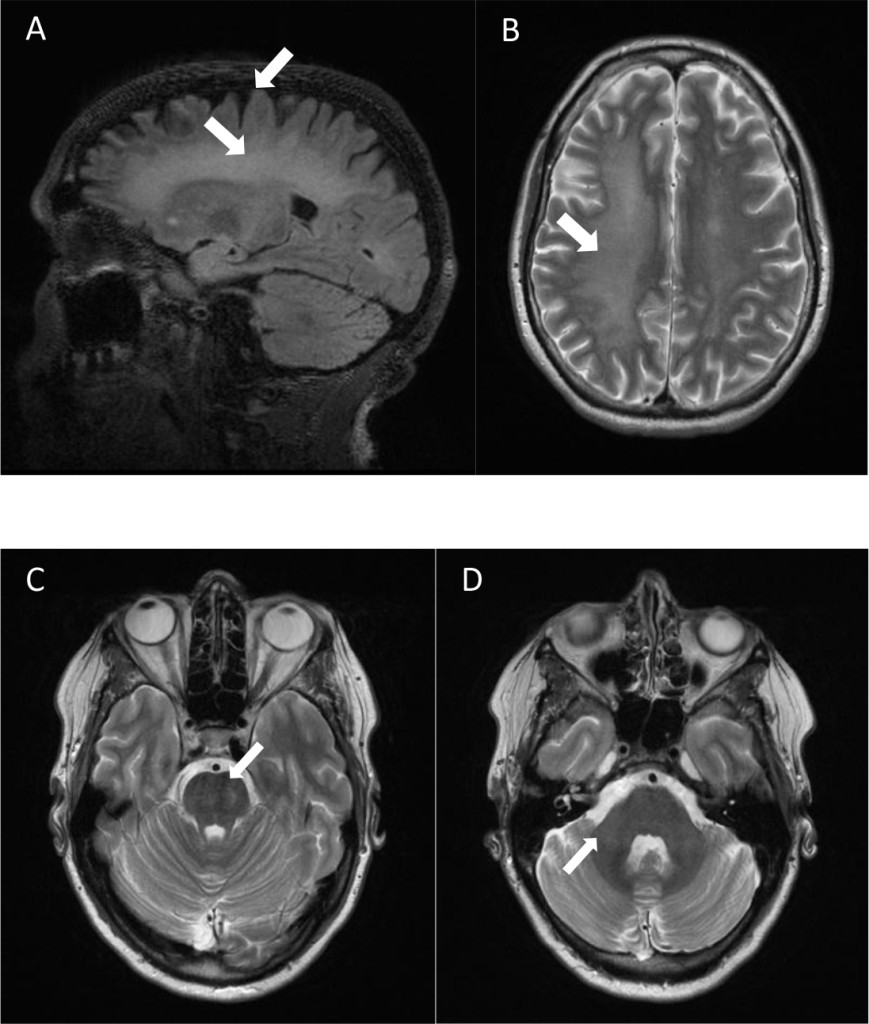
Figure 1. Brain MRI of a 54-year-old female fragile X premutation carrier, after fentanyl overdose and before vascular surgery. MRI demonstrated mild atrophy (A), increased T2 signal intensity in the pons (C), and severe diffuse increased T2 signal intensity in the deep white matter of the cerebrum (A, B). White matter damage was greater on the right side of the brain compared to the left side (B). Patient did not have increased T2 signal intensity in the middle cerebellar peduncles (D).
Even though the patient’s neurocognitive functioning is mainly preserved (low average to average scores on most assessments), her scores on the BDS-2 point to impaired executive functioning, which includes poor decision-making, planning, and motor control. Her borderline low processing speed index score is another indicator of subtle impairments that have not fully expanded to affect her general cognitive functioning (Table 2). In addition, her psychiatric history and current mental health problems indicate a particular vulnerability and could lead to further impairments in the future.
Fentanyl is a potent opioid analgesic used in the treatment of pain which is common in FXTAS and in fibromyalgia. Transdermal fentanyl patches are now widely utilized as an acceptable and efficacious method of medication delivery [18]. In addition to possible exacerbation of FXTAS symptoms, long-term exposure to opioids can make individuals more sensitive to pain through neoplastic changes in the peripheral and central nervous systems, a phenomenon known as opioid-induced hyperalgesia [19]. Identification of individuals currently using opioids in a problematic way is important given the substantial recent increases in prescription rates and consequent increases in morbidity and mortality. The present review provides updated and expanded information regarding excessive opioid use in chronic pain. Because of these findings, we recommend avoiding opioids whenever possible in the treatment of pain in individuals with the premutation or FXTAS.
Conclusion
We recommend evaluating premutation carriers with chronic pain carefully, and avoiding long-term opioid use to prevent possible exacerbation of symptoms of FXTAS. Alternative treatments for pain include gabapentin, cannabidiol and anti-inflammatory medication.
Finally, appropriate management of depression, anxiety, chronic pain and preventing long-term use of opioids may slow the progression of white matter disease in those with FXTAS.
Acknowledgements: This research was supported by the United States National Institute of Child Health and Human Development (grant R01 HD036071), the MIND Institute Intellectual and Developmental Disabilities Research Center (grant U54 HD079125) and the National Center for Advancing Translational Sciences and National Institutes of Health (grant UL1 TR001860).
Conflicts of interest: RH has received funding from Roche, Novartis, Neuren, Marinus, and Alcobra for carrying out treatment studies in patients with fragile X syndrome. She has also consulted with Roche, Novartis, Alcobra, Fulcrum and Zynerba regarding treatment studies in individuals with fragile X syndrome. FT received funds from Asuragen, Inc. The other authors declare no conflicts of interest.
References
Abstract
This study was part of the larger Pioneer Project, conducted at the Institute for Women’s Health, Texas Woman’s University, from 2000 – 2004. The pioneer Project was a longitudinal study of women (n=351) encompassing the lifecycle between ages 18 – 60. The purpose of this study was to determine if there was an association between dietary iodine consumption and body composition in Caucasian females between the ages of 18 to 60. Spearman rank order correlation assessed the association between dietary iodine intake and body weight, percent lean body mass, percent body fat, waist-to-hip ratio, total body bone mineral density (TBBMD), and circulating concentrations of T3, T4, and thyrotropin-stimulating hormone (TSH). No significant association was found between iodine intake and body weight, percent lean body mass, percent body fat, waist-to-hip ratio, TBBMD, TSH, T3, or T4. Analysis of variance (ANOVA) evaluated any significant differences between tertiles of iodine intake. ANOVA revealed no significant differences between iodine intake tertiles on percent lean body mass, percent body fat and waist-to-hip ratio.
Keywords
Iodine, body composition, percent body fat, percent lean mass, thyroid hormones
Introduction
Iodine is an essential micronutrient that is primarily concentrated in the thyroid gland (70–80% of iodine) [1]. The biosynthesis of thyroid hormones depends on adequat e dietary iodine consumption, with the thyroid gland being the primary site for iodine absorption and storage [2]. An adult human body can contain 15–20 mg of iodine, with about 80% in the thyroid gland [3]. Around 120 µg/d of iodide is typically collected by the thyroid gland to assist with the synthesis of thyroid hormones, tri-iodothyronine, T3 and thyroxine, T4 [1]; T4’s weight is composed of 65% iodine while T3’s weight is composed of 59% iodine [4]. The thyroid gland usually produces about 90% T4 and 10% T3, with T4 having the ability to convert to T3 in tissues of the human body [5]. T3 has the predominant metabolic effects in the body [6]. Most of the iodine in the thyroid gland is stored in the form of the glycoprotein, thyroglobulin. Thyroid hormones assist in the early growth process and development of a majority of organs, specifically the brain, and for metabolism of most human cells [7]. Thyroid iodine accretion and turnover decide the iodine requirement for each individual [8]. Selenium is essential for iodine metabolism because it is part of one of the enzymes, iodothyronine-5’-deiodinase, that contributes to the formation of active T3 from thyroglobulin and T4 [6]. The sodium-iodide symporter system is the primary contributor to the maintenance of healthy thyroid hormone secretion [9]. Iodine excretion is mainly through the urine, but small percentages can be found in feces because of biliary secretion [10].
The essential trace element iodine has a recommended dietary allowance (RDA) of 150 μg/day and tolerable upper intake (UI) of 1100 μg/day [3, 8, 11]. Dietary sources of iodine include iodized salt, seaweed, seafood such as oysters, lobsters, clams, sardines, and other saltwater fish, molasses, potatoes, navy beans, eggs, bread, and dairy products [10, 12, 13]. Iodophors are coloring agents, dough conditioners, and disinfectants used in dairy processing [11]. Iodine content in milk is mainly affected by iodophor sanitizing solutions used by the dairy industry and iodine added to animal feed [14]. Majority of dietary iodine is in iodide form, but iodate form is used in iodized salt, and in bread conditioners; in the body, iodate is readily reduced to iodide when consumed or injected intravenously [3]. The amount of iodine found in a majority of food sources is low, and the irrigation, fertilizers, and soil content can affect the iodine level in each food item [8]. Seafood usually has an increased amount of iodine because marine animals can concentrate iodine from seawater [8]. Iodine can be added into dairy products and chicken through supplementation in feed, as well as any sanitizing agents that may contain iodine [15]. The amount of iodine in both eggs and milk can vary depending on the iodine level in the diet of the hens and cows [3]. Cattle and chicken diets are often supplemented with kelp to provide a considerable amount of iodine through eggs (yolks are iodine-rich), meat, and milk products [16]. Compared to the United States, Japan has some of the highest intakes of iodine because of their consumption of iodine-rich seaweed. Seaweed consumption can add as much as 200 mg of daily iodine to an individual’s diet, and it might have up to 4.5 g I/kg [3, 17]. For those Japanese individuals who favor seaweed, 15–30 g of seaweed Kombu, contains about 35–70 mg of iodine, and would usually be consumed during one meal [17]. The Japanese population may consume up to 25 – 40 times the median amount of iodine in the United States without adverse effects [18]. In the United States, by weight, iodized salt is composed of one part salt to 10, 000 parts sodium chloride; which means that 1 g of iodized salt contains about 75 μg of iodine [16, 19]. Iodine deficiency was almost eliminated with the iodization of salt in the United States and several Western countries [20]. Radiocontrast media, water purification tablets, certain medications such as Amiodarone (or Cordarone), food coloring, dental and skin disinfectants have large amounts of iodine that can impact thyroid function [3, 8]. Goitrogens are substances that are naturally present in foods that can block iodine uptake by the thyroid cells from the blood by reducing iodine organification by the thyroid gland [21]. Foods containing goitrogens include millet, cassava, and cruciferous vegetables like cabbage and broccoli, soybeans, sweet potatoes, peanuts, kelp, turnips, and rapeseed [11]. These do not typically have clinical significance unless an individual has a coexisting iodine deficiency [8]. Iodine deficiency can be worsened if an individual already has a deficiency of selenium, iron, or vitamin A [8]. Iodine is primarily excreted through the kidneys, and therefore urinary iodine assessment can serve as a consistent tool for dietary iodine intake [16]. Recommended median urinary iodine excretion that indicates iodine sufficiency in populations is 150 µg/L [22]. When comparing different geographical areas, urinary iodine excretion and thyroid size are the two commonly utilized measures of an individual’s iodine status. Serum thyroglobulin is a useful marker of iodine status in an iodine-deficient population [23].
Iodine deficiency can affect individuals of all ages, and the clinical effects range from mild hypothyroidism to severe endemic cretinism and goiter [24]. Two primary factors controlling the growth of the thyroid gland are TSH and iodine intake [25]. Iodine deficiency interferes with the synthesis of T3 and T4 hormones. TSH is released in response to reduced serum concentrations of T4. TSH stimulates the thyroid gland to generate more thyroid hormones and to also grow in size in an attempt to concentrate as much iodine as possible [1, 26]. Even though the thyroid gland can release these hormones for a short time through the stored components in thyroglobulin molecules, when these stores are depleted, serum concentrations of T4 start to decrease [15]. The pituitary gland intervenes by increasing TSH release which causes the thyroid gland to enhance its uptake of iodide to increase thyroid hormone production [1]. In chronic iodine deficiency states, hyperplasia of follicular cells occurs when TSH is unable to promote T4 release resulting in hypertrophy and hyperplasia of the follicular cells leading to the development of goiter [1]. Iodine deficiency can be improved through the addition of iodine to dietary sources such as salt, water, sauces, oil, and consumption of iodine-rich foods [1]. The use of iodized salt and iodized oil have proven to be useful in numerous individuals for treatment of iodine deficiency [27]. When the physiological requirements of iodine are not met, a variety of functional or developmental abnormalities including defects in thyroid function, endemic goiter and cretinism, reduced fertility rate, endemic mental retardation, and a rise in perinatal death and infant mortality [7, 27].
A significant association was demonstrated between iodine intake and thyroid volume, with salt iodization significantly reducing thyroid volume in individuals with mild to moderate iodine deficiency [23, 28]. Overweight and obesity can also impact thyroid functioning. Significant correlations between weight, height, and thyroid volume have been observed. Boyanov et al., 2004 demonstrated a positive correlation between weight, height, body surface area (BSA), and fat-free mass and thyroid volume [29]. In another study that compared obese to non-obese participants, thyroid volume in obese participants was not associated with body weight but positively correlated with LBM [25]. In non-obese participants, the correlation between thyroid volume and LBM was stronger than the correlation between thyroid volume and body weight [25]. Sari et al., 2003 demonstrated an increased TSH concentration and thyroid volume in obese vs non-obese women, positive correlation between thyroid volume and body weight, and a significant reduction in TSH and thyroid volume in participants who had > 10% weight loss in six months with the obesity treatment, with no effect on participants with < 10% weight loss [30].
Basal metabolic rate (BMR) contributes about 60–75% to an individual’s daily energy expenditure and therefore regulates body weight [31]. Numerous studies have supported a decrease in BMR related to changes in body composition, especially a reduction of fat-free mass, with physiological, hormonal and lifestyle factors significantly impacting BMR [31, 32]. One of the primary roles of thyroid hormones in adult humans is the regulation of thermogenesis. A variety of studies have observed effects of thyroid hormones on cellular processes necessary for energy expenditure [32]. Patients with hyperthyroidism, with an excess secretion of thyroid hormones, T3 and T4, tend to have an elevated BMR that can lead to weight loss. Patients with hypothyroidism, tend to have a decreased BMR and decreased T3 and T4 concentrations that can lead to weight gain. Data from the National Health and Nutrition Examination Survey (NHANES), 2009–2010, showed that more than one-third of adults in the United States (35.7%) are obese, with no difference in prevalence between sexes [33, 34]. Two-thirds of the United States population is either overweight or obese. In a study by Carlton, 2010, one-third of the U.S. population was on some type of diet such as the Atkins for Life Diet, the South Beach Diet, the DASH (Dietary Approaches to Stop Hypertension) Diet, or the Best Life Diet that is deficient in micronutrients, with such diets being correlated with an increased risk of overweight, obesity and other chronic diseases [35]. Twenty-seven micronutrients including iodine were analyzed, and all four diet plans provided inadequate dietary levels of all twenty-seven micronutrients [35]. With the increasing incidence of obesity and potential lack of iodine in the American diet, use of iodine supplements may help to prevent or decrease obesity through the alteration of body composition and BMR.
Purpose of this study
The purpose of this retrospective study was to determine if dietary iodine consumption is associated with changes in body composition, including body weight, total body bone mineral density (TBBMD), waist-to-hip ratio, percent body fat, and percent lean body mass in Caucasian females between the ages of 18 to 60. The data used for this study came from the Pioneer Project, a longitudinal, observational study performed from 2000–2004 in the Institute for Women’s Health at Texas Woman’s University. The study observed women’s health throughout the reproductive, peri-menopausal, and post-menopausal years of life. Dietary iodine is equally crucial for both growth and metabolism as it is essential for the synthesis of thyroid hormones involved in these processes. Increased incidence of overweight or obesity in individuals may be the result of a deficiency in iodine, resulting from decreased consumption of foods containing iodine. If concentrations of T3 and T4 are decreased in an individual’s body, lower metabolism which ultimately causes weight gain and excess adiposity may be the result. This study may explain some of the causes of the current obesity epidemic. This study assessed the relationships between dietary iodine intake and body weight, percent lean body mass and percent body fat, waist-to-hip ratio, TBBMD, circulating concentrations of T3, T4, and thyrotropin-stimulating hormone (TSH), when controlling for all other variables (such as age, percent body fat, percent lean body mass, and total bone mineral density by DXA). This study tested the following assumptions: all participants were healthy individuals; the Harvard Food Frequency Questionnaire (HFFQ) is a reliable and a valid measure of the participants’ dietary iodine consumptions; the limitations imposed in this study will not destroy the external validity of the results; all participants provided accurate information for this study; and all testing that was performed for this study was reliable and accurate. The null hypotheses are stated below:
Methods
This retrospective study used data collected during the Pioneer Project, a longitudinal, observational study of women’s health throughout the reproductive, peri-menopausal, and post-menopausal years. The Pioneer Project was performed by the Texas Woman’s University’s (TWU) Institute for Women’s Health (IWH) from 2000–2004, with funds provided by the State of Texas. The Pioneer Project recorded comprehensive medical, psychological, physiological, socio-economical, and nutritional information from 351 women between 18 to 60 years of age. The anthropometric and nutritional information that was obtained through the Pioneer Project was used for this retrospective study. This study was approved by the Institutional Review Board at Texas Woman’s University.
Study design
This retrospective study used data collected during the Pioneer Project to determine if there was an association between dietary iodine intake and body composition. Data used in the study included body weight, height, dietary iodine consumption, total body bone mineral density (TBBMD), percent body fat, percent lean body mass, and serum concentrations of T3, T4, and TSH. Dietary iodine consumption levels were estimated using the Harvard Food Frequency Questionnaire (HFFQ). Blood samples were analyzed for serum concentrations of T3, T4, and TSH; blood samples were collected at the beginning of the Pioneer Project and as a follow-up, 1-year later. The blood samples were analyzed by Covance, a clinical research laboratory. TBBMD was measured with the Dual-energy X-ray Absorptiometer (DXA, Lunar Prodigy, Madison, WI) at Texas Woman’s University, Institute for Woman’s Health, Exercise, and Sports Nutrition Clinic. The DXA also evaluated the ratio of fat-to-lean-tissue, muscle mass, bone mass and density.
Participants
The participants included in this study were 351 Caucasian females, 18 to 60 years of age, living primarily in Denton, but also from Dallas and Houston, Texas. Recruitment was completed by distributing flyers around the TWU Campus, through radio announcements, and in local newspapers throughout the surrounding areas of Denton, Dallas, and Houston, Texas. All participants were first screened via a phone interview to determine eligibility criteria and were sent a medical history questionnaire that was completed before their first visit to the IWH. Inclusion Criteria included: participants were in generally good health and able to give written informed consent, females aged between 18 and 60 years, willingness to undergo the necessary testing at yearly intervals, no anticipated change in geographic location for at least 2-years. Exclusion Criteria included- resting systolic blood pressure ≥ 200 mm Hg, diastolic value > 115 mm Hg, weight > 275 lbs, pregnancy or attempting to become pregnant, within 6-months post-partum, or unable to stand freely, any indication of cardiovascular disease, all of which include frequent or complex ventricular ectopy, acute congestive heart failure, suspected myocarditis or pericarditis, aortic stenosis, valvular heart disease, uncontrolled atrial arrhythmia, uncontrolled ventricular arrhythmia, any history of a myocardial infarction, unstable angina, third degree atrioventricular block, and recent significant changes in a resting electrocardiogram (ECG) suggesting infarction or other acute, cardiac event, cardiovascular accident (CVA), renal disease including (but not limited to) polycystic kidney disease, glomerulonephritis, chronic pyelonephritis, recurrent kidney stones; transient ischemic attacks (TIA), positive HIV/AIDS status, seizure disorder, cancer, except for basal cell skin cancer that was completely treated, any history of pulmonary embolus, ventricular aneurysm, acute infection, thrombophlebitis (active), pacemaker, electrolyte abnormalities, hypertension, implantable defibrillator, diagnosed with diabetes, hypercholesterolemia, diagnosed with thyroid disorder, taking oral contraceptives or hormone replacement therapy, participating in clinical drug study, or involving investigator’s judgment, autoimmune disorders such as scleroderma, rheumatoid arthritis, or systemic lupus erythematous; and respiratory disorders like emphysema, asthma (currently), or chronic bronchitis, surgeries such as valve replacement, cardiac bypass, gastric stapling, or intestinal bypass; medication like antipsychotics, thyroid replacement, anticoagulants, corticosteroids, or cardiac medication, hepatic disease such as that which includes Hepatitis B or C, cirrhosis, a transplant of any kind, current or past history of alcohol or drug abuse, illegal drug use, or eating disorder, any pre-existing condition that would prohibit their ability to complete the study procedures (this included foot problems, hip replacement, or orthopedic injury/surgery). Participants who met the inclusion criteria and had all data collected were included in this study. Questionnaires- Participants were required to complete an informed consent form, approved by the Institutional Review Board of Texas Woman’s University to participate in the Pioneer Project and a Physiological Assessment Addendum Consent before their initial visit. Consent forms were signed in the presence of a Pioneer Project staff member. After an initial visit to review the participant’s medical history, and eligibility for study participation, the individual’s height, body weight, pulse, blood pressure, and hip and waist circumference measurements, fasting blood and urine samples were collected. Participants were provided with the Harvard Food Frequency Questionnaire to assess dietary iodine levels and a physical activity questionnaire with instructions on how to complete both the questionnaires. Questionnaires were completed yearly by all participants and physiological measurements obtained every four years from participants meeting specified criteria.
Dietary Iodine assessment- Harvard food frequency questionnaire
The Harvard Food Frequency Questionnaire (HFFQ) developed by Harvard University’s School of Public Health [36], was administered to participants at their initial visit to be filled out and returned at their next visit. The HFFQ is a 115-item questionnaire used for dietary data related to the participants’ dietary intake for the past year. This questionnaire had the participants recall and document the number of times per day, week, or month they consumed certain foods. These food items are categorized by specific food groups including eggs and meat, bread and cereals, dairy, vegetables, and fruits. The HFFQ also had questions concerning how their food was prepared, types of food used, condiment use, vitamin and mineral supplement use and the number of beverages and sweets or baked goods throughout the past year. Once the questionnaires were completed, they were sent to the Harvard University’s School of Public Health for the analyses of total energy consumption and nutrient content. The results were sent back to Texas Woman’s University in an Excel format. Estimated daily iodine intake was obtained from the HFFQ for the present study.
Anthropometric measurements
Height- Height was measured with the use of a wall-mounted stadiometer (Perspectives Enterprises, Portage, MI) that displayed both inches and centimeters. The participants removed their shoes and any heavy outer garments or accessories for the measurements. Participants stood underneath the sliding platform facing away from the stadiometer with their weight evenly distributed between both feet, heels pressed against the wall of the stadiometer with their arms hanging at the side, palms facing their thighs, looking forward with their chin parallel to the floor. Two measurements were obtained within 0.1 cm of each other, and measurements were averaged and recorded. If the two measurements were not within 0.1 cm, a third measurement was obtained, and the median value was recorded. Weight- Two different standard methods were utilized to measure weight. One of the methods had the participant stand on a balance scale (Continental Scale Corporation, Bridgeview, IL), facing the wall, with both feet flat, and arms by their side. The second method had the participant standing still on a digital scale (Tanita Corporation, Japan) with arms by their side. Two weight measurements were obtained for each participant, and the two measurements had to be within 0.1 kg of each other. Then the two measurement values were averaged and recorded. If the weight was not within 0.1 kg, a third measurement was obtained with the median value being recorded. Waist-to-hip ratio- The waist-to-hip ratio is a method that helps to estimate body composition, helps to describe an individual’s body proportions, and reflects the degree of abdominal obesity. A measuring tape (Graham Field, Atlanta, GA) was used to determine the circumference of participant’s hips (widest part of the buttocks) and the circumference of participant’s waist (just above the belly button). Once both of these measurements were obtained, waist-to-hip ratio was calculated by dividing the participant’s hip circumference by the participant’s waist circumference in centimeters. Dual-Energy X-ray absorptiometry-The absorptiometer that was utilized in this study was a Dual-energy X-ray Absorptiometer (DXA, Lunar Prodigy, Madison, WI). DXA utilizes two different photon energies (X-ray beams) to measure an individual’s soft tissue and bone, and therefore, can provide measurements of fat mass, lean body mass, bone mass, and bone density. The T-score displays the amount of bone an individual has compared to a young adult (age 20) of the same sex with peak bone mass. A T-score that is above -1 is considered normal, a score between -1 and -2.5 is classified as osteopenia or low bone mass, and a score below -2.5 is considered osteoporosis. T-score is also used to provide an estimate of an individual’s risk of developing a fracture. Alternatively, the Z-score reflects the amount of bone that an individual has compared with other people in the same age group, sex, and race. The DXA also evaluated the ratio of fat-to-lean-tissue, muscle mass, bone mass and density. Age- Age was determined according to the individual’s date of birth and represents the individual’s age at the time of data collection.
Statistical analyses
IBM Statistical Packages for the Social Sciences (SPSS) version 19.0 (SPSS Inc., Chicago, IL) was used to conduct all statistical analyses. Statistical significance was set at p<0.05. Spearman’s rank order correlation was performed to determine if there was an association between dietary iodine intake and body weight, percent lean body mass and percent body fat, waist-to-hip ratio, TBBMD, and the circulating concentrations of T3, T4, and TSH. Partial correlations were performed to determine if there were associations between dietary iodine consumption and circulating concentrations of T3, T4, and TSH while controlling for age and circulating concentrations of T3, T4, and TSH. One-way analysis of variance (ANOVA) was performed with tertiles of iodine intake at three levels, Group 1, ≤ 33rd percentile of the sample that had the lowest iodine intake; Group 2, > 33rd percentile and ≤ 66th percentile of the sample with an iodine intake in the middle; and Group 3, > 66th percentile of the sample with the highest iodine intake. The data were stratified by thirds to determine if any associations existed between iodine intake and the variables mentioned above.
Results
All participants in this study were Caucasian, even though this was not part of the inclusion criteria. There were 351 participants from the Pioneer Project who provided anthropometric data, including height and weight. There were 188 participants who had their body weight, percent lean body mass, percent body fat, and TBBMD measured, 225 participants who had grams of total mass, grams of total lean mass measured, and grams of total fat mass; 180 participants who had waist-to-hip ratio measured and 57 participants who had TSH, T3, and T4 measured. The sample sizes described above vary for each test because not every participant provided all the data which were analyzed in this study.
The participants’ body weights ranged from 46.5 to 115.8 kg. The participants’ iodine intakes ranged from 0 to 340.1 μg/ day. The percent of lean body mass ranged from 4.6 to 81%. The percent of body fat ranged from 5.4 to 59%. The participants’ waist-to-hip ratios ranged from 0.6776 to 0.9143. TBBMD for the participants ranged from 1.01 to 1.39 g/cm2. The circulating level of TSH ranged from 0.008 to 7.783 µIU/ml while T3 ranged from 0.446 pg/ml to 17.819 pg/ml, and T4 ranged from 0.462 ng/dl to 1.721 ng/dl. Mean Iodine Intake, Weight, Percent Body Fat, Percent Lean Body Mass, and TBBM, TSH, T3, and T4 Data for Pioneer Project Participants are reported in Table 1.
Table 1. Mean Iodine Intake, Weight, Percent Body Fat, Percent Lean Body Mass, and TBBM, TSH, T3, and T4 Data for Pioneer Project Participants.
|
Variable |
Sample Size (n) |
Mean |
SD |
|
Iodine Intake (μg) |
188 |
55.8 |
82.9 |
|
Weight (kg) |
188 |
66.5 |
13 |
|
LBM% |
188 |
.62 |
.09 |
|
BF% |
188 |
.38 |
.08 |
|
TBBMD (g/cm2) |
188 |
1.18 |
.07 |
|
Waist-to-hip Ratio |
180 |
.8 |
.05 |
|
TSH (µIU/ml) |
57 |
1.21 |
1.17 |
|
T3 (pg/ml) |
57 |
2.81 |
2.28 |
|
T4 (ng/dl) |
57 |
1.16 |
.35 |
Percent Body Fat – BF%, Percent Lean Body Mass – LBM%, and Total Body Bone Mineral Density – TBBMD, Thyrotropin Stimulating Hormone – TSH, Triiodothyronine – T3, and Thyroxine – T4
Dietary iodine consumption was assessed from the HFFQ, which revealed that a large group of participants from the Pioneer Project had an intake of 0 μg of iodine per day, reducing the variability of iodine intake in the study population. The majority of participants consumed less than the RDA of 150 μg of iodine per day. 60% of participants (n=113) consumed 0 μg of iodine per day while 70% of participants (n=132) consumed below the 150 μg of iodine per day for the RDA (See Figure 1).
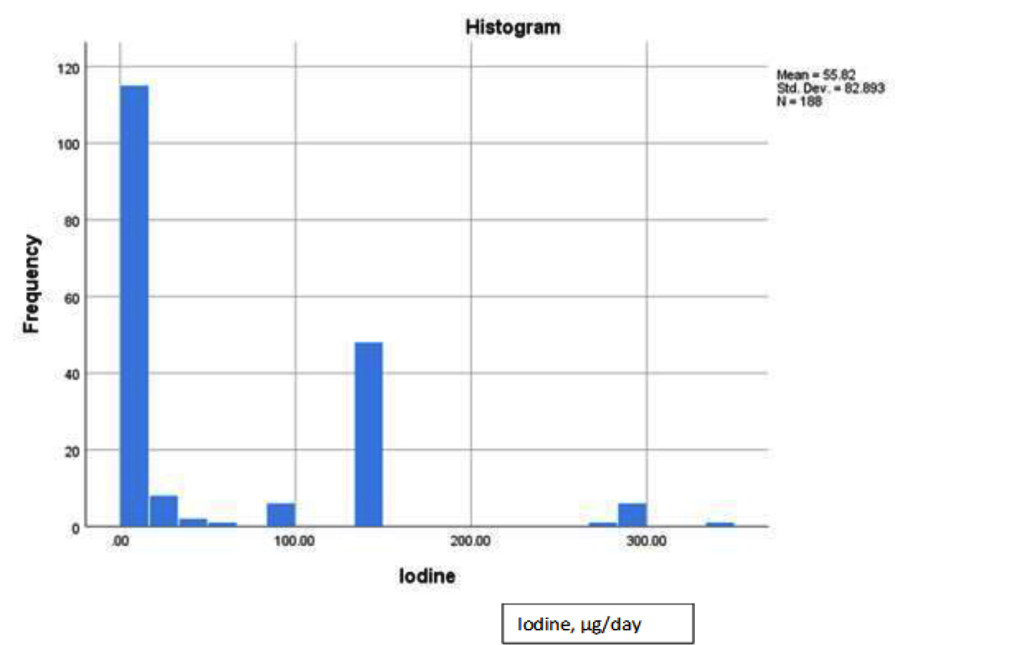
Figure 1. Dietary iodine distribution histogram for pioneer project participants.
ANOVA was used to assess any significant differences between means of three tertiles of iodine intake on percent lean body mass, percent body fat and waist-to-hip ratio (Tables 2 and 3). As a whole, no significant differences between the iodine intake groups on percent lean body mass (p = .696), percent body fat (p = .747), and waist-to-hip ratio (p = .973) were observed. Therefore, the null hypothesis was failed to be rejected. However, it is important to note that the participants who had the highest iodine intake (Group 3, > 66th percentile of the RDA) had the highest mean percent lean body mass and lowest mean percent of body fat. In Group 3, the highest mean percent lean body mass was 62.6% and the lowest mean percent body fat was 37.4%.
Table 2. Mean Percent Body Fat Among Tertiles for Iodine Intake.
|
Group |
Sample Size (n) |
Mean |
SD |
|
1 |
113 |
37.6% |
8.9% |
|
2 |
12 |
39.4% |
8.9% |
|
3 |
63 |
37.4% |
7.3% |
Group 1, ≤ 33rd percentile of the lowest iodine intake; Group 2, > 33rd percentile and ≤ 66th percentile of iodine intake in the middle; Group 3, > 66th percentile of the highest iodine intake
Table 3.Mean Percent Lean Body Mass Among Tertiles for Iodine Intake.
|
Group |
Sample Size (n) |
Mean |
SD |
|
1 |
113 |
61.6% |
10% |
|
2 |
12 |
60.6% |
8.9% |
|
3 |
63 |
62.6% |
7.3% |
Group 1, ≤ 33rd percentile of the lowest iodine intake; Group 2, > 33rd percentile and ≤ 66th percentile of iodine intake in the middle; Group 3, > 66th percentile of the highest iodine intake
Spearman’s rank order correlation assessed the association between dietary iodine intake and body weight, percent lean body mass, percent body fat, waist-to-hip ratio, TBBMD, and circulating concentrations of T3, T4, and TSH (Table 4). No significant association was found between iodine intake and body weight (rs = .085, p = .247), percent lean body mass (rs = .018, p = .808), percent body fat (rs = -.003, p = .962), waist-to-hip ratio (rs = .021, p = .775), TBBMD (rs = .087, p = .235), TSH (rs = -.156, p = .250), T3 (rs = -.038, p = .778), or T4 (rs = -.216, p = .109). After analyzing the data, the null hypotheses failed to be rejected (all p values were > .05) which indicated that there were no significant associations between dietary iodine intake and body weight, percent lean body mass, percent body fat, waist-to-hip ratio, TBBMD, and circulating concentrations of T3, T4, and TSH.
Table 4. Spearman’s Rank Order Correlation Results.
|
Iodine Intake (μg) vs. Variable Below |
rs |
P |
|
Weight (kg) |
.085 |
.247 |
|
LBM% |
.018 |
.808 |
|
BF% |
-.003 |
.962 |
|
Waist-to-Hip Ratio |
.021 |
.775 |
|
TBBMD (g/cm2) |
.087 |
.235 |
|
TSH (µIU/ml) |
-.156 |
.250 |
|
T3 (pg/ml) |
-.038 |
.778 |
|
T4 (ng/dl) |
-.216 |
.109 |
Percent Body Fat – BF%, Percent Lean Body Mass – LBM%, Total Body Bone Mineral Density – TBBMD, Thyrotropin Stimulating Hormone – TSH, Triiodothyronine – T3, and Thyroxine – T4
Partial correlations were also performed to determine if there was an association while controlling for specific variables (Table 5). The partial correlations included the evaluation of 1) dietary iodine intake with the circulating concentrations of T3, T4, and TSH while controlling for all other variables that could affect the outcome, and 2) age with the circulating concentrations of T3, T4, and TSH while controlling for all other variables that could affect the outcome. When controlling for body weight, percent lean body mass, percent body fat, waist-to-hip ratio, TBBMD, and age, no correlation between iodine intake and T4 was observed. Concentrations of TSH and T3, and their correlation with iodine intake had a slight increase in their “r” value, but the values indicated no significant correlation. The control variables (body weight, percent lean body mass, percent body fat, waist-to-hip ratio, TBBMD, and age ) did not significantly affect the correlation of iodine intake on TSH (rs = -.069, p = .673), T3 (rs = -.056, p = .731), and T4 (rs = -.152, p = .348). Alternatively, when controlling for body weight, percent lean body mass, percent body fat, waist-to-hip ratio, TBBMD, and iodine intake, there was an increase in the correlation between age and TSH, T3, and T4 than when compared to iodine intake with the levels of circulating hormones. When analyzing the correlations of age with TSH (rs = -.040, p = .806), T3 (rs = .214, p = .185) and T4 (rs = .154, p = .342), there were no significant associations of age with the circulating hormone levels.
Table 5. Partial Correlation Results.
|
Variable |
rs |
P |
|
Iodine Intake vs. TSH (µIU/ml) |
-.069 |
.673 |
|
Iodine Intake vs. T3 (pg/ml) |
-.056 |
.731 |
|
Iodine Intake vs. T4 (ng/dl) |
-.152 |
.348 |
|
Age vs. TSH (µIU/ml) |
-.040 |
.806 |
|
Age vs. T3 (pg/ml) |
.214 |
.185 |
|
Age vs. T4 (ng/dl) |
.154 |
.342 |
Thyrotropin Stimulating Hormone – TSH, Triiodothyronine – T3, and Thyroxine – T4
After analyzing the data obtained, the null hypotheses were failed to be rejected that there were significant associations between dietary iodine intake and body weight, percent lean body mass, percent body fat, waist-to-hip ratio, TBBMD, and circulating concentrations of T3, T4, and TSH. The null hypothesis was failed to be rejected that there was a significant association between dietary iodine intake and the circulating concentrations of T3, T4, and TSH when controlling for all other variables. ANOVA was completed to assess if there were any significant differences between the means of the iodine intake tertiles on percent lean body mass, percent body fat, and waist-to-hip ratio. After analyzing the effect of iodine intake separated into tertiles, the null hypotheses were failed to be rejected that there were no significant associations between dietary iodine intake and percent body fat, percent lean body mass, and waist-to-hip ratio.
Discussion
Iodine is essential for healthy thyroid function, and the thyroid hormones are responsible for regulating basal metabolic rate (BMR). Thyroid hormones are required for cellular respiration and energy production of ATP, which further enhances an individual’s oxygen consumption and metabolism. Both T3 and T4 are needed for normal growth as well as development, energy metabolism, and protein synthesis. The thyroid stimulates energy production through the cellular mitochondria thereby impacting an individual’s BMR [37]. Strengths of this study include the availability of data from the Pioneer Project which provided comprehensive medical, psychological, physiological, socio-economical, and nutritional information from 351 women between 18 to 60 years of age. The duration of the Pioneer Project with data being collected over a period of 4-years allowed for a varied range of participant ages and large sample size for data analysis. One of the main limitations of this study was that only Caucasian females were analyzed, although this was not an inclusion criterion. It is unsure if the male sex or other ethnicities would have different outcomes from what was shown in this study as neither population was assessed. Not all participants had data collected for every variable being measured in the study accounting for missing data, which may have impacted the results. The HFFQ was used to analyze the participant’s iodine intake as opposed to assessing the participant’s urinary iodine excretion which is a more accurate estimation of dietary iodine intake. The HFFQ revealed that a large group of participants from the Pioneer Project had an intake of 0 μg of iodine per day, which reduced the variability in the population. The majority of participants consumed less than the RDA of 150 μg of iodine per day. The Harvard Food Frequency Questionnaire (HFFQ) utilized in this study can be a practical method for performing a dietary assessment, but it is not without its limitations. The HFFQ requires that the participants recall the frequency of food items they consumed during the week, the month, or the year before. Participants also estimate what they consumed in their diet instead of providing exact measurements through a food record. Also, there are some non-specific questions included in the food frequency questionnaire. For example, one question asked about salt added at the table but did not specify what kind of salt was used. If an individual does not consume the same foods all the time, then they may forget about specific food items such as seasonal foods like fruits and vegetables. Validation studies have shown that correlations are limited by an error in both diet records and food frequency questionnaires [38]. Diet records may have a degree of error similar to food frequency questionnaires [38]. This is the case because when keeping diet records, the portion sizes of some foods may be estimated by dimensions or through household measurements instead of by weight. As a result, the nutrient content may be inaccurate by 20% on average [38]. The reproducibility of food frequency questionnaires has correlations ranging from 0.39–0.88 [38]. In the present study, the HFFQ was not an adequate indicator of iodine intake. 60% of participants consumed 0 μg of iodine per day while 70% of participants consumed below the 150 μg of iodine per day for the RDA. It is difficult to believe that such a large number of participants consumed no iodine in their diet since iodized salt has been distributed nationally since 1924. Based on data from this study, the HFFQ was not an adequate indicator of iodine intake as it is a self-reported history questionnaire, with more chance of reporting bias, and recall bias.
Daily urinary iodine excretion can be a reflection of iodine intake because only a small amount of iodine is excreted through the feces with the remainder excreted in the urine [39]. Therefore, analyzing an individual’s urine output may provide a better estimate of the amount of iodine that an individual consumes each day. The 24-hour urinary iodide is the most widely utilized measure of iodine status, but can be inconvenient for the subject and may be hard to collect accurately [39]. The single spot urinary samples are preferred in population studies [40]. Since there is considerable variability in daily iodine consumption, and because both the intake of iodine and fluid can affect the iodine concentration in urine, spot urine samples are unreliable for assessing iodine deficiency [40]. Urinary iodide concentration expressed as a function of urinary creatinine, this can help to correct the influence of fluid intake [40]. Future studies can focus on assessment methods to evaluate dietary iodine intake in conjunction with urinary iodine excretion to provide a better understanding of iodine status of individuals. Selenium is necessary for the biosynthesis and function of a minimal amount of selenocysteine-containing selenoproteins involved in thyroid hormone metabolism and the function of the thyroid gland [41]. By also analyzing selenium, the researcher can determine what effects this element has on human metabolism in regards to body mass index (BMI), BMR, weight, and body composition. Future studies should consider assessing selenium with iodine to determine what effect a selenium deficiency plays in the production of thyroid hormones. Studies could assess for differences between iodine intake and ethnicity, as dietary habits, and micronutrient intakes are significantly impacted by ethnic status.
Another limitation was that not all participants in this study had their T3 and T4 levels documented. This study did not demonstrate any significant relationships between dietary iodine intake and body weight, percent lean body mass, percent body fat, waist-to-hip ratio, TBBMD, and circulating concentrations of T3, T4, and TSH in Caucasian females between the ages of 18 and 60 years. However, it is important to note is that the participants who had the highest iodine intake (Group 3, > 66th percentile of the RDA) had the highest mean percent lean body mass and lowest mean percent body fat. In Group 3, the highest mean percent lean body mass was 62.6%, and the lowest mean percent body fat was 37.4% (See Tables 2, 3).
The lack of assessments for thyroid volume could also be considered another limitation of this study. Thyroid volume can be affected by daily iodine intake, geographical region and food intake habit [42]. In several other studies, researchers compared the effect of thyroid volume on body weight, body fat percentage, body fat weight, waist circumference, TSH, T4, and T3. Thyroid volume was typically measured using thyroid ultrasonography. These studies have suggested that an individual’s thyroid volume is significantly associated with body weight [30, 43–46]. Whereas, one study indicated that only lean body mass was related to thyroid volume [25]. Thyroid volume has a relationship to BMI, waist-to-hip ratio, and fat mass in areas with an adequate iodine intake as well as mild or moderate iodine-deficient areas [43–46]. There is a significant association between thyroid volume and body weight, body fat percentage, body fat weight, waist circumference, and BMI [30]. A study by Wesche and Wiersinga, 2001 looked at the effects of a 6-month intensive physical training program on thyroid volume [47]. Intensive physical training caused changes in thyroid volume related to body composition. The group of freshman rowers had reductions in thyroid volume, body weight, body mass index, fat weight, and lean body mass [47]. The control group included senior rowers who had participated in a training program for more than two years. The control group had no alterations in thyroid volume or body composition throughout the 6-month surveillance period [47].
Conclusions
In conclusion, there was not a significant association between dietary iodine intake and body weight, percent lean body mass, percent body fat, waist-to-hip ratio, TBBMD, or circulating concentrations of T3, T4, and TSH using the data from the Pioneer Project. The HFFQ did not provide accurate measurements of iodine intake for analysis in the Pioneer Project. Therefore, a more accurate indicator of iodine status needs to be utilized in future studies to analyze the effect of iodine consumption on an individual’s body weight, BMR, and body composition including percent lean body mass and percent body fat. Correlation of BMI and iodine intake was not significant but does warrant further investigation.
Acknowledgments: Thanks is extended to all those women who participated in the Pioneer Project and the State of Texas Higher Education Coordinating Board for funding the project.
References
Case Report
A meanwhile 81-year old female patient was recurrently admitted to hospital because of dyspnoea and bilateral edema.
13 years ago (in 2005) the patient had coronary bypass surgery with normally contracting left ventricle with an ejection fraction of 64%.
She had severe hypothyroidism and was on levothyroxine replacement therapy.
In 2014 the patient developed atrioventricular node tachycardia and was treated with beta blocking agents and amiodarone. In the same year she developed high-grade atrioventricular block and DDD pacemaker was implanted.
At the end of 2014 echocardiography revealed asynchronous septal left ventricular hyokinesia due to continuous right ventricular stimulation with an ejection fraction of 58%.
In the next hospital stay in february 2015 the patient presented with massive dyspnoea and massive bilateral edema. Echocardiography revealed reduction of left ventricular function with an ejection fraction of 40%, and apical ballooning. Because of the echocardiographic finding coronary angiography was initiated and showed normal bypass morphology without any stenoses. She was still on levothyroxine replacement therapy at a dosage of 125 ug oral medication.
In the next years she was recurrently hospitalised with biventricular heart failure and echocardiographic reduction of left ventricular function, and continuous apical ballooning.
In conclusion, in the first view DDD pacemaker implantation seemed to contribute to reduction of echocardiographic left ventricular function but is limited to asynchronous septal hyokinesia. In a second view chronic takotsubo cardiomyopathy despite well functioning bypass grafting caused by severe hypothyroidism on current levothyroxine replacement therapy was debated.
Takotsubo cardiomyopathy caused by pheochromocytome [1] or hyperthyroidism [2] is well known due to cathecholamine increase.
Severe hypothyroidism seems to be a reason for takotsubo cardiomyopathy [3, 4] or on levothyroxine replacement therapy as well [5]. Due to ongoing hypothyroidism takotsubo cardiomyopathy is in a chronic state and left ventricular recovery is not yet reported during a long period of time from 2015 until 2018.
The theory is that reversible or continuous left ventricular dysfunction is caused by intense, neuroadrenergic myocardial stimulation, as it appears in severe hypothyroidism although on levothyroxine replacement therapy. This phenomenon appears to be the main trigger despite multiple described mechanisms.
References
Abstract
Midkine (MK), a heparin-binding cytokine, is considered to be involved in disease mechanisms of several autoimmune (e.g rheumatoid arthritis, systemic lupus erythematosus and multiple sclerosis) and autoinflammatory (e.g Crohn’s disease and ulcerative colitis) diseases. Behçet’s syndrome (BS) is accepted as a mixed pattern disease with evidence of both acquired autoimmune component and autoinflammatory components. Therefore, our hypothesis is that MK might be overexpressed in BS patients and if so, it might serve as a disease marker in BS. Furthermore, inhibition of the hypothesized MK overexpression using MK inhibitors such as MK-aptamer might contribute to the management of BS.
Introduction
Behçet’s syndrome (BS) known also as Behçet‘s disease (BD), was first described by Prof. Dr. Hulusi Behçet, a Turkish dermatologist in 1937 [1]. The classic trisymptom complex of this syndrome is recurrent aphthous stomatitis, genital aphthous ulcers and hypopyon-uveitis [1]. It is a chronic, relapsing-remitting inflammatory vascular disease with no pathognomonic tests. In addition to oral, genital and eye involvement multiple organ systems, including skin, gastrointestinal, vascular and neurological systems are affected [2]. The prevalence of BS is significantly higher in the Mediterranean, the Far East and Central Asia (therefore called “Silk Road Disease”) compared to Europe and the United States [3-6]. Although nearly 80 years have passed since the first description of BS, the etiology and pathogenesis has not yet fully clarified. Several mechanisms, including neutrophil hyperfunction [7] and T cell hypersensitivity to several bacterial antigens may play a central role in the pathogenesis of BS [8].
Midkine (MK) is a growth factor (heparin-binding cytokine) that promotes a number of functions in target cells such as migration, proliferation, survival, growth, reproduction and repair, angiogenesis and gene expression [9]. MK is involved in the onset and/or progression of many cancers and inflammatory diseases. Therefore, it has been suggested that both MK and MK inhibitors are expected to contribute in the treatment of various diseases [10]. In addition, MK may serve as an indicator and marker in certain disorders such as rheumatoid arthritis [11].
Our proposal
Our proposal is that MK may play a role in the pathogenesis of BS. Furthermore, if MK is acting as a proinflammatory cytokine, it could be assumed that MK inhibitors may contribute to the treatment of BS.
Evaluation of the proposal
BS is a chronic inflammatory disorder caused by vasculitis that results in damage to both arteries and veins. Although the pathogenesis is not yet known, a Th1-type inflammatory reaction is seen like in some other primary vasculitides [12]. There are no biochemical tests that are specific for the diagnosis of BS, therefore the syndrome is diagnosed clinically. Some laboratory tests and imaging is done to rule out other conditions that may mimic BS. HLA B51 is used as a genetic marker for the diagnosis of BS, however it is also seen in up to 20% of the general population. The diagnosis of BS depends mostly on a good physical examination, a detailed history and presence of the typical symptoms and signs.
Recent studies showed a significant association between MK and autoimmune and autoinflammatory diseases. One of these studies showed that the plasma levels of MK and the other heparin-binding growth factor pleiotrophin were significantly higher in systemic lupus erythematosus (SLE), rheumatoid arthritis (RA) and Sjögren’s syndrome (SS) patients compared with healthy controls (HCs) [13]. Furthermore, it has been demonstrated that elevated plasma midkine and pleiotrophin levels were associated with rash, anti-SSA and IL-17 in SLE patients [13].
MK participates in the migration of inflammatory leukocytes and osteoclast differentiation in RA and may be a key molecule in the pathogenesis of the disease [14]. Shindo et al. have shown that RA patients had a significantly higher serum MK level than HCs. In addition, the serum levels of MK tended to be decreased by anti-TNF therapy. They suggested that the serum MK level could be a marker of disease activity in RA and an indicator of a poor prognosis and that MK may have a role in the pathogenesis of RA via induction of inflammatory mediators [11].
It has been shown that normal synovial fluid and noninflammatory synovial tissue did not contain detectable MK, whereas in the inflammatory synovitis of RA and osteoarthritis (OA), MK was detected in synovial fluid, synoviocytes, and endothelial cells of new blood vessels [15]. Therefore, MK showed inflammation-associated expression in patients with RA and OA. Furthermore, MK has been demonstrated to promote chemotaxis of neutrophils and promote fibrinolysis in these cases [15].
Another study on RA showed that a chimeric-type siRNA for MK strongly inhibited postsurgical adhesion and moderately attenuated the antibody- induced arthritis in mice. Therefore, the authors suggested that MK may be an important molecular target in the treatment or prophylaxis of RA [16].
MK levels were found to be high in multiple sclerosis (MS), which is also an autoimmune disease characterized by inflammatory demyelination and neuronal damage in the central nervous system (CNS) [17]. In the review of “midkine and multiple sclerosis”, Takeuchi H. suggests that MK negatively regulates autoimmune tolerance by suppressing the development of DCreg and the expansion of Treg cells. Pharmacological inhibition of MK by an RNA aptamer significantly increases DCreg and Treg and ameliorates experimental autoimmune encephalomyelitis (EAE) without any detectable adverse effects. Thus, blockade of MK signaling may provide an effective therapeutic strategy against autoimmune diseases including MS [18].
Besides autoimmune diseases, MK is implicated also in inflammatory diseases. It has been reported that circulating MK was elevated both in quiescent and active Crohn’s disease (CD) and that this elevation of MK corresponds well with disease activity and reflects the severity of inflammatory response and exacerbation of pathological angiogenesis. Furthermore, MK as a biomarker was found slightly better than that of CRP in CD [19]. Additionally, high expression of MK has been found in bowel inflammation in ulcerative colitis (UC) [20]. Interestingly inflammatory bowel disease is a major manifestation of BS. In fact, it can be very difficult to tell a BS patient from a patient with Crohn’s disease unless extraintestinal lesions are also present in that patient [21].
In conclusion, MK plays important roles as a disease marker and as an indicator of prognosis in certain autoimmune and autoinflammatory diseases (Table 1). In addition, blockade of MK signaling may provide an effective therapeutic strategy against such disorders. We suggest that knowing the role of MK in the pathogenesis and treatment of BS, may offer new insides to the difficult management of this syndrome.
Table 1. High MK serum levels in autoinflammatory and autoimmune diseases.
|
Autoimmune diseases |
Autoinflammatory diseases |
|
Rheumatoid arthritis |
Chron’s disease |
|
Systemic lupus erythematosus |
Ulcerative colitis |
|
Sjögren’s syndrome |
|
|
Multiple sclerosis |
|
|
Behçet’s syndrome? |
|
Funding: None.
Conflict of interest statement: We declare that there are no conflicts of interest.
Acknowledgement: We would like to thank to Professor Hasan Yazici from the Department of Rheumatology, Academic Hospital, Istanbul, Turkey for valuable guidance, suggestions, and comments.
References
Abstract
Cooled and frozen equine semen shows a reduction in fertility, compared to fresh one. In this study, cooled and frozen-thawed equine spermatozoa were compared and analyzed for plasma and acrosomal membrane integrity and mitochondrial membrane potential, combining three fluorescent probes: H258, CTC, JC-1 with a micro-spectrofluorimetric analysis (Quanticell equipped with a digital system for color images acquisition). Total and progressive motility, average path velocity (VAP), straight-line velocity (VSL), curvilinear velocity (VCL) and amplitude of lateral head displacement (ALH) were measured by CASA system.
We employed an innovative approach to study the reproductive potential of the male gamete subjected to cooling protocols for semen storage. In fact, we evaluated the modifications of equine sperm physiology induced by temperature during cooling and freezing treatments looking at the modifications of different functional sperm characteristics by a simultaneous analysis of different sperm markers with the aim of selecting those that are the most efficient signs for sperm fertility. We identified the mitochondrial membrane potential because it provides useful information on equine sperm quality strictly correlated with fertility. We consider it a useful marker for sperm fertility to be used as a guide to select high-quality semen to be employed in equine breeding farmers.
Keywords
Stallion; Sperm; Cooled semen; frozen semen; Sub-lethal damages
Introduction
Nowadays reproductive technologies are more attractive for the equine industry [1] because of the increasing use of both refrigerated and frozen sexed spermatozoa. Despite the high number of published papers, further knowledge on stallion sperm cryobiology still requires investigations. In the equine species, sperm quality is affected by inter-individual variability, because stallion selection is often based on performance and phenotype more than on sperm quality [2].
Short- and long-term sperm storage is a pre-requisite for the success of artificial insemination. Cooled-stored stallion semen is usually kept at a temperature of about 4-6°C for about 24h. This range of temperature has been evaluated to be efficacious for maintaining motility and consequently fertility near to fresh semen [3] Long-term storage is useful to preserve gametes from high merit animals, to check the health status of semen samples and to share superior genetics among international distributors [4]. Survival of the sperm cell to refrigeration and cryopreservation depends on its shape and size, on its hydration level and on the permeability of its cell membrane. Refrigerated and frozen-thawed semen, used in different artificial insemination programs, show some limits regards viability compared to fresh semen, due to changes in temperature. Temperature variations during a rapid cooling or during cryopreservation of spermatozoa are in fact known to exert deleterious effects on the survival of spermatozoa, resulting in lower conception rates following artificial insemination. Fertility decrease is the result of the reduction of the percentage of motile sperm, or the consequence of morphological abnormalities induced by cryopreservation, as well as of damages of sperm cell plasma membrane [5], that are responsible of the induction of cell death and sub-lethal damages in the surviving population of spermatozoa [6]. Semen evaluation represents a useful tool to investigate male infertility [7] and in many circumstances, a prospective test is desirable to identify an infertile stallion before it embarks on its breeding career [8]. In horse breeding, fertility trials associated to artificial insemination techniques are hampered by the low number of fertilized mares and by the high difficulties in management and insemination [9]. Given the limitations of the standard examination procedures in predicting horse fertility or even in identifying all infertile stallions, many approaches were employed with the hope of defining a relatively straightforward and inexpensive test closely correlated with fertility [10]. The limitation of these approaches is that most tests evaluate only a limited number of those characteristics necessary for the assessment of sperm fertility rate. For this reason, the combined use of different tests could be more promising to achieve a reliable evaluation of the functional characteristics related to sperm quality [8, 11, 12].
The integrity of sperm membrane is crucial for the maintenance of sperm fertilizing capacity [7] in fact, it is a fundamental requisite for sperm viability and for the success of fertilization. Viable spermatozoa are defined as cells that possess an intact plasma membrane [9]. Several viability assays evaluate the integrity of different plasma membrane compartments by a microscopic or cytofluorimetric approach after cell staining [9, 13]. These techniques, based on the use of viable (SYBR-14) and non-viable propidium iodide (PI) and Hoechst 33258 (H258) dyes allow detecting sperm viability [14].
Acrosome integrity is essential for oocyte fertilization [7, 15], different fluorescent staining such as Pisum sativum agglutinin (PSA) and chlortetracycline (CTC) perform its evaluation. Besides plasma membrane and acrosome integrity, the mitochondrial status plays an important role in determining sperm cell fertility competence because of its relationship with the energetic status of the cell and with motility [9]. The functionality of mitochondria is often studied by rhodamine 123 and MitoTracker fluorochromes but these techniques do not possess the ability to differentiate mitochondria with low or high membrane potential [16]. The lipophilic cationic compound, 5,5’,6,6’-tetrachloro-1,1’,3,3’-tetraethylbenzimidazolyl carbocyanine iodide (JC-1) allows for a distinction between spermatozoa with low and high functional mitochondria since this molecule possesses the ability to form aggregates or monomers, each endowed with a different emission spectrum. JC-1 is maintained as a monomer in mitochondria with low membrane potential, emitting green fluorescence, whereas it aggregates in mitochondria with high membrane potential, emitting orange fluorescence. Several authors still employ the sperm chromatin structure assay test (SCSA), based on the metachromatic properties of the acridine orange, to evaluate breaks in the DNA that may have escaped repair during the last steps of spermatogenesis.
Sperm motility is a very important parameter for sperm quality evaluation and it can be assessed using Computer Assisted Sperm Analysis (CASA) system that captures and digitized successive microscopic images [9, 17].
Fluorescent probe association is able to perform a simultaneous evaluation of several sperm cell compartments [18]. It is intuitive that the higher the number of sperm characteristics, the better is the in vitro fertility prognosis [19].
The aim of this study is to evaluate damages, induced by temperature during refrigeration and cryopreservation, on the plasma, acrosomal and mitochondrial membrane of equine sperm cells and to correlate them in order to select the best characteristics useful for a reliable prediction of the fertilizing competence of each semen sample employed in equine breeding.
Materials and methods
Ethical statement
The experiment was approved by the Ethical and Scientific Committee of “Alma Mater Studiorum”, University of Bologna”
Media and Reagents
A modified Tyrode’s medium without bicarbonate was used for incubating sperm in ‘‘non-capacitating’’ conditions. The Tyrode’s medium contained 111 mM NaCl, 3.1 mM KCl, 2 mM CaCl2, 0.4 mM MgSO4, 0.3 mM KH2PO4, 50 mg kanamycin/ml, 20 mM HEPES, 5 mM glucose, 21.7 mM sodium lactate, 1 mM sodium pyruvate. Stock solutions minus CaCl2 and pyruvate were prepared, filtered through a 0.2 mm membrane and stored at +4°C [20]. The remaining two ingredients were added 20-24 h before the experiment and the medium maintained under 5% CO2 in air at +37°C until the beginning of the experiment; pH and osmolality of the medium were maintained at 7.4 and 300 mOsm/kg, respectively.
All chemicals were purchased from Sigma-Aldrich (Milano, Italy) unless otherwise stated.
Semen collection and processing
Semen (eight ejaculates per stallion) was obtained from two individually housed stallions (Standarbred, 6 and 7 years old), routinely used in the artificial insemination programs at AUB-National Institute for Artificial Insemination, located in Cadriano (Bologna, Italy). The management of the stallions and the collection of semen samples were performed in accordance with health and welfare institutional and European regulations.
Ejaculates were collected regularly (three times/week) during the breeding season of 2011, using a Missouri artificial vagina with an in-line filter (Nasco, Fort Atkinson, WI, USA). Gel-free semen volume was measured with a graduated cylinder, semen concentration was determined using a Bürker chamber (Saaringia, Germany) and motion characteristics were estimated with CASA system. Subsequently, the filtered semen was diluted with Kenney’s extender [21] supplemented with a Tyrode medium, to a final concentration of about 20-25 × 106 spermatozoa ⁄ml. One ml aliquot of each fresh semen sample was evaluated by CASA system. After a 10 min incubation period at +37°C, 2 µl of the suspension was loaded onto a pre-warmed (37°C) Leja 20 µm four chamber slide (IMV Technologies, Piacenza, Italy) and seven fields per chamber were analyzed with CASA (HTM IVOS Version 12; IMV Technologies) using the standard setup for equine. The system parameter settings were: 45 frames acquired at 60 frames ⁄s; minimum contrast 70, minimum cell size 4 pixels; lower VAP cut-off 20 µm ⁄s, VAP cut-off for progressive cells 50 µm ⁄s and straightness 75%. Total motility, progressive motility, average path velocity and the number of rapid spermatozoa were recorded [22]. Those ejaculates containing >60% motile spermatozoa after dilution were used for subsequent assessment. Sixteen ejaculates were analyzed. Subsequently, each sample was fractionated in two aliquots: one was chilled at 4°C, the other one was frozen in 0.5 ml straw. The cooled-semen was placed in commercial styrofoam box and immediately shipped to the laboratory of Department of Emergency and Organs Transplantation (DETO) at the University of Bari, for immediate evaluation, while straws of frozen semen were stored in liquid nitrogen for successive evaluations.
Evaluation of plasma, acrosomal membrane and mitochondrial function
The fluorescent probes: H258 and CTC allow to evaluate the integrity of the plasmatic and mitochondrial membranes respectively. The first dye enters the cell and stains the nucleus when plasma membrane is damaged while the second enters the cell when the acrosomal membrane is damaged. Mitochondrial status was assessed by the lipophilic cationic JC-1 that differentiates mitochondria with low or high membrane potential by colors.
A stock solution of H258 was prepared to dissolve 10 mg in 100 µl distilled water. It was wrapped in foil and kept at 4°C. For use, 1 µl of the stock solution was diluted with 10 ml protein-free medium (PBS) and kept at +4°C. The fixative was made by mixing 1: 1 (v/v) 25% glutaraldehyde and 1 M Tris, pH 7.4 [23].
The CTC solution was made of 0.75 mM CTC and 5 mM L-cysteine in chilled CTC buffer containing 20 mM Tris and 130 mM NaCl, pH 7.8 [24].
The stock solution of 1.53 mM JC-1 in DMSO was prepared prior to use [16]. Different fluorescent probes with characteristics of excitation/emission were used simultaneously.
For each sample, aliquots of refrigerated and cryopreserved semen, pre-warmed at 37°C and to a final concentration of about 20×106 spermatozoa/ml, were suspended in 1 ml of Tyrode’s medium and JC-1 solution (2 µM final concentration) was added. Cells were incubated for 15 min at 37°C, then washed in PBS and incubated again for 2 min with 2 µl H258 solution. Unbound dye was removed centrifuging (900xg for 5 min) the stained suspension on 500 µl of 2% (w/v) polyvinylpyrrolidone in PBS.
The supernatant was discarded and the pellet re-suspended in 45 µl Tyrode’s medium. To each sample, 45 µl of the CTC solution and 4 ml of fixative solution were added and mixed. Few droplets of this suspension containing fixed and stained spermatozoa were placed between two coverslips and visualized by a Quanticell micro spectrofluorimetric system (VisiTech International, Sunderland, UK), consisting of a video digital imaging apparatus for the acquisition of color images (Nikon Instruments).
Plasma membrane integrity was evaluated using a 346-460 nm wavelength excitation/emission filters. Acrosomal membrane integrity was assessed by CTC at the 392-536 nm wavelength (excitation/emission). In mitochondria with high membrane potential, JC-1 forms multimeric aggregates and when excited at 480 nm, it emits light at 590 nm (high orange), on the contrary within mitochondria with low membrane potential, JC-1 forms monomers emitting at 525-530 nm (green) when excited at 488 nm wavelength.
For each ejaculate, about two hundred spermatozoa were analyzed and classified according to their florescence emission.
Sperm motility
Sperm kinetic was evaluated using a Sperm Analyzer (CASA-system; HTM-IVOS, Version 12.3, Hamilton-Thorne, Biosciences, MA, USA). Each ejaculate was analyzed for the cooled and frozen aliquots. Briefly, a 2 µl drop was recovered and placed in a Leja 4 analysis chamber, 20 micron depth (Leja Products B.V., The Netherlands). The analysis was performed at 37°C. The following motility characteristics were measured for each sample: percentage of motile spermatozoa; percentage of spermatozoa with a progressive motility; average path velocity (VAP): the velocity of the smoothed cell path (µm/s); straight line velocity (VSL): the average velocity measured in a straight line from the beginning to the end of the track (µm/s); curvilinear velocity (VCL): the average velocity measured over the actual point to point track followed by the cell (µm/s); amplitude of lateral head displacement (ALH); beat cross frequency (BCF); linearity (LIN); straightness (STR) and the percentage of rapid, medium, slow and static spermatozoa.
It has been necessary to set up the software as previously indicated, to clearly identify all spermatozoa, moreover to be sure that all sperm trajectories were correctly analyzed by CASA, the playback mode was also activated. Seven microscopic fields, selected randomly, were scanned.
Statistical analysis
The analysis of variance (ANOVA) was used to evaluate all recorded parameters. Differences were considered significant when P< 0.05. Linear regression and correlations among variables were also calculated.
Results
Evaluation of plasma, acrosomal membrane and mitochondrial function
At first, in each sample (cooled and frozen), the integrity of both the plasmatic and acrosomal membrane were evaluated recording the percentage of male gametes with intact or damaged membrane, moreover the percentage of spermatozoa with high or low mitochondrial potential was also recorded (Figure 1).
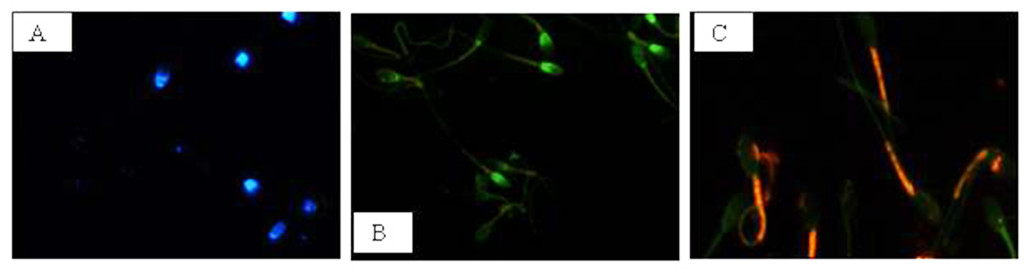
Figure 1. Photomicrography of equine spermatozoa. A Spermatozoa stained with H258 (Hoechst 33258), B Spermatozoa stained with CTC (chlortetracycline), C Spermatozoa stained with JC-1 (5,5’,6,6’-tetrachloro-1,1’,3,3’ tetraethylbenzimidazolyl carbocyanine iodide).
NIS-Elements F 3.0 (Nikon Instrument) software was employed to evaluate simultaneously all fluorescent probes. The results were used to classify spermatozoa in eight classes (Table 1), according to the morpho-functional state of plasmatic and acrosomal membranes and to mitochondrial function (Figure 2).
Table 1. Classification of equine sperm cells according to fluorescence emitted by H258, CTC and JC-1 probes.
|
Sperm Cell Category |
aH258 |
bCTC |
cJC-1 |
|
Intact plasma membrane, intact acrosome and high mitochondrial potential Intact plasma membrane, intact acrosome and low mitochondrial potential Intact plasma membrane, damage acrosome and high mitochondrial potential Intact plasma membrane, damage acrosome and low mitochondrial potential Damage plasma membrane, intact acrosome and high mitochondrial potential Damage plasma membrane, intact acrosome and low mitochondrial potential Damage plasma membrane, damage acrosome and high mitochondrial potential Damage plasma membrane, damage acrosome and low mitochondrial potential |
– – – – + + + + |
– – + + – – + + |
+ – + – + – + – |
aH258 positive (+) = blue stained nucleus. bCTC positive (+) = green acrosome region. cJC-1 positive (+) = red in mid-piece region; negative (-) = green in mid-piece region.
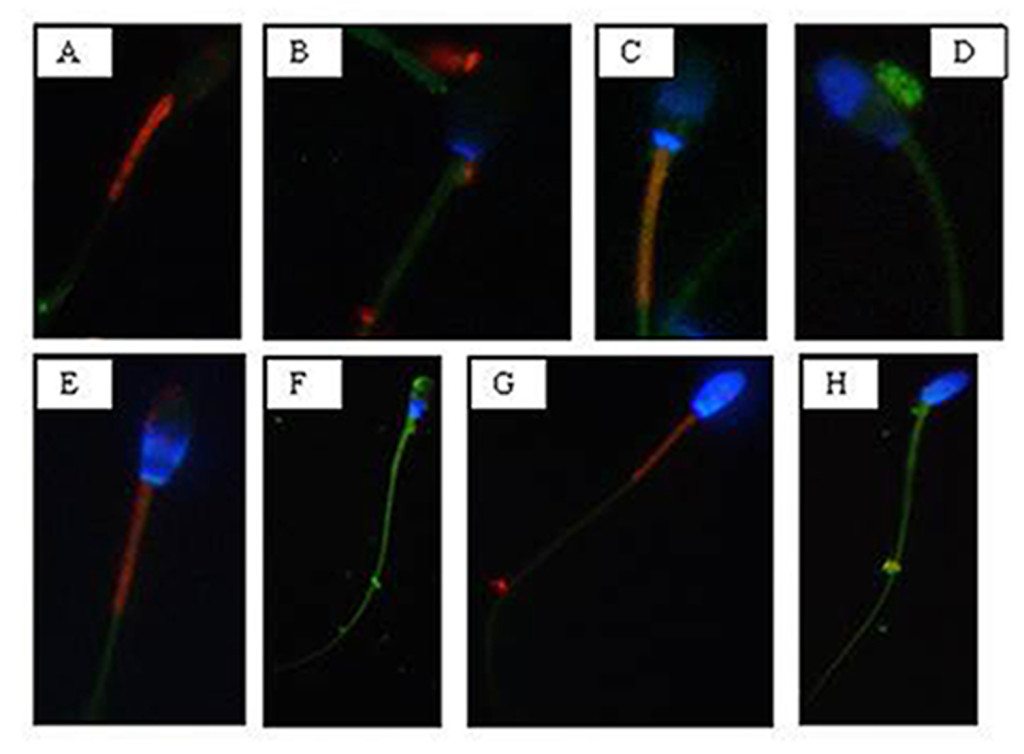
Figure 2. Photomicrography of equine spermatozoa stained with H258,CTC and JC-1. A) Intact plasma membrane, intact acrosome and high mitochondrial potential, B) Intact plasma membrane, intact acrosome and low mitochondrial potential, C) Intact plasma membrane, damaged acrosome and high mitochondrial potential, D) Intact plasma membrane, damaged acrosome and low mitochondrial potential, E) Damaged plasma membrane, intact acrosome and high mitochondrial potential, F) Damaged plasma membrane, intact acrosome and low mitochondrial potential, G) Damaged plasma membrane, damaged acrosome and high mitochondrial potential, H) Damaged plasma membrane, damaged acrosome and
low mitochondrial potential.
The analysis revealed that both cooled and frozen-thawed samples had similar amount of spermatozoa with intact or damaged plasma membrane, also the percentage of cells with intact and damaged acrosomal membrane was not statistically different; on the contrary a dramatic decrease in the percentage of spermatozoa with high mitochondrial potential was observed in frozen samples (Table 2).
Table 2. Recovery rate: cooled versus frozen semen
|
Sperm parameters |
cooled semen |
Frozen semen |
|
Intact plasma membrane (%) Damage plasma membrane (%) |
64 36 |
62 38 |
|
Intact acrosome (%) Damage acrosome (%) |
55 45 |
50 50 |
|
High mitochondrial potential (%) Low mitochondrial potential (%) |
47 53 |
24 76 |
Recovery rate (%) of spermatozoa showing different morphology of the acrosome and plasma membranes and mitochondrial potential in cooled and frozen semen.
Compared to cooled semen, in cryopreserved samples we recorded a reduction in the number of spermatozoa with intact plasma membrane, intact acrosome and high mitochondrial potential (6%); spermatozoa with intact plasma membrane, damaged acrosome and high mitochondrial potential were also lower (16%), as well as those with damaged plasma membrane, intact acrosome and high mitochondrial potential (1%). Moreover, also the number of spermatozoa with the damaged plasma membrane, intact acrosome and low mitochondrial potential were slightly reduced in frozen samples. While differences described above were not statistically significant, the reduction, caused by cryopreservation, in the class of intact plasma membrane, damaged acrosome and high mitochondrial potential spermatozoa was statistically significant (P< 0.001) as well as in the class of damaged plasma membrane, intact acrosome and low mitochondrial potential spermatozoa (P< 0.05) (Table 3).
Table 3. Cooled versus frozen semen.
|
Sperm Cell Category |
Cooled semen |
Frozen semen |
|
Intact plasma membrane, intact acrosome and high mitochondrial potential |
21% |
15% |
|
Intact plasma membrane, intact acrosome and low mitochondrial potential |
9% |
18% |
|
Intact plasma membrane, damage acrosome and high mitochondrial potential |
21% |
5% |
|
Intact plasma membrane, damage acrosome and low mitochondrial potential |
13% |
26% |
|
Damage plasma membrane, intact acrosome and high mitochondrial potential |
3% |
2% |
|
Damage plasma membrane, intact acrosome and low mitochondrial potential |
22% |
14% |
|
Damage plasma membrane, damage acrosome and high mitochondrial potential |
2% |
2% |
|
Damage plasma membrane, damage acrosome and low mitochondrial potential |
9% |
18% |
Recovery rate of spermatozoa (%) for each of the eight morphological cell classes.
Cryopreservation led to an increase of spermatozoa with intact plasma membrane, intact acrosome and low mitochondrial potential spermatozoa (9%), of intact plasma membrane, damaged acrosome and low mitochondrial potential spermatozoa (13%), of damaged plasma membrane, damaged acrosome and low mitochondrial potential spermatozoa (9%), compared to refrigeration. These increases due to cryopreservation were statistically significant for intact plasma membrane, intact acrosome and low mitochondrial potential spermatozoa (P<0.05), for intact plasma membrane, damaged acrosome and low mitochondrial potential spermatozoa (P< 0.05) and for damaged plasma membrane, damaged acrosome and low mitochondrial potential spermatozoa (P< 0.05).
Sperm motility
Motility analysis was also conducted on each ejaculate of fresh semen; the recorded mean values of total and progressive motility were 79.06% ± 3.8 and 63.87% ± 2.16, respectively.
Sperm motility values of cooled and frozen-thawed semen are shown in Table 4. Semen cryopreservation affected sperm motility. Refrigerated semen displayed higher total and progressive motility than frozen-thawed semen (P< 0.001). The estimated reduction in the percentage of total and progressive motile spermatozoa related to cryopreservation was 20.33% and 19.57%, respectively.
Table 4. Motility parameters: cooled versus frozen semen.
|
Motility parameters |
cooled semen |
frozen semen |
|
Total motility (%) Progressive motility (%) VAP (mm/s) VSL (mm/s) VCL (mm/s) ALH (mm) BCF (Hz) STR (%) LIN (%) Rapid spermatozoa (%) Medium spermatozoa (%) Slow spermatozoa (%) Static spermatozoa (%) |
74,42 ± 3,69 ** 59,37 ± 1,76 ** 108,71 ± 17,10 ** 58,31 ± 13,04 224,44 ± 30,70 ** 8,24 ± 0,94 ** 34,61 ± 5,18 53,75 ± 10,66 26,86 ± 6,26 45,61 ± 11,05 ** 7,36 ± 3,43 7,16 ± 3,32 39,88 ± 11,69 |
54,09 ± 3,43 39,8 ± 3,09 73,48 ± 15,37 57,8 ± 12,87 149,83 ± 21,24 6,21 ± 0,65 39,28 ± 3,24 71,91 ± 5,71 38,96 ± 4,41 16,79 ± 10,78 8,41 ± 5,95 13,99 ± 7,47 * 61,22 ± 20,84 * |
Motility parameters of equine cooled or frozen sperm samples: VAP (average path velocity); VSL (straight line velocity); VCL (curvilinear velocity); ALH (amplitude of lateral head displacement); BCF (beat cross frequency); STR (straightness); LIN (linearity). * P < 0.05, ** P < 0.001.
Evaluated VAP and VCL were lower in frozen-thawed semen than in refrigerated one (P< 0.001).
The VSL of refrigerated spermatozoa did not differ significantly from that of cryopreserved sperm.
The ALH was higher in cooled than in frozen-thawed semen (P<0.001). The BCF of cooled spermatozoa did not differ significantly from that of frozen sperm cells.
Cooled semen displayed a higher percentage of rapid spermatozoa (P<0.001) while a 28.82% reduction was induced by cryopreservation. The percentage of medium spermatozoa was similar in cooled and frozen semen. Slow and static spermatozoa were higher in frozen-thawed than in cooled semen (P<0.05) the percentage increase, probably due to the cryopreservation process, was 6.83% and 21.34%, respectively.
Correlations
Significant correlations were observed between mitochondrial energy level and different sperm membrane conditions. In cooled semen a high correlation between high mitochondrial potential and intact plasma membrane (r=0.91), high mitochondrial potential and intact acrosome (r=0.93), low mitochondrial potential and damage acrosome (r=0.90), were found. In frozen semen, a high correlation between low mitochondrial potential and damaged plasma membrane (r=0.87), low mitochondrial potential and damaged acrosome (r=0.92) were found. On the contrary, no correlations between mitochondrial membrane potential and different motility characteristics were evidenced.
Discussion
Severe changes in temperature are a common feature of semen preservation protocols but are not a biological phenomenon to which the sperm cell is adapted [25]. Temperature transitions associated with semen fast chilling or freezing are in fact well known for their production of deleterious effects on sperm survival and consequently, lower conception rates following artificial insemination [5].
The reduction in fertilizing ability has typically been attributed to a reduced rate of sperm motility and to the induction of morphological abnormalities [5]. Damages to the plasma membrane, to the acrosomal membrane and to the mitochondrial function of spermatozoa undergoing cooling and/or freezing depend on changes of temperatures and osmolarity, which cause morphological alterations in the organization and composition of proteins and lipids of the sperm surface [26].
Sperm quality related to functional characteristics has been investigated by the association of different fluorescent probes in ram [27], bull [28] and stallion [13, 16, 18].
In this study we validated the association of three fluorescent probes H258, CTC and JC-1 to evaluate the state of plasma and acrosomal membranes, as well as the mitochondrial function both in cooled and frozen equine sperm, using the inverted fluorescent microscopy highlighting the prominent role of the mitochondrion as marker for equine sperm quality.
We found both in cooled and frozen equine semen samples a higher number of spermatozoa with intact plasma membranes compared to those with destroyed membranes, this result is in line with the observations reported by Vasconcelos et al., [29] and by De Leeuw et al., [30].
It is reasonable to attribute the poor fertility of frozen semen to ultrastructural modifications of the cell membranes and to phase transitions occurring during cooling and rewarming. It seems reasonable that the reorganization of sperm membrane bilayer alters the interactions among lipids and between lipids and proteins required for normal membrane functions, determining a re-modelling of the membrane components [31, 32] and the decreased amount of polyunsaturated fatty acids and cholesterol [33]; [34]. Plasma membrane disruption due to cooling or freezing determines the loss of cations and enzymes from the sperm cells, providing some explanation for the reduction in sperm motility and metabolic activity observed in cold-shock spermatozoa [35]. Cold shock also destroys the selective permeability of sperm membranes to calcium, thus leading to its excessive intracellular accumulation, and consequently, to a reduction in motility and cell necrosis. These processes result in an advanced stage of sperm maturation characterized by capacitation, hyperactivation and acrosome reaction [35].
For what concerns the acrosome membrane, in the present study cooled spermatozoa displaying their integrity, were more numerous than those with a damaged acrosome membrane. As to mitochondrial membrane potential, it is a sensitive indicator of the functional status of the organelle; in the present study, cooled spermatozoa with intact plasma membrane showed a high mitochondrial potential. Whereas a high percentage of spermatozoa with an intact plasma membrane and low mitochondrial potential was observed among cryopreserved ones, suggesting that cryopreservation may result in a significant loss in mitochondrial potential.
Cryopreservation amplified the mitochondrial damage compared to cooling, probably because of the block in ATP synthesis and consequently in the reduction in the activity of ATP-dependent pumps [36], a tendency to make the plasma membrane unstable. This may lead to an increase in intracellular Na+ and a reduction in intracellular K+, with reduced Ca2+ efflux due to inhibition of the Ca2+ ATP-ase pumps, increased leakage of Ca2+ across the membrane due to the instability caused by removal of cholesterol, and/or increased Ca2+ influx due to the activation of unidentified channels [37]. Changes associated with this process include an increase of capacitated and acrosome-reacted spermatozoa, as reported by Felix [37]. These results are in agreement with those reported by Albrizio et al., [38]; they showed that cryopreservation increases the percentage of capacitated and acrosome reacted spermatozoa, increase the intracellular Ca2+ concentration and leads to a higher functional response of L-type Ca2+-channels to both the agonist (Bay K-8644) and antagonist (Nifedipine). Moreover, cryopreservation was found to determine the activation of lytic enzymes and to increase mitochondrial permeability, leading to cell death [10]. This is in accordance with the results of the present study, in which the percentage of spermatozoa with damaged acrosome membrane and low mitochondrial potential is higher in frozen than in cooled ones.
It has been suggested that plasma membranes and mitochondria in bovine sperm are both affected by cryopreservation [39]. In accordance with the above-mentioned study, we found that plasma membrane and mitochondrial membrane were equally vulnerable to the freezing and thawing process, because of their high thermolability [40]. Moreover, in this study, plasma membrane and mitochondrial membrane conditions are highly correlated demonstrating that these structures depend on each other, as reported by Celeghini et al., [7]. The mitochondrial plasma membrane is a good predictor to determine and assess plasma membrane and acrosome membrane damages because of thermic treatment. Besides structural sperm characteristics, conflicting opinions concerning the relationship between motility and fertility in the stallion exist [41, 42] although sperm cell motility and the quality of motility are still the most reliable indicators of sperm viability. In this study, total motility recorded in cooled semen was in agreement with similar data reported by Love et al.,[13] and Heckenbichler et al., [43], whereas, the same parameter found in frozen semen was similar to that found by Wrench et al., [44] and Salazar et al., [45]. The progressive motility found in cooled semen was similar to that reported by Cocchia et al., [46] and Heckenbicher et al., [43], whereas the same parameter found in frozen semen was similar to that found by Wrench et al., [44]. It is well known the functional relationship between the mitochondrion and the cellular apparatus that drives sperm movements; in fact mitochondria are well known for producing energy in the form of ATP and sperm motility depends upon the energy produced by the oxidative phosphorylation. Mitochondria are a major source of Reactive Oxygen Species (ROS) and appear to be the cellular structures most susceptible to damages during cooling and cryopreservation [47], leading to a loss of motility in frozen semen.
As to VCL, VAP, VSL and ALH parameters, the results found in cooled semen were in agreement with those of Aurich et al., [48], whereas those found in frozen semen were similar to the results of Salazar et al., [45].
This study demonstrates that the quality of motility is different in cooled and frozen semen, in fact, cooled samples showed higher VAP and VCL values than frozen ones. These results suggest that motile cells, that are numerically higher in cooled than in frozen semen, are also characterized by higher speed as deduced by their higher VAP and VCL, on the contrary, linear characteristic of sperm motility is not affected by temperature reduction. We found that ALH values were higher in refrigerated semen than in the cryopreserved one. In general, higher ALH values are unwanted, because they can interfere with cell progression, as demonstrated by [18], which stand for reduced sperm quality. However until now a cutoff value for ALH has not been defined so that is not clear the influence of this parameter on the progressive motility and on the ability of the spermatozoon to go forward into the female reproductive tract [7].
As to motility characteristics, other authors found opposite results for refrigerated and cryopreserved semen [42]; [49]; [50]. This could be only an apparent discordance considering that many factors may have a role such as season of semen recovery, physiological differences among stallions, frequency in collecting semen, different extenders for semen dilutions, different settings of the CASA system (threshold setting, specimen concentration, video digitalization rate) [9, 17, 51-53].
We, as several authors working on other animal species, didn’t find a direct correlation between mitochondrial function and a specific kinetic parameter, probably because equine sperm motility is modulated by different factors not only by mitochondria [14, 23].
In conclusion, our study, reporting the simultaneous evaluation of different functional characteristics of equine spermatozoa subjected to temperature changes, increases the information on semen quality helping the selection of those characteristics more correlated with semen fertility potential. In particular, we demonstrated that mitochondria are good indicators of sperm survival and can be used to discriminate between good and poor semen quality. Moreover, they are strictly correlated to the state of cellular membrane, therefore, a proper evaluation of mitochondria sounds necessary when analyzing sperm samples. Standing on the present study, mitochondrial membrane potential provides useful information on equine sperm quality so that it may be exploitable as a marker of sperm fertility; moreover, the high mitochondrial sensitivity to temperature variations observed in this study highlights the importance of developing new strategies to protect the functionality of this organelle to preserve sperm cell physiology.
Disclosure
None of the authors of this paper has a financial or personal relationship with other people or organizations that could inappropriately influence or bias the content of the paper.
This paper was concepted by GM Lacalandra, G. Mari and A. Zarrilli; written by M. Albrizio, G. Mari, GM Lacalandra and A. Zarrilli. Data were acquired by AC Guaricci, A. Moramarco and E. Micera; B. Mislei, and G. Rizzato analysed and interpreted the data. Albrizio revised the manuscript and cared the journal submission.
All authors approved the final article.
Acknowledgements: This work was supported by Italian University funds
References