Author Archives: rajani

fig 2

Comparison Sensor Study of US Cooked Meals Postprandial Plasma Glucose and Worldwide Fasting Plasma Glucose between Pre-Virus and Virus Periods Using GH-Method: Math-Physical Medicine (No. 344)

DOI: 10.31038/EDMJ.2020445

Abstract

The author conducts a numerical analysis to compare his diabetes control situations for two sub-periods over 2.4 years or 29+ months: the pre-Covid-19 (pre-Virus) period, from 5/5/2018 to 1/18/2020, and the Covid-19 (Virus) period, from 1/19/2020 to 10/10/2020. Special attention has been placed on the quantitative comparison of three glucose components and their measured data via a continuous glucose monitoring (CGM) sensor device on his arm, including fasting plasma glucose (FPG), postprandial plasma glucose (PPG), and daily glucose waveform.

The sensor collected PPG data comparison study is based on data associated with only US home-cooked meals. PPG values are closely related to food and meals (~40% contribution) varying from country to country depending on the food material and preparation method. In addition, he has stayed in the US exclusively during this Virus quarantined period; therefore, he must extract his US sensor PPG data out from his massive database (a data mining effort) in order to conduct a fair comparison. On the other hand, his FPG reflects his pancreatic beta cells’ health status which is directly related to his body weight (~90%% correlation) and has no identifiable direct connection with his diet. The pre-virus FPG values are based on his worldwide data collected from all nations with heavy traveling prior to the Virus period.

In summary, the US sensor PPG difference between two periods is within the range of 11 mg/dL to 13 mg/dL (8%-9%) and worldwide sensor FPG difference is 13 mg/dL (11%-12%). In terms sensor FPG, the difference between the pre-Virus and Virus periods are 13 mg/dL.

The average daily sensor glucose is 131 mg/dL for the pre-Virus period and 117 mg/dL for the Virus period. There is a 14 mg/dL (11%) of daily average glucose reduction during the Virus period in comparison with the pre-Virus period. Once again, his glucose control situation in the Virus period is better than the pre-Virus period.

The COVID-19 virus is the worst pandemic in recent human history in terms of its spreading speed and space, mortality rate, and emotional impact on the world population. People belonging to the “vulnerable” groups, such as the elderly with history of chronic diseases and their complications, require special attention on their health conditions as well as the lifestyle management program during this period.

Although the author belongs to one of the vulnerable groups, he achieved even better results on his diabetes control in terms of FPG, PPG, and daily glucose during the Virus period. This finding has proven once again unasked on data of PPG from the US-based home cooked food database and FPG from worldwide collected database.

Furthermore, by utilizing this data mining, segmentation data analysis, and other mathematical tools, he has further demonstrated his pancreatic beta cells’ self-repair phenomenon which was disclosed in several of his prior medical publications.

The quiet, stable, and undisturbed lifestyle during the Virus quarantined period contributes to his better glucose control situation. In fact, he turned the COVID-19 crisis into his health advantage. He established these same observed conclusions repeatedly with similar findings. More importantly, he also learned that he should try his best to continue this kind of good lifestyle in the future.

Introduction

The author conducts a numerical analysis to compare his diabetes control situations for two sub-periods over 2.4 years or 29+ months: the pre-Covid-19 (pre-Virus) period, from 5/5/2018 to 1/18/2020, and the Covid-19 (Virus) period, from 1/19/2020 to 10/10/2020. Special attention has been placed on the quantitative comparison of three glucose components and their measured data via a continuous glucose monitoring (CGM) sensor device on his arm, including fasting plasma glucose (FPG), postprandial plasma glucose (PPG), and daily glucose waveform.

The sensor collected PPG data comparison study is based on data associated with only US home-cooked meals. PPG values are closely related to food and meals (~40% contribution) varying from country to country depending on the food material and preparation method. In addition, he has stayed in the US exclusively during this Virus quarantined period; therefore, he must extract his US sensor PPG data out from his massive database (a data mining effort) in order to conduct a fair comparison. On the other hand, his FPG reflects his pancreatic beta cells’ health status which is directly related to his body weight (~90% correlation) and has no identifiable direct connection with his diet. The pre-virus FPG values are based on his worldwide data collected from all nations with heavy traveling prior to the Virus period.

Methods

Background

To learn more about the GH-Method: math-physical medicine (MPM) methodology, readers can review his article to understand his MPM analysis method [1], along with the outlined history of his personalized diabetes research and application tools development [2].

Overview of Diabetes Conditions

During 2015 and 2016, he dedicated his time to research and develops four prediction models related to his type 2 diabetes (T2D) conditions such as weight, PPG, FPG, and HbA1C (A1C). As a result from using his own developed metabolism model and four prediction tools, his weight reduced from 220 lbs (100 kg) in 2010 to 171 lbs. (89 kg) in 2018, and finally reached 168 lbs. (76 kg) in 2020; his waistline decreased from 44 inches (112 cm) in 2010 to 33 inches (84 cm) in 2020; his average finger glucose value reduced from 280 mg/dL in 2010 to 116 mg/dL in 2018, and finally reached to 106 mg/dL in 2020; and his A1C from 10% to 6.5% in 2018, and finally reached to 6.1% in 2020. One of his major accomplishments is that he no longer takes any diabetes medications since 12/8/2015.

In 2017, he achieved excellent results on all fronts, especially glucose control. However, during 2018 and 2019 (overlapping the pre-COVID-19 period), he traveled to 50+ international cities to attend 60+ medical conferences and made ~120 oral presentations. This kind of hectic traveling schedule inflicted damage to his diabetes control, through dinning out along with exercise disruption, plus jet-leg and sleep pattern disturbance, due to irregular life routines through traveling.

Data Collection

Since 1/1/2012, he measured his glucose values using the finger-piercing method: once for FPG and three times for PPG each day. In the finger glucose database, FPG occupies 25% of daily glucose while PPG occupies 75% of daily glucose. He did not use high finger glucose data in this particular analysis.

On 5/5/2018, he applied a CGM sensor device on his upper arm and checked his glucose measurements every 15 minutes, a total of ~96 times each day. After the first bite of his meal, he measured his PPG level every 15 minutes for a total of 3-hours or 180 minutes. He has maintained the same measurement pattern since 5/5/2018 until present day of 10/10/2020. In this CGM sensor glucose database, FPG occupies 29% of daily glucose, PPG takes up 38% of daily glucose, and pre-meals plus pre-bed periods occupy 33% of his daily glucose.

Mathematical Tools Utilized

In this glucose study, he utilized data mining, segmentation analysis, pattern recognition method, time-series analysis, and candlestick K-line model as explained [3-8].

Results

Figure 1 shows the US home cooked meals’ sensor PPG data over a 3-hour timespan and worldwide collected sensor FPG data over 7-hour timespan for the pre-Virus period (5/5/2018-1/18/2018) and Virus period (1/19/2020-10/10/2020).

fig 1

Figure 1: Data table of US sensor PPG and Worldwide sensor FPG.

In Figure 2, it shows the US sensor PPG curve and worldwide sensor FPG curve comparison between the pre-Virus period and Virus period. It is obvious that the diagrams have very high correlation coefficients between these two periods, with 99% for the US PPG and 98% for worldwide FPG. The actual glucose value comparisons listed below in the order of (peak PPG/average PPG) and (bottom FPG/average FPG):

fig 2

Figure 2: PPG and FPG waveforms comparison between two periods.

US Sensor PPG

Pre-Virus period: (143/133)

Virus period: (130/122)

Period’s differences: (13/11).

Worldwide sensor FPG

Pre-Virus period: (108/114)

Virus period: (95/101)

Period’s differences: (13/13).

In summary, the US sensor PPG difference between the two period is within the range of 11 mg/dL to 13 mg/dL (8%-9%) and worldwide sensor FPG difference is 13 mg/dL (11%-12%). In terms FPG difference of bottom and averaged values between the pre-virus and the Virus periods are 13 mg/dL.

Figure 3 depicts some vital data and candlestick charts of five PPG glucoses. The following table summarizes five key data of PPG waveforms of both periods in the order of five PPG values: (open/close/minimum/maximum/average).

fig 3

Figure 3: Comparison of daily glucose among 3 periods (pre-Virus, Virus, and total).

Pre-Virus Period K-line PPG

(128/126/109/169/135).

Virus Period K-line PPG

(112/119/101/153/123).

Sensor PPG differences

(6/7/8/16/12).

From Figure 3, it is obvious that all of the five K-line PPG values during the pre-Virus period are higher than the Virus period.

Here are some additional information listed below:

Pre-Virus Period (US Home-Cooked)

622 meals, carbs/sugar 10.1 grams, post-meal walking 4,285 steps.

Virus Period (US Home-Cooked)

726 meals, carbs/sugar 12.1 grams, post-meal walking 4,255 steps.

It should be noted that despite the carbs/sugar amount per meal during the Virus period is 2 grams more than the pre-Virus period, where both periods’ post-meal walking steps are almost equal; however, the PPG during the Virus period is actually ~13 mg/dL (or ~10%) lower than the pre-Virus period. The most logical explanation is that not only is his diabetes conditions have been improving due to his stringent lifestyle management program, but also his pancreatic beta cells’ insulin capability and quality have been self-repairing continuously over the past 10 years [6]. A similar phenomenon can also be detected from his worldwide sensor FPG difference of 13 mg/dL (or 11%-12%) improvement due to his beta cells’ insulin self-repair.

The phenomenon mentioned above can be observed in the general glucose comparison between two periods and the total period of 5/5/2018 through 10/10/2020 (Figure 3).

The average daily sensor glucose is 131 mg/dL for the pre-Virus period and 117 mg/dL for the Virus period. There is a 14 mg/dL (11%) of daily average glucose reduction during the Virus period in comparison with the pre-Virus period. Once again, his glucose control situation in the Virus period is better than the pre-Virus period.

Conclusions

The COVID-19 virus is the worst pandemic in recent human history in terms of its spreading speed and space, mortality rate, and emotional impact on the world population. People belonging to the “vulnerable” groups, such as the elderly with history of chronic diseases and their complications, require special attention on their health conditions as well as the lifestyle management program during this period.

Although the author belongs to one of the vulnerable groups, he achieved even better results on his diabetes control in terms of FPG, PPG, and daily glucose during the Virus period. This finding has proven once again unasked on data of PPG from the US-based home cooked food database and FPG from worldwide collected database.

Furthermore, by utilizing this data mining, segmentation data analysis, and other mathematical tools, he has further demonstrated his pancreatic beta cells’ self-repair phenomenon which was disclosed in several of his prior medical publications.

The quiet, stable, and undisturbed lifestyle during the Virus quarantined period contributes to his better glucose control situation. In fact, he turned the COVID-19 crisis into his health advantage. He established these same observed conclusions repeatedly with similar findings. More importantly, he also learned that he should try his best to continue this kind of good lifestyle in the future.

References

  1. Hsu, Gerald C (2020) Biomedical research methodology based on GH-Method: math-physical medicine (No. 310).
  2. Hsu, Gerald C (2020) Glucose trend pattern analysis and progressive behavior modification of a T2D patient using GH-Method: math-physical medicine (No. 305).
  3. Hsu, Gerald C. March (2019) Linkage among metabolism, immune system, and various diseases using GH-Method: math-physical medicine (No. 235).
  4. Hsu, Gerald C. May (2020) Building up fundamental strength to fight against COVID-19 for patients with chronic diseases and complications (No.253).
  5. Hsu, Gerald C (2020) A Case Study on the Prediction of A1C Variances over Seven Periods with guidelines Using GH-Method: math-physical medicine (No. 262).
  6. Hsu, Gerald C (2020) Self-recovery of pancreatic beta cell’s insulin secretion based on annualized fasting plasma glucose, baseline postprandial plasma glucose, and baseline daily glucose data using GH-Method: math-physical medicine (No. 297).
  7. Hsu, Gerald C (2020) Glucoses and HbA1C comparison study between pre- COVID-19 and COVID-19 using GH-Method: math-physical medicine (No. 318).
  8. Hsu, Gerald C (2019) Using Candlestick Charting Techniques to Investigate Glucose Behaviors via GH-Method: Math-Physical Medicine (No. 76).
fig 3

Positive Impact of Scaling and Root Planing on Glycaemia among Asian Indian Type 2 Diabetes Patients with Periodontitis

DOI: 10.31038/EDMJ.2020444

Abstract

Aim: To study whether a non-surgical therapy such as scaling and root planing (SRP) will help in improving the glycaemic control in type 2 diabetes (T2D) patients as assessed by Glycosylated haemoglobin (HbA1c) measured at baseline and during the follow-up dental examinations in a diabetes hospital in Southern India.

Methods: In this retrospective study among T2D patients, the intervention group underwent SRP in addition to conventional treatment for hyperglycaemia, the control group had only conventional treatment. Both groups had mild to moderate Periodontal Disease (PD) at baseline. Glycaemic variations, change in HbA1c were assessed between 4 and 6 months. Impact of baseline characteristics and SRP on follow-up HbA1c was assessed using multiple logistic regression analysis.

Results: Out of the 1164 patients identified, 319 were selected, 124 patients in the control group and 135 in the intervention group satisfied the criteria for analysis. At baseline, gender distribution, diabetes duration, body mass index and mean HbA1c were similar in these groups. The intervention group was younger (p = 0.02), higher percentage of them were on oral hypoglycaemic agents (p = 0.006).

At follow-up, only the intervention group showed a significant reduction in HbA1c (9.0% (75 mmol/mol) to 8.0% (64 mmol/mol), p<0.0001), while no change was seen in the control group (8.7% (72 mmol/mol) to 8.8% (73 mmol/mol)). Importantly with intervention 52.6% shifted to optimal level of HbA1c, while 52.3% of the control group had uncontrolled diabetes. Improvement in HbA1c was inversely associated with baseline HbA1c, duration of diabetes and treatment with only oral hypoglycaemic agents (OHA) versus OHA plus insulin. Intervention with SRP was independently and significantly associated with improvement in HbA1c (≤7.5%, 59 mmol/mol) [odds ratio (OR), 95% confidence interval (CI) 3.390 (1.786-6.434), p<0.0001].

Conclusion SRP, a simple and practical procedure had independent, significant beneficial effect on glycaemic control among Asian Indian T2D patients with PD.

Keywords

Type 2 diabetes, Periodontitis, Scaling and root planing, Glycaemic control, Glycosylated haemoglobin

Introduction

Diabetes is a major healthcare challenge both in developed and in developing countries. India has a large number with diabetes (72 million) and more than 90% of them have type 2 diabetes (T2D) [1]. Diabetes poses a healthcare burden not only because of the chronic requirement for the management of hyperglycaemia but also due to the associated micro and macro vascular risk factors and disorders [1,2]. Persistent hyperglycaemia can lead to several complications which include periodontal disease (PD), known to be a major complication of diabetes [3,4]. PD is caused due to exogenous bacterial infection and the resultant host response to bacterial challenge. The increased inflammatory response destroys both the endogenous bacteria and also releases cytokines that causes destruction of periodontal tissues [5]. There is emerging evidence to support the existence of a bidirectional relationship between diabetes and PD [6-9] with diabetes increasing the risk for PD and periodontal inflammation negatively affecting glycemic control [10]. It is also suggested that periodontitis may be a risk factor itself for other diabetes complications [11]. Due to the non-uniformity of the methodology, regions, age groups, the presence of habits such as tobacco use and awareness about oral hygiene it is not possible to derive a definite rate of prevalence of periodontitis in India [12,13].

We investigated in this study the effect of a non-surgical periodontal therapy, scaling and root planing (SRP) on metabolic control among T2D patients. There are only a few studies from India on the beneficial effect of SRP on glycaemic control [14-16]. Moreover, studies in large numbers and also with a comparative group are limited.

The aim was to analyse the change in glycaemic control as assessed by the HbA1c values measured at the time of baseline dental examination and during the follow-up after SRP in comparison with a control group without SRP.

Methods and Materials

Patient Selection

This was a retrospective study among T2D patients who were referred to the dental department of Dr.A.Ramachandran’s Diabetes Hospitals, Chennai, India. It included a study group who underwent periodontal therapy and a control group that only had the usual care for diabetes during the study period. The selection of patients for the analysis is shown in the flow diagram (Figure 1). Patients with diagnosis of PD and had follow-up data between 4 and 6 months of their initial visit were included. For this, medical records of T2D patients, both men and women of age 25-65 years followed-up during June 2018 and December 2019 were selected. The reasons for exclusion were unwillingness to undergo a mechanical treatment, inability to report for follow-up within the prescribed time period or having had treatment with antibiotic or anti-inflammatory drugs. Patients with habit of smoking, pan or tobacco chewing were also excluded.

fig 1

Figure 1: Flowchart showing the selection of study participants and group allocation.

A written informed consent was obtained from the patients prior to inclusion in the study to use their clinical data for research purposes without disclosing their identity. The study was approved by the Ethics Committee of the India Diabetes Research Foundation and Dr. A. Ramachandran’s Diabetes Hospitals, Chennai.

Clinical and Dental Assessment

Details on patient’s treatment history including advice on diet and physical activity were recorded. Body mass index (BMI, kg/m2) was calculated. Initial diagnosis of diabetes was made using the World Health Organisation criteria with a fasting plasma glucose (FPG) level ≥ 126 mg/dl (7.0 mmol/l) and/or 2-h post-load glucose level ≥ 200 mg/dl (11.1 mmol/l) [17]. We recorded HbA1c levels at the baseline and during the follow-up visits. HbA1c was measured by immunoturbidimetry method using TINA-QUANT II (Roche Diagnostics Corporation, Germany).

Presence of mild to moderate chronic periodontitis was diagnosed with a probing depth of >5 mm and clinical attachment loss (CAL) of >3 mm and radiographic evidence of 30 to 50% bone loss.

Study Groups

Patients chosen for the intervention group underwent SRP after the initial diagnosis of PD. The control group did not undergo SRP but received conventional treatment for glycaemia. Both groups reported for follow-up to the dental department between 4 and 6 months of the baseline visit.

Statistical Analyses

Severity of glycaemia is shown in terms of mean HbA1c values categorized as mild (HbA1c ≤7.5% (59mmol/mol)), moderate (HbA1c 7.6(60 mmol/mol)-8.5% (69 mmol/mol)) and severe (HbA1c >8.5% (>69 mmol/mol)) glycaemia. Comparisons between the baseline and follow-up values in the total group and in the 3 categories of glycaemia were made. The impact of intervention (SRP) on the mean HbA1c values and also in the 3 categories of HbA1c was compared with the respective values in the control group during the follow-up.

Data are presented as mean ± SD for continuous variables with a normal distribution, as median (interquartile range) for skewed variables and as frequency (%) for categorical variables. Intergroup differences were tested using independent sample‘t’ test and chi-square test for continuous and categorical variables respectively. For skewed variables Mann-Whitney U test was used. A multiple logistic regression analysis (MLR) (enter method) was done to assess the impact of baseline variables and SRP versus conventional treatment on the control of HbA1c at follow-up. The dependent variable was HbA1c of ≤7.5% (59 mmol/mol) versus >7.5% (>59 mmol/mol) at follow-up. Independent variables used were age, BMI, duration of diabetes, baseline HbA1c (as continuous variables), gender (reference: female), treatment of diabetes (only oral hypoglycemic agents (OHA) versus insulin plus OHA (reference)) and groups (SRP versus no SRP (reference)).

All statistical analyses were done using IBM SPSS (version 21.0). A value of p < 0.05 was considered as statistically significant.

Results

Among the total of 1164 records identified, patients from outstation (n = 845) were excluded because of their inability to report for follow-up visit during the study period. Details of 176 patients who underwent SRP (Intervention group) and 143 patients who did not undergo SRP (Control group) were included in the study. Patients in both study groups reported for the clinical follow-up between 4 and 6 months of their baseline visit. Among them, 19 patients in the control group and 41 patients in the intervention group were excluded due to the requirement for treatment with antibiotic or anti-inflammatory drugs or because of smoking habits. For the final analysis, 124 patients in the control group and 135 patients in the intervention group were included (Figure 1).

The baseline characteristics of the study participants in the control and intervention groups are shown in Table 1. The gender distribution, duration of diabetes, BMI and mean HbA1c values were similar in both groups. Higher percentage (p<0.0001) in the intervention group had calculi and/or stains. The intervention group was younger (p = 0.02), and a higher percentage of them was on treatment with OHA for diabetes (p = 0.006). Only a small percentage was on lifestyle modification, more so in the control group (p = 0.02).

Table 1: Baseline characteristics of the Control and Intervention groups.

Variables

Control

n = 124

Intervention

n = 135

Gender
Male, n (%)

83 (66.9)

94 (69.6)

Female, n (%)

41 (33.1)

41 (30.4)

Age (years) mean±SD

55.4 ± 6.5*

53.4 ± 7.2

BMI (kg/m2) mean±SD

27.4 ± 4.2

27.1 ± 5.4

Duration of Diabetes (months) median, IQR

170 (96-252)

133 (90-224)

Treatment
OHA, n (%)

60 (48.4)

88 (65.1) #

Insulin ± OHA, n (%)

52 (41.9)

43 (31.9)

Diet & Exercise, n (%)

12 (9.7)$

4 (3.0)

*p = 0.02 (‘t’ test), #p = 0.006, $p = 0.02 (Chi-square test).

BMI: Body Mass Index; OHA: Oral Hypoglycemic Agent.

Figure 2 shows the changes in the mean HbA1c values at the baseline and follow-up in the study groups. In the control group, both values were similar, whereas in the intervention group the mean value had decreased significantly at the follow-up (p<0.0001). As mentioned above, the mean baseline HbA1c value was similar in both groups. At follow-up, the control group had a higher value when compared with the intervention group (p<0.0001).

fig 2

Figure 2: Mean HbA1c (%) at baseline and at follow up.

Figure 3 shows the distribution in percentage in the categories of HbA1c in the control and intervention groups. At the baseline (Panel A), the maximum number of patients in both groups were in the highest category (>8.5% (69 mmol/mol)) of HbA1c. At follow-up (Panel B), it was observed that with intervention a larger percentage had shifted to the optimal level of HbA1c (52.6%, p<0.0002). In contrast, a larger percentage of the control group was in the uncontrolled category (53.2%, p<0.0001).

fig 3

Figure 3: Distribution in Percentage in the categories of HbA1c

In the second category of HbA1c (7.6% (60 mmol/mol)-8.5% (69 mmol/mol)) there was no significant difference between the values at baseline and follow-up in either group.

The multiple logistic regression analysis showed that age, gender and BMI did not have significant association with the outcome. The duration of diabetes, baseline HbA1c and treatment with only OHA had inverse association with good control of HbA1c. Treatment with SRP had a significant influence on the glycaemic outcome independent of the above parameters [odds ratio (OR), 95% confidence interval (CI) 3.390 (1.786-6.434), p<0.0001] (Table 2).

Table 2: Variables associated with the glycaemic outcome (HbA1c) – results of the multiple logistic regression analysis.

Variables

β Constant (SE)

OR (95% CI)

p value

Age (years)

0.044 (0.026)

1.045 (0.993-1.100)

0.091

Gender (Male)

0.648 (0.361)

1.911 (0.942-3.875)

0.073

BMI (kg/m2)

-0.014 (0.036)

0.986 (0.920-1.057)

0.699

Duration of diabetes (months)

-0.004 (0.002)

0.996 (0.992-1.000)

0.035

Baseline HbA1c (%)

-0.534 (0.108)

0.586 (0.474-0.724)

<0.0001

Treatment of Diabetes (OHA)

-0.926 (0.382)

0.396 (0.187-0.837)

0.015

Group (Intervention)

1.221 (0.327)

3.390 (1.786-6.434)

<0.0001

Dependent variable: HbA1c of ≤ 7.5% (59 mmol/mol) versus >7.5% (59 mmol/mol) at follow-up.

Independent variables used in the equation were age, BMI, duration of diabetes, baseline HbA1c (as continuous variables), gender (reference: female), treatment of diabetes (only oral hypoglycemic agents (OHA) versus insulin plus OHA (reference)) and groups (SRP versus no SRP (reference)).

OR: Odds Ratio; CI: Confidence Interval; BMI: Body Mass Index; OHA: Oral Hypoglycemic Agents.

Treatment with SRP showed a definite additive effect on the conventional treatment for diabetes in patients who also had PD.

Discussion

In this study, the important observation was that mechanical treatment of PD with SRP had facilitated improvement of glycaemia in diabetes patients during the follow-up assessment between 4 to 6 months. In comparison with the control group, treated with the conventional methods including regular clinical follow-up, better glycaemic outcome was seen with SRP even among the patients who had severe glycaemia. At follow-up, majority of the patients in the intervention group showed optimal control of glycaemia when compared to the control group (52.6% versus 29.9%, p = 0.0002). The MLR showed that treatment with SRP had an independent impact on the improvement of glycaemic outcome [OR (95% CI): 3.390 (1.786-6.434), p<0.0001]. Persons with uncontrolled diabetes and also required combined OHA and insulin treatment showed better impact with SRP as indicated by the inverse significant association with the outcome.

Previous studies have also reported the beneficial effects on diabetes control as measured by the HbA1c levels following non-surgical periodontal treatment [14-16,18]. While the first line of treatment for glycaemic control is lifestyle modification, use of OAD and /or insulin and adjunctive therapy for PD such as SRP is shown to result in better glycaemic outcome [14,18]. SRP removes the causative factors such as plaque and calculi which result in inflammation and improves the glycaemic control, also preventing its further accumulation [19]. Improved HbA1c can be also attributed to diminished gingivitis. Number of studies in India [14-16] and in several other countries [18,20] had reported that periodontal therapy is associated with reduction of infection and inflammation facilitating metabolic control of diabetes. However, some studies did not have comparative data from control groups [14,21]. A study by Stewart et al. [18] showed improvement in 17.1% in 10 months versus 6.7% in matched control groups.

Another study, with a controlled study design in India had reported outcomes similar to our findings [15]. However, the study group comprised of only 45 T2D patients [15]. A larger study in India by Sunder et al, in 266 T2D patients with a post treatment HbA1c level of 8.4 (68 mmol/mol) ± 1.9% showed a significant reduction following SRP in a follow-up period of 6 months [14]. The baseline HbA1c, mean age and inclusion criteria were similar to our study design, but there was no control group included.

Some studies had shown an effect of mechanical treatment as observed in our study and few others showed a combined effect of mechanical and antibiotic / anti-inflammatory treatment for PD on glycaemic control [22].

While many studies showed enhanced benefit of SRP as an adjunctive therapy for PD in glycaemic control, a few studies did not support this observation [23-27].

Our study has shown that in addition to the conventional therapy for hyperglycaemia, mechanical therapy such as SRP has a beneficial role even among T2D patients with severe hyperglycaemia. This procedure is simple and practical with minimal discomfort to the patients. Periodic dental check-up and application of such adjunctive therapy should become a part of diabetes management.

Declarations

Funding

The study was funded by India Diabetes Research Foundation, Chennai.

Conflict of Interest

None

Ethics Approval

The study was approved by the Ethics Committee of the India Diabetes Research Foundation and Dr. A. Ramachandran’s Diabetes Hospitals.

Authors’ Contributions

RV, CS, Arun R, AN, AR contributed to the study design. RY, A Rajeswari coordinated in data collection. AR, CS, KS and PS contributed to analyses and drafted the manuscript. All authors have reviewed the manuscript with critical input and approved the final draft of the manuscript.

Acknowledgements

We are grateful to all the patients for having consented to utilise their medical records for the purpose of research analysis. The support rendered by the department of dental care of Dr.A.Ramachandran’s Diabetes Hospitals, Chennai is greatly acknowledged.

Abbreviations

     BMI: Body Mass Index

     CAL: Clinical Attachment Loss

     CI: Confidence Interval

     FPG: Fasting Plasma Glucose

     HbA1c: Glycosylated Haemoglobin

     MLR: Multiple Logistic Regression

     OHA: Oral Hypoglycaemic Agents

     OR: Odds Ratio

     PD: Periodontal Disease

     SRP: Scaling and Root Planing

     T2D: Type 2 Diabetes

References

  1. International Diabetes Federation. IDF Diabetes Atlas, 9th edn. Brussels, Belgium: 2019. Available at: http://www.diabetesatlas.org. Last accessed on 11th March 2020.
  2. Ramachandran A, Ma RC, Snehalatha C (2010) Diabetes in Asia. Lancet 375: 408-418. [crossref]
  3. Jones JA, Miller DR, Wehler CJ, Rich SE, et al. (2007) Does periodontal care improve glycemic control? The Department of Veterans Affairs Dental Diabetes Study. J Clin Periodontol 34: 46-52. [crossref]
  4. Iacopino AM (2001) Periodontitis and diabetes interrelationships: role of inflammation. Ann Periodontol 6: 125-137. [crossref]
  5. Southerland JH, Taylor GW, Offenbacher S (2005) Diabetes and periodontal infection: making the connection. Clin Diabetes 23: 171-178. [crossref]
  6. Taylor GW, Borgnakke WS (2008) Periodontal disease: associations with diabetes, glycemic control and complications. Oral Dis 14: 191-203. [crossref]
  7. PatinoMarın N, Loyola Rodrıguez JP, Medina Solis CE, Pontigo Loyola AP, et al. (2008) Caries, periodontal disease and tooth loss in patients with diabetes mellitus types 1 and 2. Acta Odontol Latinoam 21: 127-133. [crossref]
  8. Wang TT, Chen TH, Wang PE, Lai H, et al. (2009) A population-based study on the association between type 2 diabetes and periodontal disease in 12,123 middle-aged Taiwanese (KCIS No. 21). J Clin Periodontol 36: 372-379. [crossref]
  9. Nesse W, Linde A, Abbas F, Lucien Spijkervet FK, et al. (2009) Dose-response relationship between periodontal inflamed surface area and HbA1c in type 2 diabetics. J Clin Periodontol 36: 295-300. [crossref]
  10. Taylor GW (2001) Bidirectional interrelationships between diabetes and periodontal diseases: and epidemiologic perspective. Ann Periodontol 6: 99-112. [crossref]
  11. Grossi SG (2001) Treatment of periodontal disease and control of diabetes: an assessment of the evidence and need for future research. Ann Periodontol 6: 138-145. [crossref]
  12. Chandra A, Yadav OP, Narula S, Dutta A (2016) Epidemiology of periodontal diseases in Indian population since last decade. J Int Soc Prev Community Dent. 6: 91-96. [crossref]
  13. Shaju JP, Zade RM, Das M (2011) Prevalence of periodontitis in the Indian population: A literature review. J Indian Soc Periodontol 15: 29-34. [crossref]
  14. Sundar C, Ramalingam S, Mohan V, Pradeepa R, et al. (2018) Periodontal therapy as an adjunctive modality for HbA1c reduction in type-2 diabetic patients. J Educ Health Promot. 28;7: 152. [crossref]
  15. Singh S, Kumar V, Kumar S, Subbappa A (2008) The effect of periodontal therapy on the improvement of glycemic control in patients with type 2 diabetes mellitus: A randomized controlled clinical trial. Int J Diabetes Dev Ctries. 28: 38-44. [crossref]
  16. Kiran M, Arpak N, Unsal E, Erdoğan MF (2005) The effect of improved periodontal health on metabolic control in type 2 diabetes mellitus. J Clin Periodontol 32: 266-272. [crossref]
  17. World Health Organization (2006) Definition and diagnosis of diabetes mellitus and intermediate hyperglycaemia: report of a WHO/IDF consultation. Geneva: World Health Organization,1-50.
  18. Stewart JE, Wager KA, Friedlander AH, Zadeh HH (2001) The effect of periodontal treatment on glycemic control in patients with type 2 diabetes mellitus. J Clin Periodontol 28: 306-310. [crossref]
  19. Cugini MA, Haffajee AD, Smith C, Kent RL Jr, et al. (2000) The effect of scaling and root planing on the clinical and microbiological parameters of periodontal diseases: 12-month results. J Clin Periodontol. 27: 30-36. [crossref]
  20. Nishimura F, Murayama Y (2001) Periodontal inflammation and insulin resistance-lessons from obesity. J Dent Res 80: 1690-1694.
  21. Moeintaghavi A, Arab HR, Bozorgnia Y, Kianoush K, et al. (2012) Non-surgical periodontal therapy affects metabolic control in diabetics: a randomized controlled clinical trial. Aust Dent J 57: 31-37. [crossref]
  22. Ryan ME (2008) Diagnostic and therapeutic strategies for the management of the diabetic patient. Compend Contin Educ Dent 29: 32-38, 40-44.
  23. Morita I, Inagaki K, Nakamura F, Noguchi T, et al. (2012) Relationship between periodontal status and levels of glycated hemoglobin. J Dent Res. 91: 161-166. [crossref]
  24. Sun WL, Chen LL, Zhang SZ, Ren YZ, et al. (2010) Changes of adiponectin and inflammatory cytokines after periodontal intervention in type 2 diabetes patients with periodontitis. Arch Oral Biol. 55: 970-974. [crossref]
  25. Venkataraman K, Kannan AT, Mohan V (2009) Challenges in diabetes management with particular reference to India. Int J Diabetes Dev Ctries 29: 103-109. [crossref]
  26. Petersen PE, Ogawa H (2005) Strengthening the prevention of periodontal disease: the WHO approach. J Periodontol. 76: 2187-2193. [crossref]
  27. Engebretson SP, Hyman LG, Michalowicz BS, Schoenfeld ER, et al. (2013) The effect of nonsurgical periodontal therapy on hemoglobin A1c levels in persons with type 2 diabetes and chronic periodontitis: a randomized clinical trial. JAMA 310: 2523-2532. [crossref]

Recurrent Gallbladder Cancer Presenting as Ovarian Neoplasm: A Case Report

DOI: 10.31038/CST.2020533

Introduction

Gallbladder carcinoma is reported to be incidentally diagnosed during approximately 1% of all cholecystectomies. Only 30% of gallbladder carcinomas are recognized intra-operatively, the remaining 70% are identified with final pathologic confirmation. Unfortunately, the prognosis for these malignancies is poor and the overall 5-year survival rate is reported to be less than 5%. Risk factors for the development of gallbladder carcinoma include chronic inflammation and gallstones with a direct correlation between the size of the stones and the risk of cancer. Chronic inflammation may come in the form of chronic cholecystitis, porcelain gallbladder, chronic bacterial infection and primary sclerosing cholangitis. Inflammation of tissues is thought to exacerbate DNA damage, increasing the risk of oncogenic transformation [1].

As it stands, there are few cases in literature of gallbladder carcinoma presenting as ovarian metastasis. To our knowledge, all other reports of ovarian metastasis have been in the primary setting [2,3]. As such, we present a case report of a woman with oligometastatic recurrence of gallbladder carcinoma in the ovary.

Case Presentation

A 67-year-old female with past medical history significant for diabetes mellitus type 2, idiopathic thrombocytopenia purpura, hypertension, bilateral foot drop and cauda equina syndrome status post spinal fusion presented to the hospital for acute cholecystitis. The patient underwent a laparoscopic cholecystectomy and final pathology revealed adenocarcinoma of the gallbladder with infiltration to the soft tissues near the cystic duct. She then underwent an open cystic duct resection, portal lymphadenectomy, and 4b5 liver resection with the final pathology revealing no metastasis to the liver at the time. Following her surgical recovery, she began adjuvant therapy with Gemcitabine, Cisplatin, and Xeloda.

Post treatment positron emission tomography and computed tomography scan (PET/CT), however, revealed a new pelvic mass arising from the left ovary and patient was referred to Gynecology Oncology for surgical management. The patient obtained pre-operative tumor markers and her CEA was found to be elevated at 14.2, while CA-125 and CA19-9 were within normal limits. She subsequently underwent a laparoscopic bilateral salpingooophorectomy. Intraoperatively, the patient was found to have a 5cm solid firm mass arising from the left ovary and no other evidence of intra-abdominal disease. The left fallopian tube, right fallopian tube and right ovary were found to be grossly normal appearing. Intraoperative frozen pathology demonstrated adenocarcinoma likely metastatic in origin. Final pathology confirmed adenocarcinoma in bilateral ovaries, favoring metastasis from gallbladder. Immunohistochemistry was positive for CA 19.9 and CDX2, and negative for PAX8 stains, supporting metastasis of gallbladder adenocarcinoma as opposed to an ovarian primary malignancy. Recommendations were made to the patient to obtain systemic adjuvant chemotherapy.

Discussion

Many gallbladder adenocarcinomas are incidental findings, most commonly identified during cholecystectomy for seemingly benign conditions, such as cholecystitis. Early identification is confounded by the fact that symptoms can mimic, or occur concurrently with, much more common benign diseases such as cholecystitis or cholelithiasis. Metastatic spread commonly involves nearby organs such as the liver (76-86%), lymph nodes (60%), spleen, and kidney [4]. Other reported sites of metastasis include the brain, breast, and thyroid [4,5]. Unless treated promptly, this malignancy remains a major source of mortality worldwide [1].

Classically, Krukenburg tumor refers to an ovarian tumor with a gastrointestinal primary site. Most commonly, this refers to gastric adenocarcinoma [5]. In our presented case, the primary location was the gallbladder, which was suspected prior to the laparoscopic bilateral salpingo-oophorectomy. Several case reports have focused on gallbladder cancer metastasis to the ovary in primary setting [2,3]. To our knowledge this is the first reported case of gallbladder cancer metastasizing to the ovary in a metasynchronous fashion.

The optimal therapeutic options for these patients depend on a variety of factors, including location of primary tumor, and presence of additional metastasis. Due to the rarity of diagnosis, there are no studies which have looked solely at the treatment and prognosis of ovarian metastasis from biliary origin. Several studies have suggested Hyperthermic Intraperitoneal Chemotherapy (HIPEC) may be beneficial in Krukenberg tumors with a gastric or colorectal primary [3,6].

One retrospective study reviewed prognosis of 147 patients with metastasis to the ovary from extragenital primary sites and reported the overall survival of approximately 6 months. The negative prognostic indicators included spread beyond the ovaries, local invasion, massive ascites, and bilateral ovarian metastasis [7]. However, it should be noted that only 2 patients presented with metastasis from a primary biliary carcinoma suggesting more research is needed for this subsect of patients [7].

Ovarian metastasis from a primary gallbladder cancer is a rare entity. It should be suspected in any patient with a history of biliary cancer presenting with a new-onset ovarian mass.

Consent

Informed consent was obtained from the patient for the publication of this case report.

References

  1. Goetze TO (2015) Gallbladder carcinoma: Prognostic factors and therapeutic options. World Journal of Gastroenterology 21: 12211-12217. [crossref]
  2. Kumar et al. (2010) Occult gallbladder carcinoma presenting as a primary ovarian tumor in two women: two case reports and a review of the literature. Journal of Medical Case Reports 4: 202.
  3. Lee TY, Wang CW, Chen TW, Chan DC, Liao GS, et al. (2018) Ovarian metastases from gallbladder mimics primary ovarian neoplasm in young patient: a case report. BMC Research Notes 11: 185.
  4. Rawla P, Sunkara T, Thandra K, Barsouk A (2019) Epidemiology of gallbladder cancer. Clinical and Experimental Hepatology 5: 93-102. [crossref]
  5. Pesce A, Destri GL, Amore FF, Magro G, La Greca G, et al. (2019) A rare case of Krukenberg tumor by gallbladder cancer. Annals of Medicine and Surgery 47: 50-52. [crossref]
  6. Jain V, Gupta K, Kudva R, Rodrigues GS (2006) A case of ovarian metastasis of gall bladder carcinoma simulating primary ovarian neoplasm: diagnostic pitfalls and review of literature. Int J Gynecol. Cancer 16: 319-321. [crossref]
  7. W Li, H Wang, J Wang, LV F, X Zhu, et al. (2012) Ovarian metastases resection from extragenital primary sites: outcome and prognostic factor analysis of 147 patients. BMC Canc 12: 278. [crossref]
fig 1

Coated Silver Nanoparticles Exhibit Unique Stability and Cytotoxicity in Media with Human Serum

DOI: 10.31038/NAMS.2020325

Abstract

Commercially available silver nanoparticles with five different coatings were measured for stability in media supplemented with human serum (HS) to better mimic conditions that particles might be exposed to in biomedical applications. The particles were then tested for cytotoxicity and cellular uptake in two cell lines. The stability of the particles differs from what is observed in media supplemented with fetal bovine serum (FBS). There is also a change in both the cytotoxicity of the particles and their cellular uptake in hepatocytes and neurons. These changes show that the behaviour of particles in living organisms may differ considerably from what is observed in standard in vitro testing as the particles will behave differently in the different extracellular environment they are exposed to, highlighting one of the challenges of translating in vitro studies for nanoparticles to regulatory frameworks.

Keywords

Silver, Nanoparticle, Cytotoxicity, Stability, Spectroscopy

Introduction

Silver nanoparticles are used in a wide array of commercial products that can ultimately lead to human exposure [1-3]. They are also being developed as diagnostic biomedical contrast agents and nanoscale delivery vehicles for a wide array of applications including imaging and drug delivery to the brain [4-6]. Silver nanoparticles have well established antimicrobial properties [7-10] and have shown antiviral activity in some studies [4,11-14]. There is currently a great need to better understand the underlying mechanisms of how silver nanoparticles interact with biological environments in order to facilitate their safe use in protective equipment and other healthcare products. Understanding how particles behave in vivo is challenging and most in vitro data tests particles in standard cell culture medium that is supplemented with fetal bovine serum [15]. Attempts to compensate for particle dynamics, for example, measuring sedimentation, have been attempted, however, such models fail to appreciate the complexities of the systems [16]. Nanoparticles will sediment at vastly different rates depending on their concentration, the components of the media, the media concentration and the specific properties of the nanomaterial. It is impractical to measure sedimentation at each does in a toxicity curve, and changes in volume from a 96 well plate may perturb the kinetics. The does will also change over time, as will the cellular response. Aggregated nanoparticles also may not contribute to dose in the same way as non-aggregated particles, changing the route of uptake, or removing them entirely from the bioavailable pool.

Silver nanoparticles are particularly sensitive to their aqueous environment, and thus the composition of the medium plays a critical role in the transport and stability of the particles, ultimately affecting their bioavailability or targeted uptake [17-25]. We have previously noted that particles treated with human serum albumin are more stable than those coated with bovine serum albumin, the most abundant proteins in sera [26]. We have also shown that the size dependent stability of silver particles changes in media supplemented with human serum [27]. Here we have tested how commercial particles with different coatings behave in media with human proteins and biomolecules as opposed to those from fetal bovine serum, how the particles evolve over time and how that affects their uptake and cytotoxicty. While cells are typically grown in media with FBS, they can be grown equally well in media with HS and so we sought to measure the outcome of this serum substitution in order to develop a more ‘humanized’ assay to better model one component of the cytotoxicity assays toward in vivo conditions.

Materials and Methods

Materials

Silver nanoparticles were purchased from Nanocomposix as aqueous suspensions. 40 nm particle coatings included polyvinylpyrrolidone (PVP), branched polyethylimine (BPEI), polyethylene glycol (PEG), lipoic acid and citrate. Sizes were validated by UV-Vis and DLS and data were compared to those supplied by Nanocomposix for the specific batch numbers.

Cell Culture

SH-SY5Y and HepG2 cells (American Tissue Culture Center) were all grown in Dulbecco’s modified Eagle’s medium (DMEM) (Gibco) supplemented with 10% Human AB serum (HS) (Sigma) and 1% penicillin-streptomycin (Pen/strep) (50 µg/ml, Gibco) unless stated otherwise and under standard culture conditions (37°C, 5% CO2). Media was filtered through 0.2 μm filters after the addition of HS to remove any precipitates from the media. Cells were grown in T75 flasks (Falcon) and Trypsin-EDTA solution (Gibco) was used for passaging cells (3 mL per T75 flask for HepG2 and 2 mL for SH-SY5Y). For passaging, SH-SY5Y cells were treated with Trypsin-EDTA at room temperature for 5 min, while HepG2 cells were incubated for 10 minutes at 37 degrees.

Ultraviolet-Visible (UV-Vis) Spectroscopy

Samples were run on a Varian Cary 5000 UV-Vis spectrometer at ambient temperature under a nitrogen atmosphere using plastic (Brand) cuvettes with a 1 mL sampling volume. Samples for time courses were prepared as 1:1 mixtures of DMEM (no phenol red, Gibco) with 10% HS and 1% penicillin-streptomycin and silver particles suspended in water at 20 μg/mL. This results in a final concentration of 5 % HS and 10 μg/mL silver nanoparticle, a media mixture consistent with what was used for the cytotoxicity assays. At each time point a background of water/media without particles was measured to normalize any drift that might arise from the media changing over time.

Dynamic Light Scattering (DLS)

Samples were run on a Malvern Zetasizer Nano-ZS. Samples were run in plastic cuvettes (BRAND) with a 1 mL sample volume. Each sample was measured 5 times. All initial values for particles were consistent with manufactures specifications for the particles. Samples for time courses were prepared as 1:1 mixtures of DMEM (no phenol red) with 10% HS and 1% penicillin-streptomycin and silver particles suspended in water at 20 μg/mL. This results in a final concentration of 5 % FBS and 10 μg/mL silver nanoparticle.

3-(4,5-Dimethylthiazol-2-yl)-2,5-Diphenyltetrazolium Bromide (MTT) Assay

Cells were seeded into wells in a 96-well plate (Falcon) (1 x 10⁵ cells/ml, 100 µl per well) to cover a 9 x 6 grid, filling 54 wells. Remaining wells were filled with 200 µl of PBS. After 24 hours, 100 µl volumes of dilutions of particles in water spanning from 20 µg/mL to 0.1 µg/mL were added to the seeded wells (final concentrations spanning 10 µg/mL to 0.05 µg/mL). For each nanoparticle, eight dilutions were prepared and for each dilution six replicates were performed. In the remaining 6 wells, 100 µL of water was added as a particle-free control. Cells were then incubated with nanoparticles for 72 h. After 72 h, 50 µL of a PBS solution of MTT (2.5 mg/ml) was added to each well and then incubated for 3 h. After 3 h, media was aspirated from all wells, leaving purple formazan crystals in those wells with viable cells. To each well, 150 µl of DMSO was added. Plates were then agitated for 30 s to dissolve the crystals and analyzed using a plate reader (Fluorstar Omega, BMG Labtech.) to determine the absorbance of each well at 570 nm. This reading divided by the average from the reading of the six control wells was plotted to determine the IC50 value of each complex for each cell line. Six replicates were performed for each sample on each cell line for each experiment, and each experiment was repeated three times. The values and errors reported are calculated from 18 unique measurements after curves were fit with a 4-variable sigmoidal curve to calculate the IC50 values.

Metal Analysis

To determine the AgNP uptake into each cell line, 5 mL cell suspensions of 105 cells/mL cells were plated into 3 cm Petri dishes. After 24 h, 250 μL of nanoparticles (stock suspensions of 20 μg/mL) were added to the cells. These samples were incubated for 24 h, at which times the media was removed and the cells rinsed twice with PBS. Trypsin-EDTA (2 mL of 0.25 %) was then added to detach the cells from the plate surface, and an additional 3 mL of PBS added to resuspend the cells. These suspensions were transferred to 15 mL conical Falcon tubes and centrifuged for 5 min at 800 rpm. The supernatant was discarded and the cells resuspended and rinsed twice with PBS in this manner to remove particles from the cell surface. Cell pellets were then resuspended in 2 mL of PBS and counted using a LUNA automated cell counter (Logos Biosystems). Cell suspension ranged between 1 to 2 x 10⁶ cells per sample for HepG2 cells and between 0.5 and 1.5 x 10⁶ cells per sample for SH-SY5Y cells. After counting the cells in each sample, the cells were centrifuged again for 5 min at 2000 rpm and the supernatant discarded. The cell pellet was dried overnight. To each dried pellet, 100 µL of concentrated nitric acid was added and the sample left for 24 h to be digested. Samples were then diluted with H2O and submitted for ICP-MS (Element XR, Thermo Fisher Scientific, Bremen, Germany) analysis to determine the silver content. The results were then normalized to the number of cells in each sample. Each experiment was repeated 3 times and the values and errors reported are the average of these 3 measurements. Samples for residual silver ion content were prepared by centrifuging samples at 30k rpm for 30 minutes. An aliquot for the top of the supernatant was removed and measured for silver content.

Results and Discussion

Particle Dynamics in Cell Culture Media

The silver nanoparticles are all stable in water and show now variation by UV-Vis or DLS over 72 hours. We have previously shown; however, that the spectra of particles do change over time and that the coating on the nanoparticles plays a role in determining how fast and in what manner the particles change over time in media with FBS [28]. The particles are mixed as a 1:1 mixture of the nanoparticle stock solution (20 μg/ml) and DMEM containing 1% pen/strep and 10% HS with spectral measurements made at 0, 1, 3, 24, 48, and 72 hours. In all five cases, the spectra of the particles in media with HS shows significant differences over time compared to those for particles in media with FBS. Generally, if the spectra maxima shift left or right, this is indicative of the particle shrinking in size (dissolving) or growing in size (agglomerating or seeding from dissolved ions), respectively. Decreases in the absorption maximum indicate agglomeration that has led to the particles settling out of suspension and increases may be the result of a change in the shape of the particle [26]. The data for the particles in media with FBS has been previously published; [28] however, data from the spectra are included in Table 1 for comparison. For citrate particles (Table 1 and Figure 1) the peak maximum of the spectrum decreased much more rapidly between 3 and 24 hours than it did in media supplemented with FBS; however, the total shift of the peak was less, suggesting that particles were aggregating and precipitating from the media. This was observable by eye as a thin red film slowly formed on the bottom of the cuvette. Similarly, for PVP coated particles, the maximum of the spectrum decreased more rapidly from 3 to 24 hours. In media with HS, the intensity of the maximum also continued to drop over the entire time course, whereas in FBS there was an increase in peak intensity after 48 hours. For PEG coated particles, the spectral maximum in media with HS shifted 4 nm to longer wavelength over 72 hours, while in media with FBS it shifted 3 nm in the opposite direction after 72 hours. For lipoic acid functionalized particles, there is no change in the position of the absorbance maximum, while in media with FBS there was a significant shift to longer wavelength of 15 nm over the same time frame. Finally for the BPEI coated particles, the immediate change observed in media with FBS is not observed here, and instead a much slower decrease in the spectral intensity is observed over the entire 72 hour time course. From all of these spectral analyses, it is clear that not only are the particles behaving differently in media with HS, but that each particle is behaving uniquely, not following any specific trend that can be applied to all particles when the type of serum is changed.

Table 1: Summary of the observed plasmonic absorption maxima for commercially tested 40 nm silver nanoparticles in media supplemented with human serum compared to media supplemented with fetal bovine serum. Data in FBS has been previously reported and is included here for comparison [28].


Sample

In HS

In FBS
Initial λmax (nm)

72 hour λmax (nm)

Δ λmax (nm)

Initial λmax (nm) 72 hour λmax (nm)

Δ λmax (nm)

40 nm citrate

424

424 0 423 428

5

40 nm PVP

420

424 4 416 429

13

40 nm BPEI

422

421 1 422 442

20

40 nm PEG

409

413 4 413 410

3

40 nm lipoic acid

434

434 0 421 436

15

fig 1

Figure 1: UV-Vis spectra of 40 nm silver nanoparticles with different surface coatings and functional groups recorded in cell culture media with a final concentration of 5% human male AB serum and 0.5% PEN/STREP. Spectra were recorded immediately upon mixing and then at 1, 3, 24, 48 and 72 h.

We then used DLS to further characterize changes to the size of the particles in the particle media suspensions over time (Table 2). Here, DLS measurements were made every 24 hours for 72 hours. Like with the UV-Vis spectra, the DLS data over time also shows different behaviour of the particles in media with HS compared to what we have previously reported in media with FBS [28]. For both citrate and PVP stabilized particles, the measured hydrodynamic diameter increased significantly over the first 24 hours, then decreased again, while in media with FBS the measured hydrodynamic diameter remained relatively constant throughout the 72 hour time course. For the BPEI stabilized particles, the initial measured diameter was now 50% greater than it was in FBS and decreased after 24 hours, whereas in FBS the particles continued to increase in size throughout the time course. Like for the PVP and citrate coated particles, the lipoic acid coated particles also increased in size at 24 hours, while only the PEG functionalized particles showed similar behaviour in both media. While this seems incompatible with the UV-Vis data, we can assume that the small changes in the spectral maximum of the PEG particles over time measured by UV-Vis and small decreases in size measured by DLS indicate small rearrangements at the particle surface interface with media components and highlight the complexity of quantifying changes to particles in cell culture media when so many components can interact at the particle-media interface. For 3 of the particles coatings, there is a significant change in the measured particle hydrodynamic diameters over the time course compared to data for particles in media with FBS suggesting that the particles age differently in this media and that greater levels of agglomeration likely occur from interactions with media components that do not occur in media with FBS, and that from the UV-Vis data this seems to occur generally within the first 24 hours after introduction of the particles to the media.

Table 2: Z-average hydrodynamic diameter as measured by DLS for commercially tested 40 nm silver nanoparticles in media supplemented with human serum Data is listed as average hydrodynamic diameter (standard error)/PDI value (standard error).

Sample

Initial diameter (nm)/PDI

24 hour diameter (nm)/PDI 48 hour diameter (nm)/PDI

72 hour diameter (nm)/PDI

40 nm citrate

50 (2)/0.56 (0.03)

47.9 (0.8)/0.57 (0.01) 50.2 (0.4)/0.55 (0.05)

48.9 (0.6)/0.54 (0.03)

40 nm PVP

63 (1)/0.46 (0.01)

61 (2)/0.47 (0.01) 52 (01)/0.45 (0.03)

50 (2)/0.44 (0.02)

40 nm BPEI

114.5 (0.8)/0.26 (0.01)

141 (3)/0.6 (0.1) 76.5 (0.7)/0.42 (0.02)

68.1 (0.4)/0.36 (0.03)

40 nm PEG

133 (2)/0.18 (0.01)

203 (9)/0.6 (0.1) 96.2 (0.9)/0.45 (0.02)

85 (3)/0.40 (0.05)

40 nm lipoic acid

89.9 (0.9)/0.19 (0.01)

143 (5)/0.44 (0.01) 100 (1)/0.25 (0.01)

91 (2)/0.26 (0.01)

Toxicity of AgNPs

Toxicity of the nanoparticles was measured by an MTT assay in HepG2 and SH-SY5Y cells. We have previously shown that this assay is a reliable and highly reproducible assay for measuring the cytotoxicity of silver nanoparticles in these cell lines and continued to use these cell lines because of the high levels of nanoparticles that end up in the liver after exposure to circulation, and the known persistence of silver nanoparticles in the brain after prolonged or targeted exposure [29,30]. Silver nanoparticles are also affective anti-microbial agents [6,7,9,31-34] and their use to fight infection could be improved by understanding how to modulate their uptake by and toxicity to human cells via modified surface chemistry while still retaining their antimicrobial activity.

Again, cells are grown in media with HS and particles are tested in this media, to better understand how particles modified by HS exposure behave differently in in vitro assays (Table 3). In HepG2 cells, all of the particles are significantly more toxic compared to when exposed in media with FBS except for the particles coated with lipoic acid which are slightly less toxic. The IC50 values for the PVP and citrate stabilized particles are lower by a factor of two showing a very significant increase in cytotoxicity against this cell line under these conditions. The values in the SH-SY5Y cells are less consistent. Very significant increases in toxicity are observed for the citrate and BPEI stabilized particles, while changes for the PVP and lipoic acid stabilized particles are about the same, and the PEG stabilized particles are significantly less toxic under these conditions. These changes highlight the need to carefully interpret in vitro toxicity data as the choice of media and cell line can skew the measured results raising or diminishing the potential threat posed by exposure to the particles. And changes in how particles agglomerate under specific media conditions may contribute to their rate of endocytosis into cells. There is clearly a need for better in vitro testing methods and a broad selection of both cell lines and media conditions to better mimic in vivo conditions, as the nanoparticles are highly susceptible to subtle changes in their immediate aqueous environment.

Table 3: IC50 values using an MTT assay for 40 nm silver nanoparticles with different surface coatings in two cell lines after 72 h and are reported in μg silver/mL in media supplemented with human serum compared to media supplemented with fetal bovine serum which has been previously reported [28]. For AgNO3 the IC50 value is reported in μmoles/L.

Sample

In HS

In FBS

HepG2

SH-SY5Y

HepG2

SH-SY5Y

40 nm citrate

0.8 ± 0.2

1.2 ± 0.3 1.8 ± 0.2

4.2 ± 0.3

40 nm PVP

0.9 ± 0.2

1.7 ± 0.2 1.8 ± 0.2

1.7 ± 0.2

40 nm BPEI

0.9 ± 0.3

0.5 ± 0.2 1.3 ± 0.2

2.5 ± 0.2

40 nm PEG

1.0 ± 0.3

5.0 ± 0.4

1.6 ± 0.2

1.8 ± 0.2

40 nm lipoic acid

1.6 ± 0.3

1.3 ± 0.3

1.2 ± 0.2

1.6 ± 0.2

AgNO3

3.5 (0.2)

4.8 (0.3)

3.7 (0.2)

3.2 (0.2)

Uptake of AgNPs by Cells

We next sought to determine if the changes in cytotoxicity data with media with HS could be correlated to changes in particle uptake that may arise from their different stability dynamics that we measured in media with HS (Table 4). In HepG2 cells there is little change in the measured silver in the cells when exposed to the same concentration of PVP, PEG and lipoic acid stabilized particles for the same time in media with HS as with FBS. This seems to counter the notion that the bioavailability of these particles is changing. For the BPEI particle, there is a small increase in the amount of measured silver, and for the citrate particles, a considerable decrease. For the citrate stabilized particles this is particularly odd as the decrease in uptake correlates with an increase in toxicity as opposed to the opposite as we expected. Centrifugation of the media was performed to attempt to measure changes in dissolved silver in the media by removing the particles and proteins in the media, but this did not indicate any difference in dissolved silver content between FBS and HS media; however, it is possible that the dissolved silver is more bio-available through coordination to species unique to HS that enhance their cytotoxicity. This argument, however, is countered by the fact that cytotoxicity of silver nitrate does not change in media with HS against HepG2 cells and the IC50 actually increases against SH-SY5Y cells compared to the IC50 values measured in media with FBS. It is clear that further investigation in required to understand why lower accumulated doses of silver under these exposure conditions are resulting in an increase in the measured cytotoxicity.

Table 4: Metal uptake analysis was performed on cell pellets treated with 40 nm silver nanoparticles with different coatings for 24 h in media supplemented with human serum compared to media supplemented with fetal bovine serum which have been previously reported [28]. Values reported are in ng silver/106 cells.

Sample

In HS

In FBS

HepG2

SH-SY5Y

HepG2

SH-SY5Y

40 nm citrate

12 ± 2

3 ± 1

40 ± 6

63 ± 8

40 nm PVP

30 ± 3

3 ± 1

43 ± 7

28 ± 6

40 nm BPEI

55 ± 6

221 ± 10

32 ± 5

190 ± 10

40 nm PEG

31 ± 3

3 ± 1

30 ± 5

170 ± 10

40 nm lipoic acid

35 ± 4

7 ± 2

31 ± 5

25 ± 6

In SH-SY5Y cells, there is nearly an order of magnitude less silver measured in the cells when using media with HS compared to media with FBS. In the case of BPEI, the silver content is much higher, however, this appears to arise from precipitated large agglomerates that could not be separated from the harvested cells, even with repeated washes, and as such should not be counted as an intracellular accumulation of silver nanoparticles. Ignoring the data for BPEI then, it is also clear from the SH-SY5Y cell data, that there is not a direct correlation between cellular uptake and cytotoxicity. The measured value for BPEI coated particles does correlate with a very low IC50 value, and so we cannot say that there is not an increase in uptake that is driving this increase in toxicity, however, observing black particle agglomerates in the cell pellet suggests that the absolute value reported may not be a true reflection of the actual uptake into the cells. To clarify this we are now pursing various microscopic and single cell sorting techniques to quantify the silver content of the cells.

Conclusion

Assessing the safe use of nanoparticles is critical to the successful implementation of particles to the commercial market space. Measurement of silver nanoparticle cytotoxicity has been performed by several groups with mixed outcomes; however, it is clear that if the intended outcome is toxicity to human cells, then measuring particles under conditions that more closely mimic in vivo conditions is important. Changing the serum in cell culture media from FBS to Human male AB serum has a pronounced effect of the stability of silver nanoparticles, their uptake into cells and their cytotoxicity in HepG2 and SH-SY5Y cells. The increased toxicity does not correlate to uptake or to changes in dissolved silver ion content suggesting a more complex relationship between the particles and media components that are driving the cytotoxicity that is measured. As we continue to test nanoparticles for safety, it is critically important that we advance the quality of the in vitro tests performed and focus on building better models of the in vivo environment as any small changes can have a profound impact on the behaviour of nanoparticles and the myriad of interactions that can occur at their surfaces.

References

  1. Benn T, Cavanagh B, Hristovski K, Posner JD, Westerhoff P (2010) The release of nanosilver from consumer products used in the home. J Environ Quality 39: 1875-1882. [crossref]
  2. Calderon-Jimenez B, Johnson ME, Montoro Bustos AR, Murphy KE, Winchester MR, et al. (2017) Silver Nanoparticles: Technological Advances, Societal Impacts, and Metrological Challenges Front Chem 5: 6. [crossref]
  3. Pourzahedi L, Vance M, Eckelman MJ (2017) Life Cycle Assessment and Release Studies for 15 Nanosilver-Enabled Consumer Products: Investigating Hotspots and Patterns of Contribution. Environ Sci Technol 51: 7148-7158.
  4. Karunamuni R, Tsourkas A, Maidment AD (2014) Exploring silver as a contrast agent for contrast-enhanced dual-energy X-ray breast imaging. Brit J Radiol 87: 20140081. [crossref]
  5. Liang P, Shi H, Zhu W, Gui Q, Ya X, et al. (2017) Oncotarget, Silver nanoparticles enhance the sensitivity of temozolomide on human glioma cells. Oncotarget 8: 7533-7539. [crossref]
  6. Sotiriou GA, Pratsinis SE (2011) Engineering nanosilver as an antibacterial, biosensor and bioimaging material. Current opinion in chemical engineering 1: 3-10. [crossref]
  7. Bhatia D, Mittal A, Malik DK (2016) Antimicrobial activity of PVP coated silver nanoparticles synthesized by Lysinibacillus varians. Biotech 6: 196.
  8. Hartemann P, Hoet P, Proykova A, Fernandes T, Baun A, et al. (2015) Nanosilver: Safety, health and environmental effects and role in antimicrobial resistance Mater Today 18: 122-123.
  9. Hsueh YH, Lin KS, Ke WJ, Hsieh CT, Chiang CL, et al. (2015) The Antimicrobial Properties of Silver Nanoparticles in Bacillus subtilis Are Mediated by Released Ag+ Ions. PloS one 10: 0144306.
  10. Niska K, Knap N, Kedzia A, Jaskiewicz M, Kamysz W, et al. (2016) Capping Agent-Dependent Toxicity and Antimicrobial Activity of Silver Nanoparticles: An In Vitro Study. Concerns about Potential Application in Dental Practice. Int J Med Sci 13: 772-782.
  11. Mori Y, Ono T, Miyahira Y, Nguyen VQ, Matsui T, et al. (2013) Antiviral activity of silver nanoparticle/chitosan composites against H1N1 influenza A virus. Nanoscale research letters 8: 93.
  12. Morris D, Ansar M, Speshock J, Ivanciuc T, Qu Y, et al. (2019) Antiviral and Immunomodulatory Activity of Silver Nanoparticles in Experimental RSV Infection. Viruses 11: 732. [crossref]
  13. Orlowski P, Kowalczyk A, Tomaszewska E, Ranoszek-Soliwoda K, Wegrzyn A, et al. (2018) Antiviral Activity of Tannic Acid Modified Silver Nanoparticles: Potential to Activate Immune Response in Herpes Genitalis. Viruses 10: 524. [crossref]
  14. Poon WL, Alenius H, Ndika J, Fortino V, Kolhinen V, et al. (2017) Nano-sized zinc oxide and silver, but not titanium dioxide, induce innate and adaptive immunity and antiviral response in differentiated THP-1 cells. Nanotoxicology 11: 936-951. [crossref]
  15. Burdusel AC, Gherasim O, Grumezescu AM, Mogoanta L, Ficai A, et al. (2018) Biomedical Applications of Silver Nanoparticles: An Up-to-Date Overview. Nanomaterials 8: 681. [crossref]
  16. DeLoid GM, Cohen JM, Pyrgiotakis G, Demokritou P (2017) Preparation, characterization, and in vitro dosimetry of dispersed, engineered nanomaterials. Nature Protocols 12: 355-371. [crossref]
  17. Azimzada A, Tufenkji N, Wilkinson KJ (2017) Transformations of silver nanoparticles in wastewater effluents: links to Ag bioavailability. Environmental Science: Nano 4: 1339-1349.
  18. Beer C, Foldbjerg R, Hayashi Y, Sutherland DS, Autrup H (2012) Toxicity of silver nanoparticles – nanoparticle or silver ion? Toxicology Letters 208: 286-292. [crossref]
  19. Behra R, Sigg L, Clift MJD, Herzog F, Minghetti M, et al. (2013) Bioavailability of silver nanoparticles and ions: from a chemical and biochemical perspective. Journal of the Royal Society Interface 10: 20130396. [crossref]
  20. Durán N, Silveira CP, Durán M, Martinez DST (2015) Silver nanoparticle protein corona and toxicity: a mini-review. Journal of Nanobiotechnology 13: 55. [crossref]
  21. Guo X, Li Y, Yan J, Ingle T, Jones MY, et al. (2016) Size- and coating-dependent cytotoxicity and genotoxicity of silver nanoparticles evaluated using in vitro standard assays. Nanotoxicology 10: 1373-1384. [crossref]
  22. Meier C, Voegelin A, Pradas del Real A, Sarret G, Mueller CR, et al. (2016) Transformation of Silver Nanoparticles in Sewage Sludge during Incineration. Environmental Science & Technology 50: 3503-3510.
  23. Molleman B, Hiemstra T (2017) Time, pH, and size dependency of silver nanoparticle dissolution: the road to equilibrium. Environmental Science: Nano 4: 1314-1327.
  24. Sharma VK, Siskova KM, Zboril R, Gardea-Torresdey JL (2014) Organic-coated silver nanoparticles in biological and environmental conditions: Fate, stability and toxicity. Advances in Colloid and Interface Science 204: 15-34. [crossref]
  25. Tejamaya M, Romer I, Merrifield RC, Lead JR (2012) Stability of citrate, PVP, and PEG coated silver nanoparticles in ecotoxicology media. Environmental Science & Technology 46: 7011-7017. [crossref]
  26. Kennedy DC, Qian H, Gies V, Yang L (2018) Human serum albumin stabilizes aqueous silver nanoparticle suspensions and inhibits particle uptake by cells. Environmental Science: Nano 5: 863-867.
  27. Kennedy DC, Gies V, Jezierski A, Yang L (2019) Effects of human serum on the stability and cytotoxicity of silver nanoparticles. SN Applied Sciences 1: 1510.
  28. Kennedy DC, Gies V, Jezierski A, Yang L (2019) Changes in the physical properties of silver nanoparticles in cell culture media mediate cellular toxicity and uptake. Journal of Nanoparticle Research 21: 132.
  29. Afifi M, Saddick S, Abu Zinada OA (2016) Toxicity of silver nanoparticles on the brain of Oreochromis niloticus and Tilapia zillii. Saudi Journal of Biological Sciences 23: 754-760.
  30. Antsiferova A, Yu B, Demin V, Kashkarov P, Kovalchuk M, et al. (2015) Extremely low level of Ag nanoparticle excretion from mice brain in in vivo experiments. IOP Conference Series: Materials Science and Engineering 98: 012003.
  31. Jung WK, Koo HC, Kim KW, Shin S, Kim SH, et al. (2008) Antibacterial Activity and Mechanism of Action of the Silver Ion in Staphylococcus aureus and Escherichia coli. Applied and Environmental Microbiology 74: 2171-2178. [crossref]
  32. Le Ouay B, Stellacci F (2015) Antibacterial activity of silver nanoparticles: A surface science insight. Nano Today 10: 339-354.
  33. Salomoni R, Léo P, Montemor AF, Rinaldi BG, Rodrigues M (2017) Antibacterial effect of silver nanoparticles in Pseudomonas aeruginosa. Nanotechnology science and applications 10: 115-121. [crossref]
  34. Tang S, Zheng J (2018) Antibacterial Activity of Silver Nanoparticles: Structural Effects. Advanced healthcare materials 7: 1701503. [crossref]

Layered Double Hydroxide

DOI: 10.31038/NAMS.2020324

Mini Review

Layered double hydroxides (LDHs) or hydrotalcites are inorganic clay materials with many promising properties. LDHs are represented in the general formula: [MII1-xMIIIx(OH)2.[An-x/n.mH2O], where MII and MIII are divalent and trivalent metal ions within the brucite-like layers and An- represents an interlayer anion. The flexibilities of the chemical composition (combination of various M(II) and M(III)) and excellent anion exchange tendency make them highly efficient and potential materials for wastewater treatment, drug deliver and catalysis. The M(II)/ M(III) LDH category (M(II): Mg2+, Fe2+, Co2+, Ni2+, Zn2+ , etc.; M(III): Al3+, Fe3+, Cr3+, etc.). M+ and M4+ cations can also be incorporated in the layers but examples are limited to specific cations such as Li+, Ti4+, and Zr4+. In the layers of LDH hosts, the M2+ and M3+ cations are orderly distributed. The positive charge is balanced by inorganic or organic anions (Cl, NO3, ClO4, CO32-, SO42-, RCO2, etc.) located in the interlayer with variable amounts of interlayer hydration water molecules. The first property inherent to this structure is the anion exchange capacity that occurs through the reaction represented by Equation below.

[MII1-xMIIIx(OH)2.[An-x/n.mH2O] + x/mBn- → [MII1-xMIIIx(OH)2.[Bn-x/n.mH2O], +( x/m)An-

Anion affinity for the LDH interlayer has been found to be based on the size of the ion and its associated charge. Monovalent anions have lower affinities than divalent anions and they are therefore more likely to precipitate in anion-exchange reactions. The ease of exchange of monovalent anions is in the order OH> F>C1> Br>NO3. Divalent anions such as SO42- and CO32-, have higher selectivity than monovalent anions. Therefore, the most suitable LDH for anion-exchange syntheses are those that have monovalent anions in the interlayer due to the relative ease of exchange [1-4].

LDH compounds have been synthesized by direct methods, which include coprecipitation [5-8], sol-gel synthesis [9-12], chimie douce [13], salt oxide reaction [14-16], hydrothermal growth [17,18] and electrochemical synthesis [19-24]. Indirect methods include all syntheses that use an LDH as a precursor. Examples of these are all anion exchange based methods such as direct anion exchange, anion exchange by acid attack with elimination of the guest species in the interlayer region and anion exchange by surfactant salt formation [25,26]. The non-anion exchange methods include the delamination-restacking method [27-30] and LDH reconstruction method [31,32].

LDHs are reported as very efficient drug nanovehicles [33,34]. In comparison to other inorganic nanovehicles, including silica and gold nanoparticles, quantum dots, and carbon nanotubes, they are featured with excellent biocompatibility [35], high drug loading capacity [36], and pH-responsive property [37], with biodegradability in the cellular cytoplasm [38]. Such outstanding properties make LDHs an efficient non-viral drug delivery vehicle, and also a reservoir for bioactive or bio-fragile molecules. Note that the intercalated drugs can be released either by deintercalation through anionic exchange with the surrounding anions (such as Cl and phosphate), or through the acidic dissolution of LDH hydroxide layers.

LDHs are regarded as a valuable adsorbent for removal of heavy metals and wastewater treatment arising from their unique properties including their high stability and other physicochemical properties [39]. Environmental problems associated with the use of highly mobile herbicides are of current concern because of the increasing presence of the agrochemicals in ground and surface waters. Anionic herbicides are of particular concern because they are weakly retained by most of the components of soil sediment, so they remain dissolved in the soil solution and can rapidly move around [40]. One approach to minimizing such transport losses is to use controlled release formulation in which the herbicides and drugs are incorporated in a matrix or carrier before application, thereby limiting the amount available for unwanted processes [41-43]. LDHs were widely used in the removal of Cr (VI) ions from solutions as reported in many studies [44,45] and, recently, they are used in Cr (VI) soil remediation [46].

Conclusion

Layered double hydroxide is an inorganic materials with the surface positive charge that can be synthesized by different techniques and highly applicable for environmental remediation and drug delivery.

References

    1. Mukarram Zubair, Muhammad Daud, Gordon McKay, Farrukh Shehzad, Mamdouh A Al-Harthi (2017) Recent progress in layered double hydroxides (LDH)-containing hybrids as adsorbents for water remediation. Applied Clay Science 143: 279-292.
    2. Rives V, Ulibarri AM (1999) Layered double hydroxides (LDH) intercalated with metal coordination compounds and oxometalates. Coord Chem Rev 181: 61-120.
    3. Gu Z, Atherton JJ, Xu ZP (2015) Hierarchical layered double hydroxide nanocomposites: structure, synthesis and applications. Chem Commun 51: 3024-3036.
    4. Daud M, Kamal MS, Shehzad F, Al-Harthi MA (2016) Graphene/layered double hydroxides nanocomposites: a review of recent progress in synthesis and applications. Carbon 104: 241-252.
    5. Feitknecht WV (1942) Über die Bildung von Doppelhydroxyden zwischen zweiund dreiwertigen Metallen. Helvetica Chimica Acta 25: 555-569.
    6. Reichle WT (1986) Synthesis of anionic clay minerals (mixed metal hydroxides, hydrotalcite). Solid State Ionics 22: 135-141.
    7. Reichle WT (1985) Catalytic reactions by thermally activated, synthetic, anionic clay minerals. Journal of Catalysis 94: 547-557.
    8. Miyata S (1983) Anion-exchange properties of hydrotalcite-like compounds. Clays Clay Miner 31: 305-311.
    9. Tadanaga K, Miyata A, Ando D, Yamaguchi N, Tatsumisago M (2012) Preparation of Co–Al and Ni–Al layered double hydroxide thin films by a sol– gel process with hot water treatment. Journal of sol-gel science and technology 62: 111-116.
    10. Chubar N, Gerda V, Megantari O, Mičušík M, Omastova M, et al., (2013) Applications versus properties of Mg–Al layered double hydroxides provided by their syntheses methods: Alkoxide and alkoxide-free sol–gel syntheses and hydrothermal precipitation. Chemical engineering journal 234: 284-299.
    11. Jitianu M, Zaharescu M, Bãlãsoiu M, Jitianu A (2003) The sol-gel route in synthesis of Cr (III)-containing clays. Comparison between Mg-Cr and Ni-Cranionic clays. Journal of sol-gel science and technology 26: 217-221.
    12. Prinetto F, Ghiotti G, Graffin P, Tichit D (2000) Synthesis and characterization of sol–gel Mg/Al and Ni/Al layered double hydroxides and comparison with coprecipitated samples. Microporous and Mesoporous Materials 39: 229-247.
    13. Delmas C, Borthomieu Y (1993) Chimie Douce Reactions: A New Route to Obtain Well Crystallized Layer Double Hydroxides. Journal of solid state chemistry 104: 345-352.
    14. De Roy A, Forano C, El Malki K, Besse JP (1992) Anionic clays: trends in pillaring chemistry. In Expanded Clays and other microporous solids 108-169.
    15. De Roy A, Forano C, Besse JP (2001) Layered double hydroxides: Synthesis and post-synthesis modification. Layered Double Hydroxides: Present and Future 1-39.
    16. Boehm HP, Steinle J, Vieweger C (1977) [Zn2Cr (OH) 6] X·2H2O, New layer compounds capable of anion exchange and intracrystalline swelling. Angewandte Chemie International Edition 16: 265-266.
    17. Prevot V, Caperaa N, Taviot-Gueho C, Claude Forano (2009) Glycine-assisted hydrothermal synthesis of nial-layered double hydroxide nanostructures. Crystal Growth & Design 9: 3646–3654.
    18. Kloprogge, JT, Hickey L, Frost RL, (2004) The effects of synthesis pH and hydrothermal treatment on the formation of zinc aluminum hydrotalcites. J Solid State Chem 177: 4047-4057.
    19. VishnuáKamath P, Loknathan I (1994) Electrogeneration of base by cathodic reduction of anions: novel one-step route to unary and layered double hydroxides (LDHs). Journal of Materials Chemistry 4: 1487-1490.
    20. Yarger MS, Steinmiller EM, Choi KS (2008) Electrochemical synthesis of Zn−Al layered double hydroxide (LDH) films. Inorganic chemistry 47: 5859-5865.
    21. Li Y, Zhang L, Xiang X, Yan D, Li F (2014) Engineering of ZnCo-layered double hydroxide nanowalls toward high-efficiency electrochemical water oxidation. Journal of Materials Chemistry A 2: 13250-13258.
    22. Scavetta E, Ballarin B, Gazzano M, Tonelli D (2009) Electrochemical behavior of thin films of Co/Al layered double hydroxide prepared by electrodeposition. Electrochimica Acta 54: 1027-1033.
    23. Liu X, Ma R, Bando Y, Sasaki T (2012) A general strategy to layered transitionmetal hydroxide nanocones: tuning the composition for high electrochemical performance. Advanced Materials 24: 2148-2153.
    24. Fang J, Li M, Li Q, Zhang W, Shou Q, et al., (2012) Microwave-assisted synthesis of CoAl-layered double hydroxide/graphene oxide composite and its application in supercapacitors. Electrochimica Acta 85: 248-255.
    25. Olfs HW, Torres-Dorante LO, Eckelt R, Kosslick H (2009) Comparison of different synthesis routes for Mg–Al layered double hydroxides (LDH): Characterization of the structural phases and anion exchange properties. Applied Clay Science 43: 459-464.
    26. Meyn M, Beneke K, Lagaly G (1990) Anion-Exchange Reactions of Layered Double Hydroxides. Inorganic Chemistry 29: 5201-5207.
    27. O’Leary S, O’Hare D, Seeley G (2002) Delamination of layered double hydroxides in polar monomers: new LDH-acrylate nanocomposites. Chemical Communications 21: 1506-1507. [crossref]
    28. Wang Q, O’Hare D (2012) Recent advances in the synthesis and application of layered double hydroxide (LDH) nanosheets. Chemical reviews 112: 4124-4155. [crossref]
    29. Wu Q, Sjåstad AO, Vistad ØB, Knudsen KD, Roots J, et al., (2007) Characterization of exfoliated layered double hydroxide (LDH, Mg/Al=3) nanosheets at high concentrations in formamide. Journal of Materials Chemistry 17: 965-971.
    30. Hibino T (2004) Delamination of layered double hydroxides containing amino acids. Chemistry of materials 16: 5482-5488.
    31. Miyata S (1983) Anionic exchange properties of hydrotaicitelike compounds. Clays Clay Miner 31: 305-311.
    32. Sato T, Okawaki A (1991) Intercalation of benzenecarboxylate ions into the interlayer of hydrotalcite. Solid State Ionics 45: 43-48.
    33. Saha S, Ray S, Acharya R, Chatterjee TK, Chakraborty J (2017) Magnesium, zinc and calcium aluminium layered double hydroxide-drug nanohybrids: A comprehensive study. Appl Clay Sci 135: 493-509.
    34. Naz S, Shamoon M, Wang R, Zhang L, Zhou J, et al., (2019). Advances in therapeutic implications of inorganic drug delivery nano-platforms for cancer. Int J Mol Sci 20: 965. [crossref]
    35. Choi SJ, Choy JH (2011) Layered double hydroxide nanoparticles as target-specific delivery carriers: Uptake mechanism and toxicity. Nanomedicine 6: 803-814. [crossref]
    36. Lv F, Xu L, Zhang Y, Meng Z (2015) Layered Double Hydroxide Assemblies with Controllable Drug Loading Capacity and Release Behavior as well as Stabilized Layer-by-Layer Polymer Multilayers. ACS Appl Mater Interfaces 7: 19104-19111. [crossref]
    37. Choi G, Lee JH, Oh YJ, Choy YB, Park MC, et al., (2010) Inorganic-polymer nanohybrid carrier for delivery of a poorly-soluble drug, ursodeoxycholic acid. Int J Pharm 402: 117-122.
    38. Gu Z, Zuo H, Li L, Wu A, Xu ZP (2015) Pre-coating layered double hydroxide nanoparticles with albumin to improve colloidal stability and cellular uptake. J Mater Chem 3: 3331-3339.
    39. Basu D, Das A, Stockelhuber K, Wagenknecht U, Heinrich G (2014) Advances in layered double hydroxide (LDH)-based elastomer composites. Progress in Polymer Science 39: 594-626.
    40. Cardoso LP, Valim JB (2006) Study of acids removal by calcined Mg-Al-CO3-LDH. Journal of Physics and Chemistry of Solid 67: 987-993.
    41. Ambrogi V, Fardella G, Grandolini G, Perioli L (2001) Intercalation compounds of hydrotalcite-like anionic clays with antiinflammatory agents—I. Intercalation and in vitro release of ibuprofen. Int J Pharm 220: 23-32. [crossref]
    42. Khan AI, Lei L, Norquist AJ, O’Hare D (2001) Intercalation and controlled release of pharmaceutically active compounds from a layered double hydroxide. Chem Commun 22: 2342-2343. [crossref]
    43. Oh JM, Park M, Kim ST, Jung JY, Kang YG, et al., (2006) Efficient delivery of anticancer drug MTX through MTX- LDH nanohybrid system. J Phys Chem Solids 67: 1024-1027.
    44. He X, Qiu X, Chen J (2017) Preparation of Fe (II)-Al layered double hydroxides: application to the adsorption/reduction of chromium. Colloids and Surfaces A: Physicochemical and Engineering Aspects 516: 362-374.
    45. Leite VdSA, Jesus BGLD, Duarte VGDO, Constantino VRL, Izumi CMS, et al., (2019) Determination of chromium (VI) by dispersive solid-phase extraction using dissolvable Zn-Al layered double hydroxide intercalated with l-Alanine as adsorbent. Microchemical Journal 146: 650-657.
    46. He X, Zhong P, Qiu X (2018) Remediation of hexavalent chromium in contaminated soil by Fe (II)-Al layered double hydroxide. Chemosphere 210: 1157-1166.

Stroke Survivors’ Experiences of Early Person- Centered Rehabilitation at Home – Living in Sparsely Populated Areas

DOI: 10.31038/JNNC.2020331

Abstract

Aim: The aim was to illuminate the situation of patients with stroke in sparsely populated areas and their experience of person-centred rehabilitation at home.

Methods: Fourteen persons with stroke who had received Early Supported Discharge home- rehabilitation following stroke were interviewed. The data were analyzed with a qualitative content analysis method.

Results: The analysis resulted in one overall theme: Living a life with a new version of me 2.0, built up from three categories: A new strengthen sense of self, Being at home creates trust and self-management and Environmental factors essential for rehabilitation at home.

Conclusion: The results exposed that early home rehabilitation in sparsely populated area following stroke influences the person’s possibilities to return to the life they lived before. Living a life with the new version of me 2.0 includes conditions related to prerequisites of own empowerment and the importance of both relativities and professionals.

Keywords

Early supported discharge, Home, Multidisciplinary team, Person-centered rehabilitation, Rehabilitation, Stroke

Stroke is an important cause of disability and mortality worldwide [1,2]. In Sweden, approximately 25,000-30,000 are affected by stroke annually and stroke is one of the major causes of hospital admissions. People with stroke in the north of Sweden can be offered home-based rehabilitation, also known as Early Supported Discharge (ESD). Stroke patients may therefore be discharged from inpatient care to their home, if they meet the functional, cognitive and social criteria for ESD. Early rehabilitation at home with a multidisciplinary team is recommended for patients with minor to moderate symptoms after a stroke [3,4]. A systematic review evaluated the effectiveness of home vs. centre based rehabilitation and found that interventions should shift towards more home-based rehabilitation following stroke [5]. It has also been reported that persons with stroke often select home-based rehabilitation, when getting the option [6].

Rehabilitation at home stimulates the patient to participate actively in their rehabilitation and set goals for the future [7]. Rehabilitation at home also improves patient satisfaction and the number of days in hospital are reduced by several days [4,8]. Although, a stroke often causes motor impairments and a range of highly variable cognitive impairments [9-11]. The first year is a challenging for both stroke patients and informal caregivers [12,13]. The patient may suffer negative psychosocial effects because of the body being unreliable and the patient’s self-identity, role and social relations may also be negatively affected [14,15]. A person with stroke may have an altered life instead of going back to life as it was before the stroke. The altered life may have an impact on the person’s capacity to learn and adapt to a change in the environment [16]. Overall, a person-centred rehabilitation needs to include biopsychosocial and spiritual aspects, preferences, experience’s and the right to make decisions about one´s treatment [17,18]. It is about respecting, differences and deviation and having an inclusive attitude to the ways people view their own embodiment [19]. Living in a sparsely populated area, includes specific challenges such as long distances to receive rehabilitation. These conditions place high demands on the person, family members and their social network. Rehabilitation at home enables adaptation of the environment and provides opportunities for the patient to practice skills that are important for them. There are no studies regarding stroke patient’s own perspective, of undergoing home-based rehabilitation in sparsely populated areas from true person-centred perspective [20]. Such knowledge may support health care providers to develop individual interventions at home and support transition from rehabilitation units to the home in this specific area.

Context

The study involved patients in two municipalities in the northernmost county in Sweden. Norrbotten comprises about a quarter of the land area of Sweden but has only 250 000 inhabitants. Most of the participants in this study live in sparsely populated areas with long distance to facilities where rehabilitation is available.

Aim

The aim was to illuminate the situation of patients with stroke in sparsely populated areas and their experience of person-centred rehabilitation at home.

Method

Participants

Fourteen stroke patients participated in the study. Interviews were held with 8 women and 6 men with an average age of 78 years (Table 1). The inclusion criteria’s were that;(i) the person had a first time injury from a stroke, (ii) the person had received home based rehabilitation through the team from the hospital in northern Sweden; (iii) at least three months had elapsed since the person had the stroke, (iv) the person was able to share his/her experiences during an interview.

Table 1: Description of the participants in the study.

Participant

Sex Age (years) Marital status Accommodation

Severity of stroke

1

Female

83 Cohabitating Apartment

Mild

2

Female

53 Single House

Moderate

3

Female 77 Cohabitating House Moderate

4

Female 76 Cohabitating House

Moderate

5

Female 74 Single Apartment

Moderate

6

Female 53 Cohabitating House

Moderate

7

Female 85 Single Apartment

Moderate

8 Male 88 Single House

Mild

9

Male 74 Cohabitating Apartment

Severe

10

Female 69 Cohabitating House

Moderate

11

Male 90 Single House

Moderate

12

Male 83 Cohabitating Apartment

Mild

13

Male 76 Cohabitating House

Moderate

14

Male 82 Cohabitating House

Moderate

Study Design

A qualitative interview study with a content analysis approach was performed [21].

Procedures

To obtain participants the first author contacted the professionals in stroke rehabilitation at the hospital. A purposive sampling was made and the patients who fulfilled the inclusion criteria were selected by health care professionals at the rehab units. The persons who were interested received more information about the study from the first author. The patients were given oral and written information about the study and thereafter, written consent was given by the patient. The study was approved by the Ethical Review Board in Umeå, Sweden (Reg. no. 2017/512-31).

Program

The ESDs were carried out from one hospitals in northern Sweden. The goals for the rehabilitation were established in collaboration between the professionals and the patient. An individually designed intervention plan was constructed and all interventions were performed in patients’ homes. The rehabilitation team consisted of: occupational therapist, physiotherapist, counselor, physician and nurse. The intensity and length of the rehabilitation period were based on the patients’ needs and progress.

Data Collection

Individual interviews were conducted in the participants’ homes by the first author who was not involved in the rehabilitation. The interview started with the question “Could you please tell me what happened when you had your stroke”? The interviews were semi-structured and covered a variety of topics (Table 2). The participants were encouraged to talk about their experiences regarding their stroke. The narration was supported with questions such as “Can you please explain more?” or “What happened then?” Each interview lasted about 30 minutes.

Table 2: Main topics of the interview.

1. The day you had your stroke
2. Perceived consequences of the stroke
3. Thoughts about rehabilitation at hospital
4. Thoughts about rehabilitation at home
5. Any other topics not already covered

Data Analysis

The verbatim transcriptions were analyzed using qualitative content analysis inspired by Graneheim and Lundman [21] to discover the underlying meaning of the text. All authors were involved in all steps of the analysis of the text. Each interview text was read through to gain an initial understanding of the material as a whole. As a first step, the interview text was divided into meaning units related to the aim of the study. Thereafter the meaning units were condensed using a description close to the text to maintain the meaning of the original text (Table 2). The condensed meaning units were coded and sorted into different categories identified through discussion and reflection among the authors. Throughout the analysis, the authors went back to the original text to validate the findings in the categories.

Results

The analysis of the interviews resulted in one overall theme: Living my life with a new version of me 2.0. The theme represents the participants’ development of their empowerment by having rehabilitation at home. The participants described how the stroke had changed them and how the rehabilitation was customized to suit their individual needs. Rehabilitation at home strengthened them as a person and made them take greater responsibility for their rehabilitation. The contextual factors such as collaboration and partnership with others were also highlighted. This theme was made up of three categories (1) A new strengthened sense of self, (2) Being at home promotes confidence and self-management, (3) Contextual factors are essential for rehabilitation at home. The categories with underlying sub-categories are all presented in Table 3.

Table 3: Illustration of the analysis process from meaning unit to category.

Meaning unit

 Condensed meaning unit Code

Category

Because I continually told them “I can do this now”, they could see that I could do this (walk down the steps to the basement). And I felt a sense of achievement and that my self-confidence was coming back and I dared to let go Demonstrating one’s progress and feeling growing self-confidence Feeling competent A new strengthened sense of self

Category 1: A New Strengthened Sense of Self

The category: A new strengthened sense of self was created from the subcategories; Time for reflection; Increased confidence in one’s own ability and Person-centered approach. Rehabilitation at home gave the participants a sense of mental strength and stamina and the participants felt involved in their own rehabilitation and they expressed greater self-determination (Table 4).

Table 4: Illustration of the results.

Theme: Living my life with the new version of me 2.0

Category

Subcategory

A new strengthened sense of self ·         Time for reflection

·         Increased confidence in one’s own ability

·         Person-centred approach

Being at home promotes confidence and self-management ·         Goal directed training of body functions and activities in a real                                  environment

·         Development of new strategies

·         Empowerment and own responsibility

Contextual factors are essential for home rehabilitation ·         Partnership between clients, relatives and professionals                                            strengthens the outcome

·         Collaboration between all parties is a prerequisite for                                                successful rehabilitation

Category 1:1 Time for Reflection

The participants reflected over how their functionality had changed. One participant said: “Maybe my brain needed to rest after the stroke because everything was gone. Oh, my God! I had been working with economy and now everything was gone!” (person 14). Initially, the participants were overwhelmed that they had survived, now they were trying to return to their life as it was before. They talked about listening to signals from the body and not be controlled by all the “musts”. “I started to plan in my head…thinking about the things I had to do…but I have tried to let thoughts like that go away and instead relax, just consciously stop thinking about all demands” (person 8). Another participant talked about struggling with thinking in a different way when her power was limited: “You see, I have not cut the grass yet which I usually do but I thought …what beautiful flowers, there’s nothing wrong with just looking at the flowers” (person 6). They reflected on their own role when the rehabilitation was performed at home. Some participants reflected on the possibility of seeing a counsellor if needed. One participant described the general anxiety he experienced following his stroke: “I suffer from anxiety at times and I have medication for that but I don’t think it works very well…it is latent all the time and I’m not worried about anything specific … it’s general anxiety” (person 11).

Category 1:2 Increased Confidence in One’s Own Ability

The participants described how the professionals encouraged them to do things they did not believe they were able to do. “Rehabilitation at home is worth so much. My husband said to me: ‘You must use the wheelchair when you are at home and you must not walk without a cane’. Then the occupational therapist and physiotherapist came home and put a walking belt on me and said: We are not going to hold you because you can manage yourself now” (person 1). The same person described how the professionals literally lifted her from the wheelchair to an upright position on her feet. Another participant felt that the stroke had made her feel like he was not good enough for anything. However, she also expressed how she felt increasingly better over time. “The professionals told me ‘You can do everything by yourself” (person 2). The professionals seemed to have the ability to get the participants to challenge their boundaries and feel more confident about their abilities. “I held on with my left hand and it worked out so I have walked up and down several times and that made my self-confidence coming back and I dared to let go” (person 1). Another participant expressed similar thoughts: “Being in control of my own rehabilitation gives mental strength” (person 11).

Category 1:3 Person Centered Approach

The participants emphasized that they were seen as being the experts on themselves and what was important for them. “I felt that they saw me… I felt that I was important. I am a V.I.P …so they are coming to my home” (person 1.) The feeling of being seen and acknowledged as a person was mentioned many times in the interviews. “They [health care professional]asked me what was important to me and how I wanted things to be, I said that I wanted to be able to do things that I had done before” (person 6). Another participant expressed it as follows: “At home, you are in the right environment and you can see what you need to train so you can manage at home…what is best for me” (person 12). The analysis revealed that the patients really appreciated being asked what was important to them. The support from the professionals was invaluable in the patients’ efforts to become independent and return to a good life. However, sometimes it was necessary to limit the amount of training. “She said it was enough for me to train three times a week because it wasn’t good for me to exercise too much, but I’m that kind of person, unfortunately” (person 4).

Category 2: Being at Home Promotes Confidence and Self-Management

This category was made up of the following subcategories: Goal directed training of body functions and activities in a real environment, Development of new strategies and Empowerment and own responsibility. The category revealed that home rehabilitation supported the participants’ self-efficacy. The support from professional healthcare providers was perceived as a privilege. Performing activities and exercising in one’s own home gave a feeling of harmony and security. The participants also talked about taking responsibility themselves, as well as being given alternatives from the healthcare professionals.

Category 2:1 Goal Directed Training of Body Functions and Activities in a Real Environment

The participants decide what goals were most important for them and together with the professionals, they drew up a feasible schedule: “The first plan is to manage to walk to the grocery store, even if they are walking behind me with the wheelchair…however, I will at least be able to walk there. Then I will try to be more sociable and part of the community again” (person 4). Rehabilitation at home was described as exercises aiming to improve balance, the ability to walk, training of hand function, training the memory and so on. The participants talked about how they trained different body functions with and without assistive devices. “We practiced throwing a ball to each other; we trained our sense of balance. I had a walker that I had borrowed and taken home; I think I used it twice” (person 8). Regarding the home environment one participant said “I think it’s different and better when I’m at home because I am in control of things myself”. (person 8). Rehabilitation at home was seen as being a good start but one participant said that training together with others was even better “It is nice to share experiences with others” (person 5). Not all participants understood the purpose of having rehabilitation at home. One participant said that rehabilitation could be more effective at hospital while another thought that it was enough with natural recovery: “Yes, it [the function] has returned and it’s getting better and better so I don’t know if there is any point training any more”(person 14). It came up that it was difficult for the participants to know whether the staff came from the municipality or from the county council and what the training they should do consisted of: “The girls helped me to train there [at the hospital] and they came home and watched me exercising…yes, those straps, I was supposed to pull them 40 times and I said that I usually pulled them 140 times” (person 9).

Category 2:2 Development of New Strategies

Many participants described how they had to create new strategies after their body functions had changed after the stroke. “I was wondering if I would be able to use my baking machine again. I have it in a wardrobe … but then I found out that if I take my walker …. I can lift it up on it, I think I will manage that and then I can roll the walker to the kitchen and lift the machine up on the worktop in the kitchen” (person 2). The participants also expressed the importance of being able to rest after exercising and that was easier at home. ”At home, I am able to rest whenever I want” (person 3). If they had to go to the hospital for rehabilitation, it would have entailed long, tiring journeys by car or bus. When they have rehabilitation in their home, new strategies developed based on the needs in daily life. Several participants pointed out the importance of being independent in daily activities at home. They described how they had trained and developed strategies for being able to perform activities at home “I had to practice grabbing and holding things with my left hand. Then I knew I would be able to chop vegetables” (person 4). Some participants mentioned that new strategies arose when they got new assistive devices.

Walking with a walker required space which implied changes in the environment.“When I came home, it was so cluttered…I had several armchairs. I thought, oh dear, how I can walk here? Now I have rearranged things”… (person 6).

Category 2:3 Empowerment and Own Responsibility

The participants talked about being in charge of their own rehabilitation and responsible for ensuring that the exercises were done. One participant said:”The purpose of rehabilitation is to do the exercises by myself. I make a schedule and report what I have done and also what I should do” (person 11). At the start of the rehabilitation process, it was obvious that the participants did not have much confidence and faith in their own abilities. Some participants described they were afraid of falling as a result of their deteriorated balance. Being able to train body functions with the support of the professionals was described as a valuable contribution to improved function and thus it increased the participants’ confidence in their own ability. One of the participants expressed it like this: “They have taken a real interest in me, this is what I can do now and I am able to say: We don’t need to train that, I can already do it. Being able to tell them that I have filled the dishwasher and that I try to train my left hand all the time by, for instance, hanging up laundry, it has not been so easy, clothes pegs and my fingers get stuck everywhere” (person 1).

Category 3: Contextual Factors are Essential for Home Rehabilitation

This category is made up of the subcategories: Partnership between clients, family members and professionals strengthens the outcome and collaboration between all parties is a prerequisite for successful rehabilitation. The category represents factors which the participants mentioned had had an impact on the implementation of rehabilitation in the home, for example, support from family members and social and professional support.

Category 3:1 Partnership between Clients, Family Members and Professionals Strengthens the Outcome

The participants were happy to be able to return home after a period at hospital but they described being tired and in need of various kinds of help, for example, help with household chores, cooking, shopping and fixing things in the home. Some of the participants had help from municipal homecare services. Professionals from the healthcare sector were important because, in addition to rehabilitation, they provided security and safety. Many participants said they had support from family members and friends as well. One participant said: “After all, I have had a cohabitant who has done everything” (person 13). One participant described how much she appreciated the help she had been given by her daughter, both with cooking and help with going to the toilet during the night. “My greatest happiness was when I was able to get in and out of bed at night and go to the toilet by myself so my daughter no longer had to get up twice a night to help me” (person 4). The participants also talked about the importance of taking advantage of the professionals’ competence and working together with them to get as much as possible out of the rehabilitation at home: “The professionals knew what kind of rehabilitation I needed, namely, training hand functions and balance” (person 3).

Category 3:2 Collaboration between all Parties is a Prerequisite for Successful Rehabilitation

Some participants had a number of different healthcare providers involved in their care and rehabilitation, for example, both municipal and county council professionals. Some of the participants also had municipal homecare with staff who were involved in walking exercises, for example. Sometimes, the different cultures and different laws, rules, and budgets could clash and therefore, a coordinated individual plan was drawn up with all the organizations’ involved and the patient was able to express his/her own desires and needs: “We had a meeting at the hospital before I was discharged and sent home… so we knew that they (the rehabilitation professionals) were coming to our home and we had some information about that but …” The participant who had his partner as a prompter because of verbal difficulties said: “It has been difficult, they (the homecare professionals) have not been involved… it is stated in the decision taken by the care assistance officer… the help given was sporadic and they asked: Do you want to walk with the walker?” but there was no regularity with that either… it did not work” (person 10). Another participant said that it worked very well when he came home: “I don’t remember exactly but as far as I can remember, the homecare services worked well right from the start. They came in the morning to see if I was alive: I learned to walk, leave the … walk without support”(person 7).

Discussion

The main results revealed that rehabilitation at home following a stroke helped the patients to become a new version of themselves, including a strengthened sense of self and greater confidence with regard to self-management. The results showed that contextual factors were perceived as being significant for successful home rehabilitation. The results indicated that the stroke and the rehabilitation given at home after the stroke influenced the participant’s thoughts about who they were and who they wanted to become. Many of the participants reflected on how their life had changed and they thought a lot about what is really important in life Was it a matter of being independent and having a body with the same functionality as before the stroke or was it something else? In rehabilitation, the physical body is referred to in medical terms which can lead to all the other values of the body and its potential being neglected [19]. A human being is not only capable of performing motor tasks through bodily processes; humans are those processes and that is what constitutes a person. Together, the motor system, the proprioceptive system and the sensorial system provide bodily functions, and at the same time form the foundation of one’s self-identity [22]. During the period of rehabilitation at home, the participants highlighted the support provided by the professionals and how it strengthened their confidence in their own capability. Another outcome was that several participants pointed out that the professionals had encouraged them to believe in their own abilities.

The participants in the study described that they had been seen as playing an active role in their own rehabilitation which is in line with the ICF where patient participation is a core component of rehabilitation as well as the person (patient) centered approach [23-25]. In the person/patient centered approach, the professionals are supposed to confirm the experiences and interpretation of illness that the patients depict. The approach is based on mutual respect and understanding, and the promotion of patients’ right to self-determination [26]. The goal of person centered care is to provide medical care and rehabilitation that is concordant with the patients’ cultural values, needs and preferences. Living in a rural areas brings challenges that differ from those when living in urbanized areas. Public transport is infrequent, the distances to health care and other services can be considerable. Therefore, early stroke rehabilitation at home is an opportunity for persons living in rural areas to receive high quality rehabilitation, but it also demands efforts from relatives, friends and the surrounding environment. It is also an important factor linked to the quality of personal, professional and organizational relationships [27]. Patient centered care is now reported as one of six elements of highquality care in the Institute of Medicine’s quality chasm report [28]. According to NICE guidance regarding a safe rehabilitation after stroke a personcentered approach is recommended. Individualized goal setting is also recommended as well as involving the patient and his/her family members or careers in discussions [29].

The participants appreciated having rehabilitation at home. For them, it was positive to have the opportunity to train in their home environment and to be able to rest when they needed to. Coming home, the participants had to decide which functions they felt were the most important for them to train. A goal directed approach to training is meant to increase the person’s ability to be engaged in meaningful activities [30]. The person’s ability, the goal and the environment are the core components in how movement patterns emerge [31]. This is in line with occupational therapy knowledge which means that performance of activities is an interaction between the person, the environment and the occupation [32,33]. This coincides well with the purpose of home based rehabilitation after a stroke where the participants had customized training which matched the goals the patients had chosen in the environment where they were living their everyday lives. A study in Lancet showed that for therapy-based rehabilitation for persons after a stroke, living at home could reduce the risk of deterioration in ability to perform activities in daily life [34]. It is also concluded that patients are more likely to improve if they practice tasks at home in convenient blocks of 20 minutes a few times a day when they select tasks they are motivated to add to their daily activities. Persons who had rehabilitation at home even decreased sitting time, added more steps and walking time compared with the time when they were in hospital [31].

Rehabilitation at home highlighted the need for new strategies for coping with tasks that had been easy to do previously. The concept of self-management, which is a process that develops skills and strategies to manage the physical, psychological and social effects of chronic illness [35,36] corresponds well with this. Self-efficacy is important in the construction of self-management, which emphasizes how important it is that the individuals believe in their own abilities [37]. According to a study, stroke survivors and physiotherapists view the meaning of self-management as being about ‘doing things for yourself and ‘looking after yourself’, ‘taking an active role in rehabilitation’ and ‘managing one’s recovery and health’. The individual’s role of taking responsibility was also highlighted in the study [38]. A stroke often has an impact on the health and quality of life of many persons, not only the person who experienced the stroke. The family members, friends and people who care for the survivor may be involved. According to Lou et al, patients in collaboration with their partners willingly took responsibility for their own rehabilitation regarding physical, emotional and biographical recovery [39]. Even if they saw themselves as being responsible for the rehabilitation they also pointed out that the professionals in the rehabilitation team were a valuable safety net who provided them with information, advice and support for their recovery process. These experiences are in line with the experiences of the participants in our study who also valued their family and home rehabilitation team highly. It is important to identify the needs of the family members taking care of the stroke survivors at home. Doing so will help to develop a greater understanding of home felt needs and the home rehabilitation for stroke survivors. Fulfilling the home felt needs of family members may promote the successful home rehabilitation of stroke survivors. To achieve integration and effectiveness, collaboration among professionals, family members and organizations is essential. The prerequisites are both a well performing team and an integrated rehabilitation. The participants in this study revealed that they were not always aware of which professionals were involved in the rehabilitation but it was not important to them either. What was important was collaboration and the partnership between all the parties the patients interacted with in different contexts. A well-performing team is based on interprofessional communication of clear roles and goals, shared team identity, team tasks, interdependence, integration and shared responsibility [40]. Integrated rehabilitation means health professionals working together with patients and family members, using a systematic approach to provide person-centered rehabilitation with interconnectedness of interventions of rehabilitation to address the whole person [40].

Methodological Considerations

Throughout the analysis of the interviews, all authors worked together. The authors moved between the original and the analysed data during the whole process which is in line with Morse et al. [41]. Who highlighted the importance of focusing on the processes of ensuring rigor during the study, rather than waiting until the end when it might be too late to correct errors. The participants were chosen through a strategic selection with the aim of gaining an insider perspective from the stroke survivors. The aim of qualitative studies is to describe different variations of an area, not to generalize a specific phenomenon from a selection to a wider population. To achieve transferability, the authors provided a description of the participants, the context, data collection and the analysis process as well as appropriate quotations [21]. However, one limitation of the study was not known which part of home rehabilitation was the most important for the perceived positive outcome. On the other hand, this was not the aim of the study, which could be a suggestion for further studies.

Conclusion

In conclusion, the consequences of a stroke contributed to the development of a new life, version 2.0. This study showed that person-centered ESD rehabilitation at home after a stroke enhanced the person’s self-management, empowerment and strategies. Social support from family members and guidance from a multi professional team were essential for home rehabilitation. ESD rehabilitation at home following a stroke strengthened important psychosocial aspects as well as independence in different biomechanical activities as a first glance.

Acknowledgments

We would like to thank all the participants in this study. We also thank Region Norrbotten, Sweden for financial support.

Declaration of interest: The authors report no declaration of interest.

References

    1. Feigin VL, Krishnamurthi R (2011) Stroke prevention in the developing world. Stroke 42: 3655-58. [crossref]
    2. Thrift AG, Thayabaranathan T, Howard G, Howard VJ, Rothwell PM, et al. (2017) Global stroke statistics. Int J Stroke12: 13-32. [crossref]
    3. Langhorne P, Bernhardt J, Kwakkel G (2011) Stroke rehabilitation. The Lancet 377: 1693-1702.
    4. Langhorne P, Dey P, Woodman M, Hamrin E, Kalra L, et al. (2005) Is stroke unit care portable? A systematic review of the clinical trials. Age and Ageing 34: 324-30.
    5. Hillier S, Inglis-Jassiem G (2010) Rehabilitation for community-dwelling people with stroke: Home or centre based? A systematic review. Int J Stroke 5: 178-86. [crossref]
    6. Weiss Z, Snir D, Zohar R, Klein B, Eyal P, et al. (2004) Allocation and preference of patients for domiciliary or institutional rehabilitation after a stroke. Int J Rehabil Res 27: 155-58. [crossref]
    7. Reunanen MA, Järvikoski A, Talvitie U, Pyöriä O, Härkäpää K (2016) Individualised home‐based rehabilitation after stroke in eastern F inland–the client’s perspective. Health Soc Care Communit 24: 77-85. [crossref]
    8. Fearon P, Langhorne P, Trialists ESD (2012) Services for reducing duration of hospital care for acute stroke patients. Cochrane Database Syst Rev. [crossref]
    9. Gray V, Rice CL, Garland SJ (2012) Factors that influence muscle weakness following stroke and their clinical implications: A critical review. Physiother Can 64: 415-26. [crossref]
    10. Hoffmann T, Bennett S, Koh C, McKenna K (2010) A systematic review of cognitive interventions to improve functional ability in people who have cognitive impairment following stroke. Top Stroke Rehabil 17: 99-107. [crossref]
    11. Patel M, Coshall C, Rudd AG, Wolfe CD (2003) Natural history of cognitive impairment after stroke and factors associated with its recovery. ClinRehabil 17: 158-66.
    12. Jönsson A, Delavaran H, Iwarsson S, Ståhl A, Norrving B, et al. (2014) Functional status and patient-reported outcome 10 years after stroke: The lund stroke register. Stroke 45: 1784-90.
    13. Green TL, King KM (2010) Functional and psychosocial outcomes 1 year after mild stroke. JJ Stroke Cerebrovasc Dis 19: 10-16. [crossref]
    14. Merleau-Ponty M (2013) Phenomenology of perception. London: Routledge.
    15. Pallesen H (2014) Body, coping and self-identity. A qualitative 5-year follow-up study of stroke. Disabil Rehabil 36: 232-41. [crossref]
    16. Taule T, Råheim M (2014) Life changed existentially: A qualitative study of experiences at 6–8 months after mild stroke. Disabil Rehabil 36: 2107-19. [crossref]
    17. McCormack B (2003) A conceptual framework for person‐centred practice with older people. Int J Nurs Pract 9: 202-209. [crossref]
    18. Morgan S, Yoder LH (2012) A concept analysis of person-centered care. J Holist Nurs 30: 6-15. [crossref]
    19. Nicholls DA, Gibson BE(2010) The body and physiotherapy. Physiother Theory Pract 26: 497-509. [crossref]
    20. Yun D, Choi J (2019) Person-centered rehabilitation care and outcomes: A systematic literature review. Int J Nurs Stud 93: 74-83.
    21. Graneheim UH, Lundman B (2004) Qualitative content analysis in nursing research: Concepts, procedures and measures to achieve trustworthiness. Nurse Educ Today 24: 105-12. [crossref]
    22. Gallagher S, Zahavi D (2013) The phenomenological mind. Routledge.
    23. World Health Organization (2009) International classification of functioning, disability and health (ICF); 2001. Geneva: WHO.
    24. Buhl I, Pallesen H (2015) Early rehabilitation of patients with severe acquired brain injury: Strategies to promote participation. Scand J OccupTher 22: 181-195. [crossref]
    25. Angel S, Kirkevold M, Pedersen BD (2011) Rehabilitation after spinal cord injury and the influence of the professional’s support (or lack thereof). J ClinNurs 20: 1713-22. [crossref]
    26. McCance T, McCormack B, Dewing J (2011) An exploration of person-centredness in practice.
    27. Epstein RM, Street RLJr (2011) The values and value of patient-centered care. Ann Fam Med 9: 100-03. [crossref]
    28. Wolfe A (2001) Institute of medicine report: Crossing the quality chasm: A new health care system for the 21st century. Policy, Politics, & Nursing Practice 2: 233-235. [crossref]
    29. Dworzynski K, Ritchie G, Fenu E, MacDermott K, PlayfordED, et al. (2013) Rehabilitation after stroke: Summary of NICE guidance. BMJ 346: f3615. [crossref]
    30. Mastos M, Miller K, Eliasson A, Imms C (2007) Goal-directed training: Linking theories of treatment to clinical practice for improved functional activities in daily life. ClinRehabil 21: 47-55. [crossref]
    31. Simpson DB, Breslin M, Cumming T, Zoete SD, Gall SL, et al. (2018) Go home, sit less: The impact of home versus hospital rehabilitation environment on activity levels of stroke survivors. Arch Phys Med Rehabil 99: 2216-2221. [crossref]
    32. Kielhofner G (2008) Model of human occupation. theory and application. 4th ed. Baltimore: Lippincott Williams & Wilkins (eds.).
    33. Persson D, Erlandsson L, Eklund M, Iwarsson S (2001) Value dimensions, meaning, and complexity in human occupation-a tentative structure for analysis. Scand J Occup Ther 8: 7-18.
    34. Legg L, Langhorne P (2004) Rehabilitation therapy services for stroke patients living at home: Systematic review of randomised trials. The Lancet 31: 352-6. [crossref]
    35. Hinder S, Greenhalgh T (2012)” This does my head in”. ethnographic study of self-management by people with diabetes. BMC Health Services Research 12: 83.
    36. Lorig KR, Holman HR (2003) Self-management education: History, definition, outcomes, and mechanisms. Ann Behav Med 26: 1-7. [crossref]
    37. Bandura A (2006) Guide for constructing self-efficacy scales. Self-efficacy beliefs of adolescents 5: 307-337.
    38. Sadler E, Wolfe CD, Jones F, McKevitt C (2017) Exploring stroke survivors’ and physiotherapists’ views of self-management after stroke: A qualitative study in the UK. BMJ Open 7:e011631-2016-011631. [crossref]
    39. Lou S, Carstensen K, Møldrup M, Shahla S, Zakharia E, et al. (2017) Early supported discharge following mild stroke: A qualitative study of patients’ and their partners’ experiences of rehabilitation at home. Scand J Caring Sci 31: 302-311. [crossref]
    40. Reeves S, Zwarenstein M, Goldman J, Barr H, Freeth D, et al. (2010) The effectiveness of interprofessional education: Key findings from a new systematic review. J Interprof Care 24: 230-41. [crossref]
    41. Morse JM, Barret M, Olson K, Mayan M, Spiers J (2002) Verification strategies for establishing reliability and validity in qualitative research. Int J Qual Methods 1: 13-22.
fig 1

Amino Acids as the Main Energy Source in Fish Tissues

DOI: 10.31038/AFS.2020223

Abstract

Amino acids (AAs) and proteins are major macronutrients in feedstuffs and fish. Due to a paucity of information about tissue-specific AA nutrition in aquatic animals, this review highlights the important energetic roles and functions of AAs (particularly glutamate, glutamine, and aspartate) in some tissues (particularly skeletal muscle, liver, kidney, and intestine) of fed fish. Although AAs have long been known to provide most of the energy utilized by fish, roles of specific AAs in certain tissues are unknown. Recent studies with hybrid striped bass and largemouth bass indicated that glutamate, glutamine and aspartate are major metabolic fuels in the proximal intestine, liver, kidney and skeletal muscle. Although these amino acids are abundant in both plant- and animal-source feedstuffs, their provision in compound feeds may be inadequate for optimum intestinal health or optimum growth performance of fish. Dietary supplementation with of glutamate, glutamine and aspartate may be crucial for the health of the organs and the whole body of fish, particularly under stress conditions. Knowledge of AA nutrition in fish will help to improve the growth, development and health of fish, as well as the efficiency of aquaculture worldwide.

Keywords

Amino acids, Energetic source, Protein metabolism, Fish tissues

Introduction

Amino acids (AAs) are indispensable nitrogen sources for living animals and, therefore, are a topic of utmost interest in the field of animal nutrition. In general, AAs can be grouped according to the chemical nature of their side chains, transport affinities, role in animal nutrition, or the catabolic fate of their carbon skeletons [1]. For instance, leucine, isoleucine, and valine are referred to as branched-chain AAs (BCAAs), whereas tryptophan, phenylalanine, and tyrosine are categorized as aromatic AAs. Other common groups include sulfur AAs, such as methionine and cysteine, and excitatory AAs, such as glutamate and aspartate. AAs are indispensable for protein biosynthesis and serve as the precursors of special products such as nitric oxide, polyamines, catecholamines, porphyrins, creatine, and melanin [1,2].

The first studies demonstrating the importance of AAs as an energy source for fish were performed about 50 years ago. Although several reasons have been proposed to explain the high fish requirements for dietary protein, it seems very important to focus on what has been done so far to understand this “apparent high” requirement and the greater contribution of dietary proteins for energy purposes [3,4]. From the comparison of protein efficiency ratios in a number of farmed animals, it could be observed that fish and terrestrial animals differ only in the relative dietary protein concentration required to achieve maximum growth rate. Previous studies highlight minimal or inexistent differences in protein requirements [5,6]. However, dietary protein contributes not only to body growth via protein synthesis, but a regular intake of proteins or AAs is required because fish continually use these biomolecules to replace existing proteins for tissue maintenance and to build new proteins during growth and reproduction [2].

At present, there is a paucity of information about the mechanisms for AA utilization in the energetic metabolism. Usually, animals have many different cell types and this diversity is matched by a complex system of AA transporters that operate on basis of substrate specificity and ion requirements [7]. Furthermore, the fish body has a common pool of total AAs, which is divided into the intracellular pool and extracellular pool. The intracellular pool is organ- and cell-specific [1]. Furthermore, intracellular pools of different organs are linked to the extracellular pool through the circulatory system. The AA composition of the intracellular pool is strongly influenced by the cell enzymes and the manner in which AAs are transported across the cell membrane. The same factors also control the AA distribution among different cellular compartments, such as the cytosol and mitochondria [8]. Moreover, the free AA pool composition within fish body also depends on other factors, such as starvation, acclimatization, absorption time, and food protein composition [3].

In nature, feed deprivation is a typical condition for fish because of recurring seasonal fluctuations, such as reproductive conditions or the availability of prey [9]. Fish have the ability to survive under fasting conditions for short or long periods without serious detrimental physiological effects. Starvation may provide insights on nutrients mobilization without the confusing interferences that exist when monitoring feed ingestion and digestibility. Additionally, it may be possible to estimate how the lipids and proteins inside the fish body may be utilized to survive as part of starvation metabolism [10]. Besides the requirements for protein biosynthesis, AAs are deaminated, and their carbon skeletons are oxidized to CO2 and water via the tricarboxylic acid (TCA) cycle and, in some cases, converted to fat or glucose and glycogen. In fish, AAs are quantitatively more important energy substrates than glucose and lipids are [11].

The literature on AA metabolism in fish tissues is relatively scarce and this topic has not been systematically compiled under an integrative view. In this review, the metabolism of AAs in different fish tissues is discussed with special focus on their use as energy sources.

Amino Acids in Fish Metabolism

Key Metabolic Pathways

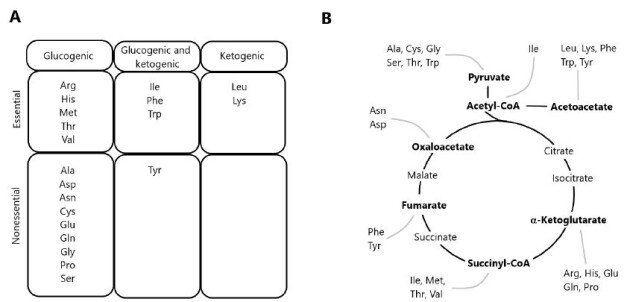
The degradation of AAs occurs via multiple pathways, including deamination and oxidation of carbon skeletons to CO2 through the TCA cycle [1,11]. Precursor substrates for gluconeogenesis include lactate and pyruvate, as well as glucogenic AAs derived from dietary protein. Since most of lactate and pyruvate are formed from glycolysis, the conversion of these metabolites into glucose via gluconeogenesis constitutes the glucose-lactate cycle. In contrast, gluconeogenesis from dietary AAs results in the formation of ammonia and represents a net transfer of carbons from proteins to carbohydrates. In herbivorous and omnivorous mammals, the recycling of glucose carbons accounts for a significant fraction of gluconeogenesis, particularly under fasting conditions [12,13]. AAs yielding acetyl-CoA or acetoacetyl-CoA are classified as ketogenic, since these two compounds are the precursors of ketone bodies. Some AAs are both ketogenic and glucogenic (Figure 1), while only leucine and lysine are exclusively ketogenic AA [14].

fig 1

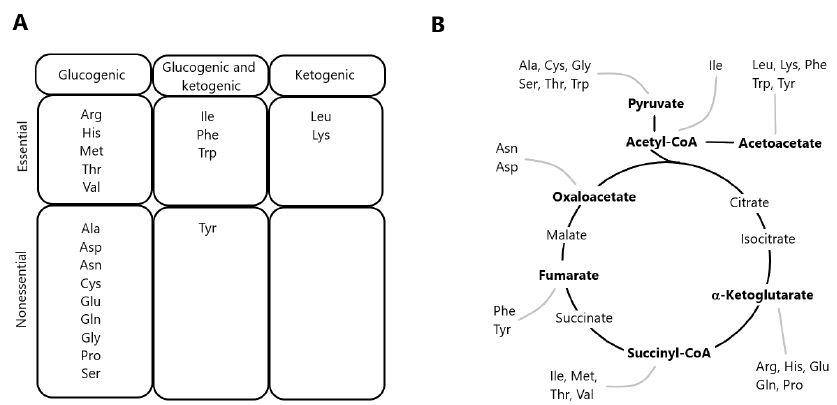
Figure 1: Classification of amino acids according to the metabolism of carbon skeletons. (A) Classification of amino acids as exclusively glucogenic, both glucogenic and ketogenic, or exclusively ketogenic. (B) Disposal of carbon skeletons as a part of the central pathways of energy metabolism.

The first enzymes to initiate AA catabolism are generally specific for a given AA or a group of structurally similar AAs (e.g., BCAAs). The general reaction types include oxidative deamination, transamination, and non-oxidative decarboxylation. Oxidative deamination is carried out by AA oxidases and dehydrogenases. D-amino acid oxidase (EC 1.4.3.3) has been detected in a variety of salmonid tissues [15] and in the common carp (Cyprinus carpio) as well [16]. Active aminotransferases for ammonia removal from specific AAs have been described in several fish tissues of salmonids [17] and Jian carp [18]. Quantitatively, the most important transaminases are aspartate aminotransferase (AST) and alanine aminotransferase (ALT), also known as glutamate-oxaloacetate transaminase (GOT) and glutamate-pyruvate transaminase (GPT), respectively. Several studies were carried out detecting these enzymatic activities in the fish blood serum and tissues. A variety of AAs act as donors for deamination reactions in fish, which use AAs as the main substrates for gluconeogenesis in their bodies, as well as main oxidative fuels [1,2]. Moreover, AAs may also undergo reactions brought on by oxidases and decarboxylases with significant physiological and nutritional consequences. Among the possible decarboxylation reactions is the conversion of glutamate into γ-aminobutyrate (GABA, a neurotransmitter), ornithine into putrescine, and arginine into agmatine [14]. The physiological significance of AA decarboxylation in fish merits systemic research.

Energy Metabolism

It has been suggested that about 50 to 70% of calories (as-fed basis) in diets consumed by trout are provided by protein, reaching about 55 to 75% on a dry-weight basis [19]. Fish consume protein to obtain AAs, which are taken up by their cells in accordance with their needs for energy or protein synthesis. The dietary protein requirements of fish ranges from 30% to 60%, depending on species, age, size, and feeding habits [2,20]. These quantities are greater than the amounts required for mammals and birds, such as swine (12-20%), dairy cows (10-18%), and chickens (14-22%) [3,21,22].

As animals get their energy needs from oxidation of the complex molecules that they eat, the energy in feed is not available until the complex molecules are broken down to simpler molecules by digestion. Furthermore, the energy needs of fish are mainly supplied by macromolecules as fats, carbohydrates, and proteins. There is little consistent information on the ability of fish to digest fats of different melting points, although fats are generally well digested and utilized by fish, providing about 8.5 kcal metabolizable energy (ME) per gram [23]. The ME values of carbohydrates for fish range from near zero for cellulose to about 3.8 kcal/g for easily digestible sugars. The value of carbohydrates in fish feeds is a controversial issue. It appears, however, that digestible carbohydrates can be well utilized as an energy source if they are provided in proper balance with other nutrients [24]. Protein has a ME value of about 4.5 kcal/g for fish, which is higher than that defined for mammals and birds [23]. Thus, it seems clear that most fish do not use carbohydrates (e.g., starch, glycogen, and simple sugars) as a major energy source [25].

Moreover, the energy metabolism in fish could be compared as similar to mammals and birds with two notable exceptions: (a) fish do not expend energy to maintain a body temperature different from that of the environment and (b) the excretion of waste nitrogen requires less energy in fish than it does in homeothermic land animals [26]. Although AAs have long been known to provide most of the energy utilized by fish, the role of specific AAs in certain tissues are unknown. Recent studies with hybrid striped bass and largemouth bass indicated that glutamate, glutamine and aspartate are major metabolic fuels in the proximal intestine, liver, kidney and skeletal muscle [11,27]. Note that these amino acids are abundant in both plant- and animal-source feedstuffs [22,28,29], but their provision in compound feeds may be inadequate for optimum intestinal health or optimum growth performance of fish [30]. Hence, the whole protein content does not vary too much among different species, and the AA profiles within the fish body is similar to that of the aforementioned animals [31,32]. However, species-specific composition in eye tissues from zebrafish (Danio rerio) and sardine (Sardina pilchardus) have been described [33].

The contribution of proteins and AAs towards meeting the energy requirements of fish is highly considered, because of the concept of “protein-sparing” through optimization of the digestible protein (DP) to digestible energy (DE) ratio addressed in a large number of species [34,35]. Moreover, the lack of control of amino acid catabolism as affected by dietary protein levels was considered as a major reason for the high protein requirements in fish [25]. As most of the fish are carnivorous, the use of protein as energy source could be compared with carnivorous mammals. Such comparison with terrestrial animals suggested that teleost fish or even shrimp use a greater proportion of proteins for energy purposes despite lower overall energy requirements due to the aquatic mode of life, which includes poikilothermy and ammoniotelism [6].

The basal energy needs of fish are lower than those of terrestrial animals due to their poikilothermic character, in which the internal temperature varies considerably according to environmental conditions. Therefore, dietary protein contributes not only to fish growth by providing AAs for protein synthesis, but also ATP production via AA catabolism. Evidence from several studies suggests that proteins and lipids are the major sources of energy for fish [36-38]. The final product of protein metabolism in teleost fish is ammonia, rather than urea and uric acid in mammals and birds, respectively. Because the synthesis of urea and uric acid requires a large amount of energy, the release of ammonia is energetically advantageous for fish [39]. Thus, the efficiency of AAs as metabolic fuels is greater in fish than in mammals and birds. High rates of AA utilization for body growth have been observed in fish as compared with other animals [8,40]. These quantitative differences have been attributed to the carnivorous/omnivorous feeding habit of fishes and their apparent preferential use of protein over carbohydrate as a dietary energy source [41].

Some cells in the nervous system can use diverse substrates, including AAs, to support oxidative energy metabolism [42]. At the same time, AA oxidation may contribute from 50 to 70% of total energy needs in marine fish embryos and yolk-sac larvae [25,43]. Indeed, it has been suggested that AAs could provide 14 to 85% of the energy requirements for teleost fish, depending on their developmental stage [44]. Energy supply is a limiting factor for physiological processes, and therefore, the study of energy metabolism associated to such processes is key to improve the growth, development and health of fish. Metabolic reorganization and alterations in intermediary metabolic pathways occur in fish to meet their increased energy demands for adaptations to changes in the aquatic environments.

Amino Acids Mobilization in Different Fish Tissues

AAs distribution and their respective concentrations into the various fish organs and tissues depend on their physiological roles (Table 1). Relatively little is known about AA metabolism in specific fish tissues. Mobilization of glycogen and lipids, as well as protein (primarily in skeletal muscle) contributes to ATP production [63,64]. Some species try to preserve liver glycogen stores by degrading proteins to support gluconeogenesis and use lipids and/or proteins as energy substrates [45,50]. In general, fish produces glycogen through gluconeogenesis during long periods of starvation, representing an energy source for muscle tissue and mobilizing it to maintain homoeostasis during the first stages of starvation [64-66]. On the other hand, an alternative pathway for de novo glucose synthesis can be through gluconeogenesis from lactate, glycerol and some AAs [67]. Fish uses AAs as the main substrates for gluconeogenesis and as main oxidative fuel. This is especially true for migratory fish, which may go for long periods without eating [68]. However, after fasting time the fish could eventually necessitate of protein catabolism to replenish glycogen stores that were exhausted during extensive starvation [49,50,67]. The anadromous Arctic char (Salvelinus alpinus) seems to find energy from protein stores into muscle tissues during the latter part of overwintering, or during migration growth and adiposity. This conclusion is supported by the reduction in muscular body mass observed during food-deprived fish from May through June [69]. Typically, fish return to standard metabolism depending on available feed after the fasting period, although this also depends on the environmental conditions, species, and age of the animal [70].

Table 1: Major roles of amino acids in fish tissues.

Tissues

Amino acids Physiological and/or metabolic role

References

Liver

Met The main role of Met is the synthesis of taurine (for bile production) [14,45,46]
Val and Ile

Val and Ile are used as glucogenic amino acids

Leu

Leu could be metabolized to ketone bodies, providing energy for tissues such as brain and heart during starvation

[14]

Ala

Ala is used as substrate for glycogen and/or glucose production in liver

[47-50]

Met, Leu and Lys

In hepatocytes, Met, Leu and Lys could regulate glycolysis, gluconeogenesis and lipogenesis; particularly relevant their involvement in regulation of metabolism related gene expression

[51,52]

Blood system

Ala, Gln, and Arg Concentrations of Ala, Gln, and Arg in plasma may be increased during long-term starvation for gluconeogenesis

[36]

Gln,Arg and Orn

Gln, Arg and Orn contribute to remove ammonia from blood during food deprivation

[53-55]

Nervous system

Glu

The main role of Glu is to provide energy for the enterocytes and precursors of biologically molecules like glutathione

[56-59]

Gly

Inhibitory neurotransmitter in the central nervous system; co-agonist with glutamate for N-methyl-D-aspartate receptor receptors; antioxidant; anti-inflammation; one-carbon metabolism; conjugation with bile acids

Muscle

Ala, Asp, Glu and leu

Ala and Asp serve as glucogenic precursors during the rest time. Moreover Ala concentration in muscle is increased to support muscular activity Leu is oxidized during food deprivation in fish to produce ATP for swimming

[40,60,61]

Gut

Glu and Gln

Glu and Gln are major energy source, and used for glutathione synthesis. They play a crucial role intestinal health of fish, by modulating intestinal structure, protecting against oxidative damage and acting as energy substrate for the enterocytes.

[11,59]

Arg

Arg has a role to improve intestinal health. Increased activity of several intestinal enzymes and changed composition of the intestinal microbiota

[62]

The low glucose turnover rate reported in fish as compared to other animals (mammals and birds) is in agreement with the fact that proteins play a large role in ATP production in most ectothermic fish [67,71,72]. This is supported by the lower nitrogen retention in ectothermic fish such as carp (30%) feeding diets with increased carbohydrate content, as compared with homeotherms like pigs (45%) and chickens (50%) [39]. AAs are not only oxidized for ATP production, but they are also used to synthesize macromolecules such as proteins in the gills or other organs, and for the osmoregulation during fish seawater acclimation [73]. Osmotic pressures in teleost fish are regulated at nearly constant levels. The non-essential AAs seem to be preferentially used for osmoregulatory proposes, rather than the ten AAs considered essential for the fish, namely arginine, histidine, isoleucine, leucine, lysine, methionine, phenylalanine, threonine, tryptophan, and valine [2]. However, the role of AAs as oxidative substrates in specific tissues has been largely neglected in previous studies that examined the effects of environmental salinity on the AA composition of fish plasma and tissues [74]. Some specific aspects of AA metabolism in different fish tissues are discussed in the following sections.

Blood System

Changes in the plasma levels of AAs at various time intervals after feeding have been monitored for several species, including rainbow trout [75], carp [76], tilapia [77], and channel catfish [78]. The enzyme glutamate dehydrogenase showed moderate activities in rainbow trout and carp erythrocytes, where glutamine was more important than glucose as an oxidative substrate [79]. Glutamate is used for the synthesis of glutamine and glutathione. Glutamine is essential for the synthesis of purines and pyrimidines, whereas glutathione protects cells from oxidative stress [1].

The metabolic reactions in the liver greatly affect the concentration of most AAs in blood and gut. Liver monitors the absorbed dietary AAs arriving from the portal blood and has the important role of controlling their catabolism and release into the general circulation. Much of the AAs taken up by the liver are rapidly degraded [80]. A rapid catabolism of excess dietary AAs was observed in rainbow trout by measuring a large increase in ammonia excretions within four hours of feeding a high protein meal [81]. In the case of BCAAs, skeletal muscles may be more important for initiating BCAA degradation than the liver [71,82].

During feed deprivation, fish appears to use catabolic energy conservation strategies to meet caloric needs while minimizing tissue energy loss [83]. It has been suggested that white muscle proteolysis is the source for increased plasma levels of free AAs observed during long-term feed deprivation, normally constituting the primary source of energy in carnivorous species [54]. Furthermore, AAs can supply glucose during periods of prolonged starvation via gluconeogenesis. In several fish species, long-term starvation mobilizes muscle protein by increasing the levels of free AA, usually alanine and glutamine, the most released AAs [36,53]. The increases in plasma AAs augment their metabolic utilization [54] and this is apparently the case for most non-essential glucogenic AAs in teleost fish [84].

AAs release via proteolysis of white muscle has been identified as an important fuel source for sockeye salmon (Oncorhynchus nerka) during periods of prolonged starvation [36]. However, the total plasma AAs in starved lake sturgeon (Acipenser fulvescens) was found to be unchanged during 45 days of feed deprivation [45]. Moreover, starved brown trout (Salmo trutta) showed a significant increase in total plasma AA levels after 15 days of feed deprivation [85]. These different responses in different studies may reflect species-specific metabolic adaptation strategies in response to feed deprivation and/or differences in body energy stores, such as lipids and glycogen. In this regard, Solea senegalensis is characterized by low body lipid stores, which supports the importance of proteolysis during prolonged feed deprivation in this species [55]. The increased levels of plasma glutamine, ornithine, and arginine observed in ureotelic fish that had been feed-deprived for 21 days may facilitate detoxification of ammonia production after AA catabolism. Glutamine is formed from glutamate and ammonia, and this reaction is a cellular mechanism for ammonia detoxification in fish. However, for every mole of ammonia detoxified, two equivalent moles of ATP are hydrolyzed [86]. Higher plasma levels of serine, asparagine, glutamine, arginine, and ornithine were observed in fish (S. senegalensis) that had been feed-deprived for 21 days [87]. This may suggest their role as important sources of carbons for gluconeogenesis, which is in line with the high rates of 14C incorporation from 14C-labeled serine and asparagine into glucose in isolated hepatocytes from feed-deprived O. mykiss. In addition, glutamine, arginine, and ornithine can be metabolized to glutamate, and deamination of glutamate is a main pathway for its oxidation to CO2 or for gluconeogenesis in the fish liver [20].

Liver

Liver plays an essential role on controlling the mobilization of energetic reserves for survival during the starvation period. In the fed state, sulfur AAs are used for the synthesis of taurine, which is required for the production of bile salts to promote lipid digestion and absorption. However, under starvation conditions, methionine is not needed to produce bile salts and, therefore, might be used as a glucogenic AA to produce glucose as a possible energy source for the central nervous system and red blood cells [45,46]. Valine and isoleucine are glucogenic, being catabolized via the TCA cycle and utilized for gluconeogenesis (Figure 1). Moreover, glutamate and glutamine are oxidized extensively in the liver of zebrafish and hybrid striped bass, with the rate of CO2 production from glutamine being greater than that from glutamate [11], while catfish hepatocytes produce five times more ammonia from glutamine than from glutamate [88]. Ketogenic AAs are converted to acetyl-CoA or ketone bodies in order to provide energy for tissues such as the brain and heart during starvation [47,89]. The analysis of stable isotopes in different tissues has been widely used in ecological studies to learn about the nutrient transfer across ecosystem boundaries and to understand trophic relationships and the migration of animals (including fish) through dietary changes that occur throughout their lives [9].

The juvenile yellowtail amberjack (Seriola lalandi) was subjected to an isotopically equilibrated diet of δ13C and δ15N AAs and proteins for 60 days and after this period, two treatments were carried out [90]. For one treatment, the fish continued to be fed and those in the other group were deprived of feed. The compound-specific isotopic analysis (CSIA) of AAs from different tissues showed significant differences between the muscle and liver samples of the control group and those fed the test diet. The CSIA for the δ15N values of liver AAs revealed the largest changes relative to the diet for non-essential AAs, whereas glycine and lysine remained constant. However, methionine was the most enriched AA within the control group, as compared to test diet. Valine and isoleucine, both essential AAs, were highly enriched in the liver of starved fish, a condition arising from either a high rate of utilization or an insufficient dietary supply. Enrichment patterns were observed for alanine, aspartate, and glutamate [90].

Salmonid fish encounter periods of little or no feed intake for many reasons, such as low feed availability during winter conditions. The role of carbohydrates and proteins as energy sources during periods of short-term fasting (days to weeks) or long-term starvation (months) in different fish species is less clear [50,91,92]. In coho salmon (Oncorhynchus kisutch), liver glycogen decreases one week after the initiation of fasting, but returns to a normal level after three additional weeks of feed deprivation. Net protein breakdown has been observed during prolonged periods of feed deprivation in salmonids, but not during the initial phase [50,91]. Juvenile salmonids are potentially more sensitive to fasting than adult fish, although there are still similarities between the different life stages in protein metabolism during fasting [93]. Alanine is likely used as a substrate for glycogen and/or glucose production in the liver [48,50], but may also be oxidized in the liver and used as a direct energy source [49]. In this scenario, decreased levels of alanine in the liver of fasted fish have been demonstrated [93].

Some genetic parameters have been considered in experiments involving food-deprived and well-fed amberjack fish, in particular changes in liver leptin (LepA1 and LepA2) expression [90]. An increase in liver leptin expression was previously observed during fasting/feed restriction, similar to the increase reported in Atlantic salmon [94,95]. The activity of enzymes involved in lipid metabolism (glucose 6-phosphate dehydrogenase and 3-hydroxyacyl-CoA dehydrogenase) and glycolysis (pyruvate kinase) appeared inversely correlated to liver leptin expression in food-deprived fish. The highest activity of these enzymes was recorded concurrently with low liver leptin expression in well-fed fish. Moreover, such interrelationships were not observed for enzymes involved in AA metabolism and gluconeogenesis [69]. Liver metabolic responses to increased dietary carbohydrates in both carnivorous fish and tilapia were also investigated as an attempt to understand the reasons for the higher metabolic use of carbohydrates in omnivorous fish than in carnivorous fish [96,97]. Some studies demonstrated that the liver of omnivorous fish responds well at the metabolic level to dietary carbohydrates, similarly to previous reports on juvenile tilapia and hybrid tilapia [98,99].

Biochemical responses to dietary nutrients in tilapia liver were previously investigated [100-102]. Gene expression studies showed no regulation at mRNA levels for metabolic enzymes related to glycolysis and gluconeogenesis, whereas mRNA levels for hepatic enzymes involved in AA catabolism were clearly dependent on the amount of dietary protein intake. This was not an expected result, as increased lipogenic and decreased gluconeogenic enzyme activities were observed in tilapia feeding carbohydrate-rich diets [103]. This indicates that enzymes in tilapia liver did not respond to dietary carbohydrates at the transcriptional level. Although the first steps of glucose utilization via the hepatic glucokinase (gck gene) were clearly higher in fish fed higher carbohydrate diets, the long-term adaptation of tilapia to carbohydrates does not necessitate persistent molecular adaptation for glucose utilization within the liver of this fish. It is unknown how the liver of carnivorous fish respond to dietary carbohydrate intake.

Intestine

Although the intestine uses both Glu and Gln as energy sources, the supply of each molecule is different. Both dietary and arterial Gln content are recruited into intestinal cells, while almost all Glu utilized in the gut comes from the lumen [104]. Glu is a non-essential AA that universally exists in living organisms. It plays various roles in enterocytes metabolism and physiology, either directly, as an energy source [56] or excitatory neurotransmitter in the enteric nervous system [105], or through conversion into bioactive molecules, such as glutathione [58]. Glu serving as a substrate for the synthesis of glutathione by the intestinal mucosa is derived from enteral Glu rather than arterial Glu, and 95% of dietary Glu is metabolized as a major energy source by the intestinal cells of piglets [59]. Although Glu can be synthesized in the body, this metabolic pathway is inadequate to meet the requirement of the piglet small intestine for glutamate [106]. These studies indicate that the utilization of dietary Glu has an important role in gut health and systemic metabolism. Examining this role may be helpful to better understand AA metabolism in the intestines of fish.

Moreover, after protein hydrolysis in the gut, the AAs are absorbed and pass along the portal system to the liver. During their passage across the intestinal wall, AAs can be incorporated into intestinal proteins (constitutive or secretory) or catabolized by the tissue [68]. The gut itself can metabolize extensive amounts of certain AAs, such as glutamate and aspartate. Indeed, in some animals, gut metabolism has a major influence on the whole body AA requirement [56].

Nervous System

Besides glucose, ketone bodies and possibly both lipids and proteins may act as energy sources in the brain of several vertebrates [107]. Astrocytes can use glutamine as an energy source and produce glutamine from glutamate (a neurotransmitter removed from the synaptic cleft), as well as from precursors, such as glucose and fatty acids [42]. The synthesis and utilization of substrates such as glutamine, ketone bodies and lactate are greatly influenced by their concentrations in the cells and the extracellular milieu [108,109]. The carbon skeletons of glutamate are mainly metabolized into CO2, lactate, or alanine, while the nitrogen of glutamate is utilized for the synthesis of other AAs such as glutamine, proline, and arginine [57,59,110]. Glutamine has various functions in cellular metabolism, such as serving as energy fuel and being a precursor for purine and pyrimidine nucleotides, NAD+, and amino sugars [57,58].

Muscular System

Proteins may play an important role in fueling muscle work in fish, but their exact contribution has yet to be established [111]. The design of reliable methods to measure substrate fluxes in fish muscle [112] has allowed researchers to start investigating how fish muscles respond to common environmental stresses. White muscle under stress is forced to produce lactate at higher rates than can be processed by aerobic tissues. However, lactate accumulation is minimized because disposal is also strongly stimulated. Trout have a much higher capacity to metabolize lactate under normoxic conditions than during hypoxia or intense swimming. The low density of monocarboxylate transporters and lack of up-regulation with exercise explain the phenomenon of lactate retention in white muscle. This tissue operates as an almost-closed system, where glycogen stores act as an “energy spring” that alternates between power release during swimming and slow withdrawal in situ from lactate during recovery [111].

To cope with exogenous glucose, trout can completely suppress hepatic production and boost glucose disposal. Without these responses, glycaemia would increase four times faster and reach dangerous levels. Therefore, the capacity of salmonids to regulate glucose levels is much better than presently described in the existing literature. However, knowledge about the use of proteins or AAs as fuel for muscle work in fish is still lacking. Glutamate and glutamine are major metabolic fuels for the skeletal muscles of zebrafish and hybrid striped bass [11]. This is contrast to mammalian muscles, where fatty acids and glucose are primary energy substrates [39].

Little is known about the use of proteins as fuel for muscular work in fish, although evidence from sockeye salmon (Oncorhynchus nerka) shows that proteins become the dominant source of fuels towards the end of migration when all the other substrates reach depletion [36]. At this point, researches also reported changes in AA and protein concentrations, as well as the activities of related enzymes. AA fluxes have not been measured in exercising fish and the only direct measurement of protein catabolism during swimming was the rate of nitrogen excretion in juvenile trout with a high growth rate. However, the high growth rate may be a destabilizing factor since significant changes in the protein composition of fish tissues occur during this stage of growth. A study examined the roles of glutamate, alanine, and aspartate as gluconeogenic precursors in resting kelp bass [60], and a further research measured the fluxes of all AAs in resting rainbow trout [113]. It is unclear whether the high rates of protein catabolism observed in migrating salmon and juvenile trout are typical of active muscles or whether they only occur under exceptional circumstances of extreme exercise or rapid growth [114].

The intramuscular metabolism of ectotherms has receive little attention, but the design of reliable methods to measure substrate fluxes in fish has allowed researchers to start investigating how fish muscles respond to common stresses [112]. For example, the mudskipper (Periophthalmodon schlosseri) is quite active and levels of total free AAs increased significantly in skeletal muscle and plasma, while alanine levels increased three-fold in the muscle, four-fold in the liver, and two-fold in plasma [61]. From these results, the authors concluded that P. schlosseri was capable of partially catabolizing certain AAs to support activity on land because of its capacity for life on sea and land. The tolerance of P. schlosseri to environmental ammonia is much higher than any other fishes because of its capability to actively excrete NH4+ and its low skin permeability to NH4+, which prevents back diffusion [115]. In this context, the amino groups of these AAs are transferred directly or indirectly to pyruvate to form alanine. The carbon chains are fed into the TCA cycle and are partially oxidized to malate, which could replenish pyruvate through the function of the malic enzyme. This favorable ATP yield from partial AA catabolism is not accompanied by a net release of ammonia [114]. Mudskippers can be very active on land. Thus, urea formation, which is energetically expensive, may not be a suitable strategy. By exposing mudskippers to terrestrial conditions, in constant darkness to minimize physical activity, the researchers reduced the rate of proteolysis and AA catabolism in response to aerial exposure [116]. In contrast, increased concentrations of alanine, BCAAs, and total free AAs were observed in the tissues of P. schlosseri exposed to terrestrial conditions for 24 h [117].

Proteins are one of the primary sources of metabolic energy in carnivorous fishes. The main storage tissue of utilizable protein is white muscle. AAs released through proteolysis can be oxidized either as energy or converted to other utilizable forms via anabolic pathways, as noted previously [11,14]. Before AAs can be oxidized through the TCA cycle, the amino group must be removed by either transamination or deamination. Ammonia is not produced during transamination, but deamination produces either NH3, which spontaneously takes up H+ to form NH4+ [118]. Certain AAs (e.g. arginine, glutamine, histidine, and proline) can be converted to glutamate, which can undergo deamination by glutamate dehydrogenase, producing NH4+ and α-ketoglutarate. The latter is fed into the TCA cycle. Glutamate can also undergo transamination with pyruvate, catalyzed by alanine aminotransferase, producing α-ketoglutarate without releasing ammonia. Continuous glutamate-pyruvate transamination would facilitate the oxidation of the carbon chains of some AAs. Under normal circumstances, the carbon chain of an AA is completely oxidized to CO2 through the TCA cycle and the electron transport chain, thus producing ATP and/or its equivalent [119]. This would cause a reduction in the efficiency of ATP production because not all AAs would fully be oxidized, allowing certain AAs to be used as energy sources, while minimizing ammonia accumulation. In fish, alanine constitutes 20 to 30% of the total AA pool [119]. Most of the free AAs could be converted into alanine and the overall quantitative energetics would appear to be quite favorable. The net conversion of glutamate to alanine would yield 20 moles of ATP per mole of alanine formed if the resultant α-ketoglutarate is completely oxidized to CO2. This favorable ATP yield from AA catabolism is accompanied by a direct release of ammonia into the living environment.

Alanine is an important substrate for hepatic gluconeogenesis and is one of the main AAs released by the skeletal muscle [1]. It is also an important source of energy for fish. However, the effect of adding alanine into diets is controversial, as dietary alanine is largely extracted by the splanchnic bed. In addition, β-alanine supplementation does not affect the growth of Japanese flounder (Paralichthys olivaceus) [120].

Skeletal muscle plays an important role in initiating BCAA degradation via transamination. There are reports that muscle tissues of goldfish [121] and trout [122] have higher activities of BCAA transaminases than mammalian muscles, which indicates a high capacity for leucine catabolism in fish muscle. In trout, the rate of leucine catabolism is higher during intense swimming than at rest [40]. The quantitative importance of leucine oxidation by fish muscle depends mainly on the use of protein as an endogenous energy source, since blood leucine does not contribute significantly to total CO2 production. This means that other substrates (e.g., glutamate, glutamine, alanine and aspartate) contribute predominantly to ATP production during exercise in fish. The oxidation of alanine occurs within the muscle, kidney and liver via glutamate-pyruvate transaminase. Alanine transport into the cells is under hormonal control during stressful conditions. Thereby, alanine is actively released at high rates by all muscle types studied, ensuring its supply to the liver and kidneys and this AA may be a major final product of muscle metabolism [40].

Important Amino Acids as Energy Sources

Lysine and Methionine

The effects of synthetic methionine and lysine on the growth and feed conversion of animals are so impressive that the use of these two AA as feed additives worldwide exceeds 700,000 metric tons annually [123,124]. Lys has a particular role in metabolism, since Lys and Leu are exclusively ketogenic AAs that are broken down to acetyl-CoA, which is oxidized to CO2 via in the TCA cycle. Unlike Lys, Met is a glucogenic AA that produces glucose as an energy source. Under methionine-limiting conditions, excesses of branched-chain AAs reduce methionine oxidation possibly due to competitive inhibition by the branched-chain ketoacids. Through the formation of S-adenosylmethionine (a donor of methyl group), methionine plays a key role in one-carbon metabolism [45,46].

Alanine

The transamination of non-essential AAs, such as alanine and aspartate, was found to be important for ATP production in fish in early investigations [71]. Alanine can stimulate the feeding response of certain fish [125] and carries nitrogen for inter-organ AA metabolism [36]. Recently, a study suggested a possible role for the hormones STC1 (a stanniocalcin homologue) and PTHrP (parathyroid hormone-relate protein) in teleost fish to safeguard liver glycogen reserves under stressful situations [126]. The strategy may involve the production of glucose via BCAA, alanine, glutamine, and glutamate and their mobilization from the muscle to the liver. Alanine is a fundamental AA that provides energy for the central nervous system during the starvation period by constant translocation from the muscle tissues through the blood system to the liver. However, under non-stressful conditions, the main energy source mainly comes from glutamate and glutamine [11].

Glycine

Glycine participates in gluconeogenesis, sulfur AA metabolism, one-carbon metabolism, and fat digestion [127]. It also stimulates feed intake in many fish [125]. In sturgeon, increased levels of glycine and a reduction of glucogenic AAs occur in response to feed deprivation. Glycine represents almost 30% of collagen, the major structural protein of connective tissues, such as tendons, skin, and ligaments [128]. Moreover, glycine might be reserved for the synthesis of creatine and, thus, the generation of creatine phosphate, a high-energy molecule used as an energy source for overcoming extreme conditions, like running away from predators [129]. In this regard, glycine plays an important role in energy metabolism during periods of feed deprivation and for activities requiring rapid use of high quantities of energy.

Arginine

Arginine is classified as an essential AA in young animals, including young fish, and is necessary for optimal growth [2]. Arginine plays various physiological roles in animal cells, such as serving as a component of proteins, an oxidative energy substrate, a stimulator of hormone secretion (e.g. growth hormone, insulin, glucagon), and a precursor of polyamine and nitric oxide (NO), which is vital for the vasodilation and immune responses [130]. In most mammals (e.g., humans, pigs and rat), the small intestine is the site for endogenous synthesis of citrulline and arginine from glutamine, glutamate and proline [21]. However, endogenous synthesis of arginine has not been demonstrated in most teleost fish [131]. In mammalian liver, arginine is essentially catabolized by arginase via the urea cycle [21]. The embryos of salmonids seem to have a functional urea cycle for ammonia detoxification, as researchers observed relatively higher activity of five urea cycle enzymes. This situation is quite different from adult fish.  Arginase is ubiquitous in fish tissues, with the highest activity in the liver and kidney [132]. The dietary requirement for arginine among various fish species may differ because of differences in metabolic and enzymatic efficiency [131]. Previous growth studies suggested that the fish arginine requirement might range from 4 to 6% of dietary protein. Salmon have the highest requirement (about 6% of dietary protein), whereas this number ranges from 4 to 5% in other species [2]. Arginine is a nutritionally essential AA for fish not only as a precursor for protein synthesis, but also for its metabolic role in the production of diverse metabolites, including nitric oxide (NO), polyamines, urea, proline, and glutamate [130,133].

Conclusions

To improve the knowledge about the use of AAs as a major energy source in fish, it is important to understand the bioavailability of each dietary AA to be absorbed and retained. The estimated bioavailability of AAs could be indirectly determined by the digestibility of dietary proteins. However, in aquatic organisms, leaching of water-soluble nutrients from both feed and feces is always a factor contributing to inaccuracy when determining the amounts of available AAs that are actually absorbed. Apart from those AAs retained for anabolic processes (i.e. protein deposition during growth), there is also a need to determine the amounts required to meet the demands of metabolic processes. Therefore, the amounts of dietary AAs that enter the portal circulation cannot be determined precisely. It is important to distinguish those AAs used in metabolic processes (e.g., ATP production) from those retained by fish under starvation conditions. Clearly, more research is needed on the metabolism of AAs in swimming fish to solve this intriguing problem. Muscular performance depends critically on the adequate supply of metabolic fuels and disposal of final products. Therefore, knowing how metabolite fluxes are regulated is necessary to understand the strategies whereby fish survive, grow, and develop. The ATP used for contraction can be generated through various pathways of energy metabolism that catabolize carbohydrates, lipids, or proteins. It can be suggested that under both fed and food-deprived conditions, AAs are major metabolic fuels for the intestine, liver, skeletal muscle, kidneys, and possibly other tissues.

References

    1. Wu G (2013) Amino Acids: Biochemistry and Nutrition. Boca Raton.
    2. Wilson RP (2002) Amino acids and proteins. San Diego, CA: Elsevier 144-179.
    3. Kaushik SJ, Seiliez I (2010) Protein and amino acid nutrition and metabolism in fish: current knowledge and future needs. Aquac Res 41: 322-332.
    4. Kim JD, Lall SP (2000) Amino acid composition of wholebody tissue of Atlantic halibut (hippoglossus hippoglossus), yellowtail flounder (pleuronectes ferruginea) and Japanese flounder (paralichthys olivaceus). Aquaculture 187: 367-373.
    5. Bowen SH (1987) Dietary protein requirements of fishes – A reassessment. Can J Fisher Aquatic Sci 44: 1995-2001.
    6. Cowey CB (1994) Amino acid requirements of fish – a critical appraisal of present values. Aquaculture 124: 1-11.
    7. Matthews JC (2000) Amino acid and peptide transport systems. Wallingford, UK: CAB International 3-23.
    8. Jürss K, Bastrop R (1995) Amino acid metabolism in fish. Biochemistry and Molecular Biology of Fishes 4: 159-189.
    9. Karasov WH, Martinez del Rio C (2007) Physiological Ecology: How Animals Process Energy, Nutrients, and Toxins. Princeton, NJ: Princeton University Press.
    10. Rossi A, Cazenave J, Bacchetta C, Campana M, Parma MJ (2015) Physiological and metabolic adjustments of Hoplosternum littorale (Teleostei, Callichthyidae) during starvation. Ecol Indic 56: 161-170.
    11. Jia S, Li X, Zheng S, Wu G (2017) Amino acids are major energy substrates for tissues of hybrid striped bass and zebrafish. Amino Acids 49: 2053-2063. [crossref]
    12. Perdigoto R, Rodrigues TB, Furtado AL, Porto A, Geraldes C, et al. (2003) Integration of [U-13C] glucose and H2O for quantification of hepatic glucose production and gluconeogenesis. NMR Biomed 16: 189-198.
    13. Coelho M, Nunes PM, Mendes V, Manadas B, Heerschap A, et al. (2015) Effect of Global ATGL knockout on murine fasting glucose kinetics. J Diabet Res 2015: 542029. [crossref]
    14. Wu G (2009) Amino Acids: Metabolism, functions, and nutrition. Amino Acids 37: 1-17. [crossref]
    15. Fickeisen DH, Brown Jr GW (1977) D‐Amino acid oxidase in various fishes. Fish Biol 10: 457-465.
    16. Deng J, Zhang X, Tao L, Bi B, Kong L, et al. (2011) D‐lysine can be effectively utilized for growth by common carp (Cyprinus carpio). Aquac Nutr 17: 467-475.
    17. Samsonova MV, Lapteva TI, Yu BF (2005) Aminotransferases in early development of salmonid fish. Russian J Dev Biol 36: 70-74.
    18. Jiang J, Feng L, Tang L, Liu Y, Jiang W, et al. (2015) Growth rate, body composition, digestive enzymes and transaminases activity, and plasma ammonia concentration of different weight Jian carp (Cyprunus carpio var. Jian). Anim Nutr 1: 373-377.
    19. Lee JK, Cho SH, Park SU, Kim KD, Lee SM (2003) Dietary protein requirement for young turbot (Scophthalmus maximus L.). Aquac Nutr 9: 283-286.
    20. Ballantyne JS (2001) Amino acid metabolism. Fish Physiol 19: 77-107.
    21. Wu G (2014) Dietary requirements of synthesizable amino acids by animals: a paradigm shift in protein nutrition. J Anim Sci Biotechnol 5: 34.
    22. Li P, Wu G (2020) Composition of amino acids and related nitrogenous nutrients in feedstuffs for animal diets. Amino Acids 52: 523-542.
    23. Jobling M (1983) A short review and critique of methodology used in fish growth and nutrition studies. J Fish Biol 23: 685-703.
    24. Hart, Paul JB (2002) Handbook of fish biology and fisheries. New York, NY: Blackwell.
    25. Cowey CB, Walton MJ (1988) Studies on the uptake of (14C) amino acids derived from both dietary (14C) protein and dietary (14C) amino acids by rainbow trout, Salmo gairdneri Richardson. J Fish Biol 33: 293-305.
    26. Van de Pol I, Flik G, Gorissen M (2017) Comparative physiology of energy metabolism: Fishing for endocrine signals in the early vertebrate pool. Front Endocrinol 8: 36. [crossref]
    27. Li XY, Wu G (2019) Oxidation of energy substrates in tissues of Largemouth bass (Micropterus salmoides). J Anim Sci 97: 68-69.
    28. Hou YQ, He WL, Hu SD, Wu G (2019) Composition of polyamines and amino acids in plant-source foods for human consumption. Amino Acids 51: 1153-1165. [crossref]
    29. Li XL, Rezaei R, Li P, Wu G (2011) Composition of amino acids in feed ingredients for animal diets. Amino Acids 40: 1159-1168. [crossref]
    30. Li XL, Zheng SX, Wu G (2020) Nutrition and metabolism of glutamate and glutamine in fish. Amino Acids 52: 671-691. [crossref]
    31. Latshaw JD, Bishop BL (2001) Estimating body weight and body composition of chickens by using noninvasive measurements. Poult Sci 80: 868-873. [crossref]
    32. Ramseyer LJ (2002) Predicting whole-fish nitrogen content from fish wet weight using regression analysis. North Am J Aquac 64: 195-204.
    33. Falco F, Barra M, Cammarata M, Cuttitta A, Jia S, et al. (2016) Amino acid composition in eyes from zebrafish (Danio rerio) and sardine (Sardina pilchardus) at the larval stage. SpringerPlus 5: 519.
    34. Cho CY, Kaushik SJ (1990) Nutritional energetics in fish: energy and protein utilization in rainbow trout (Salmo gairdneri). World Rev Nutr Dietet 61: 132-172. [crossref]
    35. Cho CY, Bureau DP (2001) A review of diet formulation strategies and feeding systems to reduce excretory and feed wastes in aquaculture. Aquac Res 32: 349-360.
    36. Mommsen TP, French CJ, Hochachka PW (1980) Sites and patterns of protein and amino acid utilization during the spawning migration of salmon. Can J Zool 58: 1785-1799.
    37. Hemre GI, Mommsen TP, Krogdahl A (2002) Carbohydrates in fish nutrition: Effects on growth, glucose metabolism and hepatic enzymes. Aquac Nutr 8: 175-194.
    38. Miao S, Nie Q, Miao H, Zhang W, Mai K (2016) Effects of dietary carbohydrate-to-lipid ratio on the growth performance and feed utilization of juvenile turbot (Scophthalmus maximus). J Ocean Univ China 15: 660-666.
    39. Wu G (2018) Principles of Animal Nutrition. Boca Raton, FL: CRC Press.
    40. Van den Thillart G (1986) Energy metabolism of swimming trout (Salmo gairdneri). Oxidation rates of palmitate, glucose, lactate, alanine, leucine and glutamate. J Comp Physiol B 156: 511-520.
    41. Tacon AGJ, Cowey CB (1985) Fish energetics. Dordrecht: Springer 155-183.
    42. McKenna MC, Dienel GJ, Sonnewald U, Waagepetersen HS, et al. (2012) Basic Neurochemistry. San Diego, CA: Academic Press 200-231.
    43. Rønnestad I, Thorsen A, Finn RN (1999) Fish larval nutrition: Recent advances in amino acid metabolism. Aquaculture 177: 201-216.
    44. Van Waarde A (1983) Aerobic and anaerobic ammonia production by fish. Comp Biochem Physiol B 74: 675-684.
    45. Gillis TE, Ballantyne JS (1996) The effects of starvation on plasma free amino acid and glucose concentrations in lake sturgeon, Acipenser fulvescens. J Fish Biol 49: 1306-1316.
    46. Hassel B (2001) Pyruvate carboxylation in neurons. J Neurosci Res 66: 755-762. [crossref]
    47. Robinson AM, Williamson DH (1980) Physiological roles of ketone bodies as substrates and signals in mammalian tissues. Physiol Rev 60: 143-187. [crossref]
    48. Canals P, Gallardo MA, Blasco J, Sanchez J (1992) Uptake and metabolism of L-alanine by freshly isolated trout (Salmo trutta) hepatocytes – the effect of fasting. J Exp Biol 169: 37-52.
    49. Pereira C, Vijayan MM, Moon TW (1995) In vitro hepatocyte metabolism of alanine and glucose and the response to insulin in fed and fasted rainbow trout. J Exp Zool 271: 425-431.
    50. Sheridan MA, Mommsen TP (1991) Effects of nutritional state on in vivo lipid and carbohydrate metabolism of coho salmon, Oncorhynchus kisutch. Gen Comp Endocrinol 81: 473-483. [crossref]
    51. Lansard MS, Panserat E, Plagnes J, Seilez I, Skiba Cassy S (2010) Integration of insulin and amino acid signals that regulate hepatic metabolism-related gene expression in rainbow trout: role of TOR. Amino Acids 39: 801-810. [crossref]
    52. Lansard MS, Panserat E, Plagnes J, Dias K, Sieliez I, et al. (2011) L-leucine, L-methionine, and L-lysine are involved in the regulation of intermediary metabolism-related gene expression in rainbow trout hepatocytes. J Nutr 141: 75-80. [crossref]
    53. Moon TW (2011) Metabolic reserves and enzyme activities with food deprivation in immature American eels, Anguilla rostrata (LeSueur). Can J Zool 61: 802-811.
    54. Sánchez-Muros MJ, Garcı́a-Rejón L, Garcı́a-Salguero L, de la Higuera M, Lupianez JA (1998) Long-term nutritional effects on the primary liver and kidney metabolism in rainbow trout. Adaptive response to starvation and a high-protein, carbohydrate-free diets on glutamate dehydrogenase and alanine amino transferase kinetics. Biochem Cell Biol 30: 55-63. [crossref]
    55. Dias J, Rueda-Jasso R, Panserat S, Conceição LEC, Gomes EF, et al. (2004) Effect of dietary carbohydrate to lipid ratios on growth, lipid deposition and metabolic hepatic enzymes in juvenile Senegal sole (Solea senegalensis). Aquac Res 35: 1122-1130.
    56. Burrin DG, Stoll B (2009) Metabolic fate and function of dietary glutamate in the gut. Am J Clin Nutr 90: 850-856. [crossref]
    57. Blachier F, Boutry C, Bos C, Tomé D (2009) Metabolism and functions of L-glutamate in the epithelial cells of the small and large intestines. Am J Clin Nutr 90: 814-821. [crossref]
    58. Newsholme P, Procopio J, Lima MMR, Pithon-Curi TC, et al. (2003) Glutamine and glutamate -their central role in cell metabolism and function. Cell Biochem Funct 21: 1-9.
    59. Reeds PJ, Burrin DG, Stoll B, Jahoor F (2000) Intestinal glutamate metabolism. J Nutr 130: 978-982. [crossref]
    60. Bever K, Chenoweth M, Dunn A (1981) Amino acid gluconeogenesis and glucose turnover in kelp bass (Paralabrax sp). Am J Physiol 240: 246-252. [crossref]
    61. Ip YK, Lem CB, Chew SF, Wilson JM, Randall DJ (2001) Partial amino acid catabolism leading to the formation of alanine in Periophthalmodon schlosseri (mudskipper): a strategy that facilitates the use of amino acids as an energy source during locomotory activity on land. J Exp Biol 204: 1615-1624. [crossref]
    62. Andersen SM, Waagbø R, Espe M (2016) Functional amino acids in fish health and welfare. Front Biosci 8: 143-169. [crossref]
    63. Navarro I, Gutiérrez J (1995) Fasting and starvation. Biochemistry and Molecular Biology of Fishes 4: 393-434.
    64. Metón I, Fernández F, Baanante V (2003) Short and long-term effects of re-feeding on key enzyme activities in glycolysis-gluconeogenesis in the liver of gilthead sea bream. Aquaculture 225: 99-107.
    65. Figueiredo-Garutti ML, Navarro I, Capilla E, Souza R, Mouraes G, et al. (2002) Metabolic changes in Brycoon cephalus (Teleostei, Characidae) during post-feeding and fasting. Comp Biochem Physiol A Mol Integr Physiol 132: 467-476. [crossref]
    66. Furné M, Morales AE, Trenzado CE, García-Gallego M, Carmen Hidalgo M, et al. (2012) The metabolic effects of prolonged starvation and re-feeding in sturgeon and rainbow trout. J Comp Physiol 182: 63-76. [crossref]
    67. Polakof S, Panserat S, Soengas J, Moon T (2012) Glucose metabolism in fish: A review. J Comp Physiol B 182: 1015-1045. [crossref]
    68. Bequette BJ (2003) Amino acid metabolism in animals: an overview. Amino Acids in Animal Nutrition 2: 103-124.
    69. Jørgensen EH, Martinsen M, Strøm V, Hansen KER, Ravuri CS, et al. (2013) Long-term fasting in the anadromous Arctic charr is associated with downregulation of metabolic enzyme activity and upregulation of leptin A1 and SOCS expression in the liver. J Exp Biol 216: 3222-3230. [crossref]
    70. Liang X, Wang J, Xue M, Gong G, Dong Y, et al. (2017) Gluconeogenesis during starvation and refeeding phase is affected by previous dietary carbohydrates levels and a glucose stimuli during early life in Siberian sturgeon (Acipenser baerii). Anim Nutr 3: 284-294.
    71. Walton MJ, Cowey CB (1982) Aspects of intermediary metabolism in salmonid fish. Comp Biochem Physiol B 73: 59-79.
    72. Garin D, Rombaut A, Fréminet A (1987) Determination of glucose turnover in sea bass Dicentrarchus labrax. Comparative aspects of glucose utilization. Comp Biochem Physiol B 87: 981-988. [crossref]
    73. Yancey PH (2001) Fish Physiology. Nitrogen Excretion 20: 309-341.
    74. Banerjee B, Gitalee B, Nirmalendu S (2014) Influence of environmental hypertonicity on the induction of ureogenesis and amino acid metabolism in air-breathing walking catfish (Clarias batrachus, Bloch). Indian J Exp Biol 52: 728-738. [crossref]
    75. Rolland M, Feekings JP, Dalsgaard J, Holm J, Skov P (2016) Modelling the effects of dietary methionine level and form on postprandial plasma essential amino acid profiles in rainbow trout (Oncorhynchus mykiss). Aquac Nutr 22: 1185-1201.
    76. Plakas SM, Katayama T, Tanaka Y, Deshimaru O (1980) Changes in the levels of circulating plasma free amino acids of carp (Cyprinus carpio) after feeding a protein and an amino acid diet of similar composition. Aquaculture 21: 307-322.
    77. Yamada S, Tanaka Y, Katayama T, Sameshima M, Simpson KL (1982) Plasma amino acid changes in Tilapia nilotica fed a casein and a corresponding free amino acid diet. Bull Jpn Soc Sci Fish 48: 1783-1787.
    78. Wilson RP, Gatlin DM, Poe WE (1985) Postprandial changes in serum amino acids of channel catfish fed diets containing different levels of protein and energy. Aquaculture 49: 101-110.
    79. Ferguson RA, Storey KB (1991) Glycolytic and associated enzymes of rainbow trout (Oncorhynchus mykiss) red cells: in vitro and in vivo studies. J Exp Biol 155: 469-485.
    80. Bae JY, Ok IH, Lee S, Hung SS, Min TS, et al. (2011) Reevaluation of dietary methionine requirement by plasma methionine and ammonia concentrations in surgically modified rainbow trout, Oncorhynchus mykiss. J Appl Ichthyol 27: 887-891.
    81. Brett JR, Zala CA (1975) Daily pattern of excretion and consumption of sockeye salmon under controlled conditions. J Fish Res Board Can 33: 2479-2486.
    82. Walton MJ, Wilson R (1986) Postprandial changes in plasma and liver free amino acids of rainbow trout fed complete diets containing casein. Aquaculture 51: 105-115.
    83. Costas B, Aragao C, Jarabo IR, Chacoff LV, Arjona FJ, et al. (2011) Feed deprivation in Senegalese sole (Solea senegalensis Kauo, 1858) juveniles: Effects on blood plasma metabolites and free amino acid levels. Fish Physiol Biochem 37: 495-504. [crossref]
    84. Suarez RK, Mommsen TP (1986) Gluconeogenesis in teleost fishes. Can J Zool 65: 1869-1882.
    85. Navarro I, Blasco J, Baños N, Gutiérrez J (1997) Effects of fasting and plasma amino acid levels in brown trout. Fish Physiol Biochem 16: 303-309.
    86. Randall DJ, Tsui TKN (2002) Ammonia toxicity in fish. Mar Pollut Bull 45: 17-23.
    87. French CJ, Mommsen TP, Hochachka PW (1981) Amino acid utilisation in isolated hepatocytes from rainbow trout. Eur J Biochem 113: 311-317. [crossref]
    88. Legate NJ, Bonen A, Moon TW (2001) Glucose tolerance and peripheral glucose utilization in rainbow trout (Oncorhynchus mykiss), American eel (Anguilla rostrata), and black bullhead catfish (Ameiurus melas). Gen Comp Endocrinol 122: 48-59. [crossref]
    89. Kopio RR, Murray DM, Story DL, Brunengraber H (1984) The shunt pathway of mevalonate metabolism in the isolated perfused rat kidney. J Biol Chem 259: 372-377. [crossref]
    90. Barreto-Curiel F, Focken U, D’Abramo LR, Viana MT (2017) Metabolism of Seriola lalandi during starvation as revealed by fatty acid analysis and compound-specific analysis of stable isotopes within amino acids. PloS One 12: 0170124. [crossref]
    91. Navarro I, Gutierrez J, Planas J (1992) Changes in plasma-glucagon, insulin and tissue metabolites associated with prolonged fasting in brown trout (Salmo trutta fario) during two different seasons of the year. Comp Biochem Physiol Comp Physiol 102: 401-407. [crossref]
    92. Pottinger TG, Rand-Weaver M, Sumpter JP (2003) Overwinter fasting and re-feeding in rainbow trout: plasma growth hormone and cortisol levels in relation to energy mobilisation. Comp Biochem Physiol B biochem Mol Biol 136: 403-417. [crossref]
    93. Kullgren A, Samuelsson LM, Larsson DGJ, Björnsson BT, Bergman EJ (2010) A metabolomics approach to elucidate effects of food deprivation in juvenile rainbow trout (Oncorhynchus mykiss). Am J Physiol Regul Integr Comp Physiol 299: 1440-1448. [crossref]
    94. Rønnestad I, Nilsen TO, Murashita K, Angotzi AR, Gamst Mohn AG, et al. (2010) Leptin and leptin receptor genes in Atlantic salmon: Cloning, phylogeny, tissue distribution and expression correlated to long-term feeding status. Gen Comp Endocrinol 168: 55-70. [crossref]
    95. Trombley S., Schmitz M (2013) Leptin in fish: Possible role in sexual maturation in male Atlantic salmon. Fish Physiol Biochem 39: 103-106. [crossref]
    96. Boonanuntanasarn S, Kumkhong S, Yoohat K, Plagnes-Juan E, Burel C, et al. (2018) Molecular responses of Nile tilapia (Oreochromis niloticus) to different levels of dietary carbohydrates. Aquaculture 482: 117-123.
    97. Kamalam BJ, Medale F, Panserat S (2017) The utilisation of dietary carbohydrates in farmed fishes: new insights on influencing factors, biological limitations and future strategies. Aquaculture 467: 3-27.
    98. Wang Y, Liu YJ, Tian LX, Du ZY, Wang JT, et al. (2005) Effects of dietary carbohydrate level on growth and body composition of juvenile tilapia, Oreochromis niloticus×O. aureus. Aquac Res 36: 1408-1413.
    99. Azaza MS, Khiari N, Dhraief MN, Aloui, N, Kraiem MM, et al. (2015). Growth performance, oxidative stress indices and hepatic carbohydrate metabolic enzymes activities of juvenile Nile tilapia, Oreochromis niloticus L., in response to dietary starch to protein ratios. Aquac Res 46: 14-27.
    100. Gaye-Siessegger J, Focken U, Becker K (2006) Effect of dietary protein/carbohydrate ratio on activities of hepatic enzymes involved in the amino acid metabolism of Nile tilapia, Oreochromis niloticus (L.). Fish Physiol Biochem 32: 275-282.
    101. Chen MY, Ye JD, Yang W, Wang K (2013) Growth, feed utilization and blood metabolic responses to different amylose-amylopectin ratio fed diets in tilapia (Oreochromis niloticus). Asian Australas J Anim Sci 26: 1160-1171.
    102. Chen YJ, Zhang T, Chen HY, Lin S, Luo L, et al. (2017) An evaluation of hepatic glucose metabolism at the transcription level for the omnivorous GIFT tilapia, Oreochromis niloticus during the postprandial nutritional status transition from anabolism to catabolism. Aquaculture 473: 375-382.
    103. Figueiredo-Silva AC, Saravanan S, Schrama JW, Panserat S, Kaushik S, et al. (2013) A comparative study of the metabolic response in rainbow trout and Nile tilapia to changes in dietary macronutrient composition. Br J Nutr 109: 816-826. [crossref]
    104. Wu G (1998) Intestinal mucosal amino acid catabolism. J Nutr 128: 1249-1252. [crossref]
    105. Kirchgessner AL (2001) Glutamate in the enteric nervous system. Curr Opin Pharmacol 1: 591-596. [crossref]
    106. Rezaei R, Knabe DA, Tekwe CD, Dahanayaka S, Ficken MD, et al. (2013) Dietary supplementation with monosodium glutamate is safe and improves growth performance in postweaning pigs. Amino Acids 44: 911-923. [crossref]
    107. Gibbs SR, DeRoos RM (1991) Plasma levels of glucose, ketone bodies, lactate, and alanine in the vascular supply to and from the brain of the adult American bullfrog (Rana catesbeiana). J Exp Zool 258: 14-23. [crossref]
    108. Edmond J, Auestad N, Robbins RA, Bergstrom JD (1985) Ketone body metabolism in the neonate: development and the effect of diet. Fed Proc 44: 2359-2364. [crossref]
    109. Dienel GA, Cruz NF (2003) Neighborly interactions of metabolically activated astrocytes in vivo. Neurochem Int 43: 339-354.
    110. Nakamura H, Kawamata Y, Kuwahara T, Torii K, Sakai R (2013) Nitrogen in dietary glutamate is utilized exclusively for the synthesis of amino acids in the rat intestine. Am J Physiol Endocrinol Metab 304: 100-108. [crossref]
    111. Weber JM, Choi K, Gonzalez A, Omlin T (2016) Metabolic fuel kinetics in fish: swimming, hypoxia and muscle membranes. J Exp Biol 219: 250-258.
    112. Haman F, Powell M, Weber JM (1997) Reliability of continuous tracer infusion for measuring glucose turnover rate in rainbow trout. J Exp Biol 200: 2557-2563. [crossref]
    113. Robinson J, Yanke D, Mirza J, Ballantyne JS (2011) Plasma free amino acid kinetics in rainbow trout (Oncorhynchus mykiss) using a bolus injection of 15N-labeled amino acids. Amino Acids 40: 689-696. [crossref]
    114. Weber M (2011) Metabolic fuels: regulating fluxes to select mix. J Exp Biol 214: 286-294. [crossref]
    115. Ip YK, Randall DJ, Kok TKT, Barzaghi C, Wright PA, et al. (2004) The giant mudsipper Periophthalmodon schlosseri facilitates active NH4+ excretion by increasing acid excretion and decreasing NH3 permeability in the skin. J Exp Biol 207: 787-801. [crossref]
    116. Lim CB, Chew SF, Anderson PM, Ip YK (2001) Reduction in the rates of protein and amino acid catabolism to slow down the accumulation of endogenous ammonia: a strategy potentially adopted by mudskippers (Periophthalmodon schlosseri and Boleophthalmus boddaerti) during aerial exposure in constant darkness. J Exp Biol 204: 1605-1614. [crossref]
    117. Ip YK, Lee CY, Chew SF, Low WP, et al. (1993) Differences in the responses of two mudskippers to terrestrial exposure. Zool Sci 10: 511-519.
    118. Mommsen TP, Walsh PJ (1992) Biochemical and environmental perspectives on nitrogen metabolism in fishes. Experientia 48: 583-593.
    119. Hochachka PW, Guppy M (1987) Metabolic arrest and the control of biological time. Cambridge, MA: Harvard University Press: 253-284.
    120. Kim K, Wang X, Bai SC (2003) Reevaluation of the dietary protein requirement of Japanese flounder Paralichthys olivaceus. J World Aquac Soc 34: 133-139.
    121. Van Waarde A (1981) Nitrogen metabolism in goldfish, Carassius auratus (L.). Activities of transamination reactions, purine nucleotide cycle and glutamate dehydrogenase in goldfish tissues. Comp Biochem Physiol B 68: 407-413.
    122. Teigland M, Kkungsoyr L (1983) Accumulation of alpha-ketoisocaproate from leucine in homogenates of tissues from rainbow trout (Salmo gairdnerii) and rat. An improved method for determination of branched chain keto acids. Comp Biochem Physiol B 75: 703-705.
    123. Fontaine J (2003) Amino Acids in Animal Nutrition. Wallingford, UK: CABI Publishing: 15-40.
    124. Nwanna LC, Lemme A, Abdallah M, Schwarz FJ (2012) Response of common carp (Cyprinus carpio L.) to supplemental DL-methionine and different feeding strategies. Aquaculture 356: 365-370.
    125. Shamushaki VAJ, Kasumyan AO, Abedian A, Abtahi B (2007) Behavioural responses of the Persian sturgeon (Acipenser persicus) juveniles to free amino acid solutions. Mar Freshwater Behav Physiol 40: 219-224.
    126. Palma PFS, Bock C, Silva TS, Guerreiro PM, Power DM, et al. (2019) STC1 and PTHrP modify carbohydrate and lipid metabolism in liver of a teleost fish. Sci Rep 9: 723.
    127. Fang YZ, Yang S, Wu G (2002) Free radicals, antioxidants, and nutrition. Nutrition 8: 872-879. [crossref]
    128. Li P, Wu G (2018) Roles of dietary glycine, proline and hydroxyproline in collagen synthesis and animal growth. Amino Acids 50: 29-38. [crossref]
    129. Lin CY, Huang LH, Deng DF, Lee SH, Liang HJ, et al. (2019) Metabolic adaptation to feed restriction on the green sturgeon (Acipenser medirostris) fingerlings. Sci Total Environ 684: 78-88. [crossref]
    130. Chen C, Shengyao LF, Kuang S, Liu Y, Jiang J, et al. (2012) Effect of dietary arginine on growth, intestinal enzyme activities and gene expression in muscle, hepatopancreas and intestine of juvenile Jian carp (Cyprinus carpio var. Jian). Br J Nutr 108: 195-207. [crossref]
    131. Dabrowski K, Terjesen BF, Zhang Y, Phang JM, Lee KJ (2005). A concept of dietary dipeptides a step to resolve the problem of amino acid availability in the early life of vertebrates. J Exp Biol 208: 2885-2894. [crossref]
    132. Wright PA, Campbell A, Morgan RL, Rosenberger AG, Murray BW (2004) Dogmas and controversies in the handling of nitrogenous wastes: Expression of arginase Type I and II genes in rainbow trout: influence of fasting on liver enzyme activity and mRNA levels in juveniles J Exp Biol 207: 2033-2042.
    133. Jobgen WS, Fried SK, Fu WJ, Meininger CJ, Wu G (2006) Regulatory role for the arginine–nitric oxide pathway in metabolism of energy substrates. J Nutr Biochem 17: 571-588. [crossref]
fig 3

Performance Analysis Involving Inductive and Capacitive Load of a 7.5 kVA Inverter for Laboratory Use in an Institution

DOI: 10.31038/NAMS.2020323

Abstract

This project is therefore aimed at designing and construction of a pure sine wave inverter system of 7.5 kVA analyzed in performance and can be used to convert electrochemical energy into an alternating current (AC) supply. The major tests that were carried out all met the expected specifications with negligible deviation or tolerance. One thing was peculiar about the results; each of the tests that were carried out in each of the subsystems that make up the inverter system was done in relation to the next subsystem that was connected to it. The outputs from the inverter system were all as expected as shown by the final results. When the final installation was made, the system was tested by gradually loading it to see that it responds to the load increase as expected; and after the load test we observed that batteries voltage dropped slightly due to the loading effect and that was normal. Based on the pattern of tests and observations used in this project, it is expected that the system performs its intended duty throughout its useful life as long as it is used as prescribed.

Keywords

Battery, Energy, Load, Performance, Power

Introduction

Electrical energy or electrical power can be generated from primary energy sources which include geothermal power, mechanical power, solar power, kinetic energy of flowing water and wind, etc. this was discovered by Michael Faraday, a British scientist in the 1820s and 1830s. According to the law of conservation of energy also known as the law of science which states that energy can neither be created nor destroyed but can be transformed from one form to another. Series of researches have been carried out to fascinate the development on the technology on energy generation from different primary sources [1]. Despite all these technologies, due to the fact that everyone needs electrical energy as a result of high population and the slow rate of technological development in the country, the amount of energy distributed becomes insufficient for people and the need keeps pressing to generate an alternative supply from primary sources of energy such as hydro, wind, solar and chemical energy. In order to generate electrical power from direct current (DC) to Alternating current (AC), a device called Inverter is employed. While a rectifier circuit is used on the other hand to convert electricity from Alternating current (AC) back to Direct current (DC) [2]. This project is therefore aimed at designing and construction of a pure sine wave inverter system of 7.5 kVA analysed in performance and can be used to convert electrochemical energy into an alternating current (AC) supply. According to the Authoritative Dictionary of IEEE Standards Terms (IEEE, 2000), inverter is an electrical power converter that changes direct current (DC) to alternating current (AC). The converted AC can be at any required voltage and frequency with the use of appropriate transformers, switching, and control circuits. The inverter performs the opposite function of a rectifier [3]. The electrical inverter is a high-power electronic oscillator. It is so named because early mechanical AC to DC converters was made to work in reverse, and thus was “inverted”, to convert DC to AC. Inverters do not suffer much from all these except that the batteries are consumed very fast as the load increases calling for constant recharging of the batteries after each use [4].

Literature Review

Osuwa and Peter, 2014, gave the brief idea about the production of solid state inverters which provides environmentally friendly alternative for uninterruptible power supply for the working of different gadgets and for sustainable economy. This study is thus anchor on the making of 1 kVA inverter for provision of power using locally sourced 80 Ah 12 volts deep cycle battery, oscillator determined MOSFETs and a transformer along with other electronic components [5]. In build an inverter for the conversion of DC to AC at a normal frequency of 50 Hz, due consideration is given to the switching speed of the oscillator used to make sure that the MOSFETs in their two channels operate in their saturation and cut off states when appropriately driven by oscillator outputs in a way to complement each other.

Omitola et.al, 2014 discuss that researchers proposed that in the modern society, electricity has great control over the most daily activities for instance in domestic and industrial utilization of electric power for operations. Electricity can be generated from public supply to users in different ways including the use of water, wind or steam energy to drive the turbine as well as more recently the use of gas generators, astral energy and nuclear energy are as well sources of electricity [6,7].

An inverter is an electronic device that converts electrical power from DC form to AC form. Its typical application is to convert battery voltage (stored D.C voltage) into a normal house A.C voltage to power electrical devices such as TV, fridge etc. when an A.C power from the national grid is not available (wikipedia).

Chan and Bowler, 1974, reveals the more up-to date types of inverters are two or more transformer coupled inverters, which might be either connected in series and/or in parallel, to bring desirable result, but the only issue is the reduced time duration because of its high power consumption when working at full capacity. (Gottles, 1985). The other drawback of the above named inverters are reduced efficiency absence of dc power energy restoration (that is, chargers were not included for charging back-up batteries in the presence of public power supply). Also there is no capacity to switch from dc source to ac source when power is restored. Although, the latest products of solar energy to electrical energy converters include battery charging circuits but does not have the capacity to switching to public power supply (PPS).

Methodology

System Operation

The batteries are the back-up source for power generation conversion of chemical energy into electricity. The power produced by the battery bank was then transferred to the inverter unit. The battery monitors in the inverter monitors the rate at which electric current were drawn in and out of the battery. It turns off charge when the battery reaches the optimum charging point and turns it on when it goes below a certain level. It fully charges the battery without permitting overcharge. The batteries are the key component in this power system. It provided energy storage for the system. The energy stored in the batteries was then used to power the load but it was first converted to AC voltage by the use of an inverter due to they were AC loads. The photovoltaic ally produced direct current was commuted periodically by controlled oscillatory system and feed to power electronic semiconductor switches such as JFET which were connected the power transformer. Here the voltage was stepped up to the desired ac voltage. The inverter could also charge the battery when there is public power supply (Figure 1).

figure 1

Figure 1: Block diagram of operational principle of a solar inverter system.

Battery Bank

A battery bank is a group of batteries connected together using series or parallel wiring. This allows more power to be stored than using a single battery. A battery bank is the result of joining two or more batteries together for a single application. What does this accomplish? Well, by connecting batteries, you can increase the voltage, amperage, or both. When you need more power, instead of getting yourself a massive super tanker of an RV battery for example, you can construct a battery bank. A battery bank is a group of batteries connected together using series or parallel wiring. This allows more power to be stored than using a single battery. A battery bank allows you to store electricity generated by solar PV system for use at any time. (Solarmango.com)

Battery Connection Scheme

The first thing you need to know is that there are two primary ways to successfully connect two or more batteries: The first is via a series and the second is called parallel [8].

Series Connection. A series connection adds the voltage of the two batteries, but it keeps the same amperage rating (also known as Amp Hours). For example, these two 6-volt batteries joined in series now produce 12 volts, but they still have a total capacity of 10 amps. To connect batteries in a series, use jumper wire to connect the negative terminal of the first battery to the positive terminal of the second battery. Use another set of cables to connect the open positive and negative terminals to your application. Never cross the remaining open positive and open negative terminals with each other, as this will short circuit the batteries and cause damage or injury (Figure 2).

fig 2

Figure 2: Battery connection in series.

Be sure the batteries you’re connecting have the same voltage and capacity rating. Otherwise, you may end up with charging problems, and shortened battery life.

Parallel Connections. The other type of connection is parallel. Parallel connections will increase the current rating, but the voltage will stay the same. In the Parallel diagram, we’re back to 6 volts, but the amps increase to 20 AH. It’s important to note that because the amperage of the batteries increased, you may need a heavier-duty cable to keep the cables from burning out. To join batteries in parallel, use a jumper wire to connect both the positive terminals, and another jumper wire to connect both the negative terminals of both batteries to each other. Negative to negative and positive to positive. You can connect your load to one of the batteries, and it will drain both equally. However, the preferred method for keeping the batteries equalized is to connect to the positive at one end of the battery pack, and the negative at the other end of the pack. It is also possible to connect batteries in what is called a series/parallel configuration, but it may sound confusing, but this is the way you can increase your voltage output and Amp/Hour rating. To do this successfully, you need at least 4 batteries (Figure 3).

fig 3

Figure 3: Battery connection in parallel.

This is a combination of the above methods and is used for 2 V, 6 V or 12 V batteries to achieve both a higher system voltage and capacity. For example; 4 × 6 V 150 Ah batteries wired in series/parallel will give you 12 V at 300 Ah. 4 × 12 V 150 Ah batteries can be wired in series/parallel to give you 24 V with 300 Ah capacity (Figure 4) [9-36].

fig 4

Figure 4: Battery connection of series and parallel.

Results

This chapter presents the test results of the works that were carried out in this project. At the end of the installation, the system was tested to ensure that it meets the desired stated objectives and specifications that guided the entire project work. The results of the test carried out are as below;

Test Carried Out

     1. Physical examination

     2. Is it fully charged?

     3. How much charge is left in it?

     4. Does it meet the manufacturer specification?

     5. Device testing

     6. Continuity test

     7. Short circuit test

Device Testing

To test the Inverter, a load of up to 6000 VA was connected to the device to test if the device can carry up to the power stipulated for it to bear.

Continuity Test

The continuity test is carried out to avoid any form of an open circuit. The presence of an open circuit in any electrical system will create an open circuit fault in the system and the system will not function. The wires have to be continuous all the way from one terminal to another. The lead used in the soldering of the components must be well soldered and there should be no any form of partial contact as this might initiate an open circuit in the system.

Short Circuit Test

A short circuit occurs when the live and the neutral wires touch each other. When this happens, the current goes infinitely high and can blow up the entire system [6]. There should be no form of short circuit, be it on the legs of the integrated circuits or along the wires. Short circuit fault is a very costly fault as it can blow up the whole system and should be avoided as much as possible, so this test is very important prior to the powering of the inverter system. To determine the system failure rate, the part count analysis of the various components is required.

Performance Evaluation Test on the Inverter Battery

The inverter battery was subjected to two types of test;

     1. No load test; and

     2. Load test.

No Load Performance Test

A no-loads test was done on the inverter initially after completion, the output of the inverter was measured using a voltmeter (Table 1).

Table 1: No-Load Test on the Inverter.

Description

Values

Input Voltage

120 V

Output Voltage

230 V

Current from Battery

220 A
Frequency

50 HZ

Calculation of the Real Power for the Inverter:

           P(kw)=P(kva) × P.F

           Where P.F=0.8;

           P(kw)=7500 × 0.8

           P(kw)=6000 w

Formula calculation, to obtain the maximum current to be demanded by the inverter from the battery; Power (P); P=IV

           I=p/v

           When; P=6000 w, V=120 v

                                       I=7500/120

                                       I=50 A

Calculation for the battery scheme:

  • Using analytical approach;
  • Terminal battery voltage before charge:


Using a series method,

   Having 10 batteries rated:

   12.5+12.4+12.4+12.4+12.5+12.5+12.4+12.5+12.4+12.5=124.5 v.

   In a battery, there are 6 cells,

   Per cell we have 2 v, 2 × 6=12 v

   Maximum for a cell is 2.2 v, 2.2 × 6=13.2 v.

   Transient/tolerance value=±13.4.


Terminal battery voltage after charge:

   Using a series method,

   Having 10 batteries rated:

   12.7+12.6+12.8+12.7+12.7+12.7+12.7+12.6+12.8+12.7=126.4 v


Calculation for battery running hour:

   Analytical approach:

   T(hr)=volt × AH × E/load


where E is power efficiency AH is ampere per hour of the battery capacity

   a. when load L=1000 w, V=120 v, battery capacity=220 AH

       T(hr)=120 × 220 × 0.9/1000=23.76 hours

   b. when load L=2000 w, V=120 v, AH=220 A

       T(hr)=120 × 220 × 0.9/2000=11.88 hours

   c. when load L=3000 w, V=120 v, AH=220 A

       T(hr)=120 × 220 × 0.9/3000=7.92 hours

   d. when load L=4000 w, V=120 v, AH=220 A

       T(hr)=120 × 220 × 0.9/4000=5.94 hours

   e. when load L=5000 w, V=120 v, AH=220 A

       T(hr)=120 × 220 × 0.9/5000=4.75 hours (Table 2).

Table 2: Calculation for battery running hour Analytical approach.

Load (w)

Time (H) (Approximated value)

1000

24

2000

12

3000

8

4000

6

5000

5

Load Performance Test

The constructed inverter was subjected to different kinds of loads to determine the efficiency, how long the inverter systems can power the loads.

In carrying out the load test, the following loads were used:

  • A megger tester
  • Multi-meter
  • Load
  • Clamp-meter.

The test results and performance tests are shown in the sub-sections below:

  • Inductive load performance is shown in Table 3 and Figure 5.
  • Resistive load performance is shown in Figures 6, 7 and Tables 4-6.

Table 3: Inductive loads test for the inverter.

S/N

Load (W) Time (1 hour interval) Battery discharge rate (V)

1

450 11:30 am 122.6

2

450 12:30 pm

122.4

3 450 1:30 pm

122.4

4 450 2:30 pm

122.3

fig 5

Figure 5: Load Performance Analysis of Inductive Load.

figure 6

Figure 6: Graphical representation of load performance analysis of resistive calculation of Load.

fig 7

Figure 7: Graphical representation of the Inverter battery charging with respect to time.

Table 4: Inductive loads test for the inverter.

S/N

Item P (w) Duration (30 Mins Interval)
     

DC (V) input

AC (V) output

I (A) output

1

Electric bulb 200 122.1 230

2.2

2 Electric Iron 1000 121.5 229

6.9

Table 5: Load Description.

Item

Description

Quantity Rating (W)

1

Television 1 62
2 Monitor 1

193

3

Fan 3 450
4 Bulb 1

200

5 Air condition 1

750

6

Iron 1 1000
Total=

2655

Table 6: Load Performance Analysis.

Time

Load (W) Current (I) Battery (V) Output voltage (V) Output current (I)

Load (%)

11.00

TV (63)

Monitor (193)

0.1 123.4 240 0.5

3

12.00

Fan (150) 1.9 123.3 236 1.1

5

1.00

Fan (150) 2.4 122.3 233 1.7

8

2.00

Bulb (200) 2.6 122.1 230 2.2

9

3.00

A.C (750) 3.6 121.8 230 2.9

12

4.00

Electric Iron (1000) 6.7 121.5 229 6.9

15.3

16

The inverter was subject to two kinds of loads to determine the efficiency, how long the inverter systems can power the loads.

  • The resistive loads which are; energy saving bulbs and soldering iron.
  • The inductive load which are; electric fans and Air Conditions.

The tests carried out on the inverter and the readings taken with the use of multi-meter are as follows:

Discussion

The results of the tests that were carried out throughout the whole determination were all gotten through systematic checks and observations, and using the appropriate test tools and equipment where necessary. The major tests that were carried out all met the expected specifications with negligible deviation or tolerance. One thing was peculiar about the results; each of the tests that were carried out in each of the subsystems that make up the inverter system was done in relation to the next subsystem that was connected to it.

The outputs from the inverter system were all as expected as shown by the final results. When the final installation was made, the system was tested by gradually loading it to see that it responds to the load increase as expected; and after the load test we observed that batteries voltage dropped slightly due to the loading effect and that was normal.

Before final installation, the different sections that make the whole system were tested individually. This pattern was adopted to make troubleshooting, analysis and testing easy and reliable. It is expected that all the results of the tests that were carried out continuously conform to the specified standards as long as the system is used within its capacity and under the standard test conditions. Based on the pattern of tests and observations used in this project, it is expected that the system performs its intended duty throughout its useful life as long as it is used as prescribed, and this is because of the fact that the system was designed under standard operating conditions of the immediate environment.

Conclusion

The application of our knowledge of engineering in solving our local problem is one thing desperately needed in our country today. That is the opportunity this project offered us; by the implementation of this project, we have successfully made the laboratory less reliant on grid supplied energy which would boost productivity. After the implementation of the 7.5 kVA inverter installed for the department, the following were achieved:

  • We successfully did a proper load sizing of the department.
  • We successfully learnt and practiced the load on inverters in buildings.
  • We successfully determined the battery bank capacity of the 7.5 kVA pure sine wave inverter we installed in the department.
  • We as well gained great entrepreneurial skill through this project. This is of immense benefit as it would reduce our dependence on the job market for survival after school.
  • The end product of the project is the availability of a reliable and consistent power supply for the department.

Recommendations

  1. A maintenance check (e.g. periodic maintenance) should be carried out on the photovoltaic components (the solar panels, the power inverter, the charge controller, the batteries, the wires and cables, the monitors and meters) probably once a month. This will ensure that any fault is discovered and looked into on time. The components should not be tampered with in case any fault is discovered, experienced technicians should be contacted to check on the problem and proffer solutions.
  2. We would recommend that close attention be paid to the loading of the inverter. For the best interest of the life span of the inverter, it should not be run at the peak load. Members of staff should ensure that heavy duty loads are not connected to the inverter during the usage of the inverter.
  3. We recommend that students be issued their projects early enough to enable them learn in details what the project entails and projects like this (solar energy based) should be encouraged by the government to ensure optimal solutions to major issues like power failure problems.

References

  1. Abatan OA, Adewale AO, Alabi AA (2013) Constant Electricity Generation From Self-Charging Inverter. International Journal of Emerging Technology and Advanced Engineering 3: 694-698.
  2. Assad Abu-Jasser, (2010) A stand-alone photovoltaic System, Case Study: A Residence in Gaza. Journal of Applied Science in Environment Sanitation 5: 81-91.
  3. Adeoye SA and Akanni OS (2017) Development of 0.75 kVA Modified Sine Wave Inverter for a viewing Centre in Nigeria. International Journal of Advance Research and Innovation 5: 333-337.
  4. Baliunas, Sallie L, Willie Soon (2001) Washington Roundtable on Science and public Policy: Climate history and the sun.
  5. Balou (2009) what types of driver circuits are there?
  6. Battery Bank (2019) http://www.solarmango.com/dictionary/bank
  7. Bellis Mary (2019) History and Timeline of the Battery.
  8. Bird BM, Kings KG (1993) an introduction to power electronics.
  9. Chan T, Bowler P (1974) International Conference on Power Electronics, Power Semiconductors and their Applications 7-9: 237-251.
  10. Connexion France. 4 April (2017) Delayed at the station? Get pedalling to charge your phone”.
  11. Dave Etchells “The Great Battery Shootout”.
  12. Prince DC (1925) The Inverter. GE Review 28: 676-81.
  13. Electrical4u (2015) Online Electrical Engineering Study Site. Transformers types and principles 25.
  14. Emerson Network Power: Effects of AC Ripple Current on VRLA Battery Life” by https://enacademic.com/dic.nsf/enwiki/1355813
  15. Geoffrey Poulton (2007) Princeton information technology. http://www.researchgate.net
  16. IEEE Standards Terms (2000) The Authoritative Dictionary of IEEE Standards Terms (2000) Seventh Edition, IEEE Press, ISBN0-7381-2601-2: 588
  17. Osuwa JC, Peter CF (2014) Construction and implementation of 1kva Inverter. IOSR Journal of Applied Physics (IOSR-JAP) 6: 56-58.
  18. Mansoori Ali G, Enayati Nader, Agyarko L Barnie (2015) Energy: Sources, Utilization, Legislation, Sustainability, Illinois as Model State. World Scientific.
  19. Battery Charging (2018) (Pdf): LM2576,LM3420,LP2951,LP2952. ti.com
  20. Martin RG, (2002) Electronic Design from Concept to Reality, Discovery Press, India: 45-65.
  21. Martin LaMonica (2011) Motion-powered gadget charger back on track. CNET
  22. (2001) AN913: Switch-Mode, Linear, and Pulse Charging Techniques for Li+ Battery in Mobile Phones and PDAs.
  23. MIT Electric Team Vehicle December (2008) A Guide to Understanding Battery Specifications “mit.edu.
  24. Ned Mohan and William P Robinson (1989) design and Development of inverter with AVR using switch. journal.au.edu
  25. Olusegun O, Omitola Segun O, Olatinwo, Taiwo R. Oyedare (2001) Design and Construction of 1KW (1000VA).
  26. Omitola JK (2014) Design and construction of1KW (1000VA) PowerInverter. Journal of Innovative Systems Designand Engineering 2-12.
  27. Phil Weicker (2013) A Systems Approach to Lithium-Ion Battery Management. Artech House
  28. Pulse Maintenance charging:” Archived March 9, 2012, at the Wayback Machine.
  29. Recharger definition and meaning – Collins English Dictionary” (“Recharge – definition of recharge in English – Oxford Dictionaries”. Retrieved 26 June, 2019.
  30. Kayne R (2013) What is a Power Inverter.
  31. Sheu Akeem Lawal, Alade Olusope Michael: Design, Construction And Performance Evaluation Of 1kva Pure Sine Wave Power Inverter, International Journal of Scientific & Engineering Research
  32. Shuler CA (1984) Electronic Principle and Application. Glencoel McGraw Hill Columbus.
  33. Tepco Egypt (2010) Types of Loads.
  34. Theraja BL (2005) A Textbook of Electrical technology (22nd Edition) S Chand and company Ltd India Pg 2167-2176.
  35. William DS, (2001) Operation amplifier with linear integration circuit, Christopher R couty of charles E Merrill pulishing co, Chicago pp: 217-241.
  36. Windy Dankoff, (2001) How to Choose an Inverter for an Independent Energy System, Home Power 74-78.
fig 1

Assessment of Facial Injury by ‘Slock’ in Incarcerated Patients

DOI: 10.31038/OHT.2020121

Abstract

Objectives: A ‘slock’ is a padlock in a sock used as an improvised weapon in correctional facilities to induce trauma. Although assault and head injury rates are high in this setting, this is the first study to analyze facial fracture patterns by mechanism of injury. The purpose of this assessment was to examine the seemingly increasing prevalence of ‘slock’ induced facial fractures and the pattern and degree of injury caused by this device.

Methods: This quality assessment initiative was performed through retrospective analysis of incarcerated patients treated surgically for facial fractures at an academic medical center from 2011-2019. Data collection included the cause of injury, prevalence of padlock induced facial fractures and anatomical locations of fractures.

Results: Over an 8-year period, 435 inmates required surgical treatment for facial fractures. Of those, 366 reported injury by an intentional mechanism. 57 patients (16%) described involvement of a padlock and 23(6%) reported use of a ‘slock’. The prevalence of padlock induced facial fractures increased 2-fold from 2012-2017. In 57 patients with a padlock or ’slock’ injury, the most common fracture sites involved the mandible (53%), zygomatic arch (15%) and the nasal bone (13%). An average of 2.28(SD=1.33) fractures per patient occurred with padlocks.

Conclusion: A padlock is the most common cause of facial fracture besides a fist. We hope to contribute to better control of the padlock supply available to inmates to reduce the burden and severity of facial trauma. Future aims include analyzing the cost to society for treatment.

Keywords

Slock, Padlock, Lock in a sock, Facial fracture patterns, Improvised weapons

Introduction

As of 2017, the US incarcerated population comprised 1.5 million people with an adult incarceration rate of 568/100,000 [1]. In 2017, Louisiana had the highest adult incarceration rate of any state at 942/100,000 [2]. In combination with a high incarceration rate, it is thought that prisons are becoming increasingly more violent. The British Ministry of Justice reports over a 2-fold increase in serious assault rates in their incarcerated population from 2008-2018 [3]. The rate of head injury in the incarcerated population is nearly 5 times higher than the general population [4]. In addition, the hospitalization rate is about 10 times higher than that of the general population [4]. The combination of these reports shows the incarcerated population places a large financial burden on society to cover medical costs. The most common injury in this population is mandibular fracture, consisting of 46% of inmate injuries [5]. Although common, limited literature exists on the mechanisms and patterns of facial trauma. Inmates convert miscellaneous items into weapons, including toothbrushes, disposable razors, batteries, and padlocks [6]. 9% of all confiscated prison weapons are of the sap-type which is a heavy weight at the end of a flexible handle [6]. A sap-type weapon is used in 17% of inmate-on-inmate weapon induced injuries [6], many of which are a ‘slock’. A ‘slock’ is a padlock that is placed in a sock and used as an improvised weapon. Socks are distributed to prisoners and padlocks can be purchased in the prison commissary for inmates to protect their personal items. These two items are easily accessible and can be easily converted to a weapon. Prisons are a controlled environment and preventing inmate access to specific items, including padlocks, could reduce the burden of facial trauma and medical care costs for incarcerated patients. The purpose of this assessment was to examine the seemingly increasing prevalence of ‘slock’ induced facial fractures and the pattern and degree of injury caused by this ad-hoc device.

Methods

This quality assessment initiative was performed through retrospective chart review of incarcerated patients. IRB exemption was obtained as a quality improvement study. Selected patients were treated surgically for facial fractures at University Health and Ochsner LSU Health Shreveport Academic Medical Center from 2011-2019. Data collection included patient-reported mechanism of injury, prevalence of padlock induced facial fractures, anatomical locations of fractures induced by a padlock repaired surgically, age at discharge and gender. Mechanisms of injury were grouped into unintentional or intentional causes. An unintentional injury was defined as a facial fracture occurring from an accidental cause. Examples include a fall in the shower, sport associated injury, etc. An intentional injury was defined as a mechanism involving an inmate-on-inmate, staff-on-inmate, or self-induced injury. Examples include a fist to face injury, ‘slock’ to face, etc. Patients with unintentional and undocumented causes of injury were not further analyzed. Intentional injuries were categorized by specific mechanism. Padlock-induced injuries were classified by anatomical location of fracture and number of fractures per patient. Fracture location data was obtained from the imaging report in the patient chart.

Results

From 2011-2019, 435 incarcerated patients required surgical treatment for facial fractures. Of those, 366 (84%) patients reported injury by an intentional mechanism and 57 (13%) reported injury by an unintentional mechanism. As seen in Table 1, 57 patients (16%) described involvement of a padlock and 23 (6%) reported specified the use of a ‘slock.’ Padlocks were the second most common cause of facial fracture after the use of a fist, composing of 200 (55%) of all surgically repaired facial fractures. 60 (16%) fractures were vaguely described as an “assault” event in the patient chart and 14 (4%) reported being hit with an unknown object. As seen in Figure 1, the prevalence of intentionally induced facial fractures requiring surgery more than doubled from 2012 to 2017, from 29 to 67 cases. The prevalence of padlock induced facial fractures was also found to increase 2-fold from 2012 to 2017, from 7 to 14. The prevalence of fist to face injuries is included in the figure for comparison and was also found to increase substantially during our timeframe. As seen in Table 2, in the 57 patients injured by a padlock we recorded 134 total facial fractures with an average of 2.28 (SD=1.33) facial fractures per patient. The majority of fractures were observed to occur in the mandible (36%) and orbit (25%). As seen in Table 3, the most common surgically repaired fracture sites in this same group involved the mandible (53%), zygomatic arch (15%) and nasal bone (13%). As shown in Table 4, a majority of the patients involved in an intentional injury were 16 to 29 years of age. Seventy-five percent of padlock induced facial fractures occurred in patients who were 16 to 39 years of age. 98% of padlock induced facial fractures occurred in men.

Table 1: Mechanism of intentional injuries.

Mechanism of intentional injuries Number of injuries (n=366)

%

Fist to face 200

55%

Padlock

57

16%

Unknown object

14

4%

Other weapons

12

3%

Foot to face

8

2%

Fall following altercation

5

1%

Head to face

2

1%

Brass knuckles

2

1%

Knee to face

2

1%

Elbow to face 2

1%

Altercation with police 2

1%

Undefined assault

60

16%

†23 of 57 Padlock cases specifically described the use of a ‘slock’ weapon. ‡Other weapons were used only once to induce injury and included items such as a baseball bat, bowl, broom handle, phone, remote control, etc.

fig 1

Figure 1: Prevalence of facial fracture by mechanism of injury. This figure depicts the increasing prevalence of facial fracture injuries treated surgically via intentional mechanisms with fist to face and padlock-induced injuries.

Table 2: Anatomical location of padlock-induced fracture. This table illustrates the anatomical locations of facial fractures from 57 cases where a padlock was the reported mechanism of injury.

Anatomical location

Number of fractures (n=134)

%

Mandible

48

36%

Orbit

33

25%

Zygomatic bone

21

16%

Nasal bone

15

11%

Maxilla

12

9%

Alveolar ridge

3

2%

Frontal bone

2

1%

Table 3: Anatomical location of padlock-induced fractures treated surgically. This table illustrates the anatomical locations of facial fractures from 57 cases where a padlock was the reported mechanism of injury and were treated surgically.

Anatomical location

Number of surgeries (n=68)

%

Mandible

36

53%

Zygomatic arch

10

15%

Nasal bone

9

13%

Orbital floor

6

9%

Alveolar ridge

5

7%

Maxilla

1

1%

Frontal sinus

1

1%

Table 4: Age distribution of incarcerated patients (The age distribution of selected mechanisms of injury).

Age at discharge

Unintentional injuries (n=57) Intentional injuries (n=366) Fist to face (n=200)

Padlock (n=57)

16-29

29 173 110

22

30-39

20 112 49

21

40-49

5 61 32

11

50-59

3 17 7

3

60+

0 3 2

0

Discussion

Intentional facial fracture injuries have increased in the Louisiana incarcerated population from 2011-2019. We found the padlock to be the most common cause of facial fracture besides the fist. The mandible is the most common site treated surgically for a padlock-induced injury. Mandibular fractures treated surgically with intermaxillary fixation may require nutritional support for up to six weeks post-operatively [7]. This six week period is associated with airway problems, malnutrition leading to decreased wound healing, and changes in serum potassium levels that may require special monitoring or electrolyte supplementation.7 The post-operative care for these patients requires significant attention and resources from correctional facility staff. Preventing these types of injuries may help to reduce the burden placed on the correctional facility. The reliance on patient reported mechanisms of injury is a limitation to the study design. In 119 (27%) reviewed cases, we found that the self-reported mechanism of injury did not correlate with the severity of the injury. A common example included a patient reporting a fall in the shower with bilateral mandible fractures. We feel that injuries by intentional mechanisms are under reported with fear of retaliation from prison staff or inmates after returning to the correctional facility. We hope to contribute to better control of the commissary padlock supply or a built-in lock mechanism for lockers available to inmates to reduce the burden and severity of facial trauma. Future aims include analyzing the cost to society for treatment of padlock and ‘slock’ induced facial fractures.

Conclusion

Padlock induced injuries are the most common cause of facial fracture in incarcerated patients besides the fist. The prevalence of ‘slock’-induced facial fractures appears to be increasing in the Louisiana incarcerated population from 2011-2019. The mandible is the most common site treated surgically for padlock-induced fracture. Stricter regulations on the padlock supply may reduce the prevalence of facial fractures in this setting. Future studies should analyze the costs to society for treatment and the potential for an alternative from providing padlocks to inmates.

Conflict of Interest

The authors declare no conflict of interest.

Institutional Review Board

The study was judged exempt from review by the institutional review board.

Acknowledgement

This research did not receive any specific grant from funding agencies in the public, commercial, or not-for-profit sectors.

Triological Society Combined Sections Meeting Poster Presentation, Coronado, California, USA, January 23-25, 2020.

References

    1. Bronson J, Carson EA (2019) Prisoners in 2017. S. Department of Justice, Bureau of Justice Statistics.
    2. Wagner P, Sawyer W (2018) States of incarceration: the global context 2018. Prison Policy Initiative.
    3. Safety in custody statistics bulletin, England and Wales, deaths in prison custody to December 2018, assaults and self-harm to September 2018. Ministry of Justice
    4. Kuzak N, O’Connor M, Pickett W, O’Brien T, Reid K, Pearson M (2001) Impact of a prison triage system on injuries seen in emergency departments. Canadian Journal of Emergency Medicine 3: 199-204.
    5. Henning J, Frangos S, Simon R, Pachter HL, Bholat OS (2015) Patterns of traumatic injury in New York City prisoners requiring hospital admission. Journal of Correctional Health Care 21: 53-58.
    6. Lincoln JM, Chen LH, Mair JS, Biermann PJ, Baker SP (2006) Inmate-made weapons in prison facilities: assessing the injury risk. Journal of the International Society for Child and Adolescent Injury Prevention 12: 195-198.
    7. Giridhar VU (2016) Role of nutrition in oral and maxillofacial surgery patients. National Journal of Maxillofacial Surgery 7: 3-9.
fig 1

Radial as the Default Approach: Are We Overexaggerating?

DOI: 10.31038/JCCP.2020331

Abstract

Recent guidelines and reviews recommend trans radial approach (TRA) as a standard strategy for PCI unless there are overriding procedural recommendations [1-3]. The basis for these recommendations is randomised trials and metanalyses with conflicting results. We seek to unmask common misinterpretations in showing that the unfavourable results of TFA compared to TRA are most likely due to flawed study protocols with missing protocols for the TFA procedure and failure to correctly address vascular complications in the trans radial arm. Properly designed trials are mandatory before superseding TFA as a strategy that according to our combined experience of more than 25,000 coronary interventions should by no means be inferior to TRA yet with the tremendous advantage of ease of procedures, higher success-rates and less radiation.

Introduction

Trans radial access (TRA) has become the default access in Europe and Asia and its use is rapidly growing in Germany and the United States [4]. Enthusiasm for TRA has reached such a feverish pitch that criticism of TRA or praise for transfemoral access (TFA) is looked upon with disdain. With forty years’ experience including significant radial and brachial experience and a personal caseload in excess of 25,000 procedures we fail to see relevant advantage in the radial procedure. Although we agree that in most cases trans radial is a reasonable alternative to transfemoral, we have reason to doubt sufficient evidence to justify a 1A guideline recommendation (“standard approach”) for TRA [1].

Aim of the Review

Major sources of evidence were the three recent large randomised trials (RIVAL, MATRIX and SAFARI-STEMI) as well as two recent metanalyses. We are convinced that arguing for radial as default and the increasing disregard of PCI via femoral route in current guidelines and large comparative trials [5-8] needs to be challenged since it requires first and foremost more properly designed studies.

General Aspects

Prior to an analysis of the data it is important to understand that generally practiced techniques differ significantly from optimal techniques, and this is the case for both femoral and radial access. Large scale clinical trials include a spectrum of operators from highly skilled to “just learning” and none of the trials specify proper technique for either TRA or TFA. Nor do they report any uniformity of technique with either procedure. In light of the small differences and marginal p values between the TRA and TFA groups, differences in technique, especially with TFA would be sufficient to negate the findings. It is agreed that as practiced in Europe and the US, excess major bleeding associated with TFA is a problem, especially in acute coronary syndromes and possibly in elective PCI. We also agree that there may be a slight increase in all-cause mortality with TFA vs. TRA, and this difference is most likely due to bleeding complications. But we are also convinced that there would be no difference upon proper application of transfemoral approach (see appendix). However, unless there is a new trial with improved techniques included in the protocol, our persuasion remains speculative.

Bleeding aside, there are many advantages to TFA and many disadvantages to TRA. None of the randomised studies and metanalyses that demonstrate excess bleeding and higher mortality with TFA address these other factors. Properly designed randomized studies must limit themselves to one or two primary endpoints and a few secondary endpoints that can be used to generate hypotheses for future studies. Designers of clinical studies must guess at which parameters need to be evaluated to assure that the results are relevant and useful. When comparing TRA and TFA we need to look at much more than the small differences in complications and the barely demonstrable differences in mortality. TFA is technically easier. In the RIVAL trial, 7% of patients randomized to TRA had to switch to TFA because of difficulties with radial artery [9].

On the other hand, we have no doubt that TFA will result in more access site bleeding complications if not complied with proper technique of puncturing and sheath removal. In addition immediate ambulation after interventions is only possible following closure device (e.g. Angio-Seal®) [10] While most radial patients may be ambulated immediately, driving cost savings [11]. TRA is technically more difficult with lower success rates for coronary angiography and PCI [9,12], results in poorer image quality and increased radiation exposure to operators and patients [13,14] Radial artery closure might occur in 5-10%, but is generally considered benign if the ulnar artery is intact [15,16]. However due to potential endothelial damage after coronary angiography, use of the radial artery as conduit for CABG is discouraged [17]. Cath labs that use TRA as their “default” technique are less likely to properly train younger physicians in TFA. More importantly, these labs will not develop the culture that is required to prevent major bleeding in TFA cases.

Bleeding and Vascular Complications

Bleeding complications after PCI, related to the vascular access site, may increase the risk of periprocedural mortality by 1.3-2.1% [18]. In a large registry of 335,477 patients who underwent PCI in 2002 a major vascular complication occurred in 4.85% [19]. With experience however the risk of any vascular complication can be decreased from 1.7% for diagnostic procedures and 3.1% for PCI to very low numbers of 0.2% and 1.0% respectively [20], a finding that is confirmed in a large scale monitor-controlled registry reporting bleeding complications prolonging hospital stay, or requiring blood transfusion or surgical intervention, being as low as < 0.1% following diagnostic procedures (mainly with 4 F) and about 1% following PCI of ACS [21]. As for RIVAL (published in 2011), the rate of non-CABG-related major bleeding at 30 days was 0.7% in the radial group compared with 0.9% in the femoral group and only 0.2% and 0.3% of the bleeding events could be attributed to the access site [9]. In the MATRIX trial (published in 2015) bleeding complications (BARC 3-5) occurred in only 0.8% of the transfemoral patients and TIMI major or minor bleeding in 1.2% (TRA) and 1.7% (TFA) (p = 0.08). In the SAFARI-STEMI randomized trial, published in 2020, bleeding complications ware rare and did not differ (1.4% vs. 2.0%; RR, 0.71) [22].

Thus, contemporary bleeding complications after transfemoral approach in ACS-PCI are in the range of 1-2/100 and might not be different from TRA in the hands of experienced TFA operators. We strongly believe that it is possible to meaningfully decrease access site bleeding with more careful attention to technique with the femoral puncture and sheath removal. Liberal use of vascular closure devices has been shown to reduce bleeding by 50% [23], and therefore should be offered at least all high risk patients – e.g., obese patients, patients with severe hypertension, and those who have received anticoagulation as part of their procedure. It is our practice to use vascular closure devices on virtually all post PCI patients. If the access site complication rates for TFA in the general community can be reduced by 50 %, the arguments favouring TRA become superficial. Endothelial damage occurs in all patients after trans radial coronary angiography [17], and radial artery occlusion after trans radial intervention, a mostly quiescent complication, is likely to occur in 5-8% of the patients, relative to timing of assessment (7.7% after 24 hours and 5.5% at > 1 week follow-up [24]. It is often overlooked because > 50% of operators do not even assess radial artery patency before discharge [25] and it is not even mentioned in one randomised trial nor in metanalyses. It is by no means a trivial complication because future use of the radial artery as access, conduit for bypass-surgery or fistula formation in haemodialysis patients is precluded.

Major Adverse Events

Major adverse events, defined as 30 d composite of all-cause mortality, myocardial infarction, or stroke occur in about 6-10% of patients who receive PCI due to ACS. In many studies comparing TRA to TFA all-cause mortality was increased in the TFA group [8,26]. In most studies the increase did not reach statistical significance, mortality was not a prespecified endpoint, and in none was it shown to persist after controlling for bleeding. As shown by a pairwise and network meta-analysis of randomized controlled trials, the survival differences appeared patient-related and not driven by beneficial effects of TRA [27]. RIVAL, the first of the two large randomised trials, failed to show any difference in the primary endpoint (MI/stroke/severe bleeding 3.2% vs. 4%; p = 0.5) or secondary endpoint (death/MI/stroke 3.2% vs. 3.2%) [9].

With MATRIX, the second randomised comparison, there was no significant difference between radial access and femoral access in terms of the first co-primary endpoint of 30day MACE, (RR 0.85, 95% CI 0.74–0.99, two sided P = 0.031; non-significant at a pre-specified α of 0.025). All-cause mortality was 1.6% and 2.2% respectively (p = 0.045) but this was not a pre-specified endpoint [12]. The results of MATRIX must be interpreted with caution due to a strong modulating effect of operator/center experience on the efficacy [28] because the benefit of radial over femoral access obviously depends upon the operator’s expertise in the femoral technique: The MATRIX study divided patients into 3 groups based on the participating center’s proportion of radial PCIs: “low” (14.9% to 64.4%), intermediate (65.4% to 79.0%), and high (80.0% to 98.0%). The results of this stratified analysis showed that the centers with low and intermediate experience in radial approach had similar MACE rates (between 7.5% and 8.5% both for radial as well as femoral approach (differences n.s.), while those centers that were doing TRA in >80% revealed a significant absolute difference between TRA and TFA of 5.2% (p = 0.00014) Their MACE for TRA was 10.3% vs. a non-acceptable 15,5% for TFA (Figure 1). In this low level TFA group the difference in NACE (major bleeding unrelated to coronary artery bypass surgery or major adverse cardiovascular events) between TRA and TFA was even more pronounced (5,8 % (p = 0.0001), unlike similar results for TRA and TFA in the two other groups. These finding are most likely related to atrophied transfemoral skills in the centers that by enlarge perform TRA, while those who cope with both techniques don’t experience any significant difference of MACE and NACE between TRA and TFA [28].

fig 1

Figure 1: The MATRIX study divided patients into 3 groups based on the participating center’s proportion of radial PCIs: “low” (14.9% to 64.4%), intermediate (65.4% to 79.0%), and high (80.0% to 98.0%). Only TFA by radial experts resulted in a significant increase in MACE [28].

The most recent randomized trial looking at mortality was the SAFARI STEMI trial. It included almost 2300 patients before the trial was stopped half way because of futility. There were no significant differences between patients assigned to radial and femoral access in the rates of reinfarction (1.8% vs. 1.6%; RR, 1.07; 95% CI, 0.57-2.00; P = 0.83), stroke (1.0% vs. 0.4%; RR, 2.24; 95% CI, 0.78-6.42; P = 0.12), and bleeding (1.4% vs. 2.0%; RR, 0.71; 95% CI, 0.38-1.33; P = 0.28), survival or other clinical end points at 30 days after the use of radial access vs. femoral access in patients with STEMI referred for primary PCI [22].

Metanalyses

Metanalyses are often composed to overcome conflicting results of randomised trials. However, the selection process of which trials to include or exclude from analysis appears incomprehensible. In 2016 Ferrante included 24 studies that enrolled 22,843 PCI patients. Although the difference was small, radial was associated with significantly lower all-cause mortality and MACE, as well as less major bleeding and fewer vascular complications (Death of all cause: -0.6% (p = 0.001), MACE: -1.1% (p = 0.002), Maj. Bleed: -1 % (p<0.001), Maj. Vasc.Cpl.: -0.9 % (<0.001)[8]. All randomised trials, including this metanalysis failed to mention any radial artery occlusion, a vascular complication that is not trivial and that occurs in up to 10% of the patients [27,29].

Shah recently reported a metanalysis of 13 randomised trials of PCI in patients with ACS including 15,516 patients showing that following TFA the major bleeding, MACE and mortality rates of radial experts was significantly increased compared to their results of TRA and to those of transfemoral experts who had similar low complications rates for TFA and TRA. He concluded that the recently reported survival differences between TRA and TFA may have been driven by adverse events in the TFA groups, rather than by a beneficial effect of the TRA itself and that it is too early to label radial access a lifesaving procedure in invasively managed patients with ACS [27]. We do have a different explanation: To our view the inferior results of TFA of radial experts is probably attributed to insufficient skills in TFA (Figure 2).

fig 2

Figure 2: Meta-analysis of randomized controlled trials (Data from 13 trials including 15,615 patients). Only TFA performed by radial experts resulted in a significant increase in MACE [27].

Image Quality and Interventional Success Rates

After getting familiar with radial approach there is no reason to believe that it is not applicable for > 90% of diagnostic and interventional procedures. That being said, it is frequently more difficult to cannulate one or another coronary artery from a transradial approach. This invariably leads to poor quality diagnostic studies [13] and/or imperfect or failed PCI [9,12]. Transfemoral PCI is easier than radial PC because of fewer access problems and a higher likelihood of being able to use larger guides (e.g. 7F and 8F) that might be necessary to enhance support and apply devices in parallel especially with complex lesion morphology. A small randomised trial (n = 1024) showed a highly significantly increased success rate for TFA (99.8% versus 96.5%, p<0.0001) following diagnostic and interventional coronary procedures [30].

A higher trans radial failure rate is also reflected by the large randomized trials: In the RIVAL trial that randomly investigated 7021 ACS patients with PCI, crossover related to failure of initial strategy was 7·0% in the radial group and 0·9% in the femoral group. Main reasons for failure were spasm (5%), looped radial artery (1.3%) and tortuous subclavian artery (1.9%) [9]. RIFLE-STEACS reported a cross over rate from radial to femoral in 9.6% [31]. MATRIX, the largest randomised comparison (n = 8404 patients with ACS) reports a conversion to femoral of 5.8% [12]. Switching to transfemoral upon failed trans radial PCI, will result in a >90% success rate [25]. It can be assumed that significant time was wasted first trying TRA then crossing over to TFA. This is especially a problem in ACS patients.

Radiation Exposure

As long as procedure time is similar, radiation exposure to patients should not differ substantially between TRA and TFA. In the RIVAL trial, however, fluoroscopy times were significantly longer for the radial approach [32]. Due to a closer position and thus increased scattering, even highly experienced operators, receive at least twice the amount of radiation as do their femoral counterparts [14,33,34]. Therefore, compelling young operators to stick mainly with transradial approach, as put into practice in an increasing number of institutions, appears irresponsible unless the benefit for patients is crystal clear – which is not the case until today.

Patient Comfort

Most operators agree that transradial approach is more convenient for the patient, mainly because early ambulation is possible in almost all patients, and also because postinterventional compression of the femoral puncture site of up to 6 hours can be distressing. On the other hand, different from femoral access that is generally tolerated very well, transradial access may be painful especially via small arteries and when spasm occurs. Diagnostic procedures via femoral artery may in >>50 % of the patients be performed with 4 F catheters (our practise since 1997), necessitating compression of the puncture side of 1 h only, and, following interventions with 6 -8F guides, we regularly apply closure devices that limit the (moderate) femoral compression to 2 hours and that also allow to ambulate the patients the same day. Since then we very rarely experience complaints about pain or discomfort.

Conclusion

The current movement from TFA to TRA in interventional treatment of ACS is not justified by evidence, since the randomised trials are showing conflicting results. If performed properly, TFA does not cause more complications than TRA but requires overnight hospitalisation unless vascular closure devices are applied. It is not justifiable to require operators to endure twice the radiation exposure to achieve an earlier ambulation. Forthcoming comparative studies need to include access- and sheath-removal protocols and need to appreciate postinterventional radial artery occlusion as a vascular complication.

Appendix

Recommended techniques for femoral artery puncture and groin management during and after diagnostic and therapeutic procedures performed via transfemoral approach.

Puncturing the Femoral Artery

Puncturing the femoral artery is not a technique that should be left at discretion to the operator but should follow strict rules: The needle should be razor-sharp to avoid arterial compression upon entry. For diagnostic procedures a 4F sheath is sufficient in at least 80% of patients, with 5F adequate for the rest. The target is the mid common femoral artery, a point that is usually positioned at the level of the centre of the femoral head. Higher or lower entries increase the rate of bleeding complications. At skin-level the entry is 1-2 cm below the inguinal ligament and the angle 30-45 degrees. Index and middle finger of the left hand (if puncture is performed from the right side) are firmly placed 3-5 cm proximally to feel the pulse and entry direction. Occasionally, if pulse is weak, fluoroscopy is needed to identify the correct direction. The “through-and through technique” should be strictly avoided. The wire should be advanced without resistance and the sheath inserted with a slight rotational motion and maintained pressure with the left hand proximally to avoid blood exit into the tissue.

Sheath Removal and Compression

The sheath should be removed immediately on the table or on a stretcher in the Cath lab to benefit from elastic recoil of the puncture, either by the operator or at least an experienced, well trained person. ACT should by <200 seconds (we rarely apply Protamine if ACT is still > 250 sec) and the systolic blood pressure should be < 160 mmHg. Sheath removal on the ward moreover by an inexperienced individual is a particularly bad idea. In patients at higher risk for bleeding we apply a closure device (Angioseal® St. Jude Medical – US/Terumo Europe).

Manual compression requires specific training and patience as well as a second person for assistance or replacement. The 3 middle fingers are firmly compressed 3-4 cm proximal to the skin puncture. The pressure should be enough to prevent any visible bleeding and any swelling. After 3-5 min the pressure may be released gradually to allow distal circulation and clotting. A frequent mistake resulting in inferior bleeding control, often used by beginners or petite persons, is to compress the site with the ball of the thumb or the balled fist. In prolonged compressions (>20 min) we use an external pressure device (Femostop® St. Jude Medical). A pressure dressing (e.g. Safeguard®) is applied if after 3-5 min of stopped manual compression there is no sign of bleeding or swelling.

The pressure dressing may be removed after 1 hour following 4F catheterization, after 2 hours following 5 F and 6 hours with 6-8F. We do recommend closing devices in all suitable patients following 6F and larger sheaths. The compression may be removed in these patients after 2 hours, and ambulation may be allowed in ordinary patients after 4 hours. We prefer to use a closure device (Angioseal®) in all patients that had 5-8 F sheaths, after an angiographic confirmation that the punctured common femoral artery is not severely stenosed and at least 6 mm in diameter. These patients don’t need any compression and a dressing at moderate pressure for 2 hours.

References

  1. Neumann FJ, Miguel Sousa-Uva, Anders Ahlsson, Fernando Alfonso, Adrian P Banning, et al. (2018) 2018 ESC/EACTS Guidelines on myocardial revascularization. Eur Heart J 40: 87-165. [crossref]
  2. Kolkailah AA, Rabah S Alreshq, Ahmed M Muhammed, Mohamed E Zahran, Marwah Anas El-Wegoud, et al. (2018) Transradial versus transfemoral approach for diagnostic coronary angiography and percutaneous coronary intervention in people with coronary artery disease. Cochrane Database Syst Rev 4: CD012318. [crossref]
  3. Mason PJ, Binita Shah, Jacqueline E Tamis-Holland, John A Bittl, Mauricio G Cohen, et al. (2018) An Update on Radial Artery Access and Best Practices for Transradial Coronary Angiography and Intervention in Acute Coronary Syndrome: A Scientific Statement From the American Heart Association. Circ Cardiovasc Interv 11: e000035. [crossref]
  4. Reifart J, Albrecht A, Haerer W, Levenson B, Ringwald G, et al. (2020) Acceptance and safety of femoral vs. radial access for percutaneous coronary intervention(PCI): Results from a large monitor-controlled German registry (QuIK). Submitted for publication.
  5. Roffi M, Carlo Patrono, Jean-Philippe Collet, Christian Mueller, Marco Valgimigli, et al. (2016) 2015 ESC Guidelines for the management of acute coronary syndromes in patients presenting without persistent ST-segment elevation: Task Force for the Management of Acute Coronary Syndromes in Patients Presenting without Persistent ST-Segment Elevation of the European Society of Cardiology (ESC). Eur Heart J 37: 267-315. [crossref]
  6. Ibanez B, Stefan James, Stefan Agewall, Manuel J Antunes, Chiara Bucciarelli-Ducci, et al. (2018) 2017 ESC Guidelines for the management of acute myocardial infarction in patients presenting with ST-segment elevation: The Task Force for the management of acute myocardial infarction in patients presenting with ST-segment elevation of the European Society of Cardiology (ESC). Eur Heart J 39: 119-177. [crossref]
  7. Valgimigli M, et al. Transradial versus transfemoral intervention for acute myocardial infarction: a propensity score-adjusted and -matched analysis from the REAL (REgistro regionale AngiopLastiche dell’Emilia-Romagna) multicenter registry. JACC Cardiovasc Interv 5: 23-35.
  8. Ferrante G, Sunil V Rao, Peter Jüni, Bruno R Da Costa, Bernhard Reimers, et al. (2016) Radial Versus Femoral Access for Coronary Interventions Across the Entire Spectrum of Patients With Coronary Artery Disease: A Meta-Analysis of Randomized Trials. JACC Cardiovasc Interv 9: 1419-1434. [crossref]
  9. Jolly SS, Salim Yusuf, John Cairns, Kari Niemelä, Denis Xavier, et al. (2011) Radial versus femoral access for coronary angiography and intervention in patients with acute coronary syndromes (RIVAL): a randomised, parallel group, multicentre trial. Lancet 377: 1409-1420. [crossref]
  10. Hvelplund A, Raban Jeger, Remo Osterwalder, Majken Bredahl, Jan Kyst Madsen, et al. (2011) The Angio-Seal femoral closure device allows immediate ambulation after coronary angiography and percutaneous coronary intervention. EuroIntervention 7: 234-241. [crossref]
  11. Safley DM, Amit P Amin, John A House, Dmitri Baklanov, Rebecca Mills, et al. (2013) Comparison of costs between transradial and transfemoral percutaneous coronary intervention: a cohort analysis from the Premier research database. Am Heart J 165: 303-309. [crossref]
  12. Valgimigli M, Andrea Gagnor, Paolo Calabró, Enrico Frigoli, Sergio Leonardi, et al. (2015) Radial versus femoral access in patients with acute coronary syndromes undergoing invasive management: a randomised multicentre trial. Lancet 385: 2465-2476. [crossref]
  13. Chow WWK, Rong Bing, Juliana Kanawati, Jerrett Lau, Javed Sheriff, et al. (2018) A Comparison of Image Quality Using Radial vs Femoral Approaches in Patients Undergoing Diagnostic Coronary Angiography. J Invasive Cardiol 30: 411-415. [crossref]
  14. Brasselet C, Thierry Blanpain, Sophie Tassan-Mangina, Alain Deschildre, Sébastien Duval, et al. (2008) Comparison of operator radiation exposure with optimized radiation protection devices during coronary angiograms and ad hoc percutaneous coronary interventions by radial and femoral routes. Eur Heart J 29: 63-70. [crossref]
  15. Rashid M, Chun Shing Kwok, Samir Pancholy, Sanjay Chugh, Sasko A Kedev, et al. (2016) Radial Artery Occlusion After Transradial Interventions: A Systematic Review and Meta-Analysis. J Am Heart Assoc 5: e002686. [crossref]
  16. Hahalis G, Konstantinos Aznaouridis, Gregory Tsigkas, Periklis Davlouros, Ioanna Xanthopoulou, et al. (2017) Radial Artery and Ulnar Artery Occlusions Following Coronary Procedures and the Impact of Anticoagulation: ARTEMIS (Radial and Ulnar ARTEry Occlusion Meta-AnalysIS) Systematic Review and Meta-Analysis. J Am Heart Assoc 6: e005430. [crossref]
  17. Gaudino M, Alessandro Leone, Andrea Lupascu, Amelia Toesca, Andrea Mazza, et al. (2015) Morphological and functional consequences of transradial coronary angiography on the radial artery: implications for its use as a bypass conduit. Eur J Cardiothorac Surg 48: 370-374. [crossref]
  18. Kwok CS, Muhammad A Khan, Sunil V Rao, Tim Kinnaird, et al. (2015) Access and non-access site bleeding after percutaneous coronary intervention and risk of subsequent mortality and major adverse cardiovascular events: systematic review and meta-analysis. Circ Cardiovasc Interv 8: e001645. [crossref]
  19. Kugelmass AD, David J Cohen, Phillip P Brown, April W Simon, Edmund R Becker, et al. (2006) Hospital resources consumed in treating complications associated with percutaneous coronary interventions. Am J Cardiol 97: 322-327. [crossref]
  20. Applegate RJ, Matthew T Sacrinty, Michael A Kutcher, Frederic R Kahl, Sanjay K Gandhi, et al. (2008) Trends in vascular complications after diagnostic cardiac catheterization and percutaneous coronary intervention via the femoral artery, 1998 to 2007. JACC Cardiovasc Interv 1: 317-326. [crossref]
  21. Reifart J, Albrecht A, Haerer W, Levenson B, Ringwald G, et al. (2016) Femoral vs. radial access for coronary intervention (PCI) in patients with acute myocardial infarction (NSTEMI an STEMI): results from a large monitor-controlled German registry (QuIK), EuroPCR, Editor. EAPCI: Eurointerv.
  22. Le May M, George Wells, Derek So, Aun Yeong Chong, Alexander Dick, et al. (2020) Safety and Efficacy of Femoral Access vs Radial Access in ST-Segment Elevation Myocardial Infarction: The SAFARI-STEMI Randomized Clinical Trial. JAMA Cardiol 5: 126-134. [crossref]
  23. Arora N, Michael E Matheny, Carrie Sepke, Frederic S Resnic (2007) A propensity analysis of the risk of vascular complications after cardiac catheterization procedures with the use of vascular closure devices. Am Heart J 153: 606-611. [crossref]
  24. Rashid M, Chun Shing Kwok, Samir Pancholy, Sanjay Chugh, Sasko A Kedev, et al. (2016) Radial Artery Occlusion After Transradial Interventions: A Systematic Review and Meta-Analysis. J Am Heart Assoc. 5: e002686. [crossref]
  25. Bertrand OF, Sunil V Rao, Samir Pancholy, Sanjit S Jolly, Josep Rodés-Cabau, et al. (2010) Transradial approach for coronary angiography and interventions: results of the first international transradial practice survey. JACC Cardiovasc Interv 3: 1022-1031. [crossref]
  26. Peter J Mason BS, Jaqueline E Tamis-Holland, John A Bittl, Mauricio G Cohen, Jordan Safirstein, et al. (2018) An Update on Radial Artery Access and Best Practices for Transradial Coronary Angiography and INtervention in Acute Coronary Syndrome. Circulation: Cardiovascular Interventions 11: e000035. [crossref]
  27. Shah R, AR, Haji SA, Rashid A (2017) Mortality and operator experience with vascular access for percutaneous coronary intervention in patients with acute coronary syndromes: A pairwise and network meta-analysis of randomized controlled trials. Int J Cardiol 248: 114-119. [crossref]
  28. Le May MR, K Singh, GA Wells (2015) Efficacy of Radial Versus Femoral Access in the Acute Coronary Syndrome: Is it the Operator or the Operation That Matters? JACC Cardiovasc Interv 8: 1405-1409. [crossref]
  29. Zankl AR, M Andrassy, C Volz, B Ivandic, U Krumsdorf, et al. (2010) Radial artery thrombosis following transradial coronary angiography: incidence and rationale for treatment of symptomatic patients with low-molecular-weight heparins. Clin Res Cardiol 99: 841-847. [crossref]
  30. Brueck M, Dirk Bandorski, Wilfried Kramer, Marcus Wieczorek, Reinhard Höltgen, et al. (2009) A randomized comparison of transradial versus transfemoral approach for coronary angiography and angioplasty. JACC Cardiovasc Interv 2: 1047-1054. [crossref]
  31. Romagnoli E, Giuseppe Biondi-Zoccai, Alessandro Sciahbasi, Luigi Politi, Stefano Rigattieri, et al. (2012) Radial versus femoral randomized investigation in ST-segment elevation acute coronary syndrome: the RIFLE-STEACS (Radial Versus Femoral Randomized Investigation in ST-Elevation Acute Coronary Syndrome) study. J Am Coll Cardiol 60: 2481-2489. [crossref]
  32. Jolly SS, John Cairns, Kari Niemela, Philippe Gabriel Steg, Madhu K Natarajan, et al. (2013) Effect of radial versus femoral access on radiation dose and the importance of procedural volume: a substudy of the multicenter randomized RIVAL trial. JACC Cardiovasc Interv 6: 258-266. [crossref]
  33. Lange HW, H von Boetticher (2012) Reduction of operator radiation dose by a pelvic lead shield during cardiac catheterization by radial access: comparison with femoral access. JACC Cardiovasc Interv 5: 445-449. [crossref]
  34. Sciahbasi A, Christian Pristipino, Giuseppe Ambrosio, Isabella Sperduti, Enrico Vittorio Scabbia, et al. (2009) Arterial access-site-related outcomes of patients undergoing invasive coronary procedures for acute coronary syndromes (from the ComPaRison of Early Invasive and Conservative Treatment in Patients With Non-ST-ElevatiOn Acute Coronary Syndromes [PRESTO-ACS] Vascular Substudy). Am J Cardiol 103: 796-800. [crossref]