Author Archives: rajani

Endovascular Treatment for Carotid Blowout Syndrome with Acute Hemorrhage in Head and Neck Cancers: A Report of Two Cases

DOI: 10.31038/JCCP.2020322

Abstract

We present two cases of carotid blowout syndrome with a hemorrhagic shock treated with an endovascular approach. In the first case, the treatment was performed by a selective embolization, while in the other case, both embolization and positioning of a covered stent was performed in order to avoid bleeding of external carotid artery. These endovascular treatments allowed the resolution of bleeding and the survival of the patients. Unfortunately, both patients died six months after the procedure for the evolution of their neoplastic disease. The endovascular treatment of carotid blowout syndrome represents a valid therapeutic option to stop carotid bleeding, but it does not change the prognosis of the patients.

Keywords

Carotid blowout, Covered stent, Hemorrhage

Introduction

The incidence of significant hemorrhage in patients with Head and Neck cancer is approximately 6-14%, while terminal hemorrhages occur in approximately 3-12%of cases [1,2]. Head and neck cancer is the eighth most common cancer worldwide, and account for approximately 3% of all malignant tumors [3]. These are a broad category including diverse types originating from different anatomical structures like craniofacial bones, soft tissues, salivary glands, skin, and mucosal membranes with squamous cell carcinoma, which is the most common histological type (90%) [4]. the 5–years survival rate for head and neck cancers is around 60% [3]. Although chemotherapy and radiotherapy have improved the life expectancy of patients with head and neck cancers, they have also increased the risk of hemorrhage up to 7.6 times (4-6). These cancers are the most common cancers associated with hemorrhage, with an incidence rate ranging from 0.5-to 10% [2,6,7]. Carotid blowout syndrome is a rare, life threatening complication in patient with advanced head and neck cancer [8]. It refers to the ruptureof the carotid artery or its extracranial branches, usually secondary to tumor encasement or invasion. It can occur after good response to radical treatment, in which there is loss of tissue bulk surrounding and supporting an artery due to previous tumor invasion. Untreated carotid blowout syndrome is associated with mortality rates up to 60% and neurological morbidity of 40% [9]. Risk factors for carotid blowout syndrome in patients with head and neck cancer include post-radiotherapy necrosis, recurrent tumors, pharyngo-cutaneous fistulas, poor nutrition, diabetes mellitus and prolonged corticosteroid use [10]. When acute bleeding occurs from carotid blowout, treatment options are surgical ligation, endovascular embolization, or reconstruction with covered stents [11]. Surgery in a previously irradiated areamay be challenging, and emergent operative ligation can be associated with higher rate of major morbidity [9].

Cases Report

We reported two cases of carotid blowout syndrome with acute hemorrhage in patients with head and neck cancer.

Case 1

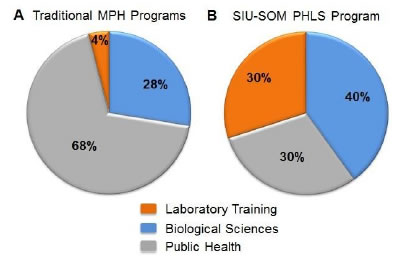
A 49-year old man was diagnosed in October 2017 with squamous carcinoma of the tongue. He had previous medical history and potus actively. After biopsy he was treated with neoadjuvant chemotherapy. The patient received 3 cycles of chemotherapy with DCFwithout complication. CT imaging showed partial response. The case was discussed at a multi-disciplinary tumor board and concomitant radiotherapy and chemotherapy with platinum was initiated. After the treatment the patient refused examinations. Seven month later, the patient was hospitalized due to an aggravation of the clinical conditions. CT imaging documented a local recurrence of cancer. During the hospitalization a respiratory disorder was presented. Tracheostomy was urgently performed. Unfortunately, a massive hemorrhage appeared with hemodynamic instability and hemorrhagic shock. The patientafter intensive care, the patient underwent the endovascular treatment urgent with embolization of the external carotid artery and its branches (Figure 1). There were no central neurological complications (Stroke ischemic or TIAs) and after 12 hours the bleeding ceased with restoration of a goodhaemodynamic compensation. There were no episodes of re-bleeding during the hospital stay. The patient was discharged and transferred to Hospice. The patient died after 6 months due to the progression of the neoplastic disease which led him to acute respiratory failure.

JCCP-3-2-309-g001

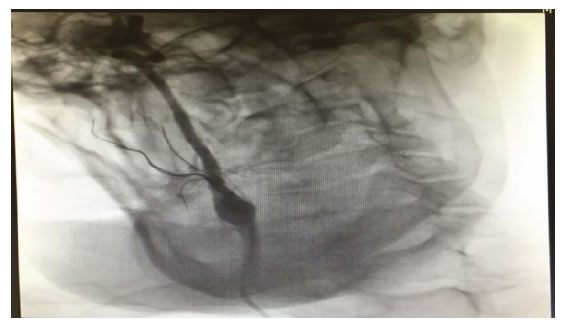
Figure 1. Endovascular treatment with embolization ECA and its branches.

Case 2

A 66-year-old patient underwent hemimandibulectomy with resection of the pterygoid and masseter muscles in July 2017. A histological examination showed a squamous carcinoma. After surgery, six cycles of chemotherapy comprising Cisplatin, 5-FUand Cetuximab was administered without complication. After 3 months a whole-Body 18F-FDG PET/CT showed lymph node progression. Second-line chemotherapy with the Carboplatin-Taxol was initiated without complication. After 3 cycles of chemotherapy, platinum-based radio-chemotherapy was started in December 2018. In January 2019 he showed rapid clinical progression of the disease and was admitted to our Department. During the hospitalization a massive hemorrhage appeared without hemodynamic instability. Therefore the patient underwent urgent CT of the neck which showed the presence of a pseudoaneurysm of the external carotid artery but a bleb of the common carotid artery immediately before the carotid bifurcation caused by neoplastic tissue sleeve around the bifurcation caused by neoplastic tissue sleeve around the bifurcation (Figure 2). Therefore it was necessary to undergo in urgency the patient not only to embolization of the pseudoaneurysm of the external carotid artery with controlled release spirals (Axium EV-3) but also to reconstruct the common carotid artery by positioning a stent coveredViabahn (Gore) between the common and internal carotid arteries in order to avoid the rupture of the vessel downstream of the pseudoaneurysm by the sleeve of neoplastic tissue present around (Figure 3). There were no central neurological complications (Stroke ischemic or TIAs) and the bleeding stopped immediately. The patient was immediately treated with dual anti-aggregation therapy to avoid intrastent thrombosis and there were not episodes of re-bleeding during the hospital stay. The patient was discharged and suspended chemo-radiation treatment and sent for supportive therapy. After 6 months the patient is still alive even though in progression with the neoplastic disease and did not present new episodes of bleeding or signs of capped stent infection.

JCCP-3-2-309-g002

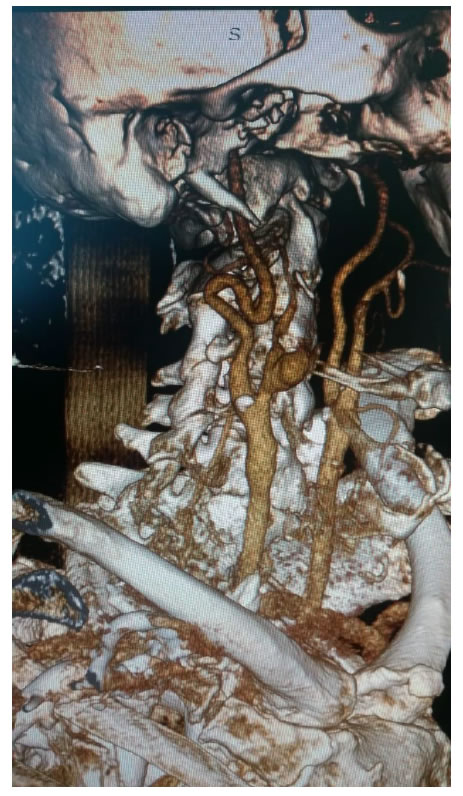
Figure 2. Angio-CT vessels neck showing pseudoaneurysm ECA e neoplastic tissue around carotid bifurcation.

JCCP-3-2-309-g003

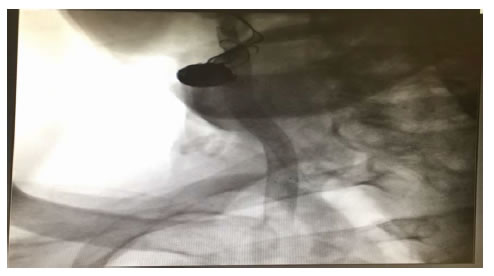
Figure 3. Endovascular treatment with embolization ECA and its branches e covered stent graft between ICA an CCA.

Discussion

Carotid Blowout Syndrome (CBS) is an uncommon complication of the advanced head and neck cancer. With continuing advancement and availability of endovascular techniques, an endovascular approach to be treatment of carotid blowout syndrome has been demonstrated tobe safe and has potential to control acute bleeding events and improve quality of life.The incidence has been estimated to be between 2% an 5% in patients receiving intervention for head and neck cancer, up to 10%in those receiving repeated courses of radiation. The morbidity of CBS has been–described, with perioperative mortality rate as high as 30% and a perioperative stroke rate as high as 15%, but remain highly variable owing to the rarty of the condition [12-13]. Both embolization and stentgrafts have been used in the management acute or impending carotid blowout. The most common locations or tumor were in the oral cavity and larynx and tho most common bleeding origin was the common carotid artery [14]. Both endovascular treatment were successful technically for immediate bleeding cessation in those with acute hemorrhage, but with a strokerate of around 11%. The risk of procedural stroke was lowest with embolizaion for CBS in the external carotid artery 1.7%, followed by stent graft of internal carotid artery / common carotid artery (ICA/CCA) 2,5% and then embolization of ICA/CCA 10,3% with post-treatment fatal re-bleeding occurring only 3,4% [11]. This compares favorably to the natural history of untreated carotid blowout syndrome, with associated risk of neurological morbidity up to 40% and mortality rate up to 60% [9].

Embolization of the ICA/CCa was generally preceded by the balloon test occlusion and stent graft was more likely to be performed in the presence of contralateral carotid artery occlusion, intolerance of balloon occlusion testing or angiographic evidence of an incomplete circle Willis [15]. Notably, despite the balloon test occlusion, the procedural stroke rate was higher after embolization of the ICA/CCA (10.4%) compared to the stent graft (2,5%). The rebreeding rate after stent graft was higher (31,9%) compared with embolization (9,1%), which may relate to the use of dual antiplatelet agents after stent grafts, which are typically not required after embolization . Importantly, 94% of patients treated for CBS involving the ICA/ACC did not experience fatal re-bleending, with no difference between embolisation and stent grafts [11]. Chang et all. Included 96 patients with CBSof which had lesion in the CCA, ICA, or bifucation: 38 patients were treated with embolization after passing a ballon occlusion test, and 18 patients underwent stent graft. Similarly, procedural stroke rates were similar (embolization 10.5%; stent graft 11,1%) and significantly higher rates of rebleeding in group stent graft 38.9% versus embolization 13,2%.

For embolization of CBS arising from branches of the External Carotid Artery, the procedural stroke rate was <2%. Although there were no fatal re-bleeds, another episode of bleeding did occur in 30% of the patients. This is similar to the largest case series by Chang. et all [15] in which35% of patients had rebleding [16]. The reason for rebleeding is not clear, and was not extractable from the literature. Potential reasonsbforrebleeding may relate to lack of identification of a target vessel, or retrograde flow from the rich collateral network of the external carotid artery when proximal occlusion of a target vessel is performed. Moreover, a new lesion of the ECA cranchmaya rise or the tumor bed could rebleed as the tumor continues to recruit neo-vascularity [16,17]. Moreover these was a higher rate of delayed stroke or TIA after stent grafts compared to embolization of the ICA/CCA. Although this coul relate to delayed stent thrombosis, the majority (two-third) of stent thrombosisi were asymptomatic. In addition, delayed stroke could relate to use post stent graft antiplatelet agents. The most common regimen was clopidogrelans aspirin foe 1-3 months, followed by life-long aspirin use. The antiplatelet regimens used are generally tailored to the clinical presentation, balancing the individual risk of rebleeding and ischemic stroke [11].

In the two cases treated, we first tried to stop the massive bleeding. In the first case where there was a hemorrhagic shock we immediately did the embolization of the external carotid artery not only of the main trunk but also of the branches of division, using spirals. In fact there was no neurological complication of ischemic type, nor new bleeding.in the second case there was no hemodynamic instability linked to bleeding which required to stop the bleeding immediately. Thus it was possible to perform a CT scan of the neck vessels which allowed to identify not only the origin of the bleeding but also the extent of the neoplastic disease. In fact, the simple embolization of the external carotid artery and its own pseudoaneurysm due to neoplastic infiltration of the wall would have temporarily solved the bleeding. In fact, the presence at CT of a neoplastic tissue sleeve around the carotid bifurcation with initial contour alteration would soon lead to a new bleeding. Therefore we changed surgical strategy proceeding both to the embolization of the pseudoanerysm of the external carotid artery and of the main trunk and to a reconstruction endovascular with the Stent graft covered Viabahn (gore) 7 x 10 mm, positioned between the internal carotid artery and the common carotid artery, covering the outer external carotid artery ostium and the neoplastic tissue sleeve around the carotid bifurcation. there was no neurological complication of ischemic type, nor new bleedingTherefore this work exposes a small and limited experience to only two cases but, however reliable, there were no complications and the patients survived the massive bleeding of Carotid Blowout Syndrome. important is the planning of endovascular strategy.

Conclusion

The endovascular approach appears to be, in our opinion, the gold standard for the treatment of bleeding from neoplasms, perhaps relapses, of head and neck after tumor removal with associated lymphadenectomy, or chemotherapy and subsequent radiotherapy. In fact, both the embolization of the external carotid artery or ICA / CCA, and the placement of a covered stent have proved and are reliable for the immediate control of the acute hemorrhage in progress. Complications can possibly be controlled if proper operative intervention is planned based on the location of the source of the bleeding and the extent of the neoplastic disease. For this reason it is fundamental to perform a CT scan of the neck vessels, if the patient’s haemodynamic conditions allow it, in order to evaluate the type of endovascular intervention to be carried out to not only stop bleeding but reduce the risk of perioperative complications.

References

  1. Ubogagu E, Harris DG (2012) Guideline for the management of terminal Hemorrhage in palliative care patients with advanced cancer discharged home for end-to-life care. BMJ Support Palliat Care2: 294-300. [Crossref]
  2. Harris DG, Noble SI (2009) Management of terminal hemorrhage in patients with advanced cancer; a systematic literature review. J Pain Symptom Manag38: 913-927. [Crossref]
  3. Jemal A, Siegel R, Xu J, Elizabeth Ward (2010) Cancer Statistics, 2010. CA Cancer J Clin60: 277-300. [Crossref]
  4. Pai SI, WestraWH (2009) Molecular Pathology of head and neck cancer: implications for diagnosis, prognosis, and treatment. Ann Rev. Pathol4: 49-70.[Crossref]
  5. Ringash J (2015) Survivorship and quality of life in head and neck cancer. J ClinOncol33: 3322-3327. [Crossref]
  6. Self EM, Bunpous J, Ziegler C, Liz Wilson, Kevin Potts (2013) Risk factors for hemorrahage after chemoradiation for oropahryngeal squamous cell carcinoma. JAMA Otolaryngol Head Neck Surg139: 356-361. [Crossref]
  7. HessénSoderman AC, Ericson E, Hemlin C, ClaesHemlin, Elisabeth Hultcrantz, IngemarMånsson, et al. (2011) Reduced risk of primary postoperartivehemorrhage after tonsil surgery in Sweden: results from The National Tonsil Surgery Register in Swedwe covering more tha 10 years and 54696 operations. Laryngoscope121: 2322-2326. [Crossref]
  8. Upile T, Triaridis S, Kirland P, Daniel Archer, Adam Searle, et al. (2005) The management of carotid artery rupture. Eur Arch Otorhinolaryngol262: 555-560. [Crossref]
  9. Chaloupka JC, Putman CM, Citardi MJ, D A Ross, C T Sasaki (1996) Endovascular Therapy for the carotid blowout syndrome in head and neck surgical patientsdiagnostic and managerial considerations. AJNR Am J Neuroradiol 17: 843-852. [Crossref]
  10. McDonald MW, Moore MG, Johnstone PA (2012) Risk of carotid blowout after reirradiation of the head and neck: a systematic review. Int J RadiatOncol Bio Phys 82: 1083-1089. [Crossref]
  11. Wong DJY, Donaldson C, Lai LT, Andrew Coleman, Charles Giddings,et al. (2017) Safety and effectiveness of endovascular embolization or stent-graft reconstruction for treatment of acute carotid blowout syndrome in patients with head and neck cancer: case series and systematic review of observational studies. Head & Neck40:846-854. [Crossref]
  12. Cohen J, Rad I (2004) Contemporary Management of carotid blowout. CurrOpinOtolaryngol Head Neck Surg 12:110-115. [Crossref]
  13. Morrisey DD, Andersen PE, Nesbit GM, S L Barnwell, E C Everts, et al. (1997) Endovascular management of hemorrhage in patients with head and neck cancer. Arch Otolaryngol Head Neck Surg123: 15-9. [Crossref]
  14. Liang NL, Guedes BD, Duvvuri U, Michael J Singh, Rabih A Chaer,et al. (2016) Outcomes of interventions for carotid blowout syndromein patients with head and neck cancer.J Vascsurg63:1525-1530. [Crossref]
  15. Lesley WS, Chaloupka JC, Weigele JB, SundeepMangla, Mohammad A Dogar(2003) Preliminary experience with endovascular reconstruction of the management of carotid blowout syndrome. AJNR AmJNeuroradiol 24: 975-981. [Crossref]
  16. Chang FC, Luo CB, Lirng JF, Chung-Jung Lin, Han-Jui Lee, et al. (2015) Endovascular management of post-irradiated carotid blowout syndrome. PLoS One 10: e0139821. [Crossref]
  17. Behzad SF, DongHlee, Ahmed Khalil, Sunil Abrol, Lucio Flores (2014) Carotid Blowout Syndrome: Endovascular management of acute Hemorrhage with Tapering Overlapped Covered Stents. Ann. VascSurg 28:1934.e7-11. [Crossref]

Overconfidence in Medical Research: The Role of P-Value and Hypothesis Testing Paradigm

DOI: 10.31038/JCCP.2020321

Abstract

Wediscusse theoverconfidence medical publications place on p value determinations. Commonly used statistical methods donot establish truth or causation.Determination of the P value is considered to bethe least helpful in assessing the uncertainty of a scientific statement. We suggest the confidence placed on p value determination as currently used in scientific literature reporting is not justified.

Keywords

H0 = Null hypothesis, H1 = Alternative hypothesis, NHST = Null hypothesis statistical testing

Introduction

About 300,000 biomedical articles are published per year in the US and Europe alone [1]. The vast majority of scientific medical communications, spoken or in print, commonly use unsupported language with certainty and statements of causation. The findings, once determined to be “statistically significant” by p value determination, are presented and treated as absolute truth.This publication argues that, for numerous reasons, these convictions are misleading.

Method

Experimental biomedical sciences normally formulate an inductive statement, gather particular observations or measurements and subsequently hypothesize an explanation of the resulting data. Deductive statements proceed from an axiom (a true rule),attempting to explain particularities derived from that rule, and thus arrive at a necessarily valid conclusion, thusmaking the premise and conclusion complete. There is no accepted set of rules that would assure correct, valid induction and therefore this type of statement cannot be certain. For that reason.The validity of inductive statements has been disputed since antiquity (for example SextusEmpiricus) and the discussion gained particular impetus in the 18th century due to publications by David Hume.What he coined as “the problem of induction” [2] is addressed in experimental sciences by statistics.This is helpful in gauging, but not dismissing, the uncertainty because statistics by itself cannot establish truth nor determine causation [3]. It is in this vein that p value, so often considered the detector of objective truth or causation, can in fact establish neither.Then, what is actually determined by the use of the p value? The most often utilized statistical paradigm in biomedical research is the falsification of null hypothesis through the utility of p value (Null hypothesis statistical testing, NHST).In fact, recent analysis of top scientific journals shows that reliance on p values increased by a factor of 14 from 1990 to 2017 [4,5].

This paradigm calls for two hypotheses: The Null hypothesis (H0) admits the property that would falsify a theory or claims that observations are the result of random effect. Its counterpart, Alternative Hypothesis (H1), admits that observations are the result of a non-random cause.Whether one or the other is admitted depends on the p value [6]. With the assumption that H0 is true, p value is an arbitrarily set probability of getting the observed or more extreme results when the experiment is repeated an infinite number of times [7]. Since the p value is based upon the assumption that the null hypothesis is true, it is not a statement of probability of H0.P value indexes incompatibility of data and H0 in a sense that it is a probability of obtaining a particular test statistics value when the Null hypothesis is true.Once that probability is shown to be below the set cutoff point, H0 is rejected and H1 is admitted [6]. Therefore p value works like a binary switch between assumed random and non-random cause. In order to illustrate the utility of p value we performed an experiment in which 20 tosses of a coin resulted in 17 tails. We may suspect that the coin was somehow altered to preferentially show tails after each toss. In order to confirm or dispel the suspicion one has to have a theoretical model of the process which in this case is the distribution of all possible outcomes of 20 tosses of a “fair coin”.Each toss can result in only two possible outcomes, heads or tails with a probability 0.5, thus constituting a discrete variable.Additionally, each toss and each series oftosses can be considered independent of the others.Taken together such outcomes form binomial distribution1 , of which the probability density function is illustrated below (Figure. 1).

JCCP-3-2-308-g001

Figure 1. Probability density function of binomial distribution, in this case the possible outcomes from 20 tosses of a coin.The Y axis represents probability.The model is a mathematical representation of our understanding of reality and doesn’t constitute the reality which in this case is the concrete result of the experiment: 17 tails out of 20 tosses of a coin.

H1 hypothesis claims that the coin is altered while H0 claims the opposite.The most commonly used value for p in hypothesis testing is 0.05. According to the paradigm all outcomes with probability less than that cutoff point allow us to dismiss H0 (fair coin) and to admit H1 (altered coin), as indicated by the model.In this case, and according to the definition, p value represented by cumulative probability of obtaining 17, 18, 19, and 20 tails equals 0.0013. While the paradigm suggests at this point the conclusion that the coin is altered (i.e., confirms hypothesis H1), we in fact still have two possibilities: 1. the coin is altered, and 2. the coin is “fair”, and a rare event happened.P value doesn’t help to decide between these two alternatives.Instead, it determines the probability of data not observed in the original experiment, but rather that predicted by the model with the assumption that H0 is true.Another way of looking at it is that p value is a probability of obtaining a particular result of calculated test statistic but it doesn’t cast light on either the Null or on the Alternative hypotheses. Since the procedure only allows to reject H0 it leaves us without any indication how well the data fit H1 and does not force us to explain why we chose this particular H1 and not one of credible alternatives. The deductive logical structure modus ponens has the form: if r then s; r; therefore s.The statement: “if rain then wet pavement; rain; therefore wet pavement” is true providing that pavement is not covered by a roof. If we obscure r and observe wet pavement we can form the hypothesis regarding the cause.The mechanics of NHST will allow to reject H0 (dry pavement) but will fail to help affirming the cause of wet pavement (rain, melting snow, flood, etc.). Thus the statement: “if wet pavement then rain” is false because rain is only one of many possible causes of wet pavement.The difficult to grasp and elusive meaning of the hypothesis testing paradigm lends itself to many misconceptions regarding the meaning of p value and to multiple inferential errors and is summarized by S. Goodman [7]. In the case of our coin tossing experiment the truth about the coin may be easier to ascertain if we repeat the original experiment and, probably more importantly, if we perform different experiments [8].

JCCP-3-2-308-e001

The logical problem of inverted conditional

The aim of experimental investigations is to establish the probability of hypothesis in light of data. This is symbolically noted as

Pr (H|D)

Let’s assume that an observation is made that leads to a hypothesis tying hip fracture and advanced age to increased mortality.Further, let’s assume that statistical analysis determined that the patient’s age is a significant factor at p=0.04. Is there justification of inductive statement that ties together hip fracture, patient’s age and probability of death? Based on the definition of p value it is possible to state that for p<0.05 the data are not likely if H0 is assumed to be true, and conversely for p> 0.05 the data are likely if H0 is assumed to be true.In either case the probability refers to data rather than the hypothesis. Instead of

Pr(H0 | D), i.e. probability of survival in light of fall (D)

the answer offered by the hypothesis testing refers to

Pr(D|H0), i.e. probability of fall (D) in light of survival (H0)

We see that the hypothesis testing using H1 and H0 leads to an inverted conditional.It tells us in this case that among many different causes of death, fall has some probability.

The following examples illustrate that reverse conditionals are not equivalent2 .The probability of hyperkalemia in the course of ketoacidosis, Pr (hyperkalemia | ketoacidosis), is high, it happens very often. On the other hand, Pr (ketoacidosis | hyperkalemia) assess the probability of ketoacidosis when hyperkalemia is present. The probability is low because there are many other reasons for hyperkalemia. Similarly, probability of pregnancy being a woman, Pr (pregnancy | woman) is about 0.02 assuming the average woman is pregnant about 2% of her life with 2 children; but Pr(woman | pregnancy) is 1 because men don’t get pregnant.More generally:the probability of obtaining a particular test statistic value (p value) given the null hypothesis is not the same as the probability of the null hypothesis given that a particular test statistic value was obtained.An interesting logical analysis of a statement made by R. Fisher regarding p value was made by W. Briggs [9]. He cites Fisher: “Belief in null hypothesis as an accurate representation of the population sampled is confronted by a logical disjunction: Either the null is false, or the p-value has attained by chance an exceptionally low value”.Briggs re-writes that statement maintaining its logical structure: “Either the null is false and we see a small p-value, or the null is true and we see a small p-value. In other words, either the null is true or it is false and we see a small p-value.Since “Either the null is true or it is false” is a tautology, and therefore necessarily true, we are left with, “We see a small p-value”. The p-value casts no light on the truth or falsity of the null.

JCCP-3-2-308-e002

The problem of irreproducibilityIf the discussed above method to gauge uncertainty of a hypothesis is dubious, then the question arises: how does it contribute to the reproducibility problem? The argument has been advanced that most published results in medical research may be false [10]. It has been further estimated that in some areas of biomedical research 75-90% of reported results are wrong [11]. Obviously the reasons for such estimation are much wider than deceiving analytical methodsand include a wide variety of factors termed together as a reproducibility problem [12-14]. Important for systematic analysis of the problem, it carefully defines components of the term “reproducibility”, distinguishing methods of reproducibility, results reproducibility, and inferential reproducibility [15]. The colloquium organized by Proceedings of National Academy of Sciences in March 2017 resulted in the whole series of articles published in vol 115 (11) discussing many responsible reasons revolving around methodological, cultural and policy aspects of that subject.

Discussion

To illustrate the problems discussed here, consider the study regarding the choice of anesthesia mode for joint replacement surgery [16]. In a retrospective study the authors analyzed 382,236 records of patients who underwent hip or knee arthroplasty comparing the impact of anesthesia type on 30 day mortality.They determined that when neuroaxial anesthesia was used, mortality was significantly lower.The reported p value was <0.001 and the relative difference of mortality in neuroaxial anesthesia group was lower by 0.08%.The finding is treated as an objective truth and in ensuing discussion the authors calculate lives possibly saved if all cases were performed under neuroaxial anesthesia.Aside from criticism of the article [17], it should be pointed out that the number of potentially saved lives is exactly what is worth proving but was not proved.The authors formulated a compelling hypothesis but demonstrating truth concerning this issue would require a prospective randomized study.The objections towards the unwarranted role ascribed to p value were succinctly summarized by American Statistical Association in its statement published in 2016 [18]. The erroneous conviction that the positive results of a study represent reality, as determined by p value, combined with a host of other methodological problems leads to a growing pool of conflicting or irreproducible reports (see PNAS Colloquium [19]) and when implemented on a wider, societal, scale may have serious adverse consequences [20].

Conclusion

Overconfidence in sciences arises from unwarranted conviction of the correctness of one’s findings.There is a widespread belief that results of a study reporting really low p value are iron clad truths while results supported by p=0.06 are not true.We argued here that this is not the case, that inductive statements, though necessary for development of knowledge, carry a varying degree of uncertainty.Statistical analysis helps to quantify it, but in itself cannot have a role of a proof.The dichotomous decision point offered by p value is imprecise at best and doesn’t help to resolve the ambiguity of an inductive statement.

References

  1. Soteriades ES, Falagas ME (2005) Comparison of amount of biomedical research originating from European Union and the United States. BMJ331: 192-194. [Crossref]
  2. Henderson L (2019) The problem of induction. In: Zalta EN (eds.). The Stanford Encyclopedia of Philosophy. Stanford. Metaphysics Research Lab, Stanford University.
  3. Hitchcock C (2018) Probabilistic causation. In: The Stanford Encyclopedia of Philosophy. Stanford. Metaphysics Reseaarch Lab, Stanford University.
  4. Chavalarias D, Wallach JD, Ho Ti Ling A, Ioannidis JPA (2016) Evolution of reporting p values in the biomedical literature 1990-2015. JAMA11: 1141-1148. [Crossref]
  5. Cristea IA, Ioannides JPA (2018) P values in display items are ubiquitous and almost always significant: a survey of top science journals. Plos one13:e0197440. [Crossref]
  6. Zar JH (1984) One sample hypothesis. In: Biostatistical analysis. Edition 2. Engelwoods Cliffs, USA: Prentice-Hall, 97-120.
  7. Goodman S (2008) A dirty dozen: twelve p-value misconceptions. SemHemat45: 135-140. [Crossref]
  8. Weisstein EW (2019) Binomial distribution. MathWorld – a Wolfram Web Resource. Available at: http://mathworld.wolfram.com/BinomialDistribution.html
  9. Briggs WM (2017) The substitute for p value. J Am Stat Assoc112:897-898.
  10. Ioannidis JPA (2005) Why most published research findings are false. PLoS Med 2: e124. Available: https://journals.plos.org/plosmedicine/article?id=10.1371/journal.pmed.0020124
  11. Begley CG, Ioannidis JPA (2015) Reproducibility in science. Improving the standard for basic and preclinical research.Circ Res116:116-126. [Crossref]
  12. Ioannidis JPA (2005) Contradicted and initially stronger effects in highly cited clinical research.JAMA249:218-228. [Crossref]
  13. Baker M (2016) Is there a reproducibility crisis? Nature Neurosci533: 452-454.
  14. Stupple A, Singerman D, Celi LA (2019) The reproducibility crisis in the age of digital medicine. NPJ Digit Med 2:2. [Crossref]
  15. Goodman SV, Fanelli D, Ioannidis JPA (2019) What does research reproducibility mean? SciTransl Med 8: 341. [Crossref]
  16. Memtsoudis SG, Sun X, Chiu Y-L, OttokarStundner, Spencer S Liu, et al. (2013) Perioperative comparative effectiveness of anesthetic technique in orthopedic patients.Anesthesiology118: 1046-1058. [Crossref]
  17. Raw RM, Todd MM, Hindman BJ (2014) The overpowered mega-study is a new class of study needing a new way of being reviewed.Anesthesiology120: 245-246. [Crossref]
  18. Wasserstein RL, Lazar NA (2016) The ASA statement statistical significance and p-values.Am Stat70: 129-133.
  19. Allison DB, Shiffrin RM, Stodden V (2018) Reproducibility of research: issued and proposed remedies. PNAS115: 2561-2562.
  20. Ziliak ST, McCloskey DN (2014) The cult of statistical significance.How the standard error costs us jobs, justice, and lives.Series: Economics, cognition, and society In: Kuran T. Ann Arbor (eds.). The University of Michigan.

Practice and Reflection on the Ethical Review on Covid-19 Pandemic

DOI: 10.31038/CST.2020522

Abstract

Since December 2019, Wuhan City, Hubei Province, has reported a cluster of pneumonia patients cause by a novel coronavirus infection with a history of exposure to the South China Seafood Market. Later, the disease has been stipulated by the law of the people’s republic of China on the prevention and treatment of infectious diseases as a B class infectious disease, and measures for the prevention and control of A-class infectious diseases have been taken [1]. The virus is airborne and spread through close contact. The main source of infection is the patients with the incubation period also highly infectious. The population is generally susceptible, and there are clusters of family aggregation [2]. During the epidemic, to protect the reviewers and researchers and reduce cross-infection, the principle of fewer meetings and avoiding gathering has been enforce and the traditional face-to-face on-site ethical review must be transformed to a contactless online review by remote online meetings. This study analyzes the background, review methods, review process, and review focus of our hospital’s ethical review during the epidemic period, and aims to provide ideas for the hospital’s ethical review for infectious disease during pandemic.

Keywords

COVID-19, Epidemic period, Contactless ethical review

Background of Ethical Review during the Epidemic Period

Ethical review is to standardize and review medical scientific research activities with the principle of ethics, thus to protect the interests and benefits of subjects, respect the rights and privacy of subjects and avoid damage to subjects [3,4]. With the increasing innovation of medical research, a growing number of researchers need to collect human specimens for research. The ethical and moral issues are more prominent during the research process, therefore more standardized and accurate ethical review works need to rely on legal regulations to protect the subjects as a premise [5]. Since December 2019, Wuhan City, Hubei Province has discovered a serial of new cases of coronavirus-infected pneumonia, and the epidemic has swept the country at an extremely rapid rate [6]. Human transmission situation of the COVID-19 is not optimistic, the number of new cases is growing every day, and has spread from large and medium-sized cities to third-tier cities and counties [1,7,8]. To control the epidemic situation, the General Office of the State Council issued documents to extend the Spring Festival holiday. Non-epidemic prevention and control related industries were recommended to work at home to avoid the occurrence of cluster infections. As a province with a large population base and a large number of infections, and various in basic conditions, Henan adopts traffic control in many districts prohibits the movement of people, and encourages people to wear masks, stay in-door, keep hygiene, and avoid massive gathering Thus to avoid cross-infection.

SARS-CoV-2 is a new virus, and there is no established clinical diagnosis and treatment method. The diagnosis and treatment of the diagnosed patients can only be carried out in accordance with the new coronavirus diagnosis and treatment guidelines issued by the National Health Construction Commission. During the outbreak of the epidemic, to support the clinical work of anti-epidemic, all regions urgently started the application of the COVID-19 related clinical research and encouraged researchers to actively declare COVID-19- related clinical research on the basis of ensuring the regular process of clinical diagnosis and treatment. These policies allow for the appropriate scientific evaluation of current interventions that are being explored or in progress, to provide corresponding countermeasures for clinical diagnosis and treatment. During the epidemic period, the number of applications for COVID-19-related projects has continued to increase. The novel coronaviruses are high-risk viruses. There   are certain risks in conducting relevant clinical studies. All relevant clinical studies should be subject to ethical review and approval by the ethics committee. As the review and supervision department, the ethics committee should conduct the review openly and transparently based on protecting the rights and benefits of the subjects to ensure the quality and efficiency of the review.

Methods of  Ethical Review during the Epidemic Period

The traditional ethical review method generally adopts face- to-face on-site review, that is, after the ethics committee secretary conducts the preliminary review of the research project, the  meeting time and venue are determined, then the ethics committee members are organized to arrive at the meeting site for the review according  to the quorum. Studies have shown that there are already some guidance documents supporting the adoption of modern information technology such as telephone conferences and video conferences to meet the timeliness and effectiveness of the review meeting. When the members cannot assemble on the meeting site due to irresistible factors such as an epidemic, remote meeting mode can be used to conduct an ethical review on the premise of accord with meeting review procedures [8]. During the epidemic, to protect the reviewers and researchers and avoid cross-infection, it is not appropriate to hold a concentrated meeting. In addition, due to traffic control, individual members or independent consultants are in a state of isolation due to irresistible factors and not reach the quorum for the on-site meeting review. It is not realistic to participate in face-to-face on-site reviews. At the same time, it is not realistic for some to participate in face- to-face on-site reviews, as the majority of medical staffs are fighting on the front line, and some researchers need to work in isolation wards. To cope with this situation, the ethics committee of our hospital broke the pattern of traditional ethical face-to-face on-site review and adopted a new review method based on electronic review materials and contactless online video conferences. Online contactless video conference enables contactless video conferences to be carried out without commissioners and researchers at the conference site, reducing the cross-infection rate, ensuring ethical review at anytime and anywhere which is a good strategy for ethical review during the epidemic.

We quickly selects 2-3 members to conduct a systematic and comprehensive review of the plan and informed consent and decides to agree, modify, or transfer to the meeting for review based on the final opinion. For projects that meet the rapid review, to avoid personnel contact, our hospital cancels the acceptance of paper-based materials and fully receives electronic versions of materials. Firstly, the secretary of the ethics committee conducts an initial review of the submitted electronic materials. After the initial review, the chairman of the committee will determine the 2-3 members for the rapid review, establish contact with the chief reviewer, and send all electronic materials to the members’ email address. After the review by the chief reviewer, the voting slip with the signature and voting results was scanned and sent to the mailbox of the ethics committee. The contactless office was carried out throughout the process, saving the time of researchers and ethics committee members by speeding up the efficiency of the review. For projects that do not meet the standards of the rapid review and must be reviewed by the meeting, the chairman will approve and decide, and our hospital will conduct a contactless ethical review of online video conferences. The ethical principles followed in the online video conference review would not change due to changes in the review format. All the conditions for review and approval of the research implementation, the research plan and the informed consent review and the face-to-face on-site review should be consistent and comply with existing laws and regulations as well as compatible with the current rules and procedures of the hospital, has certain timeliness and effectiveness, and would not change due to changes in the review method.

Ethical Review Process during the Epidemic

For projects that must undergo a conference review, our hospital conducts the contactless ethical review of online video conferences. The review process is as follows:

1. The secretary of the ethics committee conducts an initial review of all items that need to be reviewed by the meeting and sorts them according to the list of materials submitted for review. If there is a need for amendment, the researcher will be notified in time to amend. After meeting the criteria for submission, the examination materials will be sent to the referee committee members for pre-examination. The relevant materials are only used for review and should comply with the confidentiality agreement.

2. The secretary of the ethics committee determines the time of the remote online video conference and the meeting review committee establishes the review committee ethics review WeChat working group, informs the committees of the meeting timetable by phone or WeChat  and to ensure  the meeting committees meet the quorum, withdraw any members who have conflicts with the research project and sent all the electronic materials passed by the review and voting papers to the email addresses of the members in advance. At the same time, the secretary of the ethics committee formed  a researcher ethics report working for WeChat group and informed the researchers of the report schedule of the research project in advance in the group to prepare the PPT report.

3. The secretary of the ethics committee will notify all participating committee members and reporting researchers to download the remote network video conferencing software and reserve the meeting time in advance in the software. The remote network video conference standard is implemented regarding the face-to-face on-site ethical review conference, which will be chaired by the chairman of the committee. The secretary of the ethics committee will enable the remote network video conference function according to the schedule and ensure that all the participating members will join the group. Participants will ensure that both the mobile terminal and the computer terminal enable at the same time. The mobile terminal will connect to the remote network video connection to listen to the PPT report of the researchers. The computer terminal opened the electronic version of the research project materials and votes to vote. The secretary “invites” the investigators of the reports one by one on time according to the report schedule established in advance, and the members ask questions on the spot, the researchers answer the questions and exit after the report is completed. To ensure the impartiality and privacy of the review, ensure that no irrelevant personnel are present during the meeting.

4. After all the researchers have completed the reporting and Q&A sessions, the secretary ensures that the researchers, independent consultants and other unrelated personnel offline and the committee members will start full discussion and voting.

5. All participating members should complete the voting and voting during the meeting process. The secretary will conduct the on-site counting of votes and the announcement of the results, and promptly communicate the electronic version of the review decision. After the epidemic is lifted, the member’s vote and the formal review decision will be signed.

6. According to the review decision of the meeting, the chairman will issue a written ethical review opinion/approval, the scanned electronic version will be distributed to the secretary of the ethics committee, then the secretary will distribute it to the researcher’s ethics report working group for researchers to download.

7. Secretary organizes video materials after the meeting and guarantees the electronic version of conference documents and video materials for archival filing.

The Focus of Ethical Review during the Epidemic

During the COVID-19 epidemic, researchers of the COVID-19 epidemic should conduct clinical research in the same way as the non-epidemic period. All participants in the research including researchers, institutions, ethics committees, and national regulatory agencies should strictly follow the following Principles: The risks should be reasonable relative to expectations; the choice of subjects should be fair and voluntary (it is necessary to ensure that informed consent is obtained as most patients with COVID-19 are mild); the rights and health of the subjects are fully guaranteed; the research should be fully reviewed by an independent process. As the review and supervision department, the ethics committee should be fair and standardized. During the epidemic period, and the ethics review work should be focused and planned, mainly following the following points:

The review should be time-critical. The traditional face-to-face on-site review requires the submission of paper-based materials, and the reporting must be conducted on-site. After the epidemic broke out, the majority of medical staff worked hard on the front line, the clinical work to treat patients was heavy and urgent. It was necessary to conduct clinical research on COVID-19 while ensuring normal clinical work. The ethics committee should establish and improve the supervision mechanism under the premise of providing substantial protection to the subjects, simplify the ethics review process, and speed up the ethics review. The ethics committee of our hospital pre- examined the general scheme of the COVID-19 related research, adopted electronic version of the receiving materials, and no longer required the researchers to provide paper-based materials, saving time for the frontline medical staff. The research plan review follows the principle of rigor. The SARS-CoV-2 is a high-risk virus, it is risky to carry out relevant clinical research. The ethics committee as a review and supervision agency should be fair and rigorous to ensure the safety of the subjects, and no sloppiness is allowed. The focus is on whether the research plan is rigorously designed, whether the sample size selection is statistically justified, whether the grouping settings are accurate, whether the inclusion criteria and exclusion criteria are accurately demarcated. It is strictly forbidden to have subjects who meet both the inclusion criteria and exclusion criteria at the same time and effectively guarantee the research data scientific validity and subject’s acceptability of research methods. For the research involving the collection of SARS-CoV-2 specimens, focusing on examining whether the collection process is safe and whether the research is carried out in a qualified laboratory. It is not allowed to carry out experimental research on SARS-CoV-2 in unqualified and unconditional laboratories, to ensure laboratory biology safety and prevent laboratory contamination. Meanwhile, the research involving the collection and transportation of blood specimens should strictly follow the relevant national laws and regulations and be carried out after approval by the Human Genetic Resources Management Office of the Ministry of Science and Technology.

Informed consent review follows the principle of flexibility. Informed consent is the communication bridge between the researcher and the subject. It  should be focused on whether the collection of  the blood sample or biopsy sample ensures that the clinical routine diagnosis and treatment of the subject will be conducted normally and whether the right to be informed of the subject is guaranteed. The informed consent should indicate the collection method and quantity, clearly describe the rights of the subject, risks and discomfort. During the epidemic, the acquisition of informed consent should be flexible, and the forms of obtaining informed consent for different subjects can also be different. Most of the subjects involved in the clinical research of the novel coronavirus are confirmed or suspected patients of COVID-19. Many potential subjects who may be quarantined or have been quarantined are in isolation. For this group of subjects, they have the right to decide, and the signing of informed consent should adhere to the principle of self-signing. However, in the face of many severely ill subjects who are unconscious, cognitively impaired, or in critical condition, unable to comprehend the information, they should fully obtain the consent of their family member. For minor patients in quarantine, they should obtain the parent’s consent. After signing the informed consent, take special measures to keep it sealed to prevent infection caused by exposure.

Discussion

Review of an exploratory research review follows the principles of study design and clinical risk minimization. Exploratory research is mostly groping research by researchers in clinical work. After the outbreak, many critically ill patients suffer a high mortality rate. In emergencies, some researchers provide exploratory research treatments beyond clinical trials for individual patients. In the review work, the ethics committee must grasp the strength of the exploratory research review, focusing on the feasibility of the design and clinical operation of the exploratory research, whether the benefits and rights of the subjects are placed first, and to guarantee the safety is maximized and the risk is minimized in the process of exploratory research. At the same time, it is important to review whether the operation process meets the following points: there is no effective treatment for clinical treatment; it is impossible to carry out clinical research immediately; obtain preliminary support data on the effectiveness and safety of the intervention from laboratory or animal studies; approved for use by relevant national regulatory authorities; have sufficient resources to ensure that risks are minimized; fully obtain the informed consent of patients and their family members. Only when the above conditions are met can the real benefits and rights of the subjects be put in the first place, to ensure the safety of the subjects in the research process, and to avoid harm to the subjects.

Conclusion

In summary, the contactless ethical review of online video conferences during the epidemic period has effectively protected the safety of committee members and researchers and avoided cross- infection. As the review supervisory agency, the ethics committee ensures the safety of the subjects in the review process, the research protocol review follows the rigorous principle,  the  informed consent review follows the flexible principle, and the exploratory research review follows the study design and clinical operation risk minimization principles, to ensure that the ethical review work is completed with high efficiency and high quality.

References

  1. Liu Y, Ning Z, Chen Y, Guo M, Liu Y, et al. (2020) Aerodynamic analysis of SARS- CoV-2 in two Wuhan hospitals. Nature doi: 10.1038/s41586-020-2271-3.
  2. Li Q, Guan X, Wu P, Wang X, Zhou L, et al. (2020) Early Transmission Dynamics in Wuhan, China, of Novel Coronavirus-Infected Pneumonia. The New England Journal of Medicine 382: 1199-1207.
  3. DeBruin D, Leider JP (2020) COVID-19: The Shift From Clinical to Public Health Ethics. Journal of Public Health Management and Practice: JPHMP 26: 306-309.
  4. Gibney E (2020) The battle for ethical AI at the world’s biggest machine-learning conference. Nature 577: 609. [Crossref]
  5. Agich GJ (2018) Narrative and Method in Ethics Consultation. In: Peer Review, Peer Education, and Modeling in the Practice of Clinical Ethics Consultation: The Zadeh Project. Finder SG, Bliton MJ. (eds.). Cham (CH) 139-150.
  6. Wu JT, Leung K, Bushman M, Kishore N, Niehus R, et al. (2020) Estimating clinical severity of COVID-19 from the transmission dynamics in Wuhan, China. Nature Medicine 26: 506-510. [Crossref]
  7. Chan JF, Yuan S, Kok KH, To KK, Chu H, et al. (2020) A familial cluster of pneumonia associated with the 2019 novel coronavirus indicating person-to-person transmission: a study of a family cluster. Lancet 395: 514-523. [Crossref]
  8. Wang D, Hu B, Hu C, Zhu F, Liu X, et al. (2020) Clinical Characteristics of 138 Hospitalized Patients With 2019 Novel Coronavirus-Infected Pneumonia in Wuhan, China. JAMA 323: 1061-1069. [Crossref]

Trials of Low Dose Cytostatic Drugs in Severe Covid-19 Should Be Considered

DOI: 10.31038/CST.2020521

Editorial Letter

We three oncologists suggest that trials with low-dose cytostatic drugs be tested to counteract the severe lung and kidney reaction that patients may suffer from covid-19 infection.

It is now becoming a general notion that a hyperactive / dysregulated immune system, with an image that in an autoimmune response, is a significant factor behind the mortality of covid-19 disease [1]. The reaction often arrives late (1-3 weeks after illness) and rapidly in the course of the disease. So far, attempts to find effective drugs have had very limited success. Derivatives of anti-malaria drugs and anti-ebola drugs are under review, as is the supply of convalescent plasma from previously infected [1-3]. Autoimmune diseases and also autoimmune reactions in immune checkpoint inhibitors in tumor diseases are often treated with corticosteroids [4]. In severe autoimmune diseases, biological drugs such as TNF blockers, interleukin-1 and 6 inhibitors, and inhibitors of T and B cell surface markers have been used [5]. In very severe autoimmune disease, cytostatic drugs such as methotrexate and cyclophosphamide have been used successfully in, for example, rheumatoid arthritis or vasculitis [6-8]. We now propose that in more severe cases of covid-19 this possibility be tested for the following reasons:

In our clinical everyday lives, with the treatment of thousands of cancer patients, we have noted that patients with treatment with low-dose cytostatic drugs rarely show signs of viral infection, including influenza. This is also the case during current flu epidemics and in both vaccinated and unvaccinated patients.

Low dose cytostatics have few side effects and are a tried and tested treatment modality.

Low dose cytostatic therapy is a therapy modality that even older individuals tolerate well.

We propose that, in trials, low dose cytostatic drugs be given to covid-19 patients admitted to the intensive care unit (both respiratory and non-respiratory cases) either as a randomized study where admitted cases are allocated to +/- low dose cytostatic therapy or that therapy is given to everyone in an observational study with historical controls. The therapy program can be either by oral, intravenous, daily or at longer intervals eg. weekly. Outcome parameters are care time at intensive care units, need for respiratory care +/- and death in the disease. In analyzes comorbidity, gender, age and other experimental therapies are adjusted for. The proposal calls for increased cooperation between anesthesiologists, emergency care doctors, rheumatologists, infection disease doctors and oncologists. The attempts to limit the autoimmune response should, of course, not prevent / inhibit the possibility of combating the virus infection in general.

References

  1. Schoenfeldt Y (2020) Corona (COVID-19) time musings: Our involvement in COVID-19 pathogenesis, diagnosis, treatment and vaccine planning.Autoimmun Rev19:102538. [Crossref]
  2. Baden Lindsey R, Rubin EJ (2020) Covid-19 – The search for effective therapy. N Engl J Med382:1851-1852. [Crossref]
  3. Kalil AC (2020) Treating COVID-19-Off-label drug use, compassionate use, and randomized clinical trials during pandemics. JAMA. [Crossref]
  4. Martins F, Sofiya L, Sykiotis GP, Lamine F, Maillard M, et al. (2019) Adverse effects of immune checkpoint inhibitors: epidemiology, management and surveillance. Nat Rev ClinOncol16: 563-80. [Crossref]
  5. Carballido JM, Regairaz C, Rauld C, Raad L, Picard D, et al. (2020) The Emerging Jamboree of Transformative Therapies for AutoimmuneDiseases. Front Immunol11: 472. [Crossref]
  6. Silvagni E, Bortoluzzi A, Carrara G, Zanetti A, Govoni M, et al. (2028) Comparative effectiveness of first-line biological monotherapy use in rheumatoid arthritis: a retrospective analysis of the RECord-linkage On Rheumatic Diseases study on health care administrative databases. BMJ Open8:e021447. [Crossref]
  7. Paul D, Fazeli MS, Mintzer L, Duarte L, Gupta K, et al. (2020) Comparative efficacy and safety of current therapies for early rheumatoid arthritis: a systematic literature review and network meta-analysis.ClinExpRheumatol. [Crossref]
  8. Varbanova M, Schütte K, Kuester D, Bellutti M, Franke I, et al. (2011) Acute abdomen in a patient with ANCA-associated vasculitis. Dtsch Med Weekly136: 1783-1787. [Crossref]

COVID-19, Coagulopathy, and Neurovascular Complications: A Case Report

DOI: 10.31038/JNNC.2020311

Introduction

Coronavirus  disease  2019  (COVID-19) is considered a viral syndrome comprising of pneumonia, cough and dyspnea progressing towards acute respiratory distress syndrome. Recently,  a hypercoagulable state has been identified in moderate to severely ill patients, most commonly quantified by increased  D-dimer  levels. Additionally, prolonged prothrombin time and increased fibrinogen levels are associated with a poor prognosis [1]. This has led to concerns of COVID-19 patients being predisposed to clotting complications and discussions of early anticoagulation for pre- emptive management. We present the case of one such patient with complications of COVID-19 coagulopathy.

Case Report

A 43-year-old male presented to the emergency department for ongoing shortness of breath, having completed outpatient azithromycin. Past medical history was significant for hypertension, obesity, daily alcohol usage, and negative for recent travel or sick contacts. The chest x-ray revealed right lower lobe pneumonia and antibiotics were started. The oxygen saturation improved from 80% on 5 L nasal cannula to 95% after a non-rebreather was placed. A COVID-19 polymerase chain reaction (PCR) test was performed, which resulted negative. The patient was admitted to a progressive care unit, but transferred to the intensive care unit the same day for decreased oxygen saturation to 88%. Due to increased oxygen demands and new fever of 101.5°F, a repeat COVID-19 PCR test was performed. Ascorbic acid, chlordiazepoxide, hydroxychloroquine, prophylactic pantoprazole, and prophylactic enoxaparin were ordered. The repeat COVID-19 PCR resulted positive. On day 8, testing revealed a D-Dimer of 3055 ng/mL, fibrinogen >700 mg/dL and platelets of 546,000/mm3. Due to concern for increased risk of thrombosis, the patient was started on therapeutic enoxaparin. The D-dimer continued to trend up (day 11: 3,299 ng/mL; day 12: >3,680 ng/mL), while the fibrinogen and platelets decreased (day 11: 576 mg/ dL and 341,000; day 12: 561 mg/dL and 348,000). Additionally, the patient was intubated on day 6, and extubated on day 12.A transthoracic echocardiography was performed and reported to be normal.

On day 13 right hemiplegia, moderate aphasia, and moderate sensation loss to right upper and lower extremity were noted. Computed tomography imaging found an acute cortical left cerebral and right occipital infarct (Figure 1). A National Institutes of Health Stroke Scale was calculated at 20. Neurology was consulted and enoxaparin was held due to risk of hemorrhagic conversion. Due to the infectious risk of COVID-19, further diagnostic testing was limited. As the time of onset was unknown, thrombolytics and mechanical thrombectomy were not considered. Aspirin, atorvastatin, and prophylactic enoxaparin were ordered. On day 15 an ultrasound of the right upper extremity was performed due to unilateral edema which was positive for a right cephalic vein thrombus. Therapeutic enoxaparin was restarted and continued upon discharge to rehabilitation. Prior to discharge, the patient was regaining function in his right extremities.

JNNC-3-1-301-g001

Figure 1. Computed tomography imaging of the brain (non-contrast). A: Left frontoparietal infarct, B: Right occipital infarct, C: Left frontoparietal infarct.

Discussion and Conclusion

We describe the case of a patient with minimal risk factors for stroke and a Well’s criteria of zero. This patient originally presented with severe pulmonary complications of COVID-19 with no evidence of neurologic deficits. Proper prophylaxis and treatment with enoxaparin were utilized. No pharmacologic therapies provided to the patient increased risk of thrombosis. Nonetheless, the patient still developed an acute left cerebral infarct, a right occipital infarct and a right upper extremity thrombosis, clinically consistent with both arterial and venous thrombotic complications.

Limited literature exists which describes stroke as a presenting factor for patients who later tested positive for COVID-19 [2,3]. Our patient on the other hand originally presented with no neurologic symptoms. The late development of significant stroke in our case stresses the importance of a continued thorough neurological examination for severely ill COVID-19 patients throughout their hospital stay. In addition, there appears to be a correlation between stroke and d-dimer, with 7/8 patients having an elevated level. There have been discussions of early anticoagulation strategies for these new thrombotic complications. No anticoagulation was noted prior to stroke for the previously published cases; our patient was started on therapeutic anticoagulation during their hospital stay [2,3]. Tang et al. found that utilization of prophylactic anticoagulation reduced mortality by 19.6% (32.8% vs. 52.4%, p = 0.017) in patients with D-dimer levels greater than six times the upper limit of normal [4]. However, anticoagulation did not prevent thrombosis in our patient, who also had a severely elevated D-dimer. This may point to an alternative form of hypercoagulability due to platelet-rich clots, as was found in an autopsy series from New Orleans [5]. Enoxaparin inhibits factor Xa, which preferentially targets fibrin formation. Potential inclusion of early antiplatelet medications, like aspirin, should be considered.

References

  1. Han H, Yang L, Liu R, Liu F, Wu KL, et al. (2000) Prominent changes in blood coagulation of patients with SARS-CoV-2 infection. ClinChem Lab Med doi: 10.1515/ cclm-2020-0188. [Crossref]
  2. Oxley TJ, Mocco J, Majidi S, Christopher PK, Shoirah H, et al. (2020) Large-vessel stroke as a presenting feature of COVID-19 in the young. N Engl J Med 382. [Crossref]
  3. Avula A, Nalleballe K, Narula N, Sapozhnikov S, Dandu V, et al. (2000) COVID-19 presenting as stroke. Brain BehavImmun doi: 10.1016/j.bbi.2020.04.077. [Crossref]
  4. Tang N, Bai H, Chen X, Gong J, Li D, et al. (2000) Anticoagulant treatment is associated with decreased mortality in severe coronavirus disease 2019 patients with coagulopathy. Journal of Thrombosis and Haemostasis 18:1094-1099. [Crossref]
  5. Fox SE, Akmatbekov A, Harbert JL, Guang Li, Quincy BJ, et al. Pulmonary and cardiac pathology in COVID-19: The first autopsy series from New Orleans. medRxiv doi: https://doi.org/10.1101/2020.04.06.20050575.

A Discussion of the Current Limitations of Diabetes Etiology

DOI: 10.31038/EDMJ.2020431

Abstract

The immense amounts of research into diabetes reflects the need for a better understanding of what is diabetes (DM), how it can be measured, and how it can be treated and/or managed however despite the enormous amounts invested in diabetes research there is not unanimity from the research community on any of these matters. The issue which faces diabetes researchers is whether to continue with ‘more of the same’ lines of research or whether to strike out and seek more radical solutions.

It is clear that the biology of the pancreas plays a significant role; in particular the many factors which influence the genetic expression of insulin (type 1 diabetes) and the subsequent ability of insulin to react with its reactive substrate (type 2 diabetes); however there must be additional factors which are consistent with the laws of chemistry and physics which are not yet being seriously considered in the etiology of DM i.e. that the known biology of DM is only part of the complex etiology of DM.

The author raises a number of issues in this paper which address a number of inconsistencies in the screening and treatment of diabetes. Heillustrates that type 1 and type 2 diabetes exist as comorbidities, that the onset of diabetes leads inevitably to the onset of a range of diabetic comorbidities,  and that ‘the regulation of blood glucose levels’ exhibits the characteristics of a neurally regulated physiological system. Such observations have immense significance regarding how we screen for diabetes and how we treat diabetes and diabetic comorbidities.

The Biology of Diabetes

The first step to consider in the process of Diabetes (DM) is that of genetic expression in which a wide spectrum of genes, currently considered to be more than 60 genes [1], coherently interact in order to express pre-pro-insulin (type 1 diabetes) however the interpretation of such data is complicated when considering that the spectrum of genes which express pre-pro-insulin can differ [2] e.g. between different racial subtypes.

There are few instances, if any, where a single gene acts independently of all other genes in order to express a particular protein or where a single gene is considered to be responsible for a particular medical indication e.g. in the case of Rett’s syndrome [3], which is considered to be widely attributable to a single mutation in the MECP2 gene, a more in-depth examination of the literature reveals a lack of certainty surrounding such a conclusion e.g.

• ‘Mutations in a gene called MECP2 underlie almost all cases of classic Rett syndrome’

• ‘Using a systematic gene screening approach, we have identified mutations in the gene (MECP2) encoding X-linked methyl-CpG-binding protein 2 (MeCP2) as the cause of some cases of RTT’.

• ‘In 5 of 21 sporadic patients, we found 3 de novo missense mutations in the region encoding the highly conserved methyl-binding domain (MBD) as well as a de novo frameshift and a de novo nonsense mutation, both of which disrupt the transcription repression domain (TRD)’

• ‘In two affected half-sisters of a RTT family, we found segregation of an additional missense mutation not detected in their obligate carrier mother’

This indicates that there is conceivably a phenomenon of greater significance than gene chemistry but which nevertheless involves gene chemistry. It can only be explained if our DNA and genes are continually seeking out more stable states, in a best-fit manner i.e. changing between different conformational and energetic states [4] in order to find the most stable state.

It conceivably explains why therapies, which were designed to influence the genetic profile in order to be effective in their specific areas of application (viruses, virus-like particles and/or and vaccines), are associated with predisposition to type 1 diabetes [5].

1. It is often overlooked that genetic expression is a chemical reaction in which various components e.g. the genetic spectrum,transcriptases and minerals; influence the rate and extent to which pre-pro-insulin is expressed however transcriptases are often dependent upon magnesium and zinc for their structure, function and reactivity.  This is significant in DM becausethe level of essential minerals and/or their reactivity are dependent upon the prevailing intercellular pH therefore a deficit of minerals, in particular magnesium and zinc which is commonly observed in the diabetic [6], must influence the structure and/or reactivity of the enzyme and hence the extent of expression of pre-pro-insulin.

In general, the conversion of pre-pro-insulin to pro-insulin is considered to proceed without any significant hindrances however it should be emphasised that the conversion of pre-pro-insulin is dependent upon the availability and reactivity of signal peptidases and hence is likely to be influenced by the prevailing intercellular pH and levels of minerals and cofactors although the extent to which this occurs is uncertain.

2. Similarly the conversion of pro-insulin to insulin must also be dependent upon the prevailing reaction kinetics. Moreover, it is encoded by the INS gene [7] so any changes of gene structure [1] due to the influence of viruses and/or virus-like particles, the presence of mutant alleles, the influence of epigenetic components, the action of reactive oxygen species upon gene structure, alterations of gene conformation and energetics, and the prevailing reaction conditions e.g. pH and mineral levels;must also influence this process to some extent.

3. It is considered that because pro-insulin has a longer half-life than insulin (if not insulin levels would be in a perpetual deficit)and that this accounts for 5-30% of the insulin-like structures in the blood however there does not appear to be any significant explanations for this broad range of pro-insulin levels [8]. This may be significant, especially so if we consider that only one of the many insulin-like structures – insulin monomer – will react with its receptor protein IRP2.

4. Pro-insulin is converted to insulin by endopeptidases (PC1 & PC2) and Carboxypeptidase E which function at rates determined by their unique chemical properties and the corresponding reaction kinetics involving intercellular pH, levels of minerals, etc.

5. Insulin is a very large and highly reactive protein comprises 51 amino-acids. It exists as a dimer (particularly so when complexed as the zinc-hexamer), comprising an A chain and a B chain which are connected by disulphide bonds but reacts as the monomer. Its chemical properties are that it exists as a coiled moiety, is a polar entity with -NH2 and –COOH groups at its extremities, is water soluble, and highly reactive (half-life of ca 3 minutes) so if the pH is not maintained at the appropriate level this will influence insulin conformation, energetic state and half-life.

6. The relatively slow genetic expression/productionof insulin, conceivably because it is such a large and highly reactive molecule, requires that insulin is stored in the pancreas as a zinc-hexamer; awaiting metabolic signals and vagal nerve stimulation [9] to be exocytosed from the cell into the circulation;however under pathological conditions i.e. elevated levels of intercellular acidity, reduced levels of essential minerals, alters the redox state and/or bioavailability and levels of transition metals. As a resultinsulin becomes less coiled and circulates as the monomer rather than as the more stable dimer or the hexamer.

It provides a mechanism whereby zinc availability and redox mechanism are linked. Zinc is transported by albumin and transferrin however transferrin also transports iron which reduces the absorption of zinc, and vice versa. Zinc and copper also have an antagonistic relationship. This is consistent with differing levels of intercellular acidity in which there is a biodynamic relationship between essential minerals and the transition minerals at pH 7.35. When intercellular pH decreases to pH of more typically 6.75 the levels of essential minerals such as zinc and magnesium decline whilst the levels of transition metals such as iron, aluminium, copper increase. It explains why most diabetic patients are magnesium and zinc deficient [10-12].

Moreover [13] insulin levels vary throughout the day, from <100pmol/l to >800pmol/l, and in particular (i) following a meal and (ii) in a 3-15 minute oscillating manner i.e. indicatively over a 3-6 minute period for those who are normally healthy and over a 6-15 minute period for the diabetic.Under acidic conditions insulin becomes less coiled and less reactive (the phenomena of ‘protein-resistance’ is common to insulin, leptin, ghrelin and perhaps also in the ‘folding’ of other proteins), the availability of zinc hexamer in the islets declines [14] under acidic conditions, and insulin is supplied over a longer period and/or in a less reactive form.

Pathological onset of DM under acidic conditions (in general, DM does not occur in patients with relatively neutral intercellular pH),is accompanied by the glycation of proteins [15,16] e.g. of insulin, albumin, LDL-Cholesterol, haemoglobin, fibrinogen, immunoglobulin(s), etc. This is indicative of free radical reactions which arise from increased acidity, increased levels of transition minerals [17], and a suitable substrate (glucose). It is confirmed by noting thatanti-oxidants [18] influence such oxidative processes and have a positive influence upon DM.

In addition the reaction of insulin with its receptor protein IRP2 is a magnesium dependent reaction and, as outlined, the supply of magnesium is dependent upon prevailing levels of intercellular pH.

7. That the regulation of intercellular pH is so immensely significant, if not obvious from the above, is further confirmed when considering the role of metformin which is eliminated from the body almost completely unmetabolised therefore its metabolic effect is not pharmacological. A closer examination of metformin’s chemical structure reveals that it exhibits the structure, and hence the function, of a biological buffer [19] which maintains intercellular pH at a level of indicatively 6.75-6.95.

Accordingly if applied to the diabetic patient it will have the effect of reducing intercellular pH in patients with a lower intercellular pH i.e. the severely diabetic and/or obese patient with intercellular pH of indicatively 6.25-6.75. This should have the effect of reducing the severity of their diabetic symptoms however it will not be a substitute for weight-reduction measures. For patients who are pre-diabetic, who have been prescribed metformin, it willlikely have the effect of lowering their intercellular pH and enhancing their diabetic symptoms.

8. The expression of insulin and the reaction of insulin with its receptor protein are sequential processes. If they were parallel processes there would be a selection of one of the two processes – the ‘either or’ scenario – but this is clearly not the case.  The genetic expression of a protein is followed by the reaction of the expressed protein with its reactive substrate. The two processes occur in sequence so type 1DM (genotype) and type 2DM (phenotype) are comorbidities in which there can be several different states e.g.

(i) low levels of type1DM and absence of type 2DM,

(ii) low levels of type 1DM and low levels of type 2DM (diagnosis: prediabetes),

(iii) low levels of type 1DM and high levels of type 2DM (type 2 diabetes),

(iv) high level of type 1DM and absence of type 2DM (diagnosis: type 1 diabetes),

(v) high level of type 1DM and low/moderate level of type 2DM (diagnosis: type 1DM)

(vi) high level of type 1DM and high level of type 2DM (diagnosis: type 1 and type 2DM)

It is not a case of whether the patient has either type 1DM or type 2DM. Both can and do occur as comorbidities as outlined in (ii)-(vi).

9. The GLUT-4 receptor which converts glucose into energy is located in the smooth muscle. Moreover this reaction is a chromium-dependent reaction in which the prevailing redox states of chromium are influenced by the prevailing intercellular pH i.e. the intercellular pH, in combination with the quality and quantity of smooth muscle (physical fitness) influences the ability to metabolise blood glucose.

Measuring Diabetes

The onset of pathological conditions, as outlined, leads to the production of mainly excessblood glucose and elevated levels of advanced glycation end-products, which are manifest as glycated proteins and other lipids, and which subsequently alter blood viscosity and thereby influence the function of the heart, kidneys, etc.  Nevertheless, and as outlined in 1.10 above, this hyperglycaemia which is characteristic of type 1DM, is only one aspect of diabetes.  Hypoglycaemia can be encountered due to suppression of the genetic expression of insulin.  Nevertheless the characteristics of diabetes, in particular of unstable levels of blood glucose, can occur due to pathological onset in other organs (mainly the endocrine glands) and physiological systems e.g. in the case of hysterectomy.

The glycated protein HbA1c is used as a measure of type 2 diabetes however the validity of the test is often questioned, perhaps with good reason [20]. The processes responsible for type 1 and type 2 occur simultaneously i.e. they are comorbidities;thereby explaining to some extent the misdiagnoses when using the HbA1c test [21,22], but the test only measures the glycation process.

The A1c form of glycated haemoglobin A was selected because it was considered to be the most prominent of the various forms of glycated haemoglobin however it is likely, perhaps inevitable, that altered reaction conditions will lead to increased/decreased levels of the different glycated haemoglobin isomers and a reduction/increase of HbA1c.

‘the measurement of HbA1C is likely not a comprehensive indicator of HbA glycation’ [23]

Also, it is assumed that the ratio of haemoglobin Avs other proteins does not vary and hence that the test would be an accurate measure of the glycation process however the level of haemoglobin varies widely [24]. Test outcomes are influenced by many variables including light, pH, levels of minerals, RBC and/or haemoglobin levels, and other factors; and finally haemoglobin A does not play a role in the etiology of diabetes!Accordingly, the scope for misdiagnosis is immense. The possibility of inaccurate test results is inevitable, especially so in cases of non-pancreatic diabetes in which the problems of blood glucose regulation are not caused by the aforementioned pathological processes which are commonly attributed to diabetes but instead to pathological emergence in other organs and physiological systems [25].

All chemical reactions are accompanied by the absorption and emission of energy

i.e., by the emission of biophotons which create the phenomena of auto fluorescenceand/or bioluminescence in blood [26]. The emission of biophotons [27,28], as proteins decay from their reactive state to their base state, is particularly evident in the retina of diabetics as it alters blue-yellow colour perception [29] and serves as a measure of type 1 and type 2 diabetes in a cognitive test.

This occurs because the eye responds to as little as 7*10^2 bio photons per second.  The retina focusses this bioluminescence which can be measured in a cognitive test and used as a precise, digital measure of pathological onset and progression in all medical conditions which are accompanied by changes of colour perception and brain function i.e. across the complete medical spectrum.The company Bio Astral [28], supported by significant UK government grants prior to its demise, was researching advances in space-science imaging technology i.e. to measure the release of bio photons from blood (quote: ‘Our STJ cryogenic detector is 1000 times more powerful at detecting fluorescence in biological assays than current technology, and is unique in giving the colours of photons detected without requiring filters, gratings or other techniques’).

Accordingly a technique which measures the intensity and colour of biophotons has significant potential as a measure of diabetes which is relatively free from side-effects, errors and misdiagnoses.

The Neurology of Type 2 Diabetes

There are two fundamental avenues which influence the autonomic nervous system: (i) via sensory intake (vision, hearing, smell, taste and touch) and (ii) via the visceral organs.

As outlined in this text, genetic and non-genetic (phenotype) changes lead to the onset of type 1 and type 2 diabetes. It is commonly considered that genetic changes occur due to the effect of gene-altering moieties e.g. as viruses; however this text illustrates that genetic changes occur due (i) to the influence of virus-like particles (vaccines) and (ii) increased levels of intercellular pH which accompany stress and generate ROS which have a degenerative effect upon the genetic profile.

Moreover stress (either as psychological stress or as psychophysiological stress i.e. excess weight), which is experienced via the sensory organs and brain, is an acidifying process which increases cortisol levels and influences appetite [30] thereby illustrating the link between molecular biology and sense perception – influencing perception of colour and appetite.

So type 2 Diabetes is a neurological condition which arises because the brain is unable to maintain the calorific balance between appetite, the intake of calories through food and drink, and the expenditure of energy.

The regulation of blood glucose exhibits the characteristics of a neurally regulated physiological system whereby blood glucose levels are maintained between higher and lower levels hence the use of the terms ‘hyper’-glycaemia and ‘hypo’-glycaemia.

The regulation of blood glucose is just one of the 13 physiological systems. The other systems, identified by Grakov IG, are: blood pressure, blood volume, blood cell content, respiration, the consumption of food and drink, the elimination of fluids, intercellular pH, body temperature, posture, osmotic pressure, sexual function and sleep. Each performs an indispensable physiological function which, in most cases, and if not sustained within specific limits, leads to our demise.Each physiological system involves the brain and the endocrine glands.

Moreover, and as outlined earlier, the regulation of blood glucose involves the vagus nerve [9] which stimulates the pulsed release of insulin [13] by the pancreas.

Accordingly pathological onset in organs within this physiological system (network of organs) or in adjacent physiological systems will influence blood glucose levels. It explains the phenomena of non-pancreatic diabetes in which the patient(s) have problems regulating their blood glucose and yet their pancreas’ functions [31] normally e.g. due to endocrine dysfunction, hysterectomy, etc.

The most significant physiological systems [31] which influence the regulation of blood glucose level are sleep, pH [32], what we consume and excrete, and body temperature.

Each physiological system can be neurally regulated.

It is a problem for biomedicine to explain, using a solely chemical mechanism, how the different organ networks act in an apparently coherent manner.  In 2013 the Human Brain Projectwas established to explore the issues. It was tasked by the EC to achieve three fundamental objectives: (i) to understand what the brain does and how it does it; (ii) to use this knowledge to develop a new generation of cognitive diagnostic test, and (iii) to understand and adapt with therapeutic effect the multi-level nature of brain function.  Specific emphasis was placed upon screening the complex pathological coordinates of Alzheimer ’s disease.

Ewing recognised that these fundamental objectives had been completed by Grakov in the period 1981/2-1997-2006 and were incorporated into the Strannik software.  Papers followed which compared the two different techniques [33,34]; identified fundamental limitations of the techniques being deployed to achieve such objectives [34,35], in particular the reliance upon ‘big data’; determined that the brain acts as a neuromodulator [36] of the autonomic nervous system; that Grakov had developed a screening test which can screen for the complex pathological correlates of diabetes and diabetic comorbidities including Alzheimer’s Disease [37-42]; and had understood how this led to an understanding of the multilevel nature of brain function in particular of the mechanism which regulated the stability of the autonomic nervous system and the coherent function of the physiological systems [43].

The specific origins of such a technique can be traced back for over 100 years however it is only in the last 10-20 years that significant progress is being made towards the development of the envisaged new generation of neuromodulation therapy [44-46] which has the potential to improve therapeutic outcomes in [47] a wide range of medical indications [48-55] including multiple sclerosis, Parkinsonism, Alzheimer’s Disease, Migraine, regulation of menstruation, etc.

Discussion

The evidence assembled in this short paper illustrates that type 1 and type 2 diabetes are comorbidities and that‘the regulation of blood glucose levels’exhibits the characteristics of a neurally regulated physiological system and involves the process of neuroregulation [56,57] i.e. the relationship between sense perception, brain function, the autonomic nervous system (the stress response) and physiological systems, and cellular and molecular biology (as genotype and phenotype).

Moreover the evidence for such a conclusion, and its relevance to how we screen or treat diabetes is already evident in various diabetes papers which illustrate that (i) changes of blue-yellow colour perception accompany the onset and progression of diabetes, (ii) that this phenomena is not unique to diabetes but can be used to screen for an extensive range of pathologies [38] including diabetic comorbidities, (iii) that the phenomena is associated with the emission of biophotons, (iv) that the vagus nerve is involved in diabetes etiology, (v) that insulin is released by the pancreas in a pulsatile manner which is indicative of ‘control circuitry’, and (vi) that knowledge of this ‘neuro-regulatory mechanism’ can be used to treat patients with a wide range of pathological indications [39] including type 1 and type 2 diabetes and related diabetic comorbidities e.g. by reducing exposure to stress [30,58].

The future development of neurological knowledge, in particular of how the brain works and what it does, is leading to the development of a new generation of diagnostic and therapeutic technologies as envisaged by the EC’s Human Brain Project although perhaps such technologies [59] have not emanated from Human Brain Project research.

References

  1. Bakay M, Pandey R, Hakonarson H (2013) Genes involved in type 1 diabetes: an update. Genes (Basel)4(3):499-521.[crossref]
  2. Ewing GW (2017) The Interpretation of Genetic Data – Considering the Effect of Changes to Gene Conformation — If the facts don’t support the theory, change the theory – how does this contribute to understanding Diabetes? J Genet DisorGenetRep 6:1-4.
  3. Amir R, Van den Veyver I, Wan M, Tran C, Francke U et al. (1999) Rett syndrome is caused by mutations in X-linked MECP2, encoding methyl-CpG-binding protein. Nat Genet. 23: 185-188.
  4. Bodhini D, Radha V, Ghosh S, Majumder PP, Mohan V (2011) Lack of association of PTPN1 gene polymorphisms with type 2 diabetes in south Indians. J Genet 90: 323-326. [crossref]
  5. Tuomilehto J, Rewers M, Reunanen A, Lounamaa P, Lounamaa R et al. (1991) Increasing Trend in type 1 (insulin-dependent) diabetes mellitus in childhood in Finland.Analysis of age, calendar time, and birth cohort effects during 1965-1984. Diabetologia 34: 282-287. [crossref]
  6. Gunther T (2010) The biochemical function of Mg2+ in insulin secretion, insulin signal transduction and insulin resistance. Magnesium Research 23: 5-18. [crossref]
  7. INS insulin [ Homo sapiens (human) ][crossref]
  8. Interpretation for 80908 Proinsulin, Plasma. www.mayomedicallaboratories.com. 2017-03-09.
  9. Meyers EE, Kronemberger A, Lira V, Rahmouni K, Stauss HM. (2016) Contrasting effects of afferent and efferent vagal nerve stimulation on insulin secretion and blood glucose regulation. Physiol.Rep 4: 12718.
  10. Maret W, Krezel A (2007) Cellular zinc and redox buffering capacity of metallothionein/thionein in health and disease. Mol Med 13: 371–375.
  11. Rink L, Gabriel P (2000) Zinc and the immune system. ProcNutrSoc 59: 541–552. [crossref]
  12. Brandão-Lima PN, Carvalho GB, Santos RKF, Santos BDC, Vasconcelos NLD et al. (2018) Intakes of Zinc, Potassium, Calcium, and Magnesium of Individuals with Type 2 Diabetes Mellitus and the Relationship with Glycemic Control. Nutrients 10: 1948.
  13. Hellman B, Gylfe E, Grapengiesser E, Dansk H, Salehi A (2007) Insulin oscillations—clinically important rhythm. Antidiabetics should increase the pulsative component of the insulin release. Läkartidningen 104: 2236-2239. [crossref]
  14. Wijesekara N, Chimienti F, Wheeler MB (2009) Zinc, a regulator of islet function and glucose homeostasis. Diabetes, Obesity and Metabolism 11: 202-214. [crossref]
  15. Singh VP, Bali A, Singh N, Jaggi AS (2014) Advanced Glycation End Products and Diabetic Complications. Korean J PhysiolPharmacol 18: 1–14. [crossref]
  16. Wolff SP (1993) Diabetes mellitus and free radicals: Free radicals, transition metals and oxidative stress in the aetiology of diabetes mellitus and complications. British Medical Bulletin 49: 642-652. [crossref]
  17. Aust SD, Morehouse LA, Thomas CE (1985) Role of metals in oxygen radical reactions. J Free RadicBiol Med 1: 3-25. [crossref]
  18. Maritim AC, Sanders RA, Watkinss JB 3rd (2003) Diabetes, oxidative stress, and antioxidants: a review. J BiochemMolToxicol 17: 24-38. [crossref]
  19. Ewing GW (2018) Is Metformin a Drug or a Buffer and Why is this Significant? Further evidence that the brain Regulates the Autonomic Nervous System, in particular prevailing levels of Intercellular pH.Endocrinology, Diabetes and Metabolism Journal 2: 1-9.
  20. McDonald TJ, Warren R (2014) Diagnostic confusion? Repeat HbA1c for the diagnosis of diabetes. Diabetes Care 37: 135-136.
  21. CheolBae J, Sunghwan S, Sang‐Man J, Se won K, KyuYeon H, et al. (2014) Hemoglobin A1c values are affected by haemoglobin level and gender in non‐anaemic Koreans. Journal of Diabetes Investigation 5: 60-65. [crossref]
  22. Hegde SN, Srikousthubha MS, Anupama YJ, Rathnakar R, et al. (2018) A case of undetectable glycated haemoglobin (HbA1c). QJM: An International Journal of Medicine 111: 567-568.
  23. Clark SLD, Santin AE, Bryant PA, Holman RW, Rodnick KJ (2013) The initial noncovalent binding of glucose to human haemoglobin in nonenzymaticglycation. Glycobiology 23: 1250-1259. [crossref]
  24. Ebben JP, Gilbertson DT, Foley RN, Collins AJ (2006) Haemoglobin level variability: Associations with comorbidity, intercurrent events, and hospitalizations. Clin J Am SocNephrol 1: 1205-1210. [crossref]
  25. Ewing GW, Ewing EN (2008) NeuroRegulation of the Physiological Systems by the Autonomic Nervous System – their relationship to Insulin Resistance and Metabolic Syndrome.  Biogenic Amines 22: 208-239.
  26. Ewing GW, Parvez SH, Grakov IG (2011) Further Observations on Visual Perception: the influence of pathologies upon the absorption of light and emission of bioluminescence. The Open Systems Biology Journal 4: 1-7.
  27. Ewing GW, Parvez SH, Grakov IG (2011) Further Observations on Visual Perception: the influence of pathologies upon the absorption of light and emission of bioluminescence. The Open Systems Biology Journal 4: 1-7.
  28. https://www.le.ac.uk/biology/phh4/bioastral/home.htm
  29. Radwan TM, Ghoneim EM, Ghobashy WA, Orma Ahmed A (2015) Assessment of Color Vision in Diabetic Patients. International Journal of Ophthalmic Research 1: 19-23.
  30. Razzoli M, Pearson C, Crow S, Bartolomucci A (2017) Stress, overeating, and obesity: Insights from human studies and preclinical models. NeurosciBiobehav Rev 76: 154-162. [crossref]
  31. Ewing GW (2013) The ‘Biology of Systems’ or the ‘Systems of Biology’: Looking at Diabetes from the Systemic Perspective. International Journal of Systems Biology 4: 45-56.
  32. Ewing GW (2012) The Regulation of pH is a Physiological System. Increased Acidity alters Protein Conformation and Cell Morphology and is a Significant Factor in the onset of Diabetes and other common pathologies. The Open Systems Biology Journal 5: 1-12.
  33. Ewing GW, Grakov IG (2015) A Comparison of the Aims and Objectives of the Human Brain Project with Grakov’s Mathematical Model of the Autonomic Nervous System (Strannik Technology). Enliven: Neurol. Neurotech 1: 002.
  34. Ewing GW (2015) Back to Basics: Limitations of Research influencing the Human Brain Project. Comput.Sci.Syst.Biol 8:6:322-326.
  35. Ewing GW (2017) The Limitations of Big Data. The Limitations of Big Data in Healthcare. MOJ Proteomics Bioinform 5: 00152.
  36. Ewing G (2016) What is the function of the Brain? What does it do and how does it do it? It functions as a Neuroregulator, which continuously regulates the Autonomic Nervous System and Physiological Systems, and enables us to Recognise that Sleep Exhibits the Characteristics of a Neurally Regulated Physiological System. J NeurolPsychol 4: 9.
  37. Ewing GW (2016) The Use of Strannik Virtual Scanning as a Modality for the Earliest Screening of the Pathological Correlates of Alzheimer’s Disease. Human Frontier Science Program (HFSP) Journal 10: 2-20.
  38. Ewing GW (2018) A Different Perspective on Diabetes & Obesity – what it is and how it can be measured. Case Reports in Clinical Medicine 7: 269-287.
  39. Ewing GW, Parvez SH (2019) Diabetes is a Complex Neurological, Multisystemic, Multipathological and Polygenomicdisorder : Use of Strannik Software as an Effective Modality to Illustrate its Complexity. J NeurolPsychol 7: 14.
  40. Ewing GW, Ewing EN (2009) Computer Diagnosis in Cardiology. N Am J Med Sci 1: 152-159.
  41. Ewing GW (2016) The Use of Strannik Virtual Scanning as a Modality for the Earliest Screening of the Pathological Correlates of Alzheimer’s Disease. Human Frontier Science Program (HFSP) Journal 10: 2-20.
  42. Ewing GW (2019) How Disruptive Solutions Could Improve the Prevailing Healthcare Paradigm. A Novel Perspective Regarding the Treatment of Mental Health Conditions: the Strannik Mathematical Model. J Clin Cases Rep 3: 89-114.
  43. Ewing GW (2010) A Theoretical Framework for Photosensitivity: Evidence of Systemic Regulation. Journal of Computer Science and System Biology 2: 287-297.
  44. Ewing GW (2010) There is a need for an Alternative or Modified Medical Paradigm involving an understanding of the nature and significance of the Physiological Systems. N Am J Med Sci 2: 1-6.
  45. Ewing GW (2013) Virtual Scanning: a New Medical Paradigm?  Journal of Computer Science and Systems Biology 6: 93-98.
  46. Ewing GW (2016) The Future of Medicine: Biomedicine or Neuroscience? Insights in Biomedicine 1: 14-17.
  47. Kelley R, Flouty O, Emmons EB, Youngcho Kim, JohnathanKingyonet al. (2017) A human prefrontal-subthalamic circuit for cognitive control. Brain141: 205-216. [crossref]
  48. Abboud H, Hill E, Siddiqui J, Alessandro Serra, Benjamin Walter (2018) Neuromodulation in multiple sclerosis. MultScler X23: 1663-1676. [crossref]
  49. Gaede G, Tiede M, Lorenz I (2018) Safety and preliminary efficacy of deep transcranial magnetic stimulation in MS-related fatigue. Neurology: Neuroimmunology&Neuroinflammation 5: 423.
  50. Lv Q, Du A, Wei W, Li Y, Liu G, Wang X-P (2018) Deep Brain Stimulation: A Potential Treatment for Dementia in Alzheimer’s Disease (AD) and Parkinson’s Disease Dementia (PDD). Front Neurosci12:360. [crossref]
  51. Martorell AJ, Paulson AL, Suk H-J, FatemaAbdurrob , Gabrielle T Drummondet al. (2019) Multi-sensory Gamma Stimulation Ameliorates Alzheimer’s-Associated Pathology and Improves Cognition. Cell 77: 256-271. [crossref]
  52. Iaccarino HF, Singer AC, Martorell AJ, et al. (2016) Gamma frequency entrainment attenuates amyloid load and modifies microglia. Nature 540: 230-235.
  53. Luijmes RE, Pouwels S, Boonman J (2016) The effectiveness of neurofeedback on cognitive functioning in patients with Alzheimer’s disease: Preliminary results. NeurophysiolClin 46:179-187. [crossref]
  54. Noton D (2000) Migraine and photic stimulation: report on a survey of migraineurs using flickering light therapy. Complement. TherNurs Midwifery 6: 138-142. [crossref]
  55. Anderson DJ, Legg NJ, Ridout DA (1997) Preliminary trial of photic stimulation for premenstrual syndrome. J ObstetGynaecol 17: 76-79. [crossref]
  56. Ewing GW, Parvez SH 2011 (2011) Mathematical Modeling the Systemic Regulation of Blood Glucose: ‘a top-down’ Systems Biology Approach. NeuroEndocrine Letters 32: 371-379. [crossref]
  57. Ewing GW (2015) A Framework for a Mathematical Model of the Autonomic Nervous System and Physiological Systems using the NeuroRegulation of Blood Glucose as an Example. J Comput.SciSystBiol 8: 59-73.
  58. Martin Cosgrove, Martin Cosgrove (2004) Do stressful life events cause type 1 diabetes? Occupational Medicine 54: 250-254.
  59. Grakov IG Strannik Diagnostic and Treatment System: a Virtual Scanner for the Health Service. Minutes of Meeting No. 11 of the Praesidium of the Siberian of the Academy of Medical Sciences of the USSR (AMN) held in Novosibirsk 4 December 1985.

Alveolar Macrophages in Influenza A Infection Guarding the Castle with Sleeping Dragons

DOI: 10.31038/IDT.2020114


Influenza A is a Worldwide Burden and Recurring Threat

Despite major advances in influenza vaccination and flu-prevention community awareness campaigns, Influenza A virus (IAV) remains a worldwide and recurring threat [1, 2]. Seasonal influenza causes 3-5 million cases of severe respiratory and systemic illness and upwards of 650,000 deaths annually, particularly among the elderly, very young, and chronically ill [3]. Countless hours of missed school and work have significant economic consequences [4, 5]. In pandemic years, morbidity and mortality soars, especially among the young [6, 7].

The Influenza A Viral Infection Cycle

In humans, influenza A targets epithelial cells of the respiratory tract via droplet inhalation. Viral Hemagglutinin (HA) protein binds to sialic acid receptors decorating the surface of polarized respiratory epithelial host cells. If the patient has repeated exposure to the same IAV strain, or one with similar HA antigenic structure, IAV-specific IgG and secretory IgA antibodies may neutralize and thereforeeliminate the virus.Circulating CD4+ helper T-cells directed against influenza proteins may hasten the effectors T cell response; as well as provide some direct antiviral function by targeted destruction of infected cells, limiting viral spread [8, 9]. Antigen-specific effector CD8+ T cells primed against internal viral antigens, when present, clear virus and destroy infected cells, thus limiting severity of disease [9, 10]. If the virus is not cleared by these mechanisms,or if the host response is impaired (as with smokers and other conditions), retrograde infection can proceed from the upper respiratory tract to the lower.Following virion uptake in the cell endosome and uncoating viral RNA is transported to the host cell nucleus, where the virus begins replication and transcription, utilizing host cell mRNA cap-stealing mechanisms to induce viral mRNA synthesis [11]. New viral RNAs are transcribed and viral proteins translated, and new virions are assembled in the infected host cell [12, 13]. This cellular hijacking turns the host into a virus-manufacturing machine, shutting down host cell protein synthesis while simultaneously inhibiting infection-induced apoptosis [14, 15]. Viral nucleic acids and proteins are, are transported to the cell surface, packaged into new virionswhich bud off the plasma membrane and released via the action of viral neuraminidase (NA) enzyme. Virions can retain host cell membrane sialic acid receptors for the HA,enabling virions to clump. These large viral clusters may spread more easily through the lower respiratory tract; NA cleaves these domains, allowing virions to disperse in the distal airway [13, 16].

Alveolar Macrophages:The Primary Defensive Line and Cleanup Crew of the Lower Respiratory Tract

Lung macrophages derive from multiple lineages, and play different roles in the lung. Alveolar macrophages (AMФ), thought to derive fromprogenitors present in fetal liver [17] move to the lung interstitium during development then migrate to the air-tissue interface after birth, where they maintain and repopulate locally through life. AMФ are tightly adherent to alveolar epithelial cells. This cell-cell contact plays a key role in homeostasis and function. Under the direction of GM-CSF, these macrophages primarily remove surfactant and cellular debris, preventing Pulmonary Alveolar Proteinosis (PAP). They are also responsible for phagocytosis of foreign pathogens that have overcome or bypassed the mechanical defenses and immune defenses of the upper airway [18]. AMФ regenerate locally, as demonstrated by long-term persistence of donor macrophages in patients who undergo lung transplant [19, 20]. If there is complete loss of alveolar macrophages, as in irradiation, AMФ will regenerate from circulating monocytes [21].

By contrast, interstitial pulmonary macrophages, which make up a smaller proportion of lung macrophages derive from bone marrow precursors, and play a different role in lung immune defense: namely antigen-presentation and modulation of tissue injury [22]. A third, smaller subset of primitive macrophages, derives from yolk sac progenitors, and resides in the mesothelium adjacent to the vasculature [19, 23]. AMФ play myriad roles in the lungs, including localized homeostasis, injury repair and remodeling, and innate defense. Perhaps their most remarkable feature is the capacity toselectively regulate induction of the adaptive immune response to foreign pathogenswhich invade the terminal airways at the air-tissue interface [24]. Under homeostatic conditions AMФ, like microglia, primarily exist in a resting state controlled by interaction between the OX-2 membrane glycoprotein CD200 and the CD200 receptor through TGFβ signaling [25]. In this state, AMФ downregulate expression of macrophage CD11b, a surfaceintegrin protein critical for phagocytosis [24, 26], thus phagocytic activity is suppressed. AMФ adhere tightly to alveolar type I and type II cells. In this quiescent state macrophages induce low localized levels of αvβ6 integrinin alveolar epithelial cells, which binds to the latency associated peptide (LAP) of TGFβto form latent-TGFβ on AMФ[27]. This complex suppresses AMФproduction of proinflammatory and cellular recruiting cytokines interleukin 1beta (IL-1β), tumor necrosis factor-alpha (TNF-α), interleukin-6 (IL-6) and interleukin-8 (IL-8) [28].Suppression of phagocytosis and inhibition of inflammatory cytokine release regulates activation of the adaptive immune response and mitigates unchecked inflammation and edema that might otherwise impair alveolar gas exchange [29].

Alveolar macrophages become activated when AMФ pattern recognition receptors (PRRs) interact with pathogen-associated molecular patterns (PAMPs) in the respiratory tract [30]. Activation induces conformational changes resulting in loss of contact with alveolar epithelial cells. Interruption of cellular contact abruptly halts αvβ6 integrin binding with LAP binding and results in loss of latent-TGFβ. Without latent-TGFβ production, the suppression of AMФ phagocytic activity and cytokine production is lost, priming AMФ to produce TNF-α and IL-6, becoming cell-recruitmentand phagocytic machines [31]. Activated macrophages recruit neutrophils and inflammatory monocytes to the airways (and interstitium) which replace resident alveolar macrophages over the course of several days [32, 33]. Once activated, these macrophages have astonishing phagocytic and pro-inflammatory activity. MacLean and Kradin’s in vivo rat model demonstrated that AMФare able to engulf greater than 109 intratracheally-injectedListeria organisms before macrophage spillover occurs [34]. Fine particulate activation of AMФ induces high levels of reactive oxygen species (ROS), 8-isoprostane, and Arachidonic Acid (AA) metabolites including prostaglandin E2 (PGE2), leukotriene B4 (LTB4) [35]. Within days of insult, T lymphocytes and natural killer cells are recruited to the site of injury, where they secrete interferon gamma (IFN- γ) [36]. IFN- γ stimulates matrix metalloproteinase (MMP-9) production by AMФ, which alternatively activates latent-TGFβ on macrophages. This induces macrophages to re-adhere to epithelium, restoring suppression of inflammation and phagocytosis, and returning AMФ to their homeostatic inflammation-suppressing state [24].

The Alveolar Macrophage Arsenal against Influenza A

AMФ employ several pattern recognition receptors against influenza. The primary pathogen-associated molecular patterns generated by influenza A are cytoplasmic viral RNAs produced during cellular viral replication [37, 38]and viral M2 protein.AMФ exposed to IAV have marked upregulation of type I interferons (especially α1, 4, 7, 8, 13, 17, and 21),chemokine CXC motif ligands 5, 9, 10, and 11; fibroblast activation protein α (FAP);TNF-α, and members of the IL-1 family [39]. As AMФ endocytose virions, viral membrane degradation releases viral ssRNA into the macrophage cytoplasm. Viral ssRNA is recognized as foreign by AMФ toll-like receptor 7 (TLR7), inducing the NF-κB inflammatory signaling pathway expression. AMФ phagocytose dying IAV-infected alveolar epithelial cells and cellular debris. As cells are degraded, viral dsRNA is recognized by TLR3 [40],further inducing NF-κB inflammatory signaling, and producing type I interferons (IFN-I) [38, 41], and inducing expression of monocyte-recruiting chemokines like CCL2 [42]. In Infected AMФviral RNA released in cytoplasm is recognized by retinoic acid-inducible gene I (RIG-I), which activates mitochondrial antiviral signaling protein (MAVS) [43]. The viral matrix ion channel protein M2 induces formation of the NOD-LRR-pyrin domain-containing inflammasome 3 (NLRP3), activating caspases, and releasing IL-1β [44].

Alveolar Macrophages Play a Unique Role in the Protection Against Influenza A Infection

Cardani and Braciale et al(2017) demonstrated that AMФ are critical in the protection of type I alveolar epithelial cells (AEC-I) against lethal influenza infection [45].The authors developed a novel mouse model in which there is a cellular deficiency of mature alveolar macrophages. AMФ-deficient mice infected with sublethal doses of intranasal IAV developed acute respiratory distress syndrome and death 8-12 days post-infection. In these mice, IAV spreads unchecked throughout the lower respiratory tract, resulting in massive inflammation upon effector T-cell elimination of infected cells. They further demonstrated that intranasal administration of AMФ up to 24 hours post-infection rescued these mice from lethal infection by limiting IAV spread, illustrating the time-dependent role of AMФ in IAV respiratory infection. The authors determined that AMФ suppress autocrine production of cysteinyl leukotriene D4 in AEC-I, and that protection against IAV by AMФ could be replicated with drugs targeting the same downstream metabolites of the arachidonic acid pathway inhibiting production of cysteinyl leukotrienes. These finding demonstrated a previously unappreciated, protective role of AMФ in Influenza A infection.

References

  1. Thompson WW, Moore MR, Weintraub E, Weintraub E, Cheng PY(2009)et al. Estimating influenza-associated deaths in the United States. Am J Pub Health99:225-230. [crossref]
  2. Morbidity and Mortality Weekly Report (MMWR). (n.d.). Retrieved from https://www.cdc.gov/mmwr/preview/mmwrhtml/mm5933a1.htm
  3. Influenza (Seasonal). (n.d.). Retrieved from https://www.who.int/en/news-room/fact-sheets/detail/influenza-(seasonal)
  4. Thompson WW, Shay DK, Weintraub E, Brammer L, Cox N et al. (2003) Mortality associated with influenza and respiratory syncytial virus in the United States. JAMA289:179-186.[crossref]
  5. Thompson WW, Shay DK, Weintraub E, Brammer L, Bridges CB et al. (2004) Influenza-associated hospitalizations in the United States. JAMA292:1333-1340.
  6. Comparing deaths from pandemic and seasonal influenza. (2015, June 21). Retrieved from https://www.who.int/csr/disease/swineflu/notes/briefing_20091222/en/
  7. Shrestha SS, Swerdlow DL, Borse RH, Prabhu VS, Finelli LEstimating the burden of 2009 pandemic influenza A (H1N1) in the United States (April 2009-April 2010).Clin Infect Dis1:  75-82. [crossref]
  8. Wilkinson TM, Li CK, Chui CS, Huang AK Y, Perkins M et al. (2012). Preexisting influenza-specific CD4 T cells correlate with disease protection against influenza challenge in humans. Nature Medicine18: 274-80.[crossref]
  9. Pizzolla A, Wakim LM (2019) Memory T Cell Dynamics in the Lung during Influenza Virus Infection. The Journal of Immunology 20: 374-381. [crossref]
  10. Wang, Z et al.(2015) Recovery from severe H7N9 disease is associated with diverse response mechanisms dominated by CD8+ T cells. Nat Commun. 6:6833.
  11. Martín-Benito J, Ortín J (2013) Influenza Virus Transcription and Replication. Advances in Virus Research 87: 113-137. [crossref]
  12. Treanor JJ. (2005) In: Principles and Practice of Infectious Disease. Influenza virus2060.
  13. Rello J, Pop-Vicas A (2009) Clinical review: Primary influenza viral pneumonia. Critical Care13: 235. [crossref]
  14. Bender BS, Small PA Jr (1992) Influenza: pathogenesis and host defense. Semin Respir Infect7:38-45.[crossref]
  15. Zhirnov OP, Klenk HD (2007) Control of apoptosis in influenza virus-infected cells by up-regulation of Akt and p53 signaling. Apoptosis12: 1419-1432. [crossref]
  16. Stiver G. (2003). The treatment of influenza with antiviral drugs. CMAJ168: 49-57. [crossref]
  17. Guilliams M, Kleer ID, Henri S, Post S, Vanhoutte L (2013) Alveolar macrophages develop from fetal monocytes that differentiate into long-lived cells in the first week of life via GM-CSF. The Journal of Experimental Medicine210: 1977-1992. [crossref]
  18. Epelman S, Lavine KJ, Randolph GJ (2014) Origin and Functions of Tissue Macrophages. Immunity41: 21-35. [crossref]
  19. Tan SY, Krasnow MA (2016) Developmental origin of lung macrophage diversity.Development143: 1318-1327. [crossref]
  20. Eguíluz-Gracia I, Schultz HHL, Sikkeland LIB, Danilova E, Holm AM et al. (2016) Long-term persistence of human donor alveolar macrophages in lung transplant recipients. Thorax71: 1006-1011.[crossref]
  21. Sibille Y, Reynolds HY (1990) Macrophages and Polymorphonuclear Neutrophils in Lung Defense and Injury. American Review of Respiratory Disease141: 471-501. [crossref]
  22. Schneberger D, Aharonson-Raz K, Singh B (2010) Monocyte and macrophage heterogeneity and Toll-like receptors in the lung. Cell and Tissue Research343: 97-106. [crossref]
  23. Takahashi K, Yamamura F, Naito M (1989) Differentiation, Maturation, and Proliferation of Macrophages in the Mouse Yolk Sac: A Light-Microscopic, Enzyme-Cytochemical, Immunohistochemical, and Ultrastructural Study. Journal of Leukocyte Biology45: 87-96. [crossref]
  24. Lambrecht BN (2006) Alveolar Macrophage in the Drivers Seat. Immunity24: 366-368. [crossref]
  25. Varol C, Mildner A, Jun S (2015) Macrophages: Development and Tissue Specialization. Annual Review of Immunology33: 643-675. [crossref]
  26. Fossati-Jimack L, Ling GS, Cortini A, Szajna M, Malik TH et al. (2013) Phagocytosis Is the Main CR3-Mediated Function Affected by the Lupus-Associated Variant of CD11b in Human Myeloid Cells. PLoS One 8(2).[crossref]
  27. Katsumoto TR, Violette SM, Sheppard D (2011) Blocking TGFβvia Inhibition of theαvβ6 Integrin: A Possible Therapy for Systemic Sclerosis Interstitial Lung Disease. International Journal of Rheumatology1-7.
  28. García JE, Rodríguez FM, Cabo MR, Salgado MJ, Losada JP et al. (1999) Evaluation of Inflammatory Cytokine Secretion by Human Alveolar Macrophages. Mediators of Inflammation, 8: 43-51.[crossref]
  29. Holt PG (1978). Inhibitory Activity of Unstimulated Alveolar Macrophages on T-Lymphocyte Blastogenic Response1. American Review of Respiratory Disease118: 791-793. [crossref]
  30. Ding X, Jin S, Tong Y, Jiang X, Chen Z (2017) TLR4 signaling induces TLR3 up-regulation in alveolar macrophages during acute lung injury. Scientific Reports 7: 34278.[crossref]
  31. Persoons JH, Schornagel K, Tilders FF, Vente JD, Berkenbosch F (1996) Alveolar macrophages autoregulate IL-1 and IL-6 production by endogenous nitric oxide. American Journal of Respiratory Cell and Molecular Biology 14: 272-278.[crossref]
  32. Maus UA, Janzen S, Wall G, Srivastava M, Blackwell TS et al. (2006) Resident Alveolar Macrophages Are Replaced by Recruited Monocytes in Response to Endotoxin-Induced Lung Inflammation. American Journal of Respiratory Cell and Molecular Biology, 35: 227-235.[crossref]
  33. Rubins JB (2003) Alveolar Macrophages. American Journal of Respiratory and Critical Care Medicine167: 103-104.
  34. MacLean JA, Xia W, Pinto CE, Zhao L, Liu HW et al. (1996) Sequestration of inhaled particulate antigens by lung phagocytes: a mechanism for the effective inhibition of pulmonary cell- mediated immunity. Am J Pathol148:657-666. [crossref]
  35. Beck-Speier I, Dayal N, Karg E, Maier KL, Schumann G (2005) Oxidative stress and lipid mediators induced in alveolar macrophages by ultrafine particles. Free Radical Biology and Medicine38: 1080-1092.[crossref]
  36. Fenton MJ, Vermeulen MW, Kim S, Burdick M, Strieter RM (1997) Induction of gamma interferon production in human alveolar macrophages by Mycobacterium tuberculosis. Infection and Immunity 65: 5149-5156. [crossref]
  37. Hale BG, Albrecht RA, García-Sastre A (2010) Innate immune evasion strategies of influenza viruses. Future Microbiology 5: 23-41. [crossref]
  38. Iwasaki A, Pillai PS (2014) Innate immunity to influenza virus infection. Nature Reviews Immunology14: 315-328. [crossref]
  39. Wang J, Nikrad MP, Travanty EA, Zhou B, Phang T (2012) Innate Immune Response of Human Alveolar Macrophages during Influenza A Infection. PLoS ONE 7: 29879.[crossref]
  40. Zhang J, Miao J, Hou J, Lu C (2015) The effects of H3N2 swine influenza virus infection on TLRs and RLRs signaling pathways in porcine alveolar macrophages. Virology Journal 12: 61. [crossref]
  41. Xu Y, Liu L (2017) Curcumin alleviates macrophage activation and lung inflammation induced by influenza virus infection through inhibiting the NF-κB signaling pathway. Influenza and Other Respiratory Viruses 11: 457-463. [crossref]
  42. Saelens X (2019) The Role of Matrix Protein 2 Ectodomain in the Development of Universal Influenza Vaccines. The Journal of Infectious Diseases219: 68-74.[crossref]
  43. Wang R, Zhu Y, Lin X, Ren C, Zhao J (2019) Influenza M2 protein regulates MAVS-mediated signaling pathway through interacting with MAVS and increasing ROS production. Autophagy 15: 1163-1181. [crossref]
  44. Ichinohe T, Pang IK, Iwasaki A (2010) Influenza virus activates inflammasomes via its intracellular M2 ion channel. Nature Immunology 11: 404-410.
  45. Cardani A, Boulton A, Kim TS, Braciale TJ (2017) Alveolar Macrophages Prevent Lethal Influenza Pneumonia By Inhibiting Infection Of Type-1 Alveolar Epithelial Cells. PLOS Pathogens 13. [crossref]

COVID-19 and Type 1 diabetes in Sweden

DOI: 10.31038/EDMJ.2020424

Abstract

COVID19 is regarded as a lifethreatening infection for most people, but especially certain risk-groups including diabetes, and has therefore caused lock-down of societies which may have deleterious consequences.  Many countries have taken steps to shut down schools, companies and businesses,  and entire countries have been isolated. These drastic measures will have seriousconsequences for economy, psychosocial situation and health. There is a risk that people with other diseases like diabetes do not get ordinary adequate care.

Sweden has as the only country chosen another policy with recommended isolation of the most vulnerable populations, mainly people older than 70 years of age, and volontaryisolation of others who have eg serious lung disease och extreme obesity. Forverybody physical distancing, increased hygiene, at home when symptoms of COVID19, crowds < 50 people etc Otherwise open shops, open restaruants, open schools.

In the care of children and adolscents with Type 1 diabetes has some ordinary visits to the diabetesteam been replaced vby telemedicine. Quality has remained the same as 2018 and 2019  with national mean HbA1c 53.8 mmol/mol ( 95% CI 53-5- 54.1) during  Jan 1- April 28, 2020 and the proportion of patients with HbA1c < 57 mmol/l was  67.3% ( 95% CI  66-68.6%). Type 1 diabetes has not been a risk factor for severe COVID19, and no children with T1D are among those who have needed Intensive Care or who have died.

Keywords

COVID19, public health, economic depression, vulnerable groups, isolation

Severe Acute Respiratory Syndrome Coronavirus-2 (SARS-CoV-2), the virus that causes coronavirus disease 2019 (COVID-19), is   a major threat. Many countries have taken steps to shut down schools, companies and businesses,  and entire countries have been isolated. These drastic measures will have serious consequences for economy, psychosocial situation and health.

Sweden has as the only country chosen another policy with recommended isolation of the most vulnerable populations, mainly people older than 70 years of age, and volontary isolation of others who have eg serious lung disease och extreme obesity. Otherwise open shops, open restaurants, open nursery and primary schools. In spite of this open policy and a high rate of infected people fatality rate has  remained in the middle range of  European countries.

Diabetes is regarded as one of the risk factors for COVID19 [1-4]. This seems especially true for Type 2 diabetes connected to metabolic syndrome with hypertension, cardio-vasculare disease, and obesity According to Yang et al., among 52 critically ill patients, diabetes was present in 17% of cases [5]. According to Guan et al., among 1099 patients, diabetes was present in 16.2% of cases and hypertension was present in 23.7% of cases [6] and  according to Zhang et al., among 140 hospitalized patients, diabete was present in 12% of cases and hypertension was present in 30% of cases [7]. In children < 18 years of age, COVID19 is usually a mild disease, which very seldom leads to any dangerous clinical manistestation [8]. For children with Type 1 diabetes ( T1D) the large scale lock-down of society might have verynegative impacts. There is a risk that patients who get symptoms of diabetes do not dare to seek care which could lead to more severe clinical manifestation at onset. Another risk of severe lock-down of society is that patients with diabetes do not get ordinary adequate care.

The aim of this study was to get a picture of  the need for care at Intensive Care Unit  in Sweden until now (April 28th 2020), the proportion of patients with diabetes and need for ICU in children and adolescents.  In addition the aim was to investigate how quality of care of children and adolescents with T1D in Sweden has been influenced by the ongoing pandemic.

Material and Methods

Sweden has next to Finland the highest incidence of T1D in children and adolescents in the world [9]. All patient visits are registered in a national data base, SWEDIABKIDS [10] with information about HbA1c, blood lipids etc. In what way the coronavirus epidemic has influenced care is described after regular contacts between diabetesteams at pediatric clinics. All patients needing intensive care are registered in the Swedish Register for Intensive Care, in which also all patients needing ICU because of COVID19 are registered [11].

Results

Some diabetes clinics have continued in the same way as before. Patients have come to the hospital for ordinary visits and met members of the diabetesteams. Other diabetes teams have during the corona epidemic started to use telemedicine as a complement, meaning that patients, and for children their parents, have been contacted via telephone and/or skype, and in addition blood glucose values have been uploaded from glucose sensors and evaluated using Diasend. National HbA1c has remained stable: For children < 18 year of age mean HbA1c for all Sweden was 2018 54.7 mmol/mol (95% confidence interval 54.4-55), for 2019 53.3 ( 53-53.6) and for 2020 ( jan 1- April 28) 53.8 ( 53-5- 54.1). The proportion of patients with HbA1c < 57 mmol/l was  2018 63.4% (  95% confidence interval 62.3-64.5%), 2019 68.3% (67.2-69.4%) and for 2020 ( Jan 1- April 28) 67.3% ( 66-68.6%). Kolesterolvalues are registered between age 10-18 years and proportion < 4.5 was 2018 69% ( 66.7- 71.3), 2019 69.9% ( 67.5-72.3) and 2020 so far 71.6% (684- 74.8). Looking at any other parameter in the quality register shows the same trend: No difference between 2020 so far (April 28th) and the previous two years.

Regarding severity of COVID19  and the result of the Swedish approach in comparison with the lock-down of other European countries it is difficult to draw conclusions as the different countries have different degree proportions of  infected population. Sweden , with its rather open society has already a high proportion of infected people in the general population, with certain areas having passed 25% of the population, while some countries calculate with much lower proportions. Number of deaths in Sweden are shown in Figure 1. Mean age of  death people was 81 years. A large majority (93%) of the death persons belonged to at least one risk group, with chronic cardiovascular disease being the most prevalent, followed by diabetes, chronic respiratory disease and chronic renal failure  (Table 1). Number of patients at Intensive Care Unit (ICU) is shown in Figure 2 which illustrates that the numbers per day is kept rather stable.Fig 3 shows that males dominate and that there are almost no young individuals needing ICU except for rare cases with severe other underlying diseases, not Type 1 diabetes.

EDMJ-4-2-406-g001

Figure 1. Number of covid19-related deaths per day in Sweden

Table 1. Risk factors for patients who have needed Intensive Care becuase of COVID19 in Sweden until 28th April 2020

Riskgroup

Females (%)

(n)

Male(%)

(n)

Number of persons

>65 years of age

9,0

167

26,6

495

528

Child, several handicap

0,0

0

0,0

0

0

Pregnancy

1,2

22

0,0

0

15

Hypertension

8,4

156

28,2

524

544

Chronic heart-lung disease

5,6

104

16,0

298

340

Chronic heart disease

1,4

26

8,8

164

166

Chronic lung disease

4,5

84

8,6

159

204

Immune deficiency

1,7

31

3,0

55

76

Chronic liver/renal disease

0,7

13

2,8

52

60

Chronic liver insuff

0,2

4

0,4

7

11

Chronic renal insuff

0,5

10

2,5

46

51

Diabetes

5,4

100

18,2

339

349

Extreme obesity

2,3

43

3,8

71

96

Neuromuscular disease

0,3

5

0,7

13

17

Other disease

2,7

50

8,0

149

189

EDMJ-4-2-406-g002

Figure 2. Number of covid19-related deaths per day in Sweden

EDMJ-4-2-406-g003

Figure 3. ICU in different age groups. Blue: Females, Orange: Males.

Discussion

The Corona virus pandemic threathens ordinary health care, Many contries have  become paralysed and there is a risk that treatment of serious diseases like Type 1 diabetes in children and adolescents deteriorate, which may take long time to repair. With poor metabolic control we know that there is a increasing risk of vaculsar complications, and HbA1c has to be kept quite low to avoid long-term complications [12-14]. Sweden has a tradition of very active treatment of T1D with low mean HbA1c on a national level compared to many other contries [15]. In spite of this active treatment those who have got the diagnosis Type 1 diabetes in childhood have a much shorter expected length of life than a reference population [16]. Iy is therefore mandatory to try to keep quality of care also during the corona pandemic.

When society is closed because of the this pandemic telemedicine is an alternative to ordinary visits to the diabetes team [17]. This may become a valuable experience which in the future might improve care when used as a complement, but there will also be a risk that both diabetes teams and  patients/parents continue with this type of contacts instead of physical visits as it seems comfortable. Health care authorities may also become positive to this cheaper form av care. However, digital visits have certain advantages, but do not give the same type of contact as a physical meeting. This could lead to less motivation and deteriorating metabolic control .

During the corona pandemic Sweden has, unlike many other countries, not imposed any lockdown, with most measures being voluntary. The Swedish constitution prohibits ministerial rule and mandates that the relevant government body, in this case an expert agency, the Public Health Agency, must initiate all actions to prevent the virus, rendering the state epidemiologist a central figure in the crisis. The government can follow agency recommendations, as it has with legislation limiting freedom of assembly, temporarily banning gatherings of over 50 individuals, banning people from visiting nursing homes, as well as physically closing secondary schools and universities. Primary schools have remained open, in part to avoid healthcare workers staying home with their children.

The Public Health Agency and government have issued recommendations to: if possible, work from home; avoid unnecessary travel within the country; to engage in physical distancing; and for people above 70 to stay at home, as much as possible. Those with even minimal symptoms that could be caused by COVID-19 are recommended to stay home. The ‘karensdag‘ or initial day without paid sick-leave has been removed by the government and the length of time one can stay home with pay without a doctor’s note has been raised from 7 to 21 days.This approach has made it possible to keep the infection rate at such a level that the number of individuals needing intensive care because of COVID19 has remained at a steady state, and all the time there has been a reserve capacity of ca 20% of ICU beds.

Although a large proportion of the patients at ICU has had diabetes, most of them have had T2D, and no children or even young adults with T1D has needed ICU. T1D has not been regarded as a riskgroup in children andadolescents, and as society has been kept open the care and treatment of T1D has remained of good quality. There is so far no sign of deterioration of metabolic control, with HbA1c values which remain low compared to what is reported from other contries [15]. Ordinary visits at hospital has sometimes been replaced by virtual meetings with the use of internet. Thus, treatment of children and adolescents with Type 1 diabetes has worked well in spite of some lack of staff in the diabetes teams as some have been ill or stayed at home because of possible COVID19 symptoms, and also because some members of the diabetes teams have been ordered to be part of COVID19 teams.

The result of approach to fight the corona virus pandemic may have to differ between countries. One reason to different approaches in European countries is probably different political culture, where Sweden differs having strong independet expert authorities and a poluation with confidence in these authorities. Other countries may have more need for ”strong” political leaders making their own decisions, not always based on the basis of scientific evidence. The lock-down of societies evidently stop or at least delay the spread of corona virus, but only to some extent. The fatality rate has remained lower in some countries than in Sweden, but also much higher in several other European countries with strict lock-down. This lock-down approach  is not sustainable for an extended period due to its drastic and increasing economic and social consequences. Furthermore, even if successful, universal curfews would have to be implemented over many months or perhaps longer then so. The economic collapse with mass unemployment would have deterious effects on health including increasing mortality also in younger age groups. As an example the much less severe economic turbulence 2009 was calculated to cause the death of 260 000 individuals just by cancer [18] , and the negative effects on health in the developing countries was very large [19]. Another risk is the care of diabetes, as poor metabolic control may lead to long-term serious consequences for a large number of patients, with increased mortaliy many years later. In addition, long lock-down and economic collapse will, over time, destabilize society, not only through tremendous economic losses, but also through the risk of increasing social unrest and the psychological consequences of social isolation [20].

In conclusion, the corona pandemic may have great influence on the the care of Type 1 diabetes, which may have both actual and future effects. Type 1 diabetes is a lifethreatening disease. Too late diagnosis can lead to ketoacidosis and death. Poor metabolic control leads to serious complications and shorter life. The corona virus epidemic tends to paralyse societies and influence health care, which in the long run may ead to more serious effects on morbidity and mortality in young people than the corona virus per se. A more open approach based on isolation of vulnerable groups, mainly the elderly, but otherwise a functioning society is an alternative way to  both manage the pandemic and at the same time keep a high standard of diabetes care.

Acknowledgements

This study has been facilitated by the contacts created by SWEDIABNET ( The Swedish Pediatric Diabetes Trial network) supported by Vinnova and Barndiabetesfonden ( the Swedish Child Diabetes Foundation)

Disclosure

Johnny Ludvigsson has anything to disclose, and no conflict of interest.

References

  1. Clerkin KJ, Fried JA, Raikhelkar J, Sayer G, Griffin JM, et al. (2020) Coronavirus Disease 2019 (COVID-19) and Cardiovascular Disease. Circulation. [Crossref]
  2. Zhou F, Yu T, Du R, Fan G, Liu Y, et al. (2020) Clinical course and risk factors for mortality of adult inpatients with COVID-19 in Wuhan, China: a retrospective cohort study. The Lancet. [Crossref]
  3. Driggin E, Madhavan MV, Bikdeli B, Chuich T, Laracy J, et al. (2020) Cardiovascular Considerations for Patients, Health Care Workers, and Health Systems During the Coronavirus Disease 2019 (COVID-19) Pandemic. Journal of the American College of Cardiology27204. [Crossref]
  4. [The epidemiological characteristics of an outbreak of 2019 novel coronavirus diseases (COVID-19) in China] (2020) Zhonghualiuxingbingxuezazhi = Zhonghualiuxingbingxuezazhi 41: 145-51. [Crossref]
  5. Yang X, Yu Y, Xu J, Shu H, Xia J, et al. (2020) Clinical course and outcomes of critically ill patients with SARS-CoV-2 pneumonia in Wuhan, China: a single-centered, retrospective, observational study. [Published online ahead of print. Lancet Respir Med 8: 475-481. [Crossref]
  6. Guan WJ, Ni ZY, Hu Y, Liang WH, Ou CQ, et al.(2020) Clinical characteristics of coronavirus disease 2019 in China. [Published online ahead of print (February 28, 2020)]. N Engl J Med 80: 656-665. [Crossref]
  7. Zhang JJ, Dong X, Cao YY, Yuan YD, Yang YB, et al. (2020) Clinical characteristics of 140 patients infected with SARS-CoV-2 in Wuhan, China. [Published online ahead of print (February 19, 2020)]. Allergy. [Crossref]
  8. Ludvigsson JF (2020) Systematic review of COVID-19 in children show milder cases and a better prognosis than adults. ActaPaediatrica 109: 1088-1095. [Crossref]
  9. Ludvigsson J (2017) Increasing Incidence but Decreasing Awareness of Type 1 Diabetes in Sweden. Diabetes Care 40: e143-e144. [Crossref]
  10. Hanberger L, Samuelsson U, Lindblad B, Ludvigsson J, Swedish Childhood Diabetes Registry SWEDIABKIDS (2008) A1C in children and adolescents with diabetes in relation to certain clinical parameters: the Swedish Childhood Diabetes Registry SWEDIABKIDS. Diabetes Care 31: 927-929. [Crossref]
  11. The Swedish Intensive Care Registry (SIR) https://www.icuregswe.org/
  12. Nordwall M, Abrahamsson M, Dhir M, Fredrikson M, Ludvigsson J, et al. (2015) Impact of HbA1c, followed from onset of type 1 diabetes, on the development of severe retinopathy and nephropathy: the VISS Study (Vascular Diabetic Complications in Southeast Sweden). Diabetes Care 38: 308-315. [Crossref]
  13. Nordwall M, Fredriksson M, Ludvigsson J, Arnqvist HJ (2019) Impact of Age of Onset, Puberty, and Glycemic Control Followed From Diagnosis on Incidence of Retinopathy in Type 1 Diabetes: The VISS Study. Diabetes Care 42: 609-616. [Crossref]
  14. Lind M, Pivodic A, Svensson AM, Ólafsdóttir AF, Wedel H, et al. (2019) HbA1c level as a risk factor for retinopathy and nephropathy in children and adults with type 1 diabetes: Swedish population based cohort study. BMJ 366: l4894. [Crossref]
  15. Anderzén J, Hermann JM, Samuelsson U, Charalampopoulos D, Svensson J, et al. (2020) International benchmarking in type 1 diabetes: Large difference in childhood HbA1c between eight high-income countries but similar rise during adolescence-A quality registry study. Pediatr Diabetes 21: 621-627. [Crossref]
  16. Rawshani A, Sattar N, Franzén S, Rawshani A, Hattersley AT, et al. (2018) Excess mortality and cardiovascular disease in young adults with type 1 diabetes in relation to age at onset: a nationwide, register-based cohort study. Lancet 392: 477-486. [Crossref]
  17. Garg SK, Rodbard D, Hirsch IB, Forlenza GP (2020) Managing New-Onset Type 1 Diabetes During the COVID-19 Pandemic: Challenges and Opportunities. Diabetes TechnolTher22: 431-439. [Crossref]
  18. Maruthappu M, Watkins J, Noor AM, Williams C, Ali R, et al. (2016) Economic downturns, universal health coverage, and cancer mortality in high-income and middle-income countries, 1990-2010: a longitudinal analysis. Lancet 388:684-695. [Crossref]
  19. Friedman J, Schady N (2013) How many infants likely died in Africa as a result of the 2008-2009 global financial crisis? Health Economics 22:611-622.
  20. Armitage R, Nellums LB (2020) COVID-19 and the consequences of isolating the elderly. The Lancet Public Health 5: e256. [Crossref]

“Mastering” the Laboratory Sciences in Public Health Education

DOI: 10.31038/PEP.2020113

Abstract

Public health laboratories provide critical surveillance data to improve community health and environmental quality. Yet, the nation is facing a large shortfall in laboratory workers and leaders due to the number of those projected to retire and the increasing complexity of analyses and regulatory requirements. To help meet this demand, the Public Health Laboratory Sciences Master’s degree program at Southern Illinois University School of Medicine combines graduate-level classroom instruction with extensive research experience in a public health laboratory. Developed as a collaborative effort with the Illinois Department of Public Health, this graduate program is designed to produce scientists with applied  training  in  clinical,  environmental, and molecular testing protocols. The diverse training environment allows for immediate employment of graduates who require only minimal additional “on the job” training. This article will highlight the significance, curriculum, training, and success of this unique master’s degree dedicated to training the next generation of public health laboratory employees and leaders.

Keywords

Public Health, Laboratory, Education

Introduction

As the U.S. population continues to expand, so too has the demand for a highly-skilled public health workforce. However, the public health community faces current and future challenges to ensure that public health services are sustained for future generations. Many of these challenges have been discussed in length by the American Public Health Association (APHA) and include: i) budget cuts and lack of appropriate funds to support public health services, ii) significant reduction in the public health workforce (up to 50% was expected by 2012) due to retirement, iii) decrease in well qualified entry-level public health professionals to replace retirees and iv) increasing demand for more technical and analytical experts for current and future testing methodologies [1]. Despite a shrinking budget and workforce, public health agencies have been challenged to provide the same level and quality of services. The ideal ratio of public health professionals is based on the 1980 model of 220 public health professionals for every 100 000 U.S. citizens [2]. While the U.S. population has increased 27% since 1980, the public health workforce has decreased by around 55 000 to reflect today’s working capacity of ~500 000 employees [3-5]. In order to achieve the appropriate number of public health professionals for current U.S populations, the workforce would need to add ~750 000 public health professionals over the next 8 to 10 years. To address this demand, Southern Illinois University School of Medicine (SIU-SOM) in collaboration with the Illinois Department of Public Health (IDPH) developed a unique academic and laboratory training program to reinforce the ranks of the public health workforce.

Present and future deficiencies of the public health workforce

As defined by the Institute of Medicine, a public health professional is “a  person educated in public health or a related discipline who is employed to improve health through a population focus” [6]. Of the collective public health professionals about 16 000 (3.1%) are laboratorians. However, only 20% of individuals received formal training within their assigned laboratory occupation [7]. In addition, the number of personnel with advanced graduate degrees needed to successfully implement, conduct, and troubleshoot protocols performed within a modern laboratory are inadequate with only 33% of laboratorians holding a Master of Public Health (MPH) or equivalent advanced degree [8]. Classic examples outlining the responsibilities of properly educated and trained public health laboratory professionals include the identification of infectious pathogens during epidemic and pandemic outbreaks, newborn screening for heritable genetic diseases, environmental testing in support of the Safe Drinking Water Act, and screening of clinical samples to identify sexually transmitted diseases. In addition to an increasing U.S. population, modern medicine and preventative measures continue to decrease morbidity and mortality of acute and chronic disease which increases life expectancy. Despite advancements  in  the  quality  and  longevity  of  life,  resurgence of infectious pathogens leading to epidemic  and  pandemic  events  has resulted in increased demands on public health professionals. This demand requires rapid identification and response to limit the dissemination of these pathogens. One of the greatest problems facing today’s public health infrastructure is the greying workforce. In Illinois, for example, the average age of a State Health Agency worker was 48 years in 2007. As a result, ~50% of those workers were eligible for retirement in 2012 [4, 5, 9]. Nationwide, the average number of public health workers eligible for retirement in 2012 was estimated to be 150 000 reducing the current workforce of 500 000 employees by 30% [4, 5, 9]. As a result, laboratory workers, epidemiologists, and environmental health workers will become burdened by an increased work-load if the workforce cannot be replenished with properly trained personnel.

In 2001, the Center for Disease Control (CDC) put forth recommendations to the Appropriations Committee of the U.S. Senate outlining specific goals that needed to be attained by the  year 2010 to ensure a strong public health workforce with specific emphasis placed on epidemiologists, environmental health specialists, and laboratorians [7]. Despite these suggestions, the U.S. public health workforce has continued to decline as a consequence of: i) aging and retirement of public health workers, ii) workers opting into early retirement as a result of pension reform, and iii) general lack  of knowledge or interest of persons to pursue public health related employment. In addition, cutbacks, layoffs, and hiring freezes brought on by budget cuts to state and local public health departments have resulted in a smaller public health workforce struggling to serve an ever increasing population with rapidly evolving technically advanced procedures.

Development of the graduate degree in Public Health Laboratory Sciences (PHLS)

The CDC also recommended that by 2010, each public health laboratory have access to rapid and high quality testing procedures and the utilization of standards for specimen collection, transport, testing, and reporting.7 To meet these demands, modern public health laboratories are relinquishing traditional testing strategies in favor of molecular methods which can provide definitive results in a matter of  hours  instead  of days to weeks after receiving a clinical sample. The increasing demand for well-educated and trained professionals underscored the need to establish an advanced degree program.  In August  of 2005, SIU-SOM  in partnership with IDPH implemented the Public Health Laboratory Sciences (PHLS) degree program to address this need. The program is designed to expose students to advanced education in the basic sciences and public health. Didactic coursework is augmented with hands-on training in the IDPH laboratories where students receive bench-top experience with clinical, environmental, and biothreat samples during routine, epidemic, and pandemic events. In addition, PHLS graduate students meet Clinical Laboratory Improvement Amendments (CLIA) certification requirements. This in-depth training combined with a well- rounded academic curriculum ensures development of highly-qualified laboratorians who are well-versed in advanced biological disciplines. The academic and laboratory training experiences of the PHLS program are detailed below and summarized in Figure 1.

PEP-1-1-105-g001

Figure 1. The PHLS curriculum.
Schematic demonstrating the academic and laboratory training requirements to complete the non-thesis MS degree in PHLS. Total academic credits equal 46 hours (28 of didactic courses and 18 of laboratory training). Core science courses include Biochemistry I, Biochemistry II, Immunology, Bacterial Genetics and Student Seminar,and Public health program-specific courses include Introduction to the Public Health, Public Health Laboratory Disciplines, Environmental Chemistry, Clinical Microbiology and Research Methods. Hands-on training is received in the laboratory (Public Health Laboratory Training) throughout the program with rotations in the Carbondale and Chicago laboratories completed in the summer term between year 1 and year 2.

PHLS Curriculum

This non-thesis Master’s degree requires completion of 46 credit hours (28 credits of academic courses and 18 credits of laboratory- specific training) over 24 months. Each class consists of 3 to 4 students with undergraduate degrees in the physical, biological and clinical sciences including biology, chemistry, microbiology, medical technology, or public health and others. Core science courses are identical to those taken by all Master’s  and PhD graduate students  in the Microbiology, Biochemistry and Molecular Biology (MBMB) graduate program: Biochemistry I, Biochemistry II, Immunology, Bacterial Genetics and Student Seminar. The curriculum also includes program-specific courses: Introduction to the Public Health, Public Health Laboratory Disciplines, Environmental Chemistry, Clinical Microbiology and Research Methods. The majority of the coursework is completed during the first academic year. Hands-on training is completed in the public health laboratory where students are trained in diagnostic microbiology, environmental microbiology,  blood  lead analysis, and molecular diagnostics. By the end of the first year, students have completed 20 academic credits and have accumulated nearly 500 hours of hands-on training in the laboratory. During the summer term (May through August), students do not take academic courses and instead devote all of their time to laboratory training (~35 hours per week). This period focuses on practical application  of knowledge gained during the first year to support day-to-day laboratory work. Students also have opportunities to participate in field work with local health department staff. Activities include animal control, family case management, food sanitation, immunization clinics and senior home visits. This exposes them to the wider practices of public health. In addition, students travel to IDPH labs in Chicago and Carbondale to rotate through testing sections specific to those locations, such as newborn screening and sexually transmitted disease testing, respectively. These opportunities increase exposure to advanced testing procedures and personnel at these locations. During the second year, students complete the remaining academic requirements totaling 11 credit hours. Students spend substantially more time in the laboratory (25 hours per week versus 10 to 15 in the first year) where they further refine and expand their practical skill sets. By the end of the program, students have attained training in clinical, environmental and molecular testing protocols for infectious, sexually-transmitted and heritable disease as well as food, milk, water, blood lead testing, and the identification of bio-threats as part of    the Illinois Public Health Preparedness Center in collaboration with local and federal law enforcement agencies using state-of-the-art equipment (Table 1).

PEP-1-1-105-t001

Laboratory Training Opportunities and Objectives

Students have the opportunity to train in all three of the IDPH laboratories based in Springfield, Carbondale, and Chicago. These labs perform differing tests to support public health epidemiology programs by providing surveillance data with the goal of improving public health and environmental quality throughout Illinois. Each laboratory participates in numerous certification programs to ensure the accuracy of testing data. All three laboratories have a CLIA certificate and Select Agent certificate to ensure quality clinical laboratory testing and biological threat agent testing, respectively. The Chicago laboratory is accredited by the American Industrial Hygiene Association Laboratory Accreditation Programs (AIHA-LAP, LLC) to test paint, soil, dust wipes, and air filters to determine the level of lead in these samples. The Carbondale and Chicago laboratories are certified water microbiology and dairy labs. The Springfield laboratory is accredited by the U.S. Food and Drug Administration (FDA) and U.S. Environmental Protection Agency (EPA) for dairy and drinking water testing, respectively. As a result, students have an opportunity to gain broader knowledge in all medical and scientific disciplines by working with personnel who strive to ensure advanced laboratory capabilities at all three locations. The majority of the tenure is spent at the Springfield location. The IDPH Division of Laboratories in Springfield is composed of three primary sections: environmental microbiology, diagnostics/clinical microbiology, and blood lead screening. Students gain experience in laboratory testing procedures and become proficient using procedures and equipment which transcend many fields after graduation. In the environmental microbiology section, students learn procedures for water and dairy testing. Water testing  is performed for nitrate and nitrite  detection,  fluoride  detection, and pH determination. Dairy testing is performed for laboratory grade testing and for detection of elevated coliform counts. Students also have the opportunity to participate in the FDA milk splits proficiency testing program in accordance to the requirements of the Grade A Pasteurized Milk Ordinance. By successfully completing the proficiency test, students become certified milk analysts. In the diagnostics/clinical microbiology section, students become proficient in quantitative polymerase chain reaction (qPCR) and pulsed-field gel electrophoresis (PFGE). These methods are used to detect and characterize infections caused by typical enteric bacteria such as Salmonella, Shigella, and Escherichia coli. The experience gained with qPCR techniques extends to the detection of Mumps, Measles, Norovirus, and Influenza. Direct Fluorescent Antibody (DFA) testing procedures are learned for detection of Rabies virus. In the blood lead section, students learn to process samples and utilize procedures and equipment, such as inductively coupled plasma mass spectrometry (ICP-MS), to test for elevated lead levels in venous blood samples. In addition to these advanced techniques and skills, students learn and are expected to follow quality assurance and quality control procedures for record keeping, equipment maintenance, experimental and environmental controls in each laboratory section. Once appropriately trained, PHLS students have been utilized to enhance the effectiveness of the laboratories in performing public health services. The advanced biological, biochemical, and molecular knowledge of these students can be called upon to troubleshoot, identify, and establish new testing capabilities within IDPH laboratories in support of enhanced measures to identify infectious pathogens. For example, in 2009 the IDPH laboratory in Carbondale, IL used the molecular expertise of   a PHLS graduate student to develop a biosafety level (BSL)2/BSL3 molecular testing facility for the identification of pandemic Influenza, Norovirus, HIV, Shiga-toxin (STX)-producing microbial pathogens, and bio-terror select agents.

Comparison of the PHLS degree to traditional MPH programs

To illustrate the novelty of the PHLS program, we compared our graduate curriculum against the average of five well-established and accredited MPH graduate programs. This comparison was performed by dividing the core curriculum into three categories: i) biological science courses (Fig. 2A, B; blue), ii) didactic public health associated courses (Fig. 2A, B; grey), and iii) laboratory training and application and/or equivalent internship experience (Fig. 2A, B; orange). The model was applied to determine the relative emphasis (percentage) that each program dedicated to establishing an academic curriculum which would best meet the demands necessary to increase laboratory scientists in the public health workforce. Despite the presence of    all three core components in both the PHLS and MPH programs,   the distributions of those components vary  widely.  For  example, the primary focus of MPH academic programs is on public health administration and policy with courses such as: Justice and Resource Allocation, and Ethical Basis of the Practice of Public Health making up 68% of the curriculum (Fig. 2A) [10]. The remaining academic instruction covers the biological sciences (28%). Practical experience acquired in the laboratory or through an internship makes up less than 5% of MPH degree requirements (Fig. 2A). In contrast, the PHLS program provides a more even distribution among public health policy, biological sciences, and laboratory experience (Fig. 2B). Thus, PHLS graduates are well-versed in public health policy, trained to perform clinical and environmental testing, and knowledgeable of core biological sciences used to design, implement, an troubleshoot diagnostic assays utilized by modern public health facilities.

PEP-1-1-105-g002

Figure 2. Comparison of academic curriculum for a traditional MPH versus the PHLS program.
Core didactic courses in public health (grey), biological sciences (blue), and laboratory training or equivalent internship experience (orange) were identified within (A) the average of five well-established and accredited MPH programs, and compared against the same criteria for the (B) SIU-SOM PHLS program. Each colored section was defined as the cumulative percentage (%) of courses offered within each respective area as described in the course description from each institution [10-12].

Current success of the PHLS program

Despite the vacancies of available public health professionals, recent reports have indicated that there remains a lack of enthusiasm and interest in public health careers [4]. This may be due, in part, to a lack of available nationwide public health programs designed to motivate and instruct public health professionals to pursue careers in modern public health facilities. This may be an issue for some traditional MPH programs. MPH programs frequently lack clear direction for graduate students other than to encourage the graduates to pursue a position as a public health department administrator, public health program manager, or similarly titled  position.  This  problem  is  further  compounded by the fact that there is a nebulous boundary which separates public health occupations from similar health care occupations. However, public health disciplines are very focused on community health and population health at the local and national level, whereas health care occupations focus on the health of the individual. The PHLS program is designed to train graduate students in the varied aspects of public health policies and procedures while emphasizing and focusing on the accrual of in-depth scientific knowledge and laboratory training to be able to effectively analyze and diagnose threats to the health of the community/ population. To date, 22 students have completed the PHLS program. Over 50% of these students (14 of 22) were born and raised in Illinois with the remainder coming from the continental US or abroad. The majority of students have been females (18 of 22). The overall success of any program can be measured in terms of occupational  placement of students within the respective program following graduation. By these criteria, we evaluated the percentage of students that successfully completed the PHLS program by the occupational career fields in which they are currently employed. Fifteen (68%) are currently employed in clinical laboratory scientist positions in public health occupations, six (27%) have completed or are pursuing doctoral level education within public health related fields, and one (5%) is employed by a biotechnology company (Fig. 3). Thus, 100% of all PHLS graduates continue to use the knowledge and technical skills obtained through the PHLS program in their chosen careers.

Conclusion

The demand for well-trained and competent public health professionals will continue to increase to meet the demand of the ever-increasing U.S population and sophistication of public health laboratory testing methods. In collaboration with IDPH, the SIU- SOM has instituted a curriculum in Public Health Laboratory Sciences designed to instruct graduate students in public health and policy  and the biological sciences as well as technical laboratory training. We believe this combination of education and technical experience  is essential to produce public health professionals who are competent to conduct clinical testing, train personnel, and manage core public health facilities. We have found this program to be feasible utilizing existing resources and funding. In addition, the majority of core didactic course for the PHLS students are taken in conjunction with other MS and PhD graduate students in the MBMB program. This arrangement facilitates accrual of advanced analytical thinking skills and exposes PHLS students to unique ways of approaching problems. The benefits to the host laboratory are immediate. By the end of year 1, students are exposed to the clinical and environmental analyses performed in the public health laboratory. This is amazingly practical, as the scientific knowledge gleaned from the concurrent science courses is immediately integrated into the laboratory analyses that the students are required to experience “at the bench”. The contribution to the public health laboratory infrastructure is practically immediate, as the staff of the host laboratory orient and train the students to aid in daily conduct of tests. This has very practical utilization as the frequent spikes in test volumes (e.g. foodborne outbreak investigation, suspect bioterrorism samples, etc.) allow the staff to utilize the students-in- training to augment the laboratory’s capacity. Of perhaps far greater significance, this unique “labor pool” can be accessed without resorting to the very convoluted and extended timeframe hiring process this   is characteristic of most government public servant positions. We believe this program is an important and unique resource to meet public health workforce shortages. Furthermore, advances in the complexity of analyses and expanding regulatory requirements dictate that every discipline practiced in public health will demand a greater in-depth knowledge of that discipline at the outset. The end result is the development of a highly educated and experienced individual who can immediately assume lead worker duties in a modern public health laboratory, with no or very little additional laboratory training.

Implications for Policy & Practice

• The PHLS program addresses many of the challenges identified by the Public Health Workforce Interests and Needs Survey (PH WINS).

• The PHLS program provides a well-balanced curriculum in public health and policy and the biological sciences as well as technical laboratory training.

• PHLS students contribute to the public health laboratory infrastructure.

• The host public health laboratory receives immediate benefit as scientific knowledge gained from science courses is immediately integrated into the laboratory analyses that the students are required to experience “at the bench”.

• Creates a unique “labor pool” which can be accessed immediately during outbreaks or spikes in test volumes.

References

  1. Institute of Medicine (2003) Who Will Keep the Public Healthy? Educating Public Health Professionals for the 21st Century.
  2. State Public Health Employee Worker Shortage Report: A Civil Service Recruitment and Retention Crisis. Association of State and Territorial Health Officials. Published 2004. Accessed 31 March 2017.
  3. Draper DA, Hurley RE, Lauer JR (2008) Public health workforce shortages imperil nation’s health. Res Brief 4: 1-8. [crossref]
  4. Master of Public Health Program – Curriculum Guide (2012) In: Health HSoP. Boston.
  5. Master of Public Health Program – Curriculum Guide (2015) In: Health JHBSoP. Baltimore.
  6. Morrissey T (2006) The Affordable Care Act’s Public Health Workforce Provisions: Opportunities and Challenges. Washington DC.
  7. Perlino C (2006) The Public Health Workforce Shortage: Left Unchecked, Will We Be Protected? Washington, DC.
  8. Public Health Infrastructure. Centers for Disease Control and Prevention. https://www.cdc.gov/media/pressrel/fs020514.htm. Published 2001. Accessed March 30, 2017.
  9. Rosenstock L, Silver GB, Helsing K, Evashwick C, Katz R et al. (2008) On Linkages: Confronting the Public Health Workforce Crisis: ASPH Statement on the Public Health Workforce. Public Health Reports 123: 395-398. [crossref]
  10. Willard R. Local Health Department Job Losses and Program Cuts. National Association of County and City Health Officials. http://archived. naccho.org/topics/infrastructure/lhdbudget/upload/Job-Losses-and-Program- Cuts-5-10.pdf. Published May 2010. Accessed March 31, 2017.
  11. Toossi M (.2013) Labor force projections to 2022: the labor force participation rate continues to fall. Monthly Labor Review.
  12. 2-Year Master of Public Health (MPH) in Environmental Health Sciences (2015) In: University of California BSoPH. Baltimore.

Utility of Video Electroencephalography Monitoring for Diagnosis of Epilepsy and Nonepileptic Paroxysmal Events

DOI: 10.31038/AWHC.2020333

Abstract

Objective: Video electroencephalography monitoring (VEM) is an important tool for the diagnosis and classification of seizures and for the presurgical evaluation of patients with drug-resistant epilepsy. The aim of this study was to assess the utility of VEM in patients referred for differential diagnoses (epileptic events versus nonepileptic episodes) and/or improving diagnosis accuracy in epilepsy.

Methods: Three hundred and eight VEM studies were analyzed retrospectively over a period of 3 years. Only studies obtaining seizure classification and diagnostic clarification to determine the nature of paroxysmal events were included (n = 125). The clinical diagnoses before and after VEM were compared. VEM was useful if it changed the diagnosis and/or therapy or if it answered the clinical question raised by the referring physician.

Results: One hundred twenty-five patients were included (64% women) with a mean age of 43.0 ± 1.6. During VEM, 61 patients had typical clinical events; there were 21 seizures, 25 physiological events, and 18 psychogenic nonepileptic seizures (PNES). In the PNES group, we found that women and younger patients were more frequent. Epileptic patients had a shorter evolution time, and the physiological events group had an older age at event onset compared to the epilepsy group. The provisional diagnosis changed in 35% of the cases after VEM. The diagnostic usefulness of VEM was 89%. After VEM, treatment changed in 50% of patients.

Significance: VEM is an essential tool to differentiate seizure from nonepileptic paroxysmal events. It is imperative to achieve an accurate diagnosis to determine the most suitable therapeutic approach.

Key Point Box

• Misdiagnosis of nonepileptic paroxysmal events and epilepsy represents a problem with important therapeutic and social repercussions.

• Inpatient VEM has been demonstrated to be a useful tool for the diagnosis and classification of seizure events.

• VEM achieved an accurate diagnosis and accomplished the most suitable therapeutic approach in epileptic and nonepileptic patients.

Keywords

epileptic seizures, nonepileptic paroxysmal events, physiological events, psychogenic nonepileptic seizure, syncope

Introduction

An Epileptic Seizure (ES) is defined as a transient occurrence of behavioral alterations produced by abnormal, excessive, and hypersynchronous neuronal activity in the brain [1, 2]. However, since the symptoms are diverse, diagnosis of ES may be challenging given the differential diagnoses [3, 4]. Nonepileptic paroxysmal events of physiological and psychological origin, such as syncope, sleep disorders, migraines or psychogenic nonepileptic seizures (PNES), can also manifest as behavioral disturbance events or transient alterations of consciousness [3]. It is extremely important to achieve an accurate diagnosis in epilepsy, given its morbidity associated with undiagnosed and untreated seizures [2]. In the same way, misdiagnosed epilepsy can result in side effects from antiepileptic drugs, economic costs, and impact on quality of life.

Video electroencephalography monitoring (VEM) is the most useful diagnostic tool for the classification of ES, as well as being the current gold standard for distinguishing epileptic versus nonepileptic paroxysmal events [5]. The Internal League Against Epilepsy (ILAE) recommends VEM for i) differential diagnosis for epileptic seizures, ii) characterization and classification of seizures types and epilepsy syndrome, iii) quantifying seizures, iv) intensive care unit monitoring, and v) presurgical evaluation of drug-resistant epilepsy [6].

Long-term VEM (1–6 days) has been shown to improve diagnostic accuracy compared with standard EEG (20–30 minutes) [7]. VEM not only obtains more complete information regarding the EEG background and characterization of the interictal activity but also analyzes the clinical semiology with the electrophysiological phenomenology during clinical events [8]. Moreover, during preoperative evaluation of drug-resistant temporal lobe epilepsy patients, it has been shown that no other routine tests, including imaging studies, were as reliable as VEM in identifying and characterizing epilepsy seizures and defining the epileptogenic zone in patients evaluated for epilepsy surgery [9]. Nonetheless, VEM is an expensive tool that needs sophisticated equipment, highly qualified staff, and admission of patients to the hospital during variable periods.

A highly variable range of diagnostic usefulness for VEM has been described (19%–75%), which depends first on how utility is defined and on the selection of the patients evaluated [10]. However, another factor is also involved in this issue. There is no standard protocol for the duration of VEM. In fact, some units carry out 12-hour studies, while in other units, monitoring lasts several days.

In our unit, we systematically used two protocols of VEM: 24-hour VEM for the differential diagnosis and follow-up of epilepsy patients and a longer-lasting VEM (2–10 days) for the presurgical evaluation of drug-resistant epilepsy.

The purpose of this study was to assess the diagnostic utility of VEM for the classification and differential diagnosis of epilepsy and nonepileptic paroxysmal events in a national reference unit for refractory epilepsy. We define a VEM study as useful when either a tentative diagnosis was changed or confirmed or when patient management was modified as a result of the information obtained from VEM.

Methods

Patients

We retrospectively analyzed the clinical chart and VEM records of consecutive patients who underwent inpatient VEM at the video electroencephalography (VEEG) unit of the National Reference Unit for Refractory Epilepsy at Hospital Universitario de la Princesa, over a period of three years (n = 308). Only those patients who had been referred to i) differentiate between epileptic and nonepileptic events and/or ii) to classify the kind of seizure and epilepsy syndrome type were selected. Finally, the number of patients fulfilling these conditions was 125. Those patients with known medically refractory epilepsy undergoing presurgical evaluation were excluded.

Clinical charts, including age, sex, age at symptomatology onset, duration, provisional clinical diagnosis, antiepileptic drugs (AED), brain magnetic resonance imaging (MRI), and ambulatory standard EEG, were revised. In cases where patients had undergone an ambulatory EEG and neuroimaging at institutions other than our hospital, only the reports were available, and the studies themselves were not reviewed.

The provisional diagnosis of the physician who referred the patient to the VEEG unit (pre-VEM diagnosis) was compared with the final clinical diagnostic (post-VEM diagnosis), and both diagnoses were classified into the following categories: i) epilepsy, ii) PNES, and iii) nonepileptic paroxysmal events of physiological origin, including a cardiogenic or metabolic cause or event-related to other neurological diseases (e.g., sleep disorders, movement disorders, migraine, or cognitive disturbance).

Video electroencephalography monitoring

VEM was performed using a 64-channel digital VEEG system (EMU64, NeuroWorks. XLTEK®, Oakville, Canada) with 19 scalp stainless steel electrodes fixed with collodion according to the 10–20 international system; electrocardiography (ECG) and simultaneous video images were recorded continuously for 24 h. If needed, one or two electromyography channels (EMG) were added, too. Recordings were performed at a 512 Hz sampling rate with a 0.5–70 Hz bandwidth, 50 Hz notch on. EMG bandwidth was 1.5–200 Hz, notch on, and ECG bandwidth was 1.5–30 Hz, notch on. Impedances for EEG were under 25 kW.

Patients had partial sleep deprivation, but medication withdrawal was not undertaken. If considered, induction techniques involving suggestion and administration of placebo were used in some patients [4].

To avoid biases in the assessment of VEM utility, we considered three periods chronologically: i) t1defining the putative diagnosis and treatment considered as the basal line usually performed 1–2 months before, ii) VEM (performed at tVEM), and finally, iii) the period t2that includes the first clinical interview after VEM (usually 1–2 months later). No other complementary studies were undertaken between t1 and t2; thus, we were sure that changes either in diagnosis or treatment would be due to the VEM result.

The patient’s function state (p) is defined at time t, as a two-variables function, i.e., treatment (T) and diagnosis (d), stated as pt(T,d). In this definition, t is not a variable but a parameter. Therefore, we have different possibilities of changes at consecutive periods (Figure 1), depending on either T or d or both changing between t1 and t2. VEM was considered useful when variables T, d or both changed. However, in some cases where both T and d remained the same, the study can still be considered useful if it confirms a previously suspected but not well-established diagnosis, e.g., suspected PNES with no pharmacological treatment where, after VEM, a positive result confirms PNES. In such cases, the utility derived from confirmation is written as p1(T1,d1) → p2,conf (T1,d1). In other words, only when the VEM result did not change any variable or confirm a suspected previous diagnosis (p2,not (T1,d1)) was it considered to be not useful.

AWHC-3-3-315-g001

Figure 1. Scheme used to evaluate the utility of VEM.

Additional, clinical demographics and VEM bioelectrical features for each of the three clinical diagnostic categories were also analyzed.

Statistical analysis

Statistical comparisons between groups were performed using Student’s t-test or ANOVA for data with normal distribution. Normality was evaluated using the Kolmogorov–Smirnov test. The Mann–Whitney rank sum test or ANOVA on ranks was used when normality failed. In the last case, Dunn’s method was used for all pairwise post hoc comparisons of mean ranks of treatment groups. Chi-square test (χ2) was used to assess the differences between groups of patients.

The SigmaStat 3.5 software (SigmaStat, Point Richmond, CA, USA) was used for statistical analysis. The significance level was set at p < 0.05. The results are presented as the mean ± SEM, except where otherwise indicated.

Results

Patients

A total of 125 patients were included (64% women) with a mean age of 43.0 ± 1.6 years. The mean disease duration was 8.8 ± 1.0 years. A total of 82 (66%) patients received treatment with AED at the time of the study, and the mean number of AED was 1.3 ± 0.1. Brain magnetic resonance imaging (MRI) was available in 113 patients, with abnormal findings in 57 (50%) patients; of these, only 8 patients (14%) had epileptogenic lesions. Standard EEG was performed in 92 patients, 37% of which displayed epileptiform activity, 24% was reported as abnormal nonepileptic activity, and 39% was normal.

Regarding the provisional clinical diagnosis, ES was suspected in 67 patients (54%). Nonepileptic events of physiological origin were suspected in 45 patients, accounting for syncope (30 patients), movement disorders (7 patients), cognitive impairment (3 patients), sleep disorders (1 patient), and others (4 patient). A diagnosis of PNES was suspected in 10 patients, and in three of them, it was considered that it could also coincide with the diagnosis of epilepsy.

Video electroencephalography monitoring

During VEM, typical events, described as similar to accustomed, occurred in 61 patients (49%). Of these, 21 patients (36%) had ES, 25 patients (41%) hadnonepileptic paroxysmal events of physiological origin and in 13 cases (21%), the diagnosis was PNES. One of these latter patients had ES along with PNES.

Regarding patients who did not have typical events (n = 65), we found epileptiform activity in 36 patients (37.5%) and nonepileptiform abnormalities in 20 patients (21.5%). Table 1 shows the electroencephalographic findings in all patients.

Table 1. VEM findings in patients with and without typical events. Between brackets is shown percentage

Electroencephalographicdiagnosis

ES
(N=22) *

NEE
(N=39) *

No events
(N=65)

Epileptiformactivity

21 (95%)

15 (38%)

36 (55%)

Non-epileptiformabnormalities

1(5%)

9 (23%)

10 (15%)

Encephalopathy

1 (3%)

3 (4%)

Normal

14 (36%)

17 (26%)

*Onepatientpresentedseizure + PNES

The three diagnostic categories, before and after VEM, are shown in Table 2. Patients with the double diagnosis of epilepsy and PNES have been included. As we can observe from this table, the diagnosis of epilepsy was confirmed in 41% of patients, 24% less than the initial presumptive diagnosis. Additionally, the diagnosis of PNES increased by 80% after VEM. In five patients, diagnosis of both epilepsy and PNES was made.

Table 2. Diagnostic categories before and after vEEG.(n = 125)

Diagnosis

Before VEM

After VEM

Change

Epilepsy

67 (54%)

51 (41%)

-16 (24%)

Physiologicalevents

45 (36%)

50 (40%)

+5 (11.1%)

PNES

10 (8%)

18 (14.4%)

+8 (80%)

PNES + Epilepsy

3 (2.4 %)

5 (4%)

+2 (67%)

Change is defined as After_VEM(variable)-Before_VEM(variable)

We compared the demographic characteristics between patients with final clinical diagnosis of epilepsy, events of physiological origin, and PNES (Table 3). We found that in the PNES group, women were more frequent in comparison with the other two groups. Additionally, this group had the lowest average age compared to nonepileptic events of physiological origin group. This last group had the highest mean age of onset of symptoms compared to the other two groups. It also had the shorter evolution time compared with the epilepsy group.

Table 3. Demographics and clinical comparation between diagnosis groups.

Epilepticseizures (n=51) *

Physiologicalevents
(n=50)

PNES
(n=18)

P value (MW test)

ES vs PE

ES vs PNES

PE vs PNES

Female

35 (70%)

29 (58%)

15(88%)

2.000

<0.001

<0.001

Age (yrs)

40.6 ± 2.6

48 ± 2.4

36.3±3.0

0.072**

0.265**

0.010**

Age at onset (yrs)

26.2 ± 2.9

42.5 ± 2.5

30.6±3.6

<0.001

0.471

0.025

Duration (yrs)

14.4 ± 2.1

5.8 ± 1.0

5.9±2.1

0.008

0.090

0.618

Abnormal non-epilepticEEG

5 (13%)

11 (31%)

5 (35%)

2.000

1.000

2.000

Epileptic EEG

20 (53%)

7 (20%)

4 (28%)

<0.001

<0.001

1.000

Abnormalbrain MRI

31 (59.6%)

18 (41%)

7 (46.6%)

<0.001

<0.001

<0.001

MW: Mann-Whitney test.
* The patients with diagnosis of Epilepsy and PNES (5) were excluded.
** Student-t test.

On the other hand, epileptiform activity on standard EEG was associated with the occurrence of epilepsy diagnosis compared with physiological events and PNES. Moreover, patients with epilepsy (59.6%) were more likely to have an abnormal brain MRI scan.

We assessed the overall structure for all the three groups according to sex proportion, age, age at onset, and abnormal findings in EEG. Paired comparison by groups yielded highly significant differences for ES vs. physiological events (χ2= 40.65, p < 0.001), ES vs. PNES (χ2= 37.30, p < 0.001), and physiological events vs. PNES (χ2= 38.17, p < 0.001), with 5 degrees of freedom.

Utility

We considered that VEM was useful for the clinician when the results of the study led to a change in the previous diagnosis, in treatment or both or when a suspected but not well-defined diagnosis was reinforced by the study.

According to our classification, VEM was defined as useful in 112 patients (89.6%). Specifically, treatment was changed (p2(T2,d1)) in 32 cases, diagnosis was modified in 10 patients (p2(T1,d2)), both of them were modified in 35 patients (p2(T2,d2)), and the suspected diagnosis was confirmed in 35 patients (p2,con(T1,d1)). Therefore, after VEM, the treatment was modified in 67 patients (p2(T2,d1) + p2(T2,d2)) and diagnosis changed in 45 patients (p2(T1,d2) + p2(T2,d2)).

In 10.4% of cases, the VEM results were inconclusive and could not be termed as useful.

Regarding the group of patients with a final diagnosis of epilepsy (n = 51), 44 of the patients (86.3%) were on at least one AED at the time of admission. After VEM, change in therapy was reported in 33 patients (64.7%) of the total group, among whom a new AED was introduced or the dose was increased in 26 patients (78%) and the dose was reduced in 7 patients (21%).

With respect to the group of patients with physiological events (n = 50), 21 patients (42%) had been on at least one AED at the time of the study. After VEM, the treatment was modified in 18 patients (36%) with a discontinued or decreased treatment in 15 patients (71%). There were 12 patients diagnosed with PNES who had previous AED treatment. Discontinuation of therapy was seen in 3 patients.

Discussion

We have shown that VEM is an extremely helpful tool in the diagnosis and therapeutic management of patients with paroxysmal behavioral events. Misdiagnosis and misclassification of nonepileptic paroxysmal events and ES can lead to inappropriate treatment. High costs have been incurred annually on diagnostic evaluations, inappropriate antiepileptic drugs, and emergency unit utilization [11].

In many cases, clinical information alone can be incomplete or misleading due to descriptions made by untrained witnesses. Furthermore, the correct diagnosis may not be apparent during the short period of outpatient EEG. VEM helps to correlate electroencephalographic changes with clinical events and detect epileptiform activity in long-term records, which also include a sleep period [2, 12].

VEM provided a useful yield of recorded clinical events. We have found that the 24-h VEM is able to detect typical clinical events in a 49% of cases. ES represents 36% of the cases, which is comparable to other series [13]. Most of the recorded events corresponded to nonepileptic paroxysmal events (62%), although one-third (21%) were of psychogenic origin. Thus, an accurate correlation between electroclinical findings is essential to properly characterize different paroxysmal events [10, 14]. This finding was revealed in a meta-analysis of 135 published studies on VEEG, which describe that 59% of referrals were for diagnostic reasons [15].

In this sense, PNES has a special importance. VEM is an indispensable tool because it allows simultaneous analysis of both clinical and ictal EEG findings to make the most accurate differential diagnosis between seizure and PNES [4, 16]. The results of VEM between patients with epilepsy and PNES revealed a sustained decline in AED use from discharge to follow-up [17], suggesting that VEM may contribute to a beneficial elimination of unnecessary medications in the PNES group once a definitive diagnosis is made.

It has been previously shown that in those patients with a change in diagnosis, the most common change involves distinguishing epilepsy from physiological events (68.2%) [18]. In our work, we found that VEM reduced the previous diagnosis of epilepsy in 24% of the cases. The reference physicians are more likely to misdiagnose nonepileptic events as seizures than the opposite. This finding may be due to a diagnosis that was made based on clinical history and a routine EEG that can be deceptive. Physiological paroxysmal events were more frequently misdiagnosed as PNES.

A total of 35% of patients saw their previous diagnosis change. Other authors [19] described a change in the diagnosis in 58% of patients. The higher figure could possibly be observed because these researchers’ studies were longer (1–13 days) and included patients with refractory epilepsy and who were gradually tapering AED. However, recent studies indicate that the VEEG clarifies diagnosis in 56.3% of patients and changes the diagnosis in 35.6% of patients [15, 20]. We have shown that VEM was useful in establishing or shaping the diagnosis in 112 patients (89%). This technique helped to confirm the reference diagnosis with certainty, classify patients with ES, and select the best treatment according to each diagnosis of either epilepsy or nonepileptic events. The high diagnostic yield of VEM in adult patients with recurrent and unprovoked events has been confirmed previously [21-23]; however, the diagnostic usefulness is widely variable (19%–75%) due to a variation in the definition of utility [10].

We found in the PNES group that women were more frequent in comparison to the other two groups. They were also younger at the time of the study and had a younger age of onset of events compared to those experiencing physiological events. We found a longer disease duration in epilepsy patients, as has been previously described [24], showing a delay in diagnostic confirmation. On the other hand, physiological event patients were older at the onset of symptoms compared to the PNES group, which is probably related to the etiology [25]. It is quite interesting to observe that all three groups are really different. This fact can help to establish a predictive model based on electroclinical findings to help the clinician to classify a patient in daily practice.

We had a final diagnosis of event of physiological origin in 40% of our patients and of PNES in 14% of the cases (see table 3). It is important to highlight that in both these groups, we found epileptiform activity in 20% and 28% of cases, respectively, and in both, ≥30% of abnormal nonepileptic activity. There are some studies describing between 17% and 26% of patients eventually being diagnosed with nonepileptic events who had interictalepileptiform discharges (IEDs) recorded during VEEG [26, 27]. Similar findings were caused by overreading a standard EEG as abnormal [27-30]. In a study that analyzed the significance of epileptiform abnormalities in patients without epilepsy, the researchers found that of 521 patients with a follow-up of 230 person-years with no history of unprovoked seizures, 64 (12.3%) had IEDs on their EEG. These patients had associated structural neurological conditions (e.g., tumors and vascular disorders), which would explain the 20% of epileptiform abnormalities found in our patients with physiological events.

VEM also helped to determine the best treatment for the individual patient based on the type of witnessed events and the electrographic characteristics in VEM. This finding caused a treatment change in 50% of patients. Moreover, the largest change was seen in the group of patients diagnosed with epilepsy. This finding shows the value of VEM when it comes to influencing the overall care pathway of patients. Optimization of AED may result in avoiding drug adverse events, a better quality of life, and reduction in health costs [31]. In our results, the discontinuation of AED treatment in PNES was low for what we might have expected. The reasons can be different, but it is essential to mention that some clinical physicians often analyze VEM results in an imprecise way for the diagnosis of PNES [32], even though VEM is the gold standard for diagnosis of PNES [4].

Despite being considered an expensive technique with limited availability (a neurophysiologist is needed with healthcare staff and specialized technical equipment) [33], VEM has been demonstrated to be a useful test with robust therapeutic benefits. There are recent recommendations and algorithms based on high-level evidence for the use of VEM for the diagnosis and monitoring of patients with epilepsy [34]. Conversely, the financial and social cost of unclassifiable behavioral disturbances to the patient and the family is considerable, and poorly controlled ES has been associated with impaired psychosocial skills and an increased risk of death [35]. Therefore, in the absence of a study that compares the cost–benefit of VEM and the economic and social cost of chronic uncontrolled seizures (epileptic or nonepileptic), it seems logical to consider that VEM should be a mandatory tool in the differential diagnosis of ES.

Acknowledgement

This work was financed by a grant from the Ministerio de Sanidad FIS PI17/02193 and was partially supported by FEDER (FondsEuropeen de DeveloppementEconomiqueet Regional).

References

  1. Tatum WO, Rubboli G, Kaplan PW,Mirsatari SM, Radhakrishnan K et al. (2018) Clinical utility of EEG in diagnosing an monitoring epilepsy in adults. ClinNeurophysiol 129:1056-1082. [crossref]
  2. Fisher RS, Acevedo C, Arzimanoglou A, Bogacz A, Cross JH et al. (2014) ILAE official report: a practical clinical definition of epilepsy. Epilepsia 55:475-82. [crossref]
  3. Krumholz A (1999) Nonepileptic seizures: diagnosis and management. Neurology 53: 76-83.[crossref]
  4. Vega-Zelaya L, Alvarez M, Ezquiaga E, et al. (2014) Psychogenic Non-Epileptic Seizures in a Surgical Epilepsy Unit: Experience and a Comprehensive Review. Epilepsy Topics. Prof. Mark Holmes (Ed.)InTech.
  5. Cuthill FM, Espie CA (2005) Sensitivity and specificity of procedures for the differential diagnosis of epileptic and non-epileptic seizures: a systematic review. Seizure14:293-303.[crossref]
  6. Velis D, Plouin P, Gotman J, et al. (2007) Recommendations regarding the requirements and applications for long-term recordings in epilepsy. Epilepsia48:379-384.[crossref]
  7. Park KI, Lee SK, Chu K, Jung Ju Lee, Dong Wook Kimet al. (2009) The value of video-EEG monitoring to diagnose juvenile myoclonic epilepsy. Seizure18:94-99.[crossref]
  8. Delgado Nunes V, Sawyer L, Neilson J, GrammatiSarri, J Helen Crosset al. (2012) Diagnosis and management of the epilepsies in adults and children: summary of updated NICE guidelines. Br Med J 344: 281.[crossref]
  9. Pastor J, Ortega GJ, Herrera-Peco I,Marta Navas-García, Eduardo G Navarrete et al. (2010) Differential contribution of preoperatory studies to diagnosis in temporal lobe epilepsy surgery. Rev Neurol51:393-402.[crossref]
  10. Alving J, Beniczky S (2009) Diagnostic usefulness and duration of the inpatient long-term video-EEG monitoring: findings in patients extensively investigated before the monitoring. Seizure18:470-473.[crossref]
  11. Koblar, SA, Black, AB and Schapel, GJ (1992) Video-audio/EEG monitoring in epilepsy—The Queen Elizabeth Hospital Experience. Clinical and Experimental Neurology29:70-73. [crossref]
  12. Pastor J (2011) Vídeo-electroencefalografía de scalp. En: Neurocirugía Funcional y Estereotáxica. Eds: E.G. Navarrete y R. G. Sola. Viguera Editores Barcelona; pp: 109-120.
  13. McGonigal A, Russell AJC, Mallik AK, M Oto, R Duncanet al. (2004) Use of short term video EEG in the diagnosis of attack disorders.  J NeurolNeurosurg Psychiatry75:771-772.[crossref]
  14. Lawley A, Manfredonia F, Cavanna AE (2016) Video-ambulatory EEG in a secondary care center: A retrospective evaluation of utility in the diagnosis of epileptic and nonepileptic seizures. Epilepsy & Behavior57: 137-140.[crossref]
  15. Sauro KM, Wiebe N, Macrodimitris S, Wiebe S, Lukmanji S et al. (2016) Quality and safety in adult epilepsy monitoring units: A systematic review and meta-analysis. Epilepsia57:1754-1770.[crossref]
  16. Gallego I, Ezquiaga E, Betancor D, et al. (2011) Psychogenic non-epileptic seizures in an epilepsy surgery unit. Rev Neurol52:449-446.[crossref]
  17. Zhang YC, Bromfield EB, Hurwitz S, Aaron Nelson, Kristen Sylviaet al. (2009) Comparison of outcomes of video/EEG monitoring between patients with epileptic seizures and those with psychogenic nonepileptic seizures. Epilepsy Behav15:303-307.[crossref]
  18. Yogarajah M, Powell HWR, Heaney D, et al. (2009) Medium term monitoring in refractory epilepsy: the Gowers Unit experience. J NeurolNeurosurg Psychiatry80:305-311.
  19. Ghougassian DF, d’Souza W, Cook MJ, Terence J O’Brien(2004) Evaluating the utility of inpatient video-EEG monitoring. Epilepsia45:928-932.[crossref]
  20. Sauro KM, Macrodimitris S, Krassman C, et al. (2014) Epilepsy Monitoring Unit Quality Improvement Team. Quality indicators in an epilepsy monitoring unit. Epilepsy Behav33:7-11.
  21. Alsaadi TM, Thieman C, Shatzel A, Sarah Farias(2004) Video-EEG telemetry can be a crucial tool for neurologists experienced in epilepsy when diagnosing seizure disorders. Seizure13:32-34.[crossref]
  22. Lee Y, Lee M, Chen I, Yu-TaiTsai, Chung-Yang Sunget al. (2009) Long-term Video-EEG Monitoring for Paroxysmal Events. Chang Gung Med J32:305-312.[crossref]
  23. Mohan KK, Markand ON, Salanova V (1996) Diagnostic utility of video EEG monitoring in paroxysmal events. ActaNeurolScand94:320-325.[crossref]
  24. Foong M, Seneviratne U (2016) Optimal duration of video-electroencephalographic monitoring to capture seizures. J ClinNeurosci28:55-60. [crossref]
  25. Mari F, Di Bonaventura C, Vanacore N, JinaneFattouch, Anna ElisabettaVaudanoet al. (2006) Video-EEG study of psychogenic nonepileptic seizures: Differential characteristics in patients with and without epilepsy. Epilepsia5:64-67.[crossref]
  26. McBride AE, Shih TT, Hirsch LJ (2002) Video-EEG monitoring in the elderly: a review of 94 patients. Epilepsia43:165-169.[crossref]
  27. Friedman DE, Hirsch LJ (2009) How long does it take to make an accurate diagnosis in an epilepsy monitoring unit? J ClinNeurophysiol26:213-217.[crossref]
  28. Benbadis SR, Tatum WO (2003) Overintepretation of EEGs and misdiagnosis of epilepsy. J ClinNeurophysiol20:42-44. [crossref]
  29. Benbadis SR (2013) “Just like EKGs!” Should EEGs undergo a confirmatory interpretation by a clinical neurophysiologist? Neurology 80: 47-51.[crossref]
  30. Benbadis SR (2007) Errors in EEGs and the misdiagnosis of epilepsy: importance, causes, consequences, and proposed remedies. Epilepsy Behav11:257-2562.[crossref]
  31. Manfredonia F, Lawley A, Cavanna AE (2016) Impact of video-ambulatory electroencephalography on the medical management of epilepsy. J NeurolSci365:139-1342.[crossref]
  32. Harden CL, Burgut FT, Kanner AM (2003) The diagnostic significance of video-EEG monitoring findings on pseudoseizure patients differs between neurologists and psychiatrists. Epilepsia44:453-456.[crossref]
  33. Parnell KJ, Cascino GD, So EL, et al. (1999) Long-term EEG monitoring in patients with spells: clinical characteristics and predictive factors. Neurology 52: 371-372.
  34. Cho YW, Motamedi GK, Kim KT (2019) The clinical utility of non-invasive video-electroencephalographic monitoring has been diversifying. NeurolSci 40:2625-2631. [crossref]
  35. Morrel MJ, Pedley TA (2000) “The Scarlet E”: epilepsy is still a burden. Neurology54:1882-1883.[crossref]