Archives

Impact of Drug-Based Treatment for Osteoporosis on Pain and Parameters of Physical Fitness – A Clinical Pilot Study

DOI: 10.31038/IJOT.2019235

Abstract

Background: The origin of osteoporosis is attributed to several factors and its prevalence is on the increase. It is one of the principal causes of fractures, morbidity, and chronic pain. Muscle and coordination exercises may help to improve physical performance in everyday life, alleviate pain, and prevent falls. On the other hand, the effect of targeted drug therapy on these parameters is not known yet.

Methods: Twenty-five patients with osteoporosis were observed prospectively for 18 months. During this time the patients received targeted drug therapy for the disease. The results of treatment (pre/post) in regard of parameters of physical fitness and pain were analysed.

Results: No changes were noted in respect of torso strength, mobility, and coordination (p>0.05). The patients’ body height was reduced to a significant extent (p<0.001), their hand grip strength on the right side was significantly reduced (p=0.006), and their pain levels were significantly reduced (p=0.001). Factors influencing the success of treatment were body weight, height, the administration of teriparatide, and sports.

Conclusions: While pain can be influenced by medication for the treatment of osteoporosis, no effect or even a decline was noted in parameters of physical fitness.

Keywords

Hand grip strength, mobility, osteoporosis, torso strength, pain treatment

Introduction

Osteoporosis is a systemic disease of bone, marked by reduced bone mass and a disrupted microarchitecture of bone. The result is a greater propensity for fractures and the frequent occurrence of fractures. The latter are associated with pain, limited mobility and quality of life, as well as greater morbidity and mortality [1]. Furthermore, the patient experiences a loss of conditional resources such as muscle strength, endurance, and coordination.

A number of therapy options in terms of drugs and physiotherapy are available for the treatment of this disease. Regular physical exercise alleviates pain, prevents falls, and improves mobility and quality of life [2–4]. Specific medications for osteoporosis, such as bisphosphonates, reduce fracture rates by adhering firmly to bone surfaces and inhibiting the enzyme known as farnesyl pyrophosphate synthase, which is needed in osteoclasts for the formation of the cytoskeleton [5,6]. Monoclonal antibodies also contribute significantly to reducing the risk of fractures [7]. The impact of long-term specific drug therapy on the development of motor and coordination skills in the course of the disease has been poorly investigated so far. Especially pain caused by osteoporosis is of paramount importance for many patients. Alleviating such pain by drug therapy would be subjectively interpreted as successful treatment and an improvement in quality of life for many patients; this was the subject of the current prospective study.

Material and Methods

The aim of the present study is to evaluate the impact of targeted drug therapy on parameters of physical fitness and pain experienced by patients with osteoporosis. Statements about the factors influencing the success of treatment will also be evaluated.

Study Design and Recruitment

We conducted a prospective single-centre clinical investigation of a treatment group. All probands were informed in detail about the methods, purposes, and risks of the study protocol. Furthermore, they were handed out a copy of their written informed consent. The probands were recruited during the outpatient consultation hours for osteoporosis at the Südstadt Klinikum in Rostock. The recruitment of patients takes 2 years. This made it difficult to predict the required number of patients with regard to the significance of the clinical examination.

Inclusion and Exclusion Criteria

Inclusion criteria for the clinical study were the presence of proven osteoporosis requiring treatment in patients with pathological bone densitometry values and the availability of X-rays of the thoracic and lumbar spine. At the start of the study, all patients underwent a physical investigation to determine their orthopaedic status, which included the Chair-Rising test (CR test), walking speed (WS), Tandem Stand (TS), Tandem Gait (TG), Hand Grip Strength (HGS), and a guideline-oriented laboratory screening.

Exclusion criteria were all forms of severe heart failure, uncontrolled hypertension, relevant neurological deficits, vestibulopathy, and the need for external care.

Clinical Tests

Short Physical Performance Battery (SPPB)

It consists of three tests: tandem stand, walking for 4 meters, and the CR test [8,9]. For each task the patient may achieve a maximum of 4 points. The scores of the three tests are then added. A person may achieve a minimum score of 0 and a maximum score of 12 points. We used the SPPB to measure the function of the lower extremities when performing tasks similar to the activities of daily living. Based on the total score, one can estimate how severely the patient is limited in his/her daily life. Patients with a final score of 0 to 3 points are strongly impaired, especially when walking a few hundred meters, ascending stairs, and in self-care [10,8]. Patients with a final score of 4 to 6 points are moderately impaired, and those with a score from 7 to 9 points are mildly impaired. A patient who achieves a score of 10 to 12 points is minimally impaired or not impaired in his/her daily life.

The patient’s balance and coordination were tested with the aid of the tandem stand. Three positions were retained for 10 seconds each: standing with closed feet, semi-tandem stand (the heel of one foot is at the mid-portion of the inside of the other foot), and tandem stand (one foot behind the other). The patient is free to decide which foot is placed in the front.

The walking test measures the time taken to walk 4 meters at normal speed. This task combines the patient’s strength and coordination in walking and is therefore a good parameter to assess physical performance capacity [11]. The threshold value for limited mobility is a walking speed of ≤0.8 meters per second [12].

The CR test measures five consecutive cycles of standing up from, and sitting on a chair without armrests, with the patient’s arms folded across his/her chest. In general the SPPB is a frequently used instrument that has proved its value not only for the identification and description of probands at the disabled end of the functional spectrum, but also for non-disabled elderly persons [9].

The results constitute a part of the SPPB on the one hand, and provide information about a normal or elevated risk of falls on the other: a score ≤10 s is normal, whereas a score >10 s signifies an elevated risk of falling [13].

Figure 1 (Figure 1) shows an example of the CR test (a), the TS (b), and the test of WS (c).

IJOT 19 - 120_Guido Schröder_F1

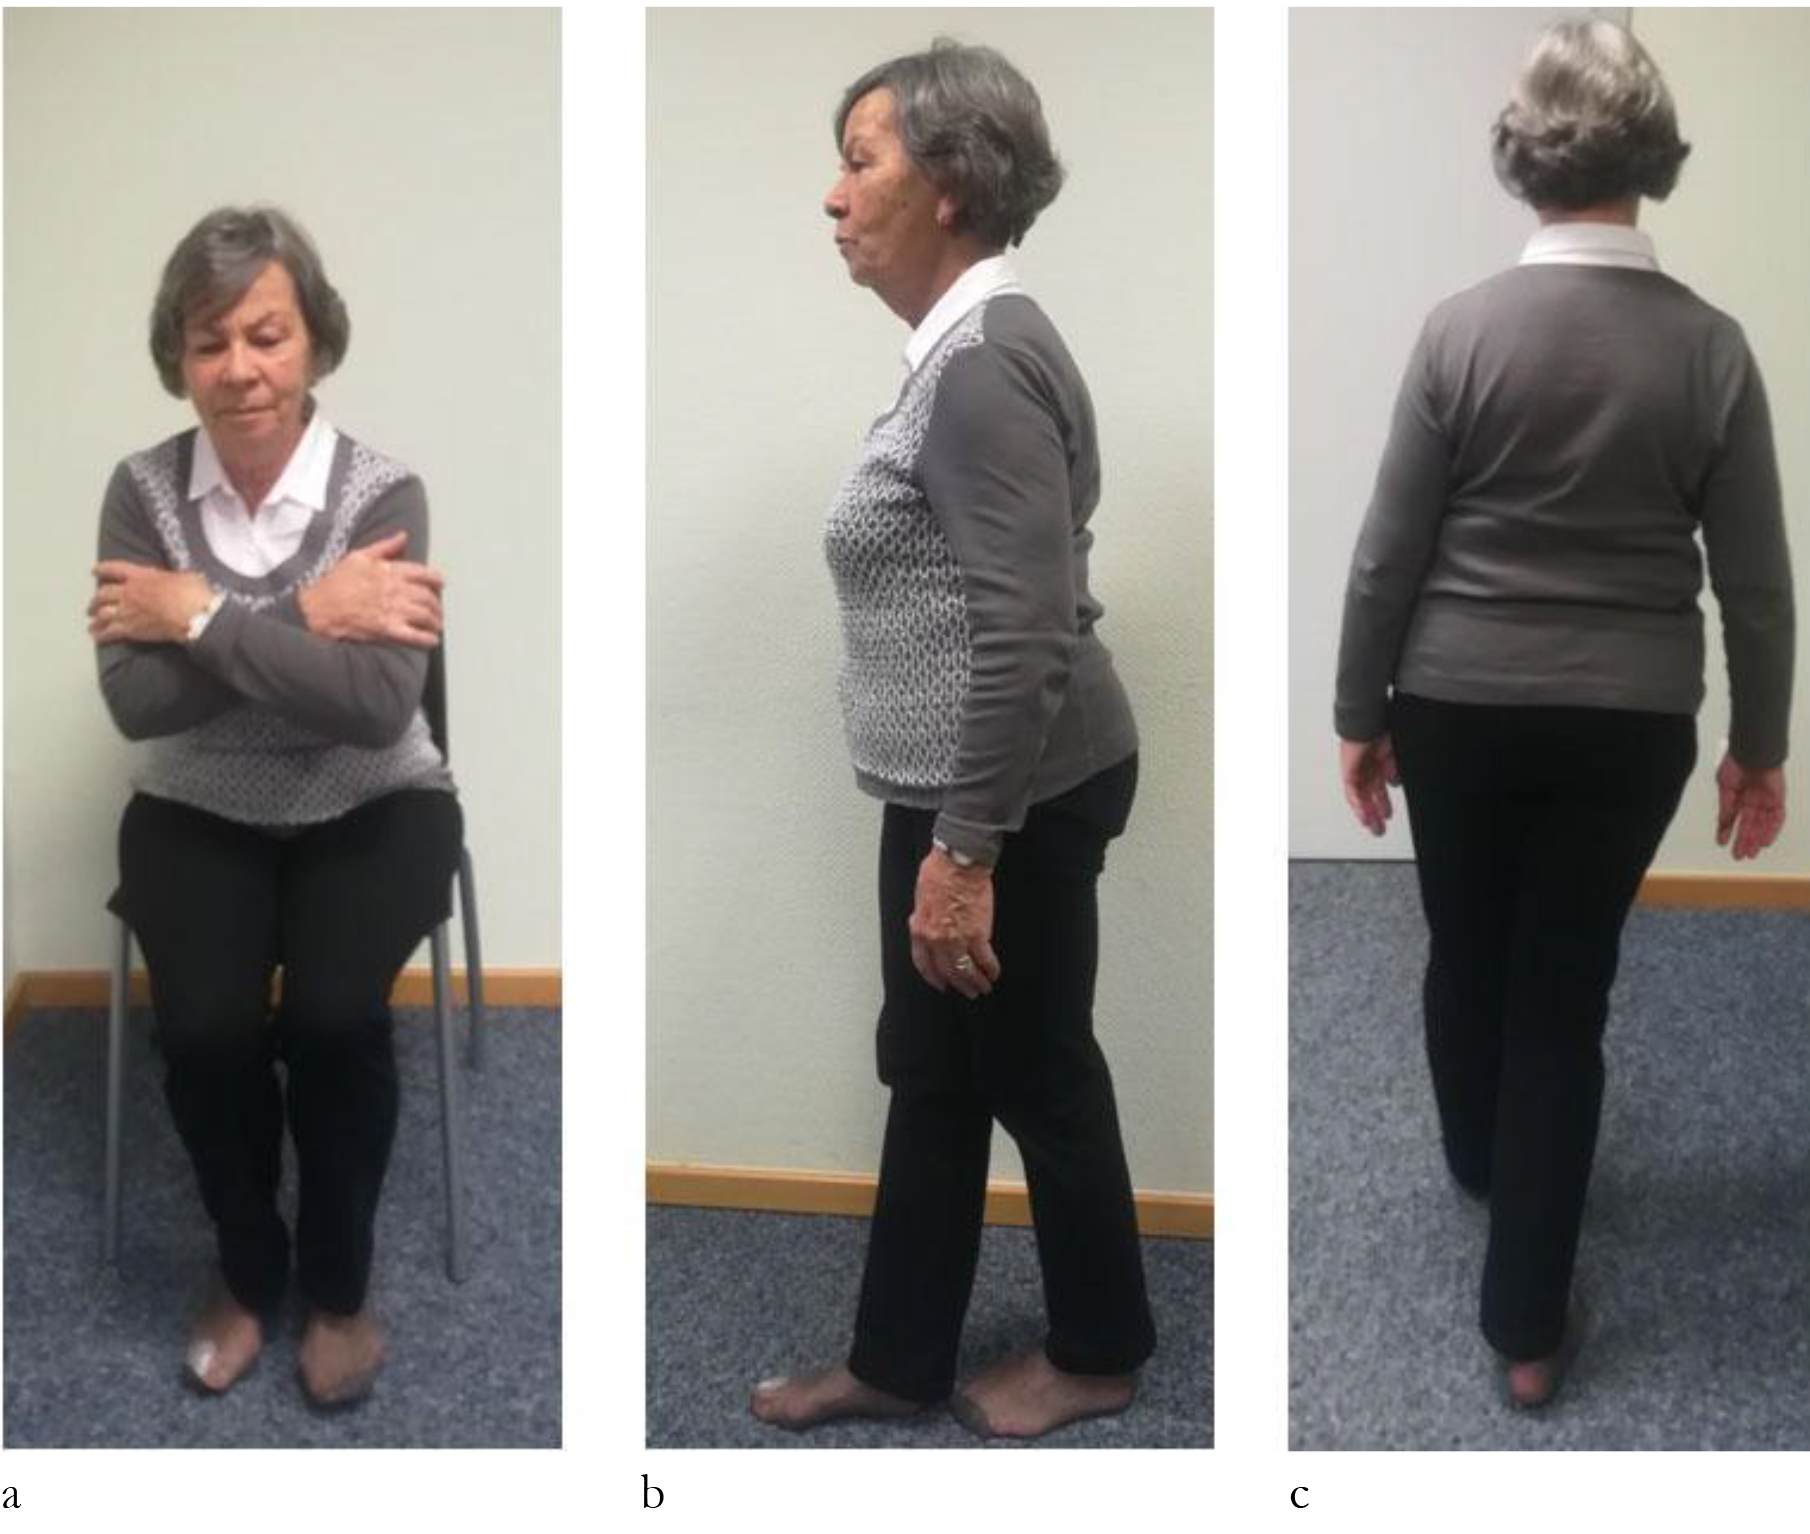
Figure 1. Exemplary tests of strength, coordination and mobility
CR test (a), TS (b), WS (c)

Hand Grip Strength (HGS)

In addition to the SPPB we measured HGS in kilograms (kg) with a traditional hand grip strength dynamometer. A score of <27 kg is considered to indicate limited physical capacity for men, while the cut-off value for women is 16 kg [12]. The HGS is an efficient and simple method to test overall strength in elderly persons, and has a high and independent predictive power in regard of functional limitations and disabilities [14,15].

Tandem Gait (TG)

TG: The patient is asked to walk 8 steps in a straight line. The outcome provides additional information about the risk of falling, to the extent that 8 walked steps are considered synonymous with a halved risk of falling in a comparison of age [13].

Pain

In the present clinical trial we used the Numerical Rating Scale (NRS). The latter is a unidimensional pain scale with 11 grades, with 0 indicating no pain and 10 the most severe imaginable pain. The probands selected the grade that described their perception of pain. The advantages of the NRS are the low error rate of its results and its high acceptance by test persons [16].

Non-Pharmacological Treatment for Osteoporosis

Calcium

Many postmenopausal women consume too little calcium. Supplementation is therefore useful, also to reduce fracture rates [17]. In the present investigation we tried to achieve a calcium supplementation level of 800 mg daily in order to achieve optimum absorption. After an initial laboratory investigation of retention parameters the patients were given nutritional counselling and advised to consume natural sources of calcium such as milk and cheese instead of food supplements (500 mg). The latter was only used in cases of marked deficiency, because the undesirable gastrointestinal effects of taking calcium could reduce the patients’ compliance. Furthermore, it has been found that higher doses of calcium may cause kidney stones or myocardial infarction [18].

Cholecalciferol

The probands were advised to take 20000 IU of vitamin D3 every week. The aim of the treatment was to achieve a serum 25-hydroxyvitamin-D level above 55 nmol/l.

Additionally all probands were given information about a balanced diet with a protein content of 1 g/kg daily [5].

Pharmacological Treatment for Osteoporosis

Bisphosphonates

A variety of bisphosphonates are currently approved for the treatment of postmenopausal osteoporosis. We used the following substances among others:

  • Alendronate 10 mg daily or 70 mg weekly taken orally; men with osteoporosis were given 10 mg daily.
  • Zolendronate 5 mg intravenously once every year in postmenopausal women and men with an elevated risk of fractures, including those with a recent fracture due to mild trauma, and for the treatment of osteoporosis in association with long-term systemic glucocorticoid therapy in both genders.
  • Ibandronate 150 mg a month taken orally, or 3 mg as an intravenous injection every 3 months in postmenopausal women with an elevated risk of fractures [19].

Denosumab

This is a monoclonal antibody against the receptor activator of the nuclear factor-kappa B ligand (RANKL), an important regulator of the development and activity of osteoclasts. It is also approved for the treatment of postmenopausal osteoporosis and for men with an elevated risk of fractures. In the present study denosumab was administered – in persons with the appropriate indication – as a subcutaneous injection at a dose of 60 mg every 6 months [19].

Teriparatide

Several cell pathways in the osteoblast are activated by teriparatide, which in turn leads to greater osteoblast recruitment [5]. In patients with an appropriate indication, teriparatide was administered at a dose of 20 to 40 mg daily.

Strontiumranelate

The distrontium saltknown as strontiumranelateconsists of two atoms of stable strontium and the organic portion, which is ranelic acid. It improves osteoblastic cell replication and enhances collagen synthesis. Simultaneously it reduces the differentiation of osteoclasts and the bone resorption activity of mature osteoclasts in vitro [20]. In patients with the appropriate indication it was given at a dose of 2 g daily.

Testosterone

Hypogonadism is the most frequent cause of osteoporosis in men. In this setting it may be useful to administer the male sexual hormone testosterone as a gel.

Statistics

The collected data were analysed using the statistical software packet SPSS, Version 23.0 (SPSS Inc., Chicago, USA). In a first step we performed a descriptive evaluation. The quantitative characteristics were described using means [MW], Standard Deviation (SD), minimum and maximum values, and the number of available observations; these were shown with the interval of means ± standard deviation. For the qualitative characteristics we mentioned absolute and percentage frequencies of the individual grades of severity.

Depending on the result of the Shapiro-Wilk tests on normal distribution, we used the dependent t-test to evaluate changes in the respective parameters between the various time points of measurement, and Wilcoxon’s rank sum test. To test qualitative characteristics and analyse categorical frequencies we used the Chi2 test. We then calculated the effect size from the quotient of the test value (z) and the square root of the number of probands (n). A resulting value below 0.3 was rated as a weak effect, a value between 0.3 and 0.5 as a moderately strong effect, and a value higher than 0.5 as a strong effect. The effect size of Cohen’s D was determined from the quotient of the mean value difference and the standard deviation (SD). A resulting value from 0.2 onward was rated weak, a value from 0.5 onward as moderate, and a value beyond 0.8 as a strong effect.

All p-values are the result of two-sided statistical tests; the level of significance was set to p≤0.05.

Results

Probands and Baseline Characteristics of the Study Population

Twenty-five patients with osteoporosis participated in the clinical trial. The patients’ age at the start of the investigation was between 48 and 78 years (65.0 ± 8.3). Twenty-three of 25 probands (92 %) concluded the clinical investigation. NRS values could not be determined for two patients because of the absence of appropriate documentation. Table 1 summarizes the baseline characteristics of the study population.

Table 1. Baseline characteristics of the study population (n = 25)

General medical history

M ± SD (Min-Max)

Gender m/f

3/22

Age (years)

65.0 ± 8.3 (48 – 78)

Height (cm)

167.2 ± 7.7 (154 – 181)

Weight (kg)

66.4 ± 11.6 (48 – 95)

BMI (kg/m2)

23.7 ± 3.4 (18.7 – 33.3)

Bone density (SD)

-2.7 ± 0.9

Fractures yes/no (%)

  • Central (%)
  • Peripheral (%)
  • Both (%)

76/24

60

4

12

School education 12 years/< 12 years (%)

24/76

Smokers / Non-smokers (%)

28/72

Drugs for osteoporosis

Bisphosphonates (%)

Monoclonal antibodies (%)

Recombinant human parathyroid hormone fragment (%)

Strontiumranelate (%)

Cholecalciferol (%)

Calcidiol (%)

Calcium 500mg (%)

68

16

8

4

72

4

4

Food rich in calcium prior to nutritional counselling

yes/no (%)

16/84

History of pain

Back pain yes/no (%)

88/12

Frequency of pain

  • Daily (%)
  • Occasionally (%)
  • Never (%)

28

60

12

Intensity of pain

  • NRS 0–10(n=23)

4.4 ± 2.9 (0 – 9)

Type of pain

  • Burning (%)
  • Stabbing (%)
  • Dull (%)
  • Different types (%)
  • No pain (%)

8

12

56

12

12

Location

  • Cervical spine (%)
  • Thoracic spine (%)
  • Lumbar spine (%)
  • Entire spine (%)
  • No pain (%)

0

4

56

28

12

Time of maximum pain

  • Morning (%)
  • Noon (%)
  • Evening (%)
  • Night (%)
  • Whole day (%)
  • No pain (%)

12

4

32

8

32

12

Regular use of analgesics yes/no (%)

28/72

Musculoskeletal diseases

  • Rheumatic disease (%)
  • Orthopae dicdisease (%)
  • None (%)

20

32

48

Work situation

  • Labourer (%)
  • Seeking employment/work (%)
  • Pensioner (%)

28

0

72

Activities that challenge the back muscles yes/no (%)

32/68

Activity profile

  • Sedentary (%)
  • Standing (%)
  • Mixed (%)

32

8

60

Sports yes/no (%)

76/24

Data presented as means ± SD and percentages

Height, Body Weight, BMI

The patients’ height at the time point T0 was on average 167.2 ± 7.7 cm. In the observation period we registered a mean value of 164.5 ± 8.1 cm, which amounted to a highly significant difference (p<0.001) between the two time points. The change in the patients’ BMI was also very significant (p=0.008). On the other hand, weight did not differ significantly between T0 und T1 (p>0.05).

CR test

With regard to the CR test, at the start of the investigation we noted a mean value of 9.7 ± 2.3 seconds. After the conclusion of treatment there was a statistical trend in terms of a deterioration of torso strength (10.7 ± 2.7 s, p=0.086).

Walking Speed

WS at the time point T0 was on average 0.9 ± 0.1 m/s. At T1 the mean value was 0.9 ± 0.2 m/s. The pairwise comparison of means revealed no significant difference (p=0.573).

Table 2 provides an overview of the above mentioned parameters.

Table 2. Results of parametric tests as percentage changes (n=25)

Parameter

Observation period vs. Baseline

p-value

Effect size, Cohens d

Height

-1.6 ± 1.8

<0.001

0.869***

Weight

0.9 ± 6.0

0.616

——-

BMI

4.1 ± 7.3

0.008

0.579**

Chair-rising test

12.3 ± 27.1

0.086

——-

Walking test

3.7 ± 21.2

0.573

——-

Data presented as means ± SD, t test against 0, *weak, **moderate, ***strong

Hand Grip Strength

HGS on the right side was reduced after drug therapy from 29.6 ± 9.9 kg to 27.2 ± 8.6 kg; the difference was highly significant (p=0.006). On the left side there was no significant difference (p>0.05). On the left side HGS was 28.0 ± 9.8 kg at the start of treatment and then reduced to 26.5 ± 8.4 kg.

Figure 2 shows the relative changes in the CR test, WS, and HGS.

IJOT 19 - 120_Guido Schröder_F2

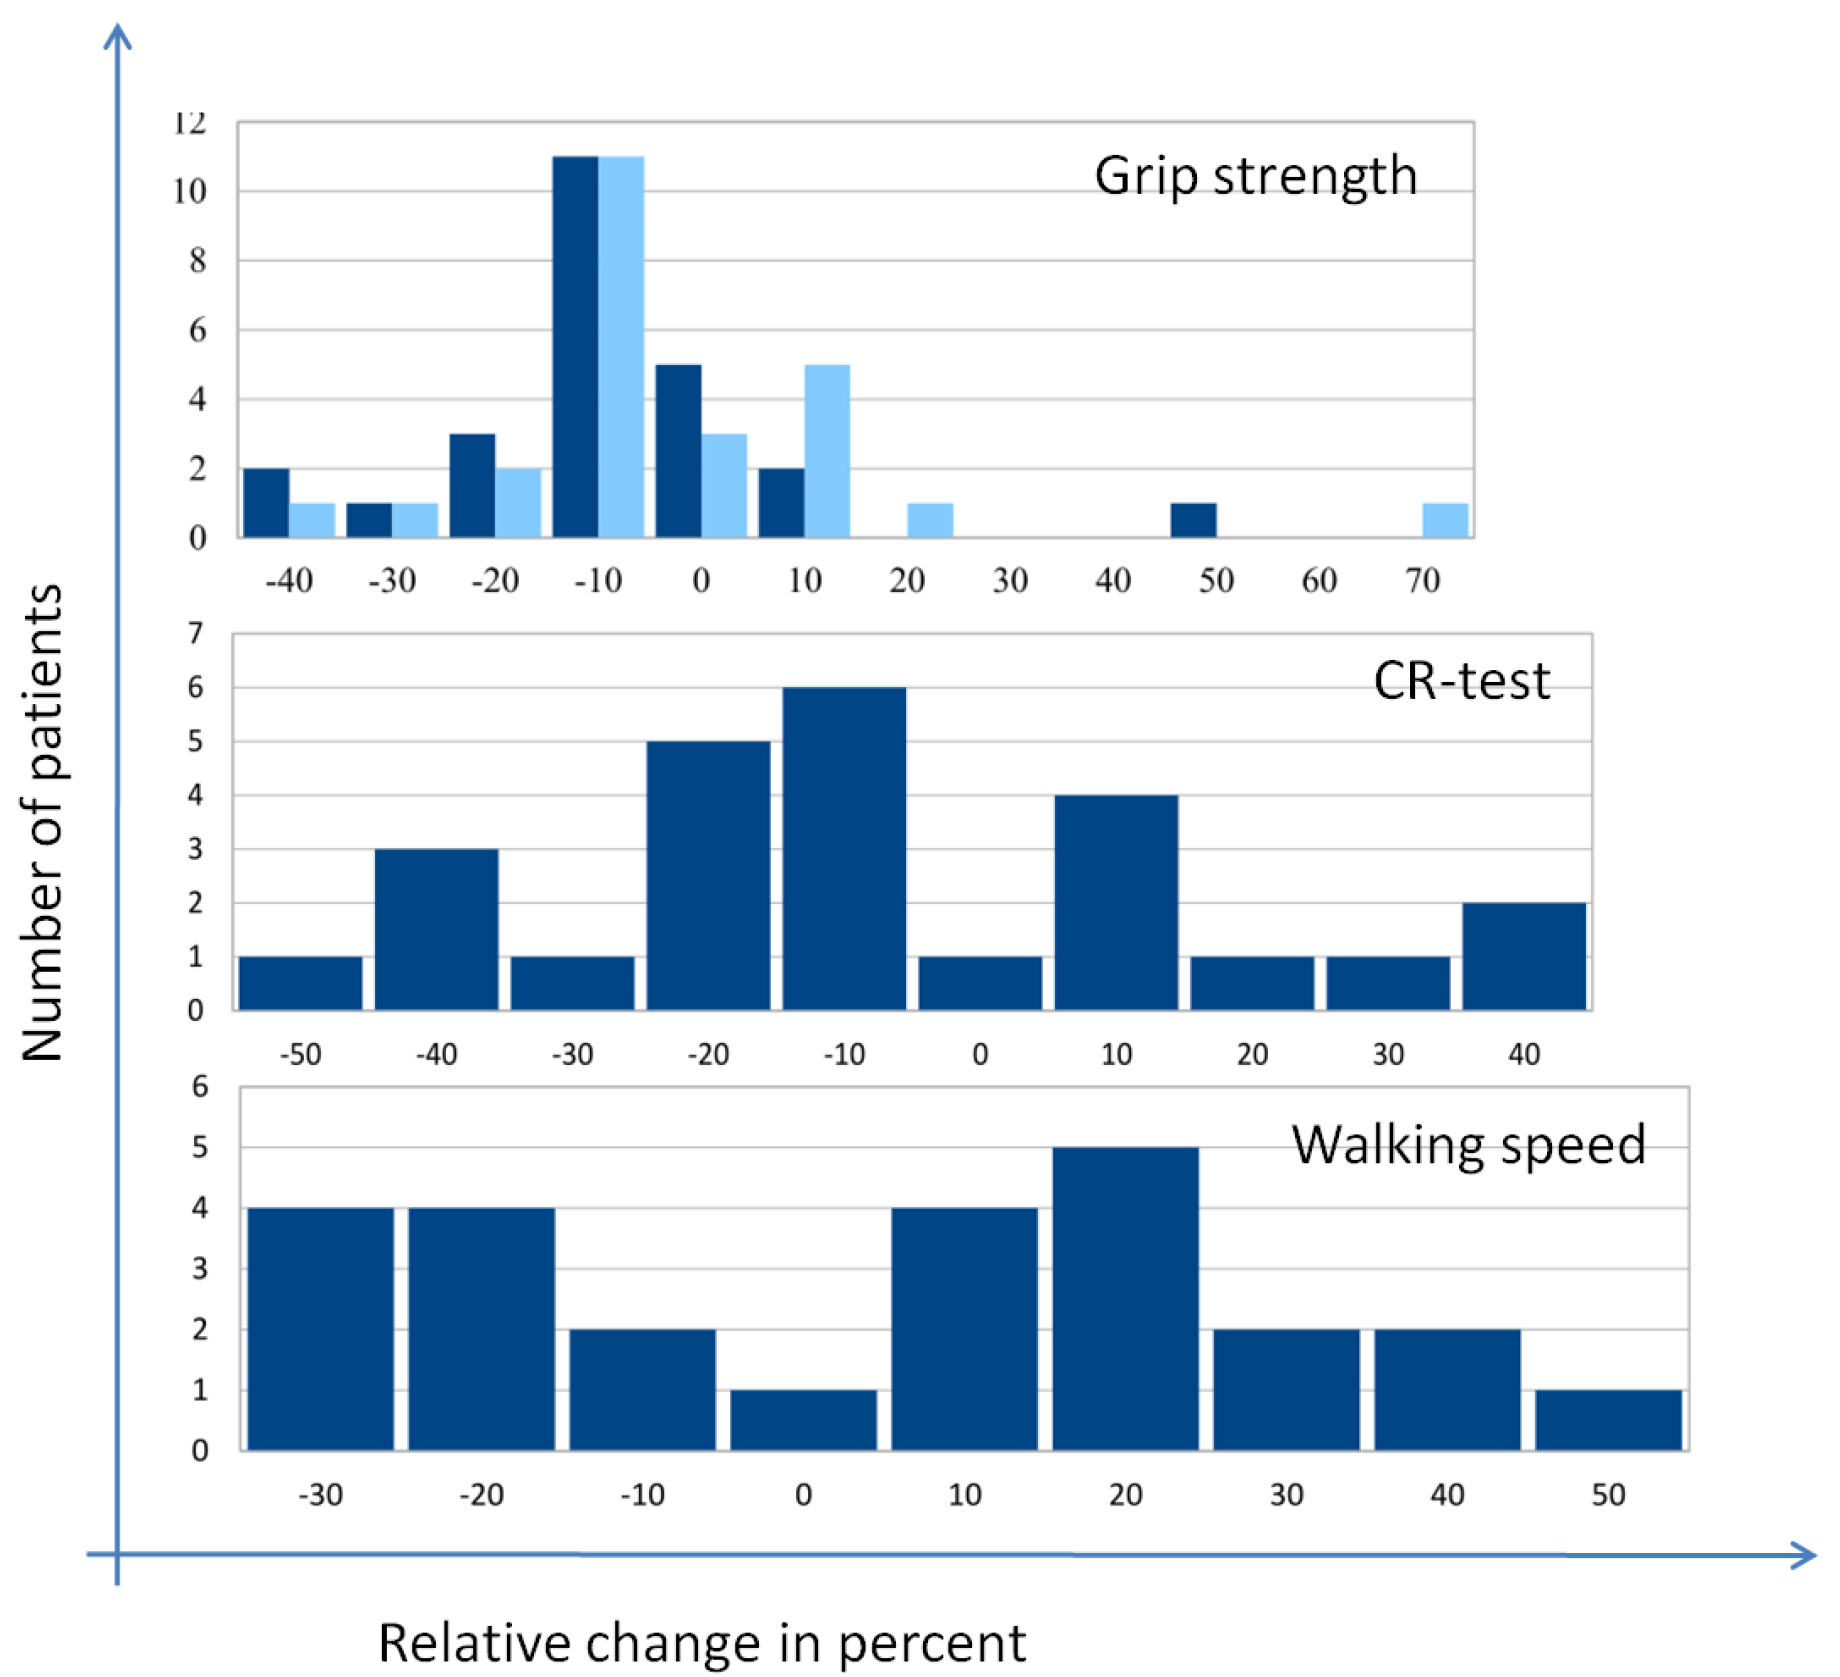
Figure 2. Relative changes in selected parameters of strength and mobility

Tandem Gait

On tandem gait the patients were able to walk a minimum of 4 steps and a maximum of 8 steps at the start of treatment. At time point T1 we observed no significant difference in this regard (p>0.05).

SPPB

The SPPB values were between 8 and 11 points at the start of the investigation, and 10.2 ± 1.0 points on average. A comparison of values at the start of the investigation (T0) and after 18 months of drug treatment for osteoporosis (T1) revealed no significant difference (10.2 ± 1.0 points, p=0.776).

Pain

Sixty percent of the study participants said they had occasional pain and 28% had pain every day. The intensity of pain was moderate (NRS 4.4 ± 2.9) at the start of the investigation. Pain was primarily described as dulland was mainly experienced in the lumbar spine. Thirty-two percent of patients had persistent pain throughout the day or in the evening. Twenty-eight percent of the patients used painkillers of the WHO category I regularly while 8% used NSAID. Four percent of patients used phytopharmaceuticals or painkillers of the WHO category II, and 12% used a combination of treatments. After 18 months of drug treatment for osteoporosis the patients’ pain levels on the NRS were reduced on average to 2.6 ± 2.0 points; the result was highly significant (p=0.001), and the effect was strong (r=0.508).

Table 3 provides a summary of the results in regard of the above mentioned parameters.

Table 3. Results of the non-parametricsigned rank test (n=25)

Parameter

p-valueƟ

Effect size, r

Hand grip strength on the right side

0.006

0.391***

Hand grip strength on the left side

0.136

——-

Tandem gait

0.443

——-

SPPB

0.776

——-

NRS (n=23)

0.001

0.508***

ƟWilcoxon test, *weak, **moderate, ***strong

Success of Treatment

We rated the success of treatment (SOT) on a numerical rating scale from 0 to 10. An improvement by at least 2 points on the NRS was rated as successful treatment. Eight patients concluded the treatment successfully, whereas 15 patients experienced no success of treatment (NTS). We also determined the corresponding factors that influenced the success of treatment.

The two groups differed very significantly in terms of body weight at the start of the investigation [57.4 ± 6.8 kg (SOT) vs. 70.3 ± 11.2 kg (NTS), p=0.007], and still differed significantly after the intervention [59.6 ± 9.0 kg (SOT) vs. 69.3 ± 10.0 kg (NTS), p=0.033]. With regard to height, a statistically significant difference was noted between the two groups [161.9 ± 6.8 cm (SOT) vs. 169.0 ± 6.6 cm (NTS), p=0.023], which remained significant in the observation period [158.8 ±  4.4 cm (SOT) vs. 166.5 ± 7.9 cm (NTS), p=0.019]. With regard to BMI, at baseline the difference between the two groups revealed a trend towards significance (p=0.073), which was no longer present after the conclusion of treatment (p>0.05). With regard to the prescribed drugs, a difference was only noted between the SOT and NTS groups when they took teriparatide (p=0.043). As regards sports, a significant difference was noted between the SOT and NTS groups (p=0.021).

In contrast, for the CR test, walking speed, new fractures, and food rich in calcium, we registered no significant differences between the individual time points of measurement (p>0.05) (Table 4). The factors influencing the success of treatment are summarized in Table 4.

Table 4. Success of treatment

Parameter

Successful treatment*

(n=8)

No successful treatment

(n=15)

p-value

Age (years)

63.3 ± 8.5

65.1 ± 8.3

0.625π

Weight (kg)

Before the intervention

After the intervention

57.4 ± 6.8

59.6 ± 9.0

70.3 ± 11.2

69.3 ± 10.0

0.007π

0.033π

Height (cm)

Before the intervention

After the intervention

161.9 ± 6.8

158.8 ± 4.4

169.0 ± 6.6

166.5 ± 7.9

0.023π

0.019π

BMI (kg/m2)

Before the intervention

After the intervention

21.9 ± 2.0

23.5 ± 2.9

24.6 ± 3.8

25.0 ± 4.1

0.073π

0.355π

Chair rising test (s)

Before the intervention

After the intervention

8.9 ± 2.3

10.1 ± 1.8

10.2 ± 2.2

10.9 ± 3.1

0.105π

0.496π

Walking speed (m/s)

Before the intervention

After the intervention

0.9 ± 0.1

0.9 ± 0.1

0.9 ± 0.1

0.9 ± 0.2

0.413π

0.469π

Smokers yes/no

3/5

4/11

0.591c

Bisphosphonates yes/no

7/1

8/7

0.101c

Monoclonal antibodies yes/no

1/7

3/12

0.651c

Recombinant human parathyroid hormone fragment

2/6

0/15

0.043c

Strontiumranelate

1/7

0/15

0.161c

New fractures yes/no

3/5

3/12

0.363c

Sports yes/no

8/0

8/7

0.021c

*defined as a reduction on the NRS by 2 points. Data expressed as means ± SD, πindependent t test, cChi-square test

Discussion

The present investigation is the first to provide comprehensive data on the effects of 18 months of drug treatment for osteoporosis on parameters of physical fitness and pain. The level of pain could be reduced significantly in the entire group, whereas the parameters of physical fitness remained unchanged or even deteriorated. While the reasons for this change are manifold, we presume that the drug treatment could have influenced the patients’ perception of pain. In our investigation, especially teriparatide was found to exert favourable effects. Soen et al. [21] achieved similar results in their investigation of about 2000 patients who took 20 μg of teriparatide daily. The mode of action of this drug is not fully investigated yet and calls for further research. One potential mechanism of reducing back pain is reducing the severity as well as the number of new vertebral fractures [22]. New fractures played a subsidiary role in the present study, especially with regard to the success of treatment. The other drugs that we administered also had an effect on the patients’ perception of pain, regardless of the success of treatment. In the present study 68 % of the probands were given bisphosphonates, which enhance bone density by inhibiting osteoclast activity, and thus markedly suppress bone turnover when used for a long period of time [23]. However, these drugs may also cause an accumulation of micro injuries and thus impair the healing of stress fractures [24]. Despite an increasing quantity of bone, the quality of bone may deteriorate, which may favour bisphosphonate-related proximal femoral fractures among other conditions [25]. However, an animal experiment performed by Naito et al. [26] showed that treatment with alendronate may halt bone resorption and reduce levels of pain mediators. Compared to other bisphosphonates, the unique mechanism of action of minodronate on the inhibition of the P2X(2/3) receptor is advantageous, especially in reducing back pain among patients with osteoporosis [27]. However, in the present investigation we did not use minodronate. It should be noted that patients with osteoporosis benefit from the alleviation of pain in terms of an improvement of their quality of life.

Worthy of note was the significant change in hand grip strength on the right side. Simultaneously, pain levels were reduced in patients who did the sports program regularly. We attribute this effect to the specificity of the component of strength; in other words, only those patients who perform specific exercises for muscle strength are able to increase their muscle strength. Some participants performed the muscle strengthening exercises regularly while others swam or biked.

The results of the present study reveal that, in addition to drug treatment for osteoporosis, consistent muscle exercises may be useful. In a meta-analysis of the impact of various physical activities on osteoporosis, many studies revealed an increase in bone density under regular physical activity. Moderately intensive exercises performed twice to four times a week, in short intervals and at a high frequency, appeared to be especially effective [28]. In the present study only five patients performed regular sports at baseline by way of intensive muscle exercises. Based on these results, patients should be advised to perform regular exercise. Sling therapy is a suitable option; among our patients this exercise led to a significant reduction of pain, improvement of physical fitness, and a positive perception of their subjective health [4].

Independent of drug therapy, a lower body weight with a normal BMI does appear to exert a positive effect on pain levels. In the group that achieved successful treatment, the probands were on average about 12.5 kg lighter and their BMI was markedly lower than the corresponding values in patients who did not achieve successful treatment. Segar et al. [29] showed that a high BMI is associated with pain, especially in the lower extremity; the authors also noted back pain in these patients.

Conclusion

  • Teriparatide has – more than other drugs – a positive effect on the pain experienced by patients with osteoporosis.
  • Independent of the perception of pain, drugs for osteoporosis have no impact on muscle strength.
  • Physical activity or exercise in a sufficient dose does contribute to the reduction of pain in the long term among patients with osteoporosis.
  • A normal BMI may influence the perception of pain in patients with osteoporosis.
  • Supplementary muscle exercises aligned to the patient’s level of fitness appear meaningful in addition to drug therapy.

Limitations

The prospective design and the limited size of the group are limitations of the present study. More complex statistical procedures could not be used. Thus, no general conclusions can be drawn on the basis of the present data. The absence of the blinding of patients and investigators is a further limitation. This is a single pilot study, so a misinterpretation of the findings is possible. Our results may not be generalizable. In general the investigation period of 18 months is short. Bisphosphonates partly unfold their effect up to 3 years. This permits limited statements about the long-term effects of the treatment. In future investigations we intend to evaluate the data of a longer period of intervention and thus achieve a better level of evidence.

Declaration

Ethical Approval

We declare that this study with human subjects is in accordance with the Helsinki Declaration of 1975 as amended in 2000 and that it has been approved by the competent institutional ethics committee of the University of Rostock (Trial registration No. A 2018–0247).

Consent to participate

All  subjects  were  informed  comprehensively  about  the  methods,  purposes and risks of the study protocol and also received a written declaration of informed consent.

Consent for publication

BF agreed in writing to the publication of the illustration.

Availability of data and material

The vote of the Ethics Committee can be found at the following address (https: //www.ethik.med.uni-rostock.de/ A 2018–0247). The consent to the publication of the photographic material has been given to the journal.

Authors’ contribution

HCS led the investigation and is co-responsible for the clinical trial concept. He also participated in the recruitment of the test subjects. GS designed the data preparation concept. UV carried out the survey, measurement and documentation of the data. RB participated in the data preparation and correction of the typesetting. VB was responsible for the translation of the journal article. AH carried out the statistical data evaluation.

References

  1. Zanker J, Duque G (2018) Osteoporosis in Older Persons. Old and New Players. Journal of the American Geriatrics Society.
  2. Bergland A, Thorsen H, Karesen R (2011) Effect of exercise on mobility, balance, and health-related quality of life in osteoporotic women with a history of vertebral fracture. A randomized, controlled trial. Osteoporosis international 22: 1863–1871.
  3. Iwamoto J, Suzuki H, Tanaka K, et al. (2009) Preventative effect of exercise against falls in the elderly. A randomized controlled trial. Osteoporosis international 20: 1233–1240.
  4. Schröder G, Knauerhase A, Kundt G, Schober H-C. 2012. Effects of physical therapy on quality of life in osteoporosis patients – a randomized clinical trial. Health and quality of life outcomes 10: 101.
  5. Tella SH, Gallagher JC (2014) Prevention and treatment of postmenopausal osteoporosis. The Journal of steroid biochemistry and molecular biology 142: 155–170.
  6. Reid IR, Horne AM, Mihov B, et al. (2018) Fracture Prevention with Zoledronate in Older Women with Osteopenia. The New England journal of medicine 379: 2407–2416.
  7. Saag KG, Petersen J, Brandi ML, et al. (2017) Romosozumab or Alendronate for Fracture Prevention in Women with Osteoporosis. The New England journal of medicine 377: 1417–1427.
  8. Guralnik JM, Ferrucci L, Simonsick EM, et al. (1995) Lower-extremity function in persons over the age of 70 years as a predictor of subsequent disability. The New England journal of medicine 332: 556–561.
  9. Guralnik JM, Ferrucci L, Pieper CF, et al. (2000) Lower extremity function and subsequent disability. Consistency across studies, predictive models, and value of gait speed alone compared with the short physical performance battery. The journals of gerontology. Series A, Biological sciences and medical sciences 55: M221–31.
  10. Guralnik JM, Simonsick EM, Ferrucci L, et al. (1994) A short physical performance battery assessing lower extremity function. Association with self-reported disability and prediction of mortality and nursing home admission. Journal of gerontology 49: M85–94.
  11. Seefried L, Genest F (2017) Functional diagnostics of sarcopenia. Osteology 26: 13–17.
  12. Cruz-Jentoft AJ, Bahat G, Bauer J, et al. (2018) Sarcopenia. Revised European consensus on definition and diagnosis. Age and ageing.
  13. Runge M (2009) Fünf Esslinger. Ein Bewegungsprogramm für Muskel-Knochen- Fitness.
  14. Rantanen T (2003) Muscle strength, disability and mortality. Scandinavian journal of medicine & science in sports 13: 3–8.
  15. Rantanen T, Volpato S, Ferrucci L, et al. (2003) Handgrip strength and cause-specific and total mortality in older disabled women. Exploring the mechanism. Journal of the American Geriatrics Society 51: 636–641.
  16. Basler HD (2011) Akutschmerztherapie in Pädiatrie und Geriatrie – Schmerzmessung: Welche Schmerzskala bei welchen Patienten? Anästhesiol Intensivmed Notfallmed Schmerzther: 334–342.
  17. Prince RL, Devine A, Dhaliwal SS, Dick IM (2006) Effects of calcium supplementation on clinical fracture and bone structure. Results of a 5-year, double-blind, placebo-controlled trial in elderly women. Archives of internal medicine 166: 869–875.
  18. Bolland MJ, Avenell A, Baron JA, et al. (2010) Effect of calcium supplements on risk of myocardial infarction and cardiovascular events.Meta-analysis. BMJ (Clinical research ed.) 341: 3691.
  19. Compston J, Cooper A, Cooper C, et al. (2017) UK clinical guideline for the prevention and treatment of osteoporosis. Archives of osteoporosis 12: 43.
  20. Dimai HP (2005) Strontium ranelate. A novel concept for the treatment of osteoporosis. Wiener klinische Wochenschrift 117: 728–738.
  21. Soen S, Fujiwara S, Takayanagi R, et al. (2017). Real-world effectiveness of daily teriparatide in Japanese patients with osteoporosis at high risk for fracture. Final results from the 24-month Japan Fracture Observational Study (JFOS). Current medical research and opinion 33: 2049–2056.
  22. Genant HK, Halse J, Briney WG, et al. (2005) The effects of teriparatide on the incidence of back pain in postmenopausal women with osteoporosis. Current medical research and opinion 21: 1027–1034.
  23. Odvina CV, Zerwekh JE, Rao DS, et al. 2005. Severely suppressed bone turnover. A potential complication of alendronate therapy. The Journal of clinical endocrinology and metabolism 90: 1294–1301.
  24. Unnanuntana A, Saleh A, Mensah KA, et al. (2013) Atypical femoral fractures. What do we know about them?: AAOS Exhibit Selection. The Journal of bone and joint surgery 95: 1–13.
  25. Ma C-M, Cheung M-H, Wong W-B (2015) Surgical Difficulties and Complications in the Treatment of Bisphosphonate-related Proximal Femur Fractures. 非典型股骨近端骨折外科手術的困難和併發症. Journal of Orthopaedics, Trauma and Rehabilitation 19: 83–88.
  26. Naito Y, Wakabayashi H, Kato S, et al. 2017. Alendronate inhibits hyperalgesia and suppresses neuropeptide markers of pain in a mouse model of osteoporosis. Journal of orthopaedic science 22: 771–777.
  27. Ohishi T, Matsuyama Y (2018) Minodronate for the treatment of osteoporosis. Therapeutics and clinical risk management 14: 729–739.
  28. Moreira LDF, Oliveira MLd, Lirani-Galvao AP, et al. (2014) Physical exercise and osteoporosis. Effects of different types of exercises on bone and physical function of postmenopausal women. Arquivosbrasileiros de endocrinologia e metabologia 58: 514–522.
  29. Segar AH, Urban JPG, Fairbank JCT, Judge A. 2016. The Association between Body Mass Index (BMI) and Back or Leg Pain in Patients with Spinal Conditions. Results from the Genodisc Study. Spine 41: 1237–E1243.

Juvenile Tillaux Fractures: A Comparison of Direct and Indirect Fixation

DOI: 10.31038/IJOT.2019234

Abstract

Background: Two different screw configurations for the fixation of juvenile Tillaux fractures have been reported. One technique, direct fixation involves placement of one or two screws directly through the fragment, into the medial epiphysis or across the physis and into the metaphysis. The second technique involves placement of one or two screws through the medial epiphysis and into the fragment. The purpose of the study was to retrospectively study both techniques with regard to their effectiveness in maintaining an open anatomic reduction.

Methods: A review of all juvenile Tillaux fractures that had been operatively treated at our institution over a 5 year period was performed. A total of thirty-eight fractures were identified with twenty-three fractures (61%) treated utilizing a direct fixation technique and fifteen fractures (39%) treated utilizing an indirect fixation technique. All fractures were followed to union with a mean follow-up of twenty-one weeks.

Results: Thirty-four of the thirty-eight fractures were anatomically reduced on intraoperative radiographs with elimination of joint step-off on all radiographs and a residual one-millimeter fracture gap noted in four fractures. No fracture displaced between the time of internal fixation and healing. The mean healed fracture gap was 0mm and the mean healed joint step-off was 0mm. Four of the fifteen fractures stabilized with indirect fixation required hardware removal. One of the twenty-three fractures stabilized using direct fixation required hardware removal.

Conclusion: Either direct or indirect fixation of juvenile Tillaux fractures is effective in maintaining an anatomic open reduction of the joint surface.

Introduction

The juvenile Tillaux fracture was first recognized by Paul Jules Tillaux [1] but was not extensively described until the report of Kleiger and Mankin [2]. The fracture occurs primarily in older adolescents in whom closure of the distal tibial physis has begun [3–7]. Early descriptions of the fracture reported successful treatment with closed reduction and casting [2,8,9]. However, reports of early degenerative changes in patients with displaced intraarticular distal tibia fractures have led to recommendations for open reduction and internal fixation in displaced intraarticular distal tibia fractures [10]. Some authors have advocated closed reduction with percutaneous fixation [11] or arthroscopic reduction [12,13] but open reduction is the standard of care [14–22]. The literature describes two different fixation techniques. The first involves placement of one or two pins or screws through the epiphyseal fragment and into the distal tibial metaphysis [18,20,21,23–25] (figure 1). The second technique involves placement of one or two screws through the medial malleolus and into the Tillaux fragment [17] (figure 2). Both techniques have been used at our institution. This study was performed to evaluate the effectiveness of each technique at maintaining the anatomic reduction obtained at the time of open reduction.

Materials and Methods

After obtaining institutional review board approval, a review of all distal tibial Tillaux fractures treated operatively at our institution between over a five year period was performed. Patients successfully treated with cast immobilization and without surgical intervention were excluded. Charts were reviewed for demographic information, operative details and postoperative complications and follow-up. Radiographs were reviewed for confirmation of the fracture pattern, the screw configuration used and intraoperative measurement of the displacement after fixation. Follow-up radiographs were reviewed to assess healing and measure displacement in both a transverse direction (fracture gap) and a vertical direction (joint step off).

A total of forty-five patients with forty-five fractures were identified. Seven patients had radiographs that could not be located or inadequate follow-up for inclusion in the study. A total of thirty-eight patients with thirty-eight fractures were identified that were followed to union. A total of sixteen males and twenty-two females were included. The mean age of the patients was thirteen years and eight months (range eleven years and one month to sixteen years and two months). The right ankle was involved in twenty-two fractures (58%) and the left in sixteen (42%). A total of twenty-three fractures (61%) were stabilized using direct fixation while fifteen fractures (39%) underwent indirect fixation. All patients were followed to fracture union, which occurred in all fractures within six weeks after the injury. The mean follow up was twenty-one weeks (range six to 124 weeks)

Surgical Technique

After the patient had been placed in the supine position with a bump under the ipsilateral hip, the involved extremity was prepared and draped free. Under tourniquet, in all patients, an anterior longitudinal incision was made over the ankle and dissection was performed down to the level of the anterior tibial tendon. Dissecting either medial to the anterior tibial tendon or between the anterior tibial tendon and the extensor hallicus longus tendon an arthrotomy was then performed. The Tillaux fragment was then identified and distracted by inserting a freer elevator into the fracture site. Hematoma was then curetted from the fracture site and the ankle joint thoroughly irrigated. The articular surface was then reduced under direct vision using the elevator and held reduced using a large bone reduction clamp. One of two fixation configurations was then used after open reduction at the surgeon’s discretion. The first technique, designated direct fixation, involved the placement of one or two cannulated 4.0mm, partially threaded, interfragmentary screws (Smith-Nephew-Richards, Memphis, Tennessee, USA) angled proximally, medially and posteriorly through the Tillaux fragment and into either the distal tibial epiphysis or across the physis and into the metaphysis (Fig. 1a-f). The second technique, designated indirect fixation17, involved making a small (3mm) incision over the medial aspect of the epiphysis and placement of one or two cannulated interfragmentary screws through the medial epiphysis between the physis and the joint surface using image intensification (Fig. 2a-e). Closure of the incisions was carried out after confirming anatomic reduction both visually by inspecting the joint surface and by using image intensification. Regardless of the screw configuration utilized, the ankle was immobilized in a short leg cast or orthotic walker boot and the patient was requested to be non-weight bearing for six weeks. Hardware removal was not routinely performed after fracture healing but was performed if the patent experienced significant discomfort with activity over the area of screws.

IJOT-119_Gordon JE_F1a

Figure 1a. Anteroposterior radiograph of the left ankle in a 13+0 year old female after a twisting injury sustained after stepping into a hole showing a displaced Tillaux fracture.

IJOT-119_Gordon JE_F1b

Figure 1b. Lateral radiograph of the left ankle in the same patient.

IJOT-119_Gordon JE_F1c

Figure 1c. Coronal reconstruction of computed tomography of the distal tibia following closed reduction showing significant gapping of the Tillaux fragment.

IJOT-119_Gordon JE_F1d

Figure 1d. Coronal reconstruction of computed tomography of the distal tibia in the mid tibia following closed reduction showing mild displacement of the Tillaux fragment.

IJOT-119_Gordon JE_F1e

Figure 1e. Anteroposterior intraoperative image of the ankle in the same patient obtained using an image intensifier intraoperatively after open anatomic reduction and internal fixation using direct fixation with one screw

IJOT-119_Gordon JE_F1f

Figure 1f. Lateral image of the ankle in the same patient.

IJOT-119_Gordon JE_F2a

Figure 2a. Anteroposterior radiograph of the left ankle in a 12+6 year old female after an injury sustained while playing soccer. A displaced Tillaux fracture is present

IJOT-119_Gordon JE_F2b

Figure 2b. Lateral radiograph of the left ankle in the same patient.

OLYMPUS DIGITAL CAMERA

Figure 2c. Computed axial tomographic image of the left distal tibia showing displacement of the Tillaux fragment.

IJOT-119_Gordon-JE_F2d.jpg

Figure 2d. Intraoperative anteroposterior image of the ankle in the same patient obtained using an image intensifier intraoperatively after open anatomic reduction and internal fixation using indirect fixation with two screws.

IJOT-119_Gordon JE_F2e

Figure 2e. Intraoperative lateral image of the ankle in the same patient obtained using an image intensifier intraoperatively after open anatomic reduction and internal fixation using indirect fixation with two screws.

Results

Anatomic reduction was obtained in thirty-four of the thirty-eight fractures at the time of operative fixation. Joint step off was eliminated in all patients. Three of the twenty-three fractures treated by direct fixation (13%) and one of the fifteen fractures treated by indirect fixation (7%) were noted to have a residual one-millimeter fracture gap intraoperatively that was felt to be acceptable. Measurements at the time of bony union revealed that no fracture had displaced joint step off (mean 0 mm). At the time of union, no patient had a measurable fracture gap (mean 0 mm). One of the twenty-three patients who had direct fixation (4%) requested hardware removal. Four of the fifteen patients who had indirect fixation (29%) requested hardware removal. No intraoperative or postoperative complications occurred although transient tingling in the distribution of the superficial peroneal nerve was noted postoperatively in a few patients. This had resolved by the time of final follow-up in all patients. No patient developed other neurovascular complications, wound problems or infection. Hardware removal was uncomplicated in all patients who requested removal of the screws.

Discussion

Juvenile Tillaux fractures are uncommon and most reports consist of small series or case reports with the largest series in the literature representing 10 patients [26,27] Here we report the operative experience at our institution over an extended period of time with this uncommon fracture. Our routine during this time has been to perform antero-posterior, lateral, and mortise radiographs as the initial radiographic evaluation. Fractures that were displaced were splinted and operative treatment recommended. Fractures that were not clearly displaced were placed into long leg casts with the knee bent 45–90°. After cast placement, computed tomography with coronal and sagittal reconstruction was performed to evaluate the joint surface [19, 28–33]. Displacement with fracture gap or joint step-off of more than 1mm was considered to be significant and operative treatment recommended. Operative treatment in each instance involved open reduction with internal fixation using 4.0mm cannulated screws. Closed reduction of these fractures, if attempted was performed prior to definitive imaging and in our experience rarely achieved the anatomic reduction of the joint surface that we believe is essential to good long-term results.

The advantage of direct fixation is that it is technically slightly easier, not requiring joint space visualization and image intensification needed for indirect fixation. In addition, direct fixation does not require additional incisions to be made in the area of the medial malleolus. Crossing the physis typically involves little risk of late growth problems because these fractures typically occur after closure of the posterior and medial aspects of the distal tibial physis2, 7. Indirect fixation has the advantage of requiring a slightly smaller anterior incision because drilling and screw placement is not performed through this incision. Indirect fixation also has the advantage of simplified screw removal in the event of painful hardware. Hardware removal was more frequently requested in the patients who had been stabilized using indirect fixation, possibly due to prominence of the screws at the medial malleolus causing problems with shoe wear. Either technique seems to be effective in maintaining an anatomic reduction that has been achieved by open reduction.

In conclusion, both direct and indirect fixation of juvenile Tillaux fractures are effective in maintaining an anatomic reduction of the fracture when the limb is immobilized in a short leg, below knee cast or orthotic walker boot when the patient is kept non-weight bearing.

Acknowledgement

Study conducted at Washington University School of Medicine, St. Louis Shriners Hospital for Children, and St. Louis Children’s Hospital, St. Louis, Missouri, USA.

References

  1. Rang M (1983) Children’s Fractures. (2nd edn). Philadelphia and Toronto: J.B. Lippincott Company 1983.
  2. Kleiger B, Mankin HJ (1964) Fracture of the lateral portion of the distal tibial epiphysis. J Bone Joint Surg [Am] 46: 25–32.
  3. Protas JM, Kornblatt BA (1981) Fractures of the lateral margin of the distal tibia. The Tillaux fracture. Radiology 138: 55–7.
  4. Letts RM (1982) The hidden adolescent ankle fracture. J Pediatr Orthop 2: 161–4.
  5. Love SM, Ganey T, Ogden JA (1990) Postnatal epiphyseal development: the distal tibia and fibula. J Pediatr Orthop. 10: 298–305.
  6. Ogden JA, McCarthy SM (1983) Radiology of postnatal skeletal development. VIII. Distal tibia and fibula. Skeletal Radiol 10: 209–20.
  7. Spinella AJ, Turco VJ (1988) Avulsion fracture of the distal tibial epiphysis in skeletally immature athletes (juvenile Tillaux fracture). Orthop Rev 17: 1245–9.
  8. Kleiger B (1956) The mechanism of ankle injuries. J Bone Joint Surg [Am] 38: 59–70.
  9. Spiegel PG, Cooperman DR, Laros GS (1978) Epiphyseal fractures of the distal ends of the tibia and fibula. J Bone Joint Surg [Am] 60: 1046–50.
  10. Ertl JP, Barrack RL, Alexander AH, VanBuecken K (1988) Triplane fracture of the distal tibial epiphysis. J Bone Joint Surg [Am] 70: 967–76.
  11. Schlesinger I, Wedge JH (1993) Percutaneous reduction and fixation of displaced juvenile Tillaux fractures: a new surgical technique. J Pediatr Orthop 13: 389–91.
  12. Leetun DT, Ireland ML (2002) Arthroscopically assisted reduction and fixation of a juvenile Tillaux fracture. Arthroscopy 18: 427–9.
  13. Ogawa T, Shimizu S (2017) Arthroscopically assisted surgical fixation of a juvenile Tillaux fracture and implant removal: A case report. J Clin Orthop Trauma 8: 32–7.
  14. Dailiana ZH, Malizos KN, Zacharis K, Mavrodontidis AN, Shiamishis GA, et al (1999) Distal tibial epiphyseal fractures in adolescents. Am J Orthop 28: 309–12.
  15. de Sanctis N, Della Corte S, Pempinello C (2000) Distal tibial and fibular epiphyseal fractures in children: prognostic criteria and long-term results in 158 patients. J Pediatr Orthop B 9: 40–4.
  16. Koury SI, Stone CK, Harrell G, La Charite DD (1999) Recognition and management of Tillaux fractures in adolescents. Pediatr Emerg Care 15: 37–9.
  17. Lintecum N, Blasier RD (1996) Direct reduction with indirect fixation of distal tibial physeal fractures: a report of a technique. J Pediatr Orthop 16: 107–112.
  18. Kling TF Jr (1990) Operative treatment of ankle fractures in children. Orthop Clin North Am. 21: 381–92.
  19. von Laer L (1985) Classification, diagnosis, and treatment of transitional fractures of the distal part of the tibia. J Bone Joint Surg [Am]. 67: 687–98.
  20. Kling TF, Jr., Bright RW, Hensinger RN (1984) Distal tibial physeal fractures in children that may require open reduction. J Bone Joint Surg [Am] 66: 647–57.
  21. Dias LS, Giegerich CR (1983) Fractures of the distal tibial epiphysis in adolescence. J Bone Joint Surg [Am] 65: 438–444.
  22. Britton PD (1988) Adolescent-type Tillaux fracture of the ankle: two case reports. Arch Emerg Med 5: 180–3.
  23. Dingeman RD, Shaver GB (1978) Operative treatment of displaced Salter-Harris III distal tibial fractures. Clin Orthop 135: 101–103.
  24. Salter RB (1974) Injuries of the ankle in children. Orthop Clin North Am 1974;5: 147–152.
  25. Dias LS, Tachdjian MO (1978) Physeal injuries of the ankle in children. Clin Orthop 136: 230–3.
  26. Tiefenboeck TM, Binder H, Joestl J, et al. (2017) Displaced juvenile Tillaux fractures : Surgical treatment and outcome. Wien Klin Wochenschr 129: 169–75.
  27. Kaya A, Altay T, Ozturk H, Karapinar L (2007) Open reduction and internal fixation in displaced juvenile Tillaux fractures. Injury 38: 201–5.
  28. Yao J, Huurman WW (1986) Tomography in a juvenile Tillaux fracture. J Pediatr Orthop 6: 349–51.
  29. Felman AH (1989) Tillaux fractures of the tibia (in adolescents). Pediatr Radiol 20: 87–9.
  30. Horn BD, Crisci K, Krug M, Pizzutillo PD, MacEwen GD (2001) Radiologic evaluation of juvenile Tillaux fractures of the distal tibia. J Pediatr Orthop 21: 162–4.
  31. O’Connor DK, Mulligan ME (1998) Extra-articular triplane fracture of the distal tibia: a case report. Pediatr Radiol. 28: 332–3.
  32. Steinlauf SD, Stricker SJ, Hulen CA (1998) Juvenile Tillaux fracture simulating syndesmosis separation: a case report. Foot Ankle Int 19(5): 332–5.
  33. Karrholm J (1997) The triplane fracture: four years of follow-up of 21 cases and review of the literature. J Pediatr Orthop B 6: 91–102.

Extraction of Remaining Teeth and Same Day Loading of Neoss Proactive Dental Implants with a Full-arch Fixed Provisional Bridge. A Survival Analysis

DOI: 10.31038/JDMR.2019224

Abstract

Removal of remaining teeth and same day loading of an implant-supported full-arch bridge may be a sensible treatment modality for many patients presenting with a severely diseased partial dentition. The aim of the present study was to retrospectively analyse 30 consecutive patients (21 female/ 9 male, mean age 61.9 + 11.1 years) subjected to removal of all remaining teeth, placement of four to six implants and loading of a full-arch provisional bridge the same day.  A total of 156 dental implants (Proactive Straight, Neoss Ltd, Harrogate, UK) 3.5 to 5 mm in diameter and 9 to 13 mm in lengths were placed in 21 maxillae and 14 mandibles. Provisional acrylic bridges were fabricated in the in-house dental laboratory and fitted after a few hours from the surgical procedures using screw retention. The fabrication of the definitive prostheses was initiated between three to six months from the implant placement. A total of four implants failed in three patients during the initial healing period with provisional bridges in place, giving a cumulative survival rate of 97.3 % during a mean follow-up period of 3.5 + 1.0 years (range 2–5 years). Two failures occurred in the maxilla as a result of fracture of the provisional bridge and two in the mandible due to infection. These three patients had new implants placed and could maintain the repaired or a new provisional bridge during the additional healing period. A total of seven provisional acrylic bridges fractured. No implant failures were observed after placement of the permanent fixed bridges. Few minor other complications occurred during the follow-up. It is concluded that the evaluated treatment concept resulted in a high implant survival rate and few complications after a follow-up of 2 to 5 years.  Although not quantified, the positive effects on self-esteem and psychosocial wellbeing was obvious.

Keyword

Dental Implants, Full-Arch Bridge, Follow-Up Study, Extraction Sockets, Immediate Loading, Screw-Retained Prosthesis

Introduction

Today, most patients can be offered replacement of lost teeth with fixed implant-supported prostheses using swift and safe procedures irrespective of the conditions of the edentulous areas 1]. This is thanks to developments of the original strict osseointegration protocol [2], which was thoroughly evaluated in clinical studies and proven to be highly successful, initially in totally edentulous jaws [3] and later in partially dentate patients [4, 5] Long healing periods were originally advocated after tooth extraction as well as after implant placement in order to assure osseointegration of the implants prior to loading [6]. Further development and evaluation of improved implant surfaces, regenerative techniques and treatment protocols have resulted in the possibility to dramatically reduce treatment times without jeopardizing the outcomes [1]. For instance, implants can be placed immediately in extraction sockets [7, 8] and loaded the same day or a few days after installation [9, 10]. However, although immediate/early loading of dental implants has evident benefits for the patient, it is a resource demanding procedure, as it requires a well-planned collaboration between the clinical team and the dental technician. In fact, it is a logistic challenge to offer immediate/early loading to all implant patients in a busy dental practice. Since the majority of implant patients are missing one or a few teeth [11–13], fixed or removable provisional prostheses can be made and used during the implant healing period.

The present authors have identified one group of patients in whom immediate loading is justified and highly effective. These patients typically presents with a severely diseased partial dentition in one or both jaws. Apart from the functional aspects with impaired chewing comfort, the aesthetic appearance may have led to low self-esteem, depression and a decline in psychosocial wellbeing [14].  Moreover, the patients may not have seen a dentist for a long time due to severe dental fear.  It is our experience that these patients can be motivated to go through one surgical procedure including removal of remaining teeth and placement of implants followed by the manufacturing and loading of a provisional bridge the same day as reported by other authors [15–17]. Systematic reviews have concluded that immediate/early loading is a straightforward approach in the mandible [18], while treatment of the maxilla is less well documented [19–21], particularly when implants are placed in extraction sockets [21]. However, numerous studies have reported survival rates from 98% to 99% when placing implants in extraction and healed sites for immediate loading of maxillary full-arch constructions [22–25], while other studies have shown less good outcomes with increased failure rates in the maxilla [26, 27] and for implants in extraction sockets [28].

The aim of the present study was to retrospectively analyse implant survival and technical complications in 30 consecutive patients treated with same day loading of full-arch implant-supported temporary bridges in conjunction with tooth extractions.

Materials & Methods

Patients and data collection

This retrospective study includes consecutive patients treated with an immediately loaded fixed full-arch bridge on Neoss implants (Proactive Straight, Neoss Ltd, Harrogate, UK) in conjunction with extraction of remaining teeth in the maxilla and/or mandible at the Edinburgh Dental Specialist referral clinic, Edinburgh, Scotland and with at least two years of follow-up.

Patient data were collected from the charts and entered into spreadsheets.  Gender, age, diagnosis of the failing dentition, surgical date, number of teeth extracted, implant location, insertion torque, implant dimensions, abutment type and angulation, implant and restorative complications or failures were recorded. The study was made in accordance with the World Medical Association Declaration of Helsinki.

At the initial consultation, the patients signed a general consent form for data collection. A comprehensive medical history assessment was made. The clinical examination included an oral cancer screen, intraoral radiographs, comprehensive dental and periodontal examinations. Photographs were taken as well as impressions for diagnostic models (Figure 1). An initial treatment plan was outlined by the prosthodontist (PC) and presented and discussed with the patient. The presurgical patient evaluation with the implant surgeon (LS) consisted of a comprehensive oral examination and the use of orthopantomographic and/or cone beam computed tomographic (CBCT) scans. The only exclusion criteria applied was the insufficient bone availability for implant placement as evaluated initially on orthopantomographic assessment and confirmed by CBCT imaging.

JDMR-19-120- Lars Sennerby_-Sweden_F1

Figure 1. 48 year old female patient at initial consultation for treatment of both jaws. a. Orthopanthomogram, b. Extraoral appearance. c. Intraoral view. d. Left and e. right side. f. Occlusal view of upper and g. lower jaw.

Clinical procedures

The treatment consisted in the extraction of the remaining dentition in the dental arch and the immediate placement of four to six dental implants in the maxilla and four to five in the mandible (Figure 2). (Neoss Proactive Straight, Neoss Ltd, Harrogate, UK). The final number of implants to be placed in the particular case was decided by the surgeon during the surgical procedures, depending on the bone quantity and quality, on the implant distribution in the dental arch and on the initial implant stability. The implants were placed both in healed and extracted sites in order to achieve a good distribution of the implants within the jaw. The implants were typically placed between the maxillary sinuses and the mental foramina.

JDMR-19-120- Lars Sennerby_-Sweden_F2

Figure 2. Intraoral view after extractions of remaining teeth (see Figure 1a) and implant surgery, which was made at two different occasions with 6 weeks in between. a. Upper jaw with six implants and prosthetic abutments. b. Lower jaw with five implants and abutments.

Screw-retained transmucosal abutments (Access, Neoss Ltd, Harrogate, UK or Multi Unit Abutments, Nobel Biocare UK Ltd, Uxbridge, UK) were placed on the implants. Most of the abutments were straight, whereas angulated abutments were used to compensate for the intentionally tilted posterior implants (to avoid maxillary sinuses or mandibular nerve infringements) or to correct the angulation of forward positioned anterior implants. Resorbable sutures were used for soft tissue closure.

Directly after the placement of the transmucosal abutments, working impressions of the implant positions were taken with Impregum (3M Ltd, London, UK). The occlusal vertical dimension was registered in different ways. By using one remaining tooth to be extracted (or refitting the extracted tooth in the extraction socket) in case the original vertical dimension was acceptable. When there was the need of an increase in the vertical dimension, temporary cylinders sectioned at the wished length and fitted onto the transmucosal abutments were used to provide a stable bite registration. The provisional acrylic bridges were fabricated in the in-house dental laboratory and fitted after a few hours from the surgical procedures using screw retention (Figure 3). The distal extension of the temporary bridges was limited to the most distal implant position to prevent acrylic fractures and maintain the occlusal load to the minimum. The fit and occlusion were checked and adjusted as needed. Provisional fillings were placed in the access holes and the patient was discharged with instructions to follow a soft food diet for the time the temporary bridge was in use.

JDMR-19-120- Lars Sennerby_-Sweden_F3

Figure 3. a. Provisional acrylic bridge for the upper and b. lower jaw. c. Occlusal views of upper and d. lower bridge. e. Extraoral  and f. intraoral appearance with both provisional bridges fitted on the implants.

Post-operative protocol

Post-surgical prescriptions consisted of analgetic drugs in case of pain (brufen 400mg x4 or paracetamol 1gr x4) and a five-day course of antibiotics (amoxicillin 750 mg x2 or clindamycin 150 mg x2). Patients were seen 1–2 weeks following surgery to assess the healing process and the functionality of the temporary bridge (aesthetics, occlusion, vertical dimension) as well as to address any potential concerns regarding swelling and bruising. Patients were encouraged to contact the clinic in case any mobility of the bridge or portions of the bridge were experienced. In such a case, the bridge was carefully removed and the implant conditions assessed. In case of bridge fractures, the bridge was repaired in the dental laboratory and refitted after a few hours. In case of implant mobility, the implant was removed and later replaced with a new one.

Final bridges

The fabrication of the definitive prostheses was initiated between three to six months from the implant placement, depending on the amount of soft and hard tissue recession expected after surgery, on the jaw (maxilla or mandible), on the time availability from the patient’s and the prosthodontist’s sides.

At the removal of the temporary bridge, the stability of the implant/transmucosal abutment complex was verified and the conditions of the peri-implant soft tissues assessed. In the absence of mobility, pain, suppuration at palpation/pressure, the implants were considered ready to support a definitive restoration, which was fabricated during three to four appointments. This would include (i) final impressions, (ii) articulation of the working models in the laboratory using the provisional prostheses as guidance and (iii) insertion of the definitive bridge or (i) final impressions, (ii) bite registration, (iii) wax trial and (4) insertion of the definitive bridge. At the time of the final impressions, the proper fit of the impression copings onto the transmucosal abutments or onto the implants as well as the peri-implant bone level were checked with intraoral radiographs.

Three different types of definitive bridges could be provided:

  1. A titanium framework and acrylic resin denture base material with denture teeth around it,
  2. A monolithic zirconia framework with porcelain bonded on it
  3. A chrome-cobalt framework with porcelain bonded on it.

The bridges were screw-retained onto the transmucosal abutments or directly onto the implants after the removal of the transmucosal abutments (Figure 4, 5), depending on the amount of soft tissue recession that had occurred during healing and on the aesthetic demands. The fit of the bridge to the transmucosal abutments/implants was verified with intraoral radiographs that would also provide for baseline peri-implant bone levels.

JDMR-19-120- Lars Sennerby_-Sweden_F4

Figure 4. a. Soft tissue situation at the time of fitting the final bridges in the upper  and b. lower jaw.

JDMR-19-120- Lars Sennerby_-Sweden_F5

Figure 5. a-d. Showing the final bridge in the upper  and e-f. the lower jaw.

JDMR-19-120- Lars Sennerby_-Sweden_F6

Figure 6. a. Extraoral view with final bridges fitted. b Intraoral frontal view, c. Right and d. left side. e. Occlusal view of the upper and f. lower bridges. g. Oblique extraoral view of final bridges.

Follow-ups

A follow-up appointment was carried out after 3–4 weeks from the provision of the definitive bridge for a control tightening of the screws and the provision of permanent fillings onto the access holes. Patients were thereafter scheduled for recalls once a year the first two years, thereafter at the fifth, seventh, 10th anniversary and every 2–3 years thereafter. At these appointments, assessments of the integrity of the prostheses and of the soft and hard peri-implant tissues conditions by clinical and radiographic examinations were carried out.

Results

A total of 30 patients (21 female/ 9 male, mean age 61.9 + 11.1 years) were included in the study. Five patients had been treated in both jaws at two different occasions. On average, seven teeth (7.7 + 2.8) were extracted in each jaw and treated with 156 implants (Neoss Ltd, Harrogate, UK), where 93 had been placed in the maxilla (21 jaws) and 63 in the mandible (14 jaws) (Table 1). In five cases, previously placed implants were included in the bridge.

Table 1. Number and type of implants placed. Failed implants within brackets.

 Diameter

Length

3.5 mm

4.0 mm

4.5 mm

5.0 mm

Sa

9 mm

2

1

1

4

11 mm

3

14

1

18

13 mm

10

116 (4)

8

134

Sa

13

132

10

1

156

A total of four implants failed in three patients during the follow-up period giving a cumulative survival rate of 97.4% after a mean follow-up of 3.5 + 1.0 years (range 2–5 years) (Table 2). All implant failures occurred during the initial healing period with temporary bridges in place. Two failures occurred in the maxilla (2.2 %) in two patients as a result of fracture of the temporary bridge and two in the mandible (3.2 %) in one patient due to infection. These three patients had new implants placed and could maintain the repaired bridge (n=2) or got a newly made temporary bridge including the newly placed implants (n=1) during the additional healing period. No implant failures were observed after placement of the permanent fixed bridges.

Table 2. Implant survival. Life table analysis.

Interval

Implants

Failed

Not yet due

CSR

Insertion to final bridge

156

4

0

97.4 %

Final bridge to 1 year

152

0

0

97.4 %

1 to 2 years

152

0

31

97.4 %

2 to 3 years

121

0

31

97.4 %

3 to 4 years

90

0

68

97.4 %

4 to 5 years

22

Although not quantified in the present study, the peri-implant marginal bone levels were maintained throughout the observation period with the exception of one anterior mandibular fixture showing a bone loss of 2mm mesially and distally at the 1-y recall compared to the bone levels observed at the time of the fit of the permanent bridge. The fixture did not show any further bone loss at the subsequent recall appointments. From a prosthetic point of view, in seven patients the provisional acrylic prostheses fractured during the healing time. Two of these patients experienced two fractures and one patient three fractures of the same prosthesis. In two cases the fractures of the provisional restorations corresponded to the osseointegration failure of the implant supporting the fractured portion.

The lower jaws were all but one restored with titanium/acrylic prostheses. Fifteen upper jaws were restored with titanium/acrylic prostheses, five with metal/ceramic prostheses and one with a zirconia restoration.

During the follow-up period, four patients experienced the fracture of an acrylic tooth from the permanent restoration (one patient had three fractures of one acrylic tooth). In all cases, the prostheses were repaired in the laboratory within few hours and refitted the same day.

Discussion

In the present retrospective study, 30 patients received a total of 35 immediately loaded fixed implant-supported provisional bridges in conjunction with extraction of remaining teeth and were evaluated after 2 to 5 years. All provisional bridges could be maintained as planned during the initial period of 3 to 6 months in spite of four implant osseointegration failures, although the involved bridges had to be repaired and adjusted. No additional failures occurred after connection of the final bridges, giving an implant survival rate of 97.4 % with small differences between the maxilla and mandible after a mean follow-up of 3.5 years. The four failures in the present study were due to fracture of the provisional bridge and subsequent overload in two maxillary cases and infection in one mandible.

The same treatment modality has been evaluated by other authors in previous publications, which have shown varying clinical results and especially in the maxilla [23–28]. The reasons for the different outcomes may be attributed to differences in patient selection, inclusion criteria and the type/number of implants that were used. For instance, Balshi et al [23] placed a mean of 10 implants per patient and reported a survival rate of 99%, while studies with lower survival rates in general used fewer implants [29]. It is also known that implant surface topography has an impact on implant healing [30–31] and clinical outcome [32], which may explain differences between studies. For instance, Andersson et al [33] used a similar concept as in the present study in 55 patients but where the Neoss implants were loaded 1–3 days after extractions and implant placement. They reported a survival rate of 93.7 % after a mean follow-up of 2.9 years, which is lower than in the present study. Although utilising the same implant design as in our study, they used two different surfaces (Bimodal vs Proactive) and observed better results with the Proactive surface, 96.4 % vs 89.7 % for the Bimodal surface. They speculated that this could be explained by differences in surface topography as well as chemical properties of the two surfaces, as the Proactive surface is rougher and hydrophilic compared to the smoother and hydrophobic Bimodal surface. Experimental and clinical studies have shown a stronger bone tissue response to the Proactive surface, which showed more bone contacts and higher stability as measured with removal torque tests and resonance frequency analysis (RFA) measurements [34, 35]. In addition, clinical studies have also demonstrated higher stability [36] and better clinical outcomes [37] with Neoss Proactive than with Bimodal implants.  However, like in our study, all patients received and maintained a fixed bridge in spite of the implant failures in the Andersson et al study.

From a prosthetic point of view, the maintenance of the implant-retained prosthesis can be viewed as the primary objective of the treatment. In such a case, the survival rate of the restorations described in this study was 100%, with very few minor prosthetic complications that could be amended within few hours. These data are very similar to the data presented by Tealdo and co-workers who reported of a 100% fixed prostheses survival and minor fractures, easily adjusted, in a 6-year prospective study on immediate or delayed implant load on maxillary edentulous patients [38].

The immediate effect of the provision of an immediate fixed restoration on the patient’s life quality should not be underestimated. It is well documented that insertion of an implant-supported bridge in the edentulous patient results in marked psychological and social improvement when using the original and lengthy protocol [39]. Many of the patients in this investigation had a history of poor functioning removable prostheses, constant discomfort and often pain due to failing dentition, low self-esteem and limited social life. The one-day treatment approach had a dramatic effect as it clearly improved the subject life quality and self-esteem almost immediately.

It is concluded that extraction of remaining teeth and same day loading of a provisional full-arch bridge resulted in a high implant survival rate and few complications in both the mandible and maxilla after a follow-up of 2 to 5 years.  Although not quantified, the positive effects on self-esteem and psychosocial wellbeing was obvious.

References

  1. Buser D, Sennerby L, De Bruyn H (2017) Modern implant dentistry based on osseointegration: 50 years of progress, current trends and open questions. Periodontol 2000 73: 7–21. [crossref]
  2. Brånemark PI, Hansson BO, Adell R, Breine U, Lindström J, et al. (1977) Osseointegrated implants in the treatment of the edentulous jaw. Experience from a 10-year period. Scand J Plast Reconstr Surg 16: 1–132.
  3. Adell R, Lekholm U, Rockler B, Brånemark PI (1981) A 15-year study of osseointegrated implants in the treatment of the edentulous jaw. Int J Oral Surg 10: 387–416. [crossref]
  4. Lekholm U, Gunne J, Henry P, Higuchi K, Lindén U, et al. (1999) Survival of the Brånemark implant in partially edentulous jaws: a 10-year prospective multicenter study. Int J Oral Maxillofac Implants 14: 639–645. [crossref]
  5. Henry PJ, Laney WR, Jemt T, Harris D, Krogh PH, et al. (1996) Osseointegrated implants for single-tooth replacement: a prospective 5-year multicenter study. Int J Oral Maxillofac Implants 11: 450–455. [crossref]
  6. Adell R, Lekholm U, Brånemark PI (1987) Surgical procedures. In Brånemark, Per-Ingvar; Zarb, George A.; Albrektsson, Tomas (eds.) Tissue-Integrated Prostheses: Osseointegration in Clinical Dentistry, Chicago, Quintessence, pp: 211–232.
  7. Chrcanovic BR, Albrektsson T, Wennerberg A (2015) Dental implants inserted in fresh extraction sockets versus healed sites; a systematic review and meta-analysis. J Dent 43: 16–41.
  8. Chen H, Zhang G, Weigl P, Gu X (2018) Immediate placement of dental implants into infected versus noninfected sites in the esthetic zone: A systematic review and meta-analysis. J Prosthet Dent 120: 658–667. [crossref]
  9. De Bruyn H, Raes S, Ostman PO, Cosyn J (2014) Immediate loading in partially and completely edentulous jaws: a review of the literature with clinical guidelines. Periodontol 2000 66: 153–187. [crossref]
  10. Huynh-Ba G, Oates TW, Williams MAH (2018) Immediate loading vs. early/conventional loading of immediately placed implants in partially edentulous patients from the patients’ perspective: A systematic review. Clin Oral Implants Res 16: 255–269.
  11. Hugoson A, Koch G, Go¨thberg C, Helkimo AN, Lundin SA, et al. (2005) Oral health of individuals aged 3–80 years in Jo¨nko¨ping, Sweden during 30 years (1973–2003). Part II: Review of clini- cal and radiographic findings. Swed Dent J 29: 139–155.
  12. Mack F, Samietz SA, Mundt T, Proff P, Gedrange T, et al. (2006) Prevalence of single-tooth gaps in a population-based study and the potential for dental implants–data from the Study of Health in Pomerania (SHIP-0). J Craniomaxillofac Surg 34 Suppl 2: 82–85. [crossref]
  13. O¨sterberg T, Carlsson GE (2007) Dental state, prosthodontic treatment and chewing ability – a study of five cohorts of 70-year-old subjects. J Oral Rehabil 34: 553–559.
  14. Emami E, de Souza RF, Kabawat M, Feine JS (2013) The impact of edentulism on oral and general health. Int J Dent 2013: 498305. [crossref]
  15. Balshi TJ, Wolfinger GJ (1997) Immediate loading of Brånemark implants in edentulous mandibles: a preliminary report. Implant Dent 6: 83–88. [crossref]
  16. Wolfinger GJ, Balshi TJ, Rangert B (2003) Immediate functional loading of Brånemark system implants in edentulous mandibles: clinical report of the results of developmental and simplified protocols. Int J Oral Maxillofac Implants 18: 250–257. [crossref]
  17. Olsson M, Urde G, Andersen JB, Sennerby L (2003) Early loading of maxillary fixed cross-arch dental prostheses supported by six or eight oxidized titanium implants: results after 1 year of loading, case series. Clin Implant Dent Relat Res 5 Suppl 1: 81–87
  18. Papaspyridakos P, Mokti M, Chen CJ, Benic GI, Gallucci GO, et al. (2014) Implant and prosthodontic survival rates with implant fixed complete dental prostheses in the edentulous mandible after at least 5 years: a systematic review. Clin Implant Dent Relat Res 16: 705–717. [crossref]
  19. Attard NJ, Zarb GA (2005) Immediate and early implant loading protocols: a literature review of clinical studies. J Prosthet Dent 94: 242–258.
  20. Ostman PO (2008) Immediate/early loading of dental implants. Clinical documentation and presentation of a treatment concept. Periodontol 2000 47: 90–112. [crossref]
  21. Strub JR, Jurdzik BA, Tuna T (2012) Prognosis of immediately loaded implants and their restorations: a systematic literature review. J Oral Rehab 39: 704–717.
  22. Degidi M, Piattelli A, Felice P, Carinci F (2005) Immediate functional loading of edentulous maxilla: a 5-year retrospective study of 388 titanium implants. J Periodontol 76: 1016–1024.
  23. Balshi SF, Wolfinger GJ, Balshi TJ (2005) A prospective study of immediate functional loading following the Teeth-in-a-Day protocol: a case series of 55 consecutive edentulous maxillas. Clin Implant Dent Relat Res 7: 24–31.
  24. Agliardi EL, Pozzi A, Stappert CFJ, Benzi R, Romeo D, et al. (2014) Immediate fixed rehabilitation of the edentulous maxilla: a prospective clinical and radiological study after 3 years of loading. Clin Implant Dent Relat Res 16: 292–302.
  25. Gillot L, Canna B, Buti J, Noharet R (2012) A retrospective cohort study of 113 patients rehabilitated with immediately loaded maxillary cross-arch fixed dental prostheses in combination with immediate implant placement. Eur J Oral Implantol 5: 71–79.
  26. Grunder U (2001) Immediate functional loading of immediate implants in edentulous arches: two-year results. Int J Periodontics Restorative Dent 21: 545–551.
  27. Covani U, Orlando B, D’Ambrosio A, Sabattini VB, Barone A (2012) Immediate rehabilitation of completely edentulous jaws with fixed prostheses supported by implants placed into fresh extraction sockets and healed sites: a 4-year evaluation. Implant Dent 21: 272–279.
  28. Ji TJ, Kan JY, Rungcharassaeng K, Roe P, Lozada JL (2012) Immediate loading of maxillary and mandibular implant-supported fixed complete dentures: a 1- to 10-year retrospective study. J Oral Implantol 38: 469–477.
  29. De Bruyn H, Raes S, Ostman PO, Cosyn J (2014) Immediate loading in partially and completely edentulous jaws: a review of the literature with clinical guidelines. Periodontol 2000 66: 153–187. [crossref]
  30. Zechner W, Tangl S, Fürst G, Tepper G, Thams U, et al. (2003) Osseous healing characteristics of three different implant types. Clin Oral Implants Res 14: 150–157. [crossref]
  31. Burgos PM, Rasmusson L, Meirelles L, Sennerby L (2008) Early bone tissue responses to turned and oxidized implants in the rabbit tibia. Clin Implant Dent Relat Res 10: 181–190. [crossref]
  32. Jemt T, Olsson M, Franke Stenport V (2015) Incidence of First Implant Failure: A Retroprospective Study of 27 Years of Implant Operations at One Specialist Clinic. Clin Implant Dent Relat Res 17 Suppl 2: e501–510.
  33. Andersson P, Degasperi W, Verrocchi D, Sennerby L (2015) A Retrospective Study on Immediate Placement of Neoss Implants with Early Loading of Full-Arch Bridges. Clin Implant Dent Relat Res 17: 646–657. [crossref]
  34. Grossi-Oliveira GA, Antunes AA, Elias CN, Wennerberg A, Sennerby L, et al. (2015) Early Osseointegration Events on Neoss® ProActive and Bimodal Implants: A Comparison of Different Surfaces in an Animal Model. Clin Implant Dent Relat Res 17: 1060–1072.
  35. Sennerby L, Gottlow J, Gottlow J (2017) Integration of Neoss ProActive implants in comparison with other brands of dental implants. Letters Implant Dent 1: 7–20.
  36. Vanden Bogaerde L, Sennerby L (2016) A Randomized Case-Series Study Comparing the Stability of Implant with Two Different Surfaces Placed in Fresh Extraction Sockets and Immediately Loaded. Int J Dent 2016: 8424931. [crossref]
  37. Zumstein T, Sahlin H (2017) The evolution of the Neoss implant system: A retrospective follow-up of three patient cohorts treated with three types of Neoss implants. Letters Implant Dent 1: 35–37.
  38. Tealdo T, Menini M, Bevilacqua M, Pera F, Pesce P, et al. (2014) Immediate versus delayed loading of dental implants in edentulous patients’ maxillae: a 6-year prospective study. Int J Prosthodont 27: 207–214. [crossref]
  39. Blomberg S (1987) Psychological response. In Brånemark, Per-Ingvar; Zarb, George A.; Albrektsson, Tomas (eds) Tissue-Integrated Prostheses: Osseointegration in Clinical Dentistry, Chicago, Quintessence, pp: 16.

Asymmetrical Naproxen-Conjugated Dendrimer for Targeted- Drug Delivery to Human Prostatic Adenocarcinoma Cancer Cells

DOI: 10.31038/JPPR.2019235

Abstract

Naproxen was directly conjugated to NH2-terminated dendrimers by an amide bond and OH-terminated dendrimers by an ester bond. The drug-conjugated polyamidoamine dendrimers showed better cellular uptake than free naproxen. Free naproxen and conjugates in vitro cytotoxicity studies were performed in U251, PC3, K-562, HCT-15, MCF-7 and SKLU-1 cancer cells using different cytotoxicity assays. Naproxen-conjugates of first and second generation showed significant cytotoxic effects in human prostatic adenocarcinoma PC-3 and human mammary adenocarcinoma MCF-7. Moreover, the naproxen-conjugates improved cytotoxicity compared to free naproxen. The increased therapeutic efficacy was observed in specific naproxen conjugates of first generation using low doses, demonstrating that the conjugate was as potent as the antiproliferative agent cisplatin.

Keywords

Polyamidoamine-dendrimers, Naproxen-conjugates, Anti-cancer activity.

Introduction

Dendrimers are homogeneous structures from their nucleus to their terminal group, and also in their internal branching moieties. Dendrimers have unique properties, such as monomolecular weight and good biocompatibility. Dendrimers are spherical three-dimensional structures with exchanged surface functionalities [1–3]. Dendrimers have a great potential for applications in many fields, including drug/gene delivery, as catalysts, and in bioimaging. Among these, applications have been a key focus of research in nanotechnology and nanobiology [4,5]. Bioactive compounds could be joined with the dendrimers and can act as efficient nanocarriers of the bioactive compounds [6]. Naproxen (Nap, see Scheme 2) is a member of the class of Non-steroidal Anti-Inflammatory Drugs (NSAIDs). As one of the most commonly-used cyclooxygenase (COX) inhibitors, it has been used for the treatment of many inflammation-associated conditions, e.g. arthritis, gout, tendinitis, and bursitis [7,8]. Although some COX-2 inhibitors were demonstrated to be related to increases in the risk of cardiovascular events and gastrointestinal adverse effects [9–11], an emerging body of data suggests that Nap rarely increases the risk of adverse cardiovascular events compared to other NSAIDs. In the literature, the synthesis of dendrimers with naproxen as conjugates or complexes has been reported, improving the solubility and the permeability of the drug. It was also was found that the conjugates of naproxen showed anticancer activity [7–13]. Recently, we designed and synthesized several types of NSAIDs-modified dendrimers with good drug-delivery properties [12,13]. Herein we have further designed and developed naproxen and poly-amidoamine-modified dendrimers as possible targeted drug carriers towards human prostatic adenocarcinoma and human mammary adenocarcinoma cancer cells.

Materials and Methods

1H and 13C NMR spectra were recorded on a Varian Unity-300 MHz with Tetramethylsilane (TMS) as an internal reference.  Infrared (IR) spectra were measured on a Nicolet FT-SSX spectrophotometer. Elemental analysis was determined by Galbraith Laboratories, INC Knoxville. FAB+ mass spectra were taken on a JEOL JMS AX505 HA instrument. Electrospray mass spectra were taken on a Bruker Daltonic, Esquire 6000. MALDI-TOF mass spectra were taken on a Bruker Omni FLEX using 9-nitroanthracene (9NA) as a matrix. The UV-vis absorption spectra were obtained at room temperature with a Shimadzu 2401 PC spectrophotometer.

Characterization of the Conjugates

1H and 13C NMR spectra were recorded on a Varian Unity-300 MHz with tetramethylsilane (TMS) as an internal reference.  Infrared (IR) spectra were measured on a Nicolet FT-SSX spectrophotometer. Elemental analysis was determined by Galbraith Laboratories, INC Knoxville. FAB+ mass spectra were taken on a JEOL JMS AX505 HA instrument. Electrospray mass spectra were taken on a Bruker Daltonic, Esquire 6000.  MALDI-TOF mass spectra were taken on a Bruker Omni FLEX using 9-nitroanthracene (9NA) as a matrix. The UV-vis absorption spectra were obtained at room temperature with a Shimadzu 2401 PC spectrophotometer.

Anticancer Screening

U-251 (human glioblastoma), PC-3 (human prostatic adenocarcinoma), K-562 (human chronic myelogenous leukemia cells), HCT-15 (human colorectal adenocarcinoma), MCF-7 (human mammary adenocarcinoma), SKLU-1 (human lung adenocarcinoma) cell lines were supplied by the National Cancer Institute (USA). COS 7 Monkey African green kidney, SV40 transformed cells were supplied by National Cancer Institute (USA). Cytotoxicity assays were determined using the protein-binding dye sulforhodamine B (SRB) in microculture to measure cell growth, as described [12,13]. Conjugates of naproxen and polyamidoamine dendrimers were prepared in 2 % DMSO and added into the culture medium immediately before use. Control cells were treated with 2 % DMSO. For the assay with COS 7 Monkey African green kidney, SV40 transformed, the tested compounds were dissolved in fresh culture medium with 2% DMSO to afford different concentrations (1, 10, 50, 100 μmol/L).

Results and Discussion

Synthesis of Ethanolamine Polyaminoamide Dendritic Arms Dendrimers

The PAMAM dendrimers were synthesized by a divergent approach using ethanolamine as the core. This methodology involves typical stepwise and iterative two-step reaction sequences, consisting of the Michael addition of primary amines with methyl acrylate and the amidation of methyl ester groups with ethylendiamine to produce amine terminations (Scheme 1).

JPPR 19 - 119 - Martínez-García M_F1

Scheme 1. Synthesis of the ethanolamine PAMAM-dendrimers

JPPR 19 - 119 - Martínez-García M_F2

Scheme 2. Synthesis of the naproxen chloride 13.

The dendrons of first and second generation were characterized by 1H, 13C NMR, FTIR, UV-Vis spectroscopy and mass spectrometry.

Synthesis of Naproxen Chloride

After that, from the naproxen acid, the naproxen chloride with thionyl chloride in CH2Cl2 at reflux for 3h was obtained (Scheme 2) and characterized by 1H, 13C NMR and mass spectrometry.

Synthesis of Naproxen Dendrimers

The naproxen chloride was coupled to the dendrons with ethanolamine and amine terminal groups (Chart 1). For the NMR spectra of compounds 7 and 8, methanol deuterated was used as solvent. Their peaks were similar to those of compounds 2 and 4. The high-resolution mass spectra results of compounds 7 and 8 were 926.4 and 1806.8 m/z, respectively.

JPPR 19 - 119 - Martínez-García M_F3

Chart 1. Naproxen derivatives of first 7 and second 8 generation.

In the 1H NMR spectra, the following signals were observed: at δH 8.26 one broad signal due to the NH groups, three broad signals at δH 7.73–7.12 assigned to the Ar protons from naproxen, one singlet at δH 3.83 for the OCH3 groups, one broad signal at δH 3.75 for the CH protons due from the naproxen moiety, three broad signals at δH 3.38–2.24 due to the dendritic branches and finally at δH 1.39, one broad signal for the CH3 from the naproxen moiety.

Cytotoxicity of Naproxen conjugates

The cytotoxic activity of the synthesized PAMAM-ethanol derivatives 3, 4 and the conjugate compounds of naproxen 7 and 8 were chosen for evaluation of their biological activity against cancer cell lines. We screened in vitro against seven human cancer cell lines: U251 (human glioblastoma), PC-3 (human prostatic adenocarcinoma), K-562 (human chronic myelogenous leukemia cells), HCT-15 (human colorectal adenocarcinoma), MCF-7 (human mammary adenocarcinoma), SKLU-1 (human lung adenocarcinoma). As a control, we also tested against the COS-7 African green monkey kidney cell line. The free naproxen and cisplatin were used to compare the antiproliferative activity of the dendrimers 3, 4 and 7, 8. The dendrimers 3 and 4 with two and four NH2 terminal groups at 10 µM showed low anticancer activity against all the cells used. In the case of the conjugates 7 and 8, the concentration of the conjugate was diluted in 3 and 5 times to have the anticancer activity for one molecule of naproxen and compare it to the free naproxen. Table 1 shows the normalized percentage of inhibition of the growth that allows comparing the activity of the same amount of naproxen in its free state and when it is contained in the conjugates of compounds 7 and 8.

Table 1. Cytotoxic activity of the compounds 3, 4, 7 and 8 at 10 mM.

% of  inhibitión

Sample

U251

PC-3

K562

HCT-15

MCF-7

SKLU-1

COS7

3

NC

1.8±2.2

1.6±1.1

NC

1.8±1.2

NC

NC

4

NC

1.2±1.7

1.9±1.2

0.6±0.6

1.1±1.3

NC

NC

7

4.5±1.4

53.0±2.2

6±1.5

7.5±0.8

33.0±1.0

11.1±1.3

NC

8

5.1±1.1

59.4±1.1

7.1±1.4

8.1±1.3

38.5±1.9

15.3±0.8

NC

Naproxen

NC

NC

1.76

2.23

6.43

NC

NC

Cisplatin

87.49

42.65

79.15

32.42

32.42

81.35

42.39

NC = non cytotoxic.

Cisplatin was tested at the same concentration of 10 µM. The initially obtained cytotoxic screening data (Table 1) showed that at 10 µM, the conjugate 7 showed good inhibition activity 53.0±2.2 (%) against the human prostatic adenocarcinoma PC-3 cell line and 33.0±1.0 % against human mammary adenocarcinoma MCF-7 cell line, this activity was higher than the free naproxen. The conjugate 8 showed better activity from 15.3±0.8 to 39.4±1.1 against PC-3, MCF-7 SKLU-1 in comparison with the naproxen alone. For the dendrimer conjugate naproxen 7 the activity against PC-3 and MCF-7 was very close to that of cisplatin. The antiproliferative results obtained with the conjugates of naproxen 7 and 8 were compared to cisplatin, as a reference anticancer drug. The compounds 3, 4 and the conjugates 7 and 8 did not show any activity against the COS-7 African green monkey kidney cell line.

Conclusion

Naproxen was directly conjugated to NH2-terminated dendrimers by an amide bond and OH-terminated dendrimers by an ester bond. The drug-conjugated polyamidoamine dendrimers showed better cellular uptake than free naproxen. Free naproxen and conjugates’ in vitro cytotoxicity studies were performed in U251, PC3, K-562, HCT-15, MCF-7 and SKLU-1 cancer cells using different cytotoxicity assays. Naproxen-conjugates of first and second generation showed significant cytotoxic effects in human prostatic adenocarcinoma PC-3 and human mammary adenocarcinoma MCF-7. Moreover, the naproxen-conjugates improved cytotoxicity compared to the free naproxen. The increased therapeutic efficacy was observed in specific naproxen conjugates of first generation using low doses demonstrating that the conjugate was equally potent as the antiproliferative agent cisplatin.

Supplementary Material

Supplementary material is associated with this manuscript. It contains general experimental procedures, compound characterization data, and copies of 1H and 13C NMR spectra of representative compounds.

Acknowledgment

This work was supported by DGAPA IN101117 grants. EMK was supported by a postdoctoral fellowship from CONACyT-México. We would also like to thank Rios O.H., Velasco L., Huerta S.E., Patiño M.M.R., Peña Gonzalez M.A., Rios Ruiz L. and Garcia Rios E. for technical assistance.

References

  1. Sadekar S, Ghandehar H (2012) Transepithelial transport and toxicity of PAMAM dendrimers: Implications for oral drug delivery. Adv Drug Delivery Rev 64: 571–88.
  2. Mignani S, El Kazzouli S, Bousmina M, Majoral JP (2013) Expand classical drug administration ways by emerging routes using dendrimer drug delivery systems: A concise overview. Adv Drug Delivery Rev 65: 1316–30.
  3. Kesharwani P, Jain K, Kumar NJ (2014) Dendrimer as nanocarrier for drug delivery Progress in Polymer Science. 39: 268–307.
  4. Huang D, Wub D (2018) Biodegradable dendrimers for drug delivery. Materials Science & Engineering 90: 713–27.
  5. Sherje AP, Jadhav M, Dravyakar BR, Kadam D (2018) Dendrimers: A versatile nanocarrier for drug delivery and targeting. Inter J of Pharmaceutics 548: 707–20
  6. Kesharwani P, Gothwal A, Iyer AK, Jain K, Chourasia MK, Gupta U (2018) Dendrimer nanohybrid carrier systems: an expanding horizon for targeted drug and gene delivery. Drug Discovery Today 23:300–14.
  7. Zhao Y, Zeng Q, Wu F, Li J, Pan Z, et al (2016)  Novel naproxen-peptide-conjugated amphiphilic dendrimer self-assembly micelles for targeting drug delivery to osteosarcoma cells. RSC Adv 6: 60327–60335
  8. Gasparini G, Longo R, Sarmiento R, Morabito A (2003) Inhibitors of cyclo-oxygenase 2: a new class of anticancer agents? Lancet Oncol 4: 605–615.
  9. Najlah M, Freeman S, Attwood D, D’Emanuele A (2007) In vitro evaluation of dendrimer prodrugs for oral drug delivery. Inter J of Pharmaceutics 336:183–90.
  10. Najlah M, Freeman S, Khoder M, Attwood D, D’Emanuele A (2017) In Vitro Evaluation of Third Generation PAMAM Dendrimer Conjugates. Molecules 22:1661–1673.
  11. Ouyanga  L, Mac  L, Lia  Y, Pana  J, Guoa L (2010) Synthesis of water-soluble first generation Janus-Type dendrimers bearing Asp oligopeptides and naproxen. ARKIVOC: 256–66
  12. Padilla-Monroy S, Martínez-Klimova E, Ramírez-Ápan T, Nieto-Camacho A, Calderón-Pardo J, et al (2018) Porphyrin Conjugates of Ibuprofen and their Antiproliferative Activity Against Human Prostate and Breast Cancer Cells. Biointerface Research in Applied Chemistry 8: 3039–48.
  13. Pedro-Hernández LD, Martínez-Klimova E, Cortez-Maya S, Mendoza-Cardozo S, Ramírez-Ápan T, et al (2017) Synthesis, Characterization and Nanomedical Applications of Conjugates Between resorcinarene-Dendrimers and Ibuprofen. Nanomaterials 7: 163–73.

Myelinated nerve fiber layer associated with other ocular pathology in a 20-year-old myopic man

DOI: 10.31038/JCRM.2019235

Abstract

Background: Myelinated retinal nerve fibers (MRNFs) are usually unilateral and asymptomatic benign lesions associated with mild hypermetropia, emmetropia, or severe myopia. We describe herein an myopic patient with a syndrome of ipsilateral myelinated retinal nerve fibers associated with other pathological changes: epiretinal membrane with pseudohole, vitreomacular traction syndrome and bilateral lattice degeneration.

Methods: Extended ophthalmoscopy was used to evaluate retinal posterior segment. Infrared reflectance imaging helped in visualizing sub-retinal pathology. Detailed images from within the retina were obtained by using optical coherence tomography.

Results: Ophthalmologic examination revealed ipsilateral small temporal myopic conus with lattice degeneration temporally and inferotemporally. The area of myelinated nerve fiber extended into the pappilomacular bundle, but did not reach the fovea. At the fovea, an epiretinal membrane with clinically visible vitreomacular traction and some retinal elevation was found. In the peripheral fundus areas of lattice degeneration temporally and inferiorly was also noted. The OCT scans of the affected eye showed an incomplete posterior vitreous detachment with traction of a thickened posterior hyaloid base to the fovea. There was distortion of the foveal anatomy with a small amount of subfoveal fluid but a full-thickness macular hole could not be detected. Macular traction detachment of retina and epiretinal membrane with macular hole were treated surgically (S/P Repair Complex RD (25g, 20% SF6, membrane peel with gas endotamponade) and vitreomacular traction was released. Lattice degeneration was treated by laser (S/P Laser).

Conclusions: MRNF lesions were stable and although associated with other ocular pathology progression was not observed during follow-up.

Keywords: Myelinated – Myopia – Lattice degeneration – Vitreomacular traction – Coherence tomography

Introduction

Myelinated retinal nerve fibers (MRNFs) are usually unilateral and asymptomatic benign lesions of the retina around the optic disk [1–2]. but it could also be found in other parts of the retina and in fovea [3]. During embryonic development the retinal nerve fibers may retain the myelin coat resulting in abnormal intraocular myelination of the peripheral nerve anterior to the lamina cribrosa [4]. The MRNF may be inherited but early-age trauma to the eye damaging lamina cribrosa may let oligodendrocytes to pass to the retina causing myelination [5]. MRNF has been associated with mild hypermetropia, emmetropia, or severe myopia. The size and the location of opaque nerve fiber patch determine visual field defects in eyes with MRNF [2], [6]. Studying the correlation between the extend of myelinated nerve fibers and refraction anomalies Schmidt D. at al [7]. concluded that myopia only occurred in eyes with wide-spread myelinated nerve fibers but not in eyes with circumscribed myelinated nerve fibers.

Case report

A 20-year-old man presented with severe left eye (OS) central blurred vision worsening during a period of one year. Reading and watching TV were affected activity. On the right eye (OR) he had gradual onset of blurred vision with mildly affected reading. The patient was noted to have an area of myelinated nerve fiber layer in his left eye a number of years ago, which remained stable over several years of follow-up. More recently change in visual acuity of the left eye was noted. The patient’s past ocular history was also notable for anisometropia, but he did not report a history of amblyopia. On examination visual acuity with correction at distance measured 20/25 OD and 20/80 OS. RO examination also revealed a small temporal myopic conus and lattice degeneration temporally – inferotemporally and a few additional areas inferiorly (Fig.1A). Optical Coherence Tomography (OCT) showed normal thickened retinal nerve fibers with an attached hyaloid (Fig.1B). Left eye fundus examination showed abnormal layer of blood vessels and circumferential areas of lattice degeneration temporally and inferotemporally (Fig.1C). The area of myelinated nerve fiber extended into the papillomacular bundle, but did not reach the fovea. At the fovea, an epiretinal membrane with clinically visible vitreomacular traction and some retinal elevation was noted. The OCT scans of the left eye showed an incomplete posterior vitreous detachment with traction of a thickened posterior hyaloid base to the fovea distorting foveal anatomy with a small amount of subfoveal fluid but a full-thickness macular hole could not be detected (Fig. 1D). Myelinated nerve fiber lesions showed hyperreflectibility (Fig. 2). Autofluorescence imaging revealed a dark area in the region of myelinated RNFL (Fig. 3). Macular traction detachment of retina and epiretinal membrane with macular hole were treated surgically (S/P Repair Complex RD (25g, 20% SF6, membrane peel with gas endotamponade) and vitreomacular traction was released. Lattice degeneration was treated by laser (S/P Laser). Initial ocular post-op medication was: Cyclogyl 2%, Gentacidin 0.3%, and Prednisolone Acetate 1%. Three days after surgery Timol (Maleate) 0.25% was added. Retinal examination found periphery laser scarring and lattice degeneration with atrophic hole with laser (inferotemporal). The patient was regularly followed up in order to monitor progression and one year after surgery no disk edema and pallor, no new holes or tears were found and retinal vessels had normal caliber.

JCRM 2019-113 - Dragan Jovanovic USA_F1

Figure 1. Optic disc imaging findings: A, OD color fundus photograph showing circumferential areas of lattice degeneration emporally – inferotemporally. B, OD OCT showing normal thickened retinal nerve fibers with an attached hyaloid . C, OS color fundus photograph showing a large area of MNFL extended into the papillomacular bundle without reaching the fovea. D, OS OCT showing an incomplete posterior vitreous detachment with traction of a thickened posterior hyaloid base to the fovea. Distorted foveal anatomy with a small amount of subvoveal subretinal fluid.

JCRM 2019-113 - Dragan Jovanovic USA_F2

Figure 2. OCT of the right and of the left eye showed hyperreflectivity of myelinated nerve fiber lesions in the left eye.

JCRM 2019-113 - Dragan Jovanovic USA_F3

Figure 3. Autofluorescence imaging reveals a dark area in the region of the myelinated RNFL in OS.

Discussion

MNFL represent an asymptomatic developmental anomaly in which myelin sheaths extend to retinal nerve fibers along their intraocular portion causing displacement of the axons toward the vitreous body causing decreased vessel density in MRNF areas [8]. In our patient MRNF lesions were stable and although associated with other ocular pathology progression was not observed during follow-up. Cases with regression of MRNF associated with inflammatory diseases and glaucoma were also reported in the literature [9], [10]. Our patients was myopic (OD – 10.25 and OS – 5.50) and ophthalmologic examination revealed a small temporal myopic conus in right eye. High myopia is one of the leading causes of low vision in the world. [11] Genetic and environmental factors play role in its development [12]. Physiological myopia is a common optical aberration [13], but in pathological shortness with irreversible conditions such as retinal detachment, and macular atrophy can lead to blindness. In the myopic eye excessive axial elongation can lead to mechanical stretching and thinning of the choroid and RPE. [14], [15]. Changes in peripheral retina of myopic are predisposing factors for retinal detachment and include lattice degeneration, white-without-pressure, pigmentary degenerations, and retinal tears and holes. Association of extensive myelinated nerve fibers and high degree myopia have been reported [16]. Ellis et al [17] found that 83% of patients with myelinated retinal nerve fibers had myopia greater than 6 diopters. It is not clear whether myelination of retinal nerve fibers is the reason for or the result of myopia. In patient with myelinated fibers retinal images may be blurred causing visual deprivation. This deprivation may contribute to myopia by including an axial enlargement. On the other hand, it is also possible that axial elongation predisposes to retinal nerve fiber myelination. Straatsma et al [18] found that 10% of patients with myelinated nerve fibers have myopia, ampliopia, and strabismus. Our patient had refractive error of -9.0 in OD and -5.5 in OS. In pathologic myopia progressive chorioretinal degeneration is often associated [19]. In our patient’s OS where MRNF lesions were found posterior cortical vitreous partially separated from the retina (epiretinal membrane) and some tractional areas remain adherent to portions of the macula causing Vitreomacular Traction Syndrome (VTS).

Compliance with ethical standards

Conflict of interest: The authors declare that they have no conflict of interest.

Ethical approval: All procedures performed in studies involving human participants were in accordance with the ethical standards of the institutional and/or national research committee and with the 1964 Helsinki Declaration and its later amendments or comparable ethical standards

Informed consent: Informed consent was obtained from patient’s parents to publish his photo and all other information

References

  1. Straatsma BR, Foos RY, Heckenlively JR, Taylor GN. (1981) Myelinated retinal nerve fibers. Am J Ophthalmol. 91: 25–38.
  2. Kodama T, Hayasaka S, Setogawa T. (1990) Myelinated retinal nerve fibers: Prevalence, location and effect on visual acuity. Ophthalmologica. 200: 77–83. [Crossref]
  3. Serdar O, Mehmet YT. (2017) Ring-shaped myelinated retinal nerve fibers at fovea. Indian J Ophthalmol. 65(7): 630–632. [Crossref]
  4. Darin RG. (2018) Atlas of Retinal OCT. Optical Coherence Tomography 2018, Elsevier;2018
  5. Prakalapakorn SG, Buckley EG. (2012) Acquired bilateral myelinated retinal nerve fibers after unilateral optic nerve sheath fenestration in a child with idiopathic intracranial hypertension. J Pediatr Ophthalmol Strabismus. 16: 534–8. [Crossref]
  6. Bradley R. Straatsma, John R. Heckenlively, Robert Y. Foos, and John K. (1979) Shahinian, Myelinated retinal nerve fibers with ipsilateral myopia, amblyopia, and strabismus. American Jopurnal of Opthalmology. 88: 506–510. [Crossref]
  7. Smitdt D, Meyer JH, Brandi-Dohrn J. (1996–1997) Wide-spread myelinated nerve fibers of the optic disc: do they influence development of myopia? Int Ophthalmol. 20(5): 263–8. [Crossref]
  8. Hollo G. (2016) Infuence of myelinated retinal nerve fibers on retinal vessels density measurement with AngioVue OCT angiography. Int Ophthalmol. 36(6): 915–919. [Crossref]
  9. Sowkia JW, Nadeau MJ. (2013) Regresion of myelinated nerve fibers in a glaucomatous eye. Optom Vis Sci. 90(7): e2018-e220. [Crossref]
  10. Chavis PS, Tabbara KF. (1998) Demyelinization of retinal myelinated nerve fibers in Behcet’s disease. Doc Opthalmol. 95: 157–64. [Crossref]
  11. Hayashi K, Ohno-Matsui K, Shimada N, Moriyama M,Kojima A, Hayashi W, Yasuzumi K, Nagaoka N, Saka N, Yoshida T, Tokoro T, Mochizuki M. (2010) Long-term pattern of progression of myopic maculopathy: a natural history study. Ophthalmology 117: 1595–611. [Crossref]
  12. Pan CW, Zheng YF, Wrong TY, et al. (2012) Variation in prevalence of myopia between generations of migrant Indians living in Singapore. Am J Ophthalmol 154: 376–81. [Crossref]
  13. Baker BJ, Pruett R. (2004) Degenerative myopia. In: Yanoff M, Duker SJ. Ophthalmology: 2nd ed. Spain : Mosby 934–7.
  14. Grossniklaus HE, Green WR. (1992) Pathologic findings in pathologic myopia: Retina 12(2): 127– 133. [Crossref]
  15. Rabb MF, Garoon I, LaFranco FP. (1981) Myopic macular degeneration. Int Ophthalmol Clin 21(3): 51– 69. [Crossref]
  16. Elvan Yalcın, Ozlem Balcı, and Ziya Akıngol (2013 ) Indian J Ophthalmol. 61(10): 606–607;
  17. Ellis GS Jr, Frey T, Gouterman RZ. (1987) Myelinated nerve fibers, axial myopia, and refractory amblyopia: An organic disease. J Pediatr Ophthalmol Strabismus 24: 111–9. [Crossref]
  18. Straatsma BR, Heckenlively JR, Foos RY, Shahinian JK. (1979) Myelinated retinal nerve fibers associated with ipsilateral myopia, amblyopia, and strabismus. Am J Ophthalmol 88: 506–10). [Crossref]
  19. Soubrane  G, Coscas G.J. (2001) Choroidal neovascularization in degenerative myopia. In: Ryan SJed. Retina. 3rd St Louis, Mo Mosby Inc 1136–1152.

What do we know about Food Cravings and Aversions during Pregnancy?

DOI: 10.31038/IGOJ.2019234

Abstract

During pregnancy, it is very common for women to make changes in the choice of foods they eat and often experience cravings and aversions to certain foods. The purpose of this narrative review is to describe the current state of knowledge about the different hypotheses that try to explain the presence of food cravings and aversions during pregnancy and to know the occurrence of these phenomena in different geographical contexts.

The most studied hypothesis relates to food aversions to maternal-fetal protection mechanisms; others with less sustenance link them as preventive of the metabolic syndrome, as a consequence of shortage of resources or compensatory of placental growth. The hypotheses that explain the appearance of food cravings relate them as a consequence of a search for nutrients or active compounds present in the foods craved for, or as a consequence of the hormonal fluctuations that are special to pregnancy.

The prevalence with which cravings and aversions occur varies from 38 to 79%, being less frequent in European populations and more common in the African continent. In general terms, foods craved by pregnant women in Western cultures are chocolate, fruits and fruit juices, sweet foods and, to a lesser extent, meats and dairy products. In geographical contexts of socio-economic vulnerability, foods of animal origin such as meat, cheese and milk, followed to a lesser extent by vegetables, fruits and grains, emerge as usually cravings.

Protein-rich foods of animal origin are largely rejected by pregnant women in Western countries, while cereals and vegetables are frequently avoided by pregnant women in Africa and Asia.

Keywords

Pregnancy, Cravings, Aversions, Food Choice

Introduction

Pregnancy is a complex and vitally important period and its physiology is of great biological and nutritional importance since the contribution of nutrients must be adequate in quantity, quality and distribution so that both the process of embryogenesis and development of the fetus and health of the mother are adequate [1, 2].

It is common for pregnant women to make changes in the choice of foods they eat, which are the result of a complex set of biological and cultural interactions that have implications for maternal and child health [3–6]. Within these food variations appear phenomena that pregnant women frequently experience: cravings and aversions to certain foods. These phenomena, in which causes and consequences are little known, are usually considered as anecdotal and marginal [7].

Several conceptualizations and definitions have been used in relation to the terms “cravings” [4,6,8–11] and “aversions”[4,6,8,10–12], among them the one used by Weigel, who points out that they are phenomena with the following characteristics: sudden appearance, strong intensity and absence prior to pregnancy [11].

It is important to distinguish food cravings during the pregnancy from pica, a condition characterized by the persistent and compulsive consumption of non-nutritive substances such as earth and clay (geophagia), ice (pagophagia), among others [13, 14]. In the case of aversions, it is necessary to differentiate them from food taboos, in which certain foods are not culturally accepted as suitable for consumption in particular phases of the life cycle, such as pregnancy. Taboos in most cases seem to be meaningless since the characterizations of food vary from one population group to another [15, 16].

The important physiological changes of pregnancy, especially hormonal ones, could in part give an answer to understand the complex plot of possible causes that cause food cravings and aversions in the pregnant woman [17–20]. (Graph 1) outlines the hormonal interactions that could influence on the appearance of food cravings and aversions.

IGOJ 2019-112 - Laura Beatriz López Argentina_F1

Graph 1. Possible hormonal influence on food cravings and aversions.

The rabbi, physician and philosopher Maimonides (1138–1204) was one of the first to take into account changes in maternal physiology to describe food cravings, and proposed the theory that they were the result of an imbalance in body fluids, caused by the accumulation of “bad liquids” in the stomach folds of pregnant women, due to their inability to release menstrual blood during conception. When these liquids penetrated the stomach, a woman craved sour and spicy things until these unpleasant juices were eliminated by the vomit. As the pregnancy progressed and the growing fetus reduced the penetration of these fluids, women would be less susceptible to cravings and nausea [21].

Since then and until now, food cravings and aversions during pregnancy have been the focus of research and debate among anthropologists, nutritionists and public health professionals.

The present work consists of a narrative review that aims at describing the current state of knowledge about the different hypotheses that try to explain the presence of food cravings and aversions during pregnancy and to know the occurrence of these phenomena in different geographical contexts.

Hypothesis about the Presence of Food Aversions

Several hypotheses centered on a biological perspective have been postulated in order to understand why some pregnant women present food aversions; possibly the hypothesis of maternal-fetal protection has been the most studied. Other explanations with less bibliographic support link dietary aversions as preventive of the metabolic syndrome during pregnancy, or related to shortage of resources, or as a compensation mechanism for placental growth.

“Maternal-fetal protection hypothesis”

This theory is based on the fact that food aversions could protect the embryo or fetus against certain toxins at a moment of extreme vulnerability: organogenesis. Of the approximately 280 days that gestation lasts, embryonic tissues are more susceptible to teratogenic damage during certain well-defined critical periods, when cell division and differentiation and the morphogenesis of various systems and organs reach a simultaneous peak, produced between weeks 6 and 18. [10]. If the presence of food aversions occurs mostly during these periods, the pregnant woman could have developed different adaptive mechanisms to face the challenges of pregnancy.

This hypothesis is based on the year 1940, when Irving, in a study from Boston, observed that pregnant women with gravid hyperemesis had fewer spontaneous abortions than the usual expectation for that moment, postulating a possible association between nausea and vomiting with positive results during pregnancy [10, 22, 23].

Thirty-six years later, Ernest Hook resumed this observation and raised the “embryo protection hypothesis”, suggesting that in early pregnancy nausea, vomiting, food aversions, together with anatomical and sensory changes evolved as a complex set of symptoms that would make pregnant women avoid or expel foods with strong smells or flavors that could be potentially toxic and / or teratogenic. Their observations were based on the decrease in alcohol consumption, caffeine and the desire to smoke that women presented during pregnancy, which were explained by sensory changes and by nausea and vomiting, symptoms that could act as fetusprotectors [24].

Later in 1988, this hypothesis is extended by Margie Profet [25, 26], who proposes that nausea, vomiting and food aversions would be an evolutionary adaptation mediated by the modification of taste and olfactory sensibility to protect the embryo against the maternal ingestion of “toxins” present in some foods. Certain “toxic” plants that supposedly contain high levels of potentially abortive or teratogenic phytochemicals should be avoided. While humans commonly ingest phytochemicals naturally present in vegetables, and also selectively use phytochemicals in the preparation of food (spices), some of them could be potentially harmful during pregnancy, such as those present in bitter-tasting vegetables and spicy foods with strong flavor. Profet also suggests that the methods of cooking by frying, roasting or toasting would be the frequently aversive or avoided because their strong smells would indicate the presence of potentially mutagenic compounds, as well as decaying animal foods that emit suggestive smells due to the presence of parasites and / or bacteria that cause deterioration and produce toxins. On the other hand, it could be predicted that the best tolerated foods would be those that have mild smells and flavors and that do not decompose easily, such as breads, cereals and processed grains.

Later on, other authors deepened this hypothesis by renaming it “maternal-embryo protection hypothesis”, theorizing that pregnant women learn to avoid and / or expel through vomit potentially dangerous foods, not only for their embryos in development but also for themselves [8,11,12,27,28]. As part of this adaptation that evolved, in a coordinated way, the vomit would expel the noxious substance, while the nausea would be produced by an experience of aversion [27].

Hypothesis about “dietary aversions as preventive of the metabolic syndrome during pregnancy”

This proposal suggests that aversions during pregnancy may have evolved, in part, to motivate women to avoid eating foods that increase the risk of developing certain chronic non communicable diseases, particularly gestational diabetes mellitus [28–30].

Following this line of reasoning, dietary aversions would be an evolutionary tactic in populations without a long history of cereal cultivation to avoid the metabolic syndrome. This idea is based on evidences that come from populations in which, historically; the sugar necessary for fetal growth was not available due to a shortage of cereals, grains and starches or due to intense and regular cycles of hunger. In these cases, aversions to these carbohydrate-rich foods were possibly a mechanism to prevent the gestational metabolic syndrome [28, 29].

Hypothesis about “Scarcity of resources”

From the evolutionary biology, certain authors support that a decrease of the alimentary aversions during pregnancy in vulnerable populations could be predicted, with an important load of infectious diseases, with alimentary insecurity and anthropometric indexes that indicate a deficient maternal nutrition. However, studies in which all these associated factors were evaluated could not demonstrate their relationship with the food aversions of pregnant women [12, 31, 32].

Hypothesis about “Compensation of placental growth”

This hypothesis suggests that dietary aversions in the early stages of pregnancy would improve the growth of the placenta; thus, the fetus would exert a “manipulation” upon the maternal physiology, in such a way that mothers are motivated to avoid highly energetic meals. The restriction of maternal energy would benefit the fetus because, according to this hypothesis, mothers with restricted energy intake will prioritize the destiny of any resource that they have available for the development of the placenta and the embryo [28,33]. This position was based on observations of the severe hunger that affected the West of the Netherlands between the years 1944–1945 and its relationship with the weight of the placenta and neonate [28]. It was observed that when the period of maternal malnutrition occurs only during the first trimester, moment that coincides with the highest prevalence of food aversions, the neonates have weights within the normal range and greater weight of the placenta, effects that are not observed in undernourished mothers in the second half of pregnancy. This finding, which is also observed in animals, suggests that malnutrition in the first trimester would lead to a compensatory placental growth [33–35].

Hypothesis about the presence of food cravings

Different statements try to explain the reasons that could be responsible for the presence of cravings during pregnancy. The hypotheses found are: the search for nutrients or cravings in response to nutritional deficiencies; cravings in relation to the presence of active compounds in the desired foods and cravings as a result of hormonal fluctuations.

Hypothesis: “Cravings as a search for nutrients” or “In response to nutritional deficiencies”

From a biological perspective, it was postulated that cravings could serve to provide depleted nutrients in maternal diets, [9, 28]. This position considers craving as a mechanism to ensure adequate and balanced nutrition during pregnancy, which would motivate pregnant women to seek and consume foods rich in energy and micronutrients essential for fetal development.

Some authors consider that taking into account that the nutritional needs of the fetus increase as their development progresses, the intensity of the cravings should follow the same upward trajectory [9,28,36].

In 2002, the anthropologist Daniel Fessler, from an evolutionary perspective, also suggests that pregnant women may have a particular predisposition to seek through cravings, missing nutrients from their diets due to losses caused by aversions and vomiting; that is, there would be a functional link between cravings and food aversions [27]. These interactions were observed in pregnant women who had aversions to certain foods and they were more likely to have cravings compared to those who did not have food rejections [3]. However, this synergy between aversions and food cravings still remains a controversial issue that requires greater evidence from different geographical, social or cultural contexts [10].

Hypothesis: “Cravings are due to the presence of active compounds in the desired foods”

It is suggested that cravings could be due to the presence of active compounds (phytonutrients) in the desired foods [9]. The benefits of potentially bioactive ingredients are due to the possible ability to alleviate physical and perhaps psychological symptoms associated with pregnancy, such as fatigue, irritability and cramps, among others [9]. Chocolate being one of the foods most desired by pregnant women in some contexts, it is pointed out that women’s inclination to it could be cyclical and hormone dependent [9]. The biologically active components of chocolate such as methylxanthines, biogenic amines and cannabinoid-like fatty acids can trigger transient feelings of well-being during pregnancy [37]. However, this relationship is also questioned because the potentially active ingredients of chocolate are present in small quantities, which would make their potential benefits unlikely [9].

Hypothesis: “Cravings are due to hormonal fluctuations”

This hypothesis relates the presence of cravings with the sensory modifications resulting from the hormonal changes that occur during pregnancy. Several hormones such as estrogen, progesterone, leptin, ghrelin and neropeptide Y, among others, change significantly in this period affecting sensory perception with an increase in sensitivity to smells, taste and smell and indirectly being able to influence the selection pattern of the food. [9, 37, 39]. Despite these observations, there is an information gap that relates the exact nature of the link between hormonal fluctuations during pregnancy and food cravings [9].

(Table 1) summarizes the most relevant hypotheses and their foundations on the possible causes of the appearance of food aversions and cravings during pregnancy.

Table 1. Most relevant hypotheses and their foundations upon the possible causes of the appearance of food aversions and cravings during pregnancy.

Hypotheses

Authors, year (Reference)

Foundations

AVERSIONS


Maternal-fetal protection

Hook, 1978 (23)
Profet, 1988 (24)
Bayley, 2002 (8)
Fessler, 2002 (26)
Weigel, 2011 (11)
Placek, 2015 (12) McKerracher, 2016 (27)

Nausea and vomiting work to protect the embryo by expelling dangerous chemicals transmitted by food and resulting in subsequent aversion. At first, the possible relationship between nausea, vomiting and aversions to alcohol, coffee and tobacco is explored. Then, this hypothesis is extended to certain “toxic” potentially abortive or teratogenic plants.

After this, the presence of nausea and vomiting is linked to the development of food aversions and it is theorized that pregnant women learn to avoid and / or expel through vomit potentially dangerous foods not only for the developing embryo, but also for themselves.

Preventive of the metabolic syndrome during pregnancy

Haig, 1996 (44)
McKerracher, 2016 (27)

The aversions during pregnancy may have evolved, in part, to motivate women to avoid eating foods that increase the risk of developing metabolic syndrome and / or gestational diabetes mellitus.

Scarcity of resources

Holland, 2003 (45)
Placek, 2012 (12)

Food insecurity and anthropometric indices that indicate poor maternal nutritional status could predict a decrease in dietary aversions during pregnancy.

Compensation of placental growth

Huxley, 2000 (30).
McKerracher, 2016 (27)

Malnutrition in the first trimester of pregnancy, a period that coincides with food aversions, would lead to compensatory placental growth.

CRAVINGS

Search for nutrients or in Response to nutritional deficiencies

Tierson, 1985 (33)
Orloff, 2014(9)
McKerracer, 2016 (27)

They consider craving as a mechanism to ensure adequate and balanced nutrition during pregnancy, in which women are motivated to seek and consume foods rich in energy and micronutrients essential for fetal development.

Presence of active compounds in the desired foods

Orloff, 2014 (9)

The pregnant woman, through cravings, consumes food with bioactives that produce a sensation of well-being.

Hormonal Fluctuations

Orloff, 2014 (9)

There is a relationship between hormonal changes and the frequency and intensity of cravings in pregnant women.

Although there may be a biological and evolutionary component in the development of these modifications in food preferences, food cravings or aversions do not escape the cultural food patterns that are also involved in the food choices of pregnant women [5]. There are civilizations that have a cultural model in which the cravings must be fulfilled by the pregnant woman, in some cases rituals are performed at the end of pregnancy to ensure that the wishes of the woman and the “fetus” have been fulfilled [9, 12]. However, in other cultural settings, pregnant women do not have a “special” treatment, so cravings are not very valued [12].

In such a way that from an anthropological and cultural perspective, interpreting the meanings behind the expressions of food cravings and aversions and unraveling the biocultural mechanisms of these food choices could be more complex than expected. In addition to evolutionary influences, experiences during an individual’s life can have significant impacts on the nature of food cravings and aversions. Both the context and social status as well as relative wealth can affect the choices of which foods are desired or avoided by the pregnant women [5].

Possible consequences postulated upon the presence of food cravings

Beyond the different theories that can cause food cravings, we have also tried to explain the possible consequences that such cravings could generate in the pregnant woman. A recent explanation suggests a possible association between cravings and the risk of excessive weight gain during pregnancy [9]. This association is based on the high frequency of cravings during pregnancy in North American women, and the increasing increment in the prevalence of pregnant women with greater weight gain than recommended [40–42]. This construction is based on the popular belief that cravings should be fulfilled by pregnant women. A possible explanation could be based on a model in which the cravings result from ambivalence or a tension between giving (please) or avoiding (effort to restrict consumption) the desired food. It is assumed that women, in general, try to resolve this ambivalence in favor of abstinence due to the cultural pattern of thinness, but this model also gives occasional permission to break the restriction, resulting in episodic consumption and potentially excessive of the desired foods [9]. This statement would be supported in part by recent studies [41, 43] that identify cravings during pregnancy as a possible predictor of excess of weight gain.

Another potential risk suggests that cravings for sweet foods are associated with an increased risk of abnormal glucose tolerance and the development of gestational diabetes mellitus [44, 45]. In some studies, women who developed gestational diabetes mellitus had a decreased perception of sweet taste and an increase in food cravings with that taste mainly during the third trimester, compared to healthy pregnant women. However, these associations are weak and other investigations fail to support this association between cravings for sweet-tasting foods and maternal blood glucose levels [45, 46].

Prevalence and characteristic of food cravings and aversions

The prevalence with which cravings occur varies from 40 to 79%, the lowest figure comes from Europe, while the highest prevalence corresponds to the African continent. With respect to food aversions, its occurrence varies from 38% in pregnant women in Asia to 78% in Africa.

The nature of the food desired and / or rejected also has special characteristics according to the geographical context in which they are studied, possibly shaped by cultural, ethnic and / or socio-economic influence. In general terms, foods craved for by pregnant women in Western cultures are chocolate, fruits and fruit juices, sweet foods such as ice cream and desserts and to a lesser extent different types of meat and dairy products. On the other hand, pregnant women in other geographic contexts of greater socioeconomic vulnerability experience cravings mainly for protein foods of animal origin such as meat, cheese and milk followed to a lesser extent by vegetables, fruits and grains.

On the other hand, meat and protein-rich foods such as dairy products are largely avoided by pregnant women from Western countries, followed by coffee, highly spicy foods and to a lesser extent vegetables. Cereals such as wheat, corn and rice and less strongly vegetables and meats are mostly avoided by pregnant women in other geographical areas such as Africa and Asia.

(Table 2) summarizes the prevalence and characterization of food cravings and aversions in different geographical contexts.

Table 2. Prevalence and characterization of food cravings and aversions in different parts of the world.

Author, year (reference)

Place (n)

Prevalence of cravings and foods mostly craved for

Prevalence of aversions and foods mostly aversive

Tsegaye, 1998
(3)

Africa, Etiophia (n:295)

72%
Meat sauce, cheese and milk

65%
Roasted wheat, coffee, wheat bread, meat sauce, kocho and injera.

Nyaruhucha, 2009
(47)

Africa, Tanzania (n: 204)

73%
Meat, mango, yoghurt, orange, banana.

70%
Rice, meat, fish, evo, legumes, tea.

Young, 2012
(5)

Africa, Kenya and Tanzania: (n:188)

56%
Meat and milk.

78%
Corn, millet, rice, buttermilk and blood.
vegetables and fried foods.

Patil, 2012
(48)

Africa, Tanzania (n: 545)

79%
Meat / fish, vegetables, fruits and grains.

63%
Vegetables, meat, fish and grains.

Placek, 2015
(12)

Asia, India (n:149)

50%
Sour foods (immature mango and tamarind), ethnic tasty and strong, vegetables and fruits, grains – starches and meat – sweets.

60%
Fruits, tasty and strong ethnic foods, meat, vegetables and sweets, non-alcoholic beverages, starch-dairy products and ice cream.

Qureshi, 2015
(49)

Asia, Pakistan (n: 110)

78%
Sweets, salty foods, spicy and fried food

38%
Poultry products, sweets, tea, milk and rice and fried foods, legumes, spicy and vegetable foods.

Mc Kerracher, 2016
(27)

Oceania
Fiji Islands, Yasawa (n: 70)

Bananas, mango, green leafy vegetables, fish and meat.

Fish, cassava, meat, non-fish aquatic foods, imported starches, locally grown starches and rarely spicy, sour or bitter-tasting vegetables.

Bayley, 2002
(8)

Europe, Great Britain (n: 99)

61%
Fruits and fruit juices, sweet foods (sweets, chocolates, cookies).

54%
Coffee, high-spiced foods, meats and protein-rich foods.

Hill, 2015
(43)

Europe, Great Britain (n: 1693)

39%
Sweet foods (chocolate, sweets, ice cream, desserts), fruits and dairy products.

Not studied

Coronios Vargas, 1992
(4)

América, USA
(n: 160)

dairy products, chocolate, tea
vegetables, meats, sweets
cereals, fermented fish, fruits a

Vegetables, meats and dairy products.

Weigel, 2011
(11)

América, Ecuador  (n: 849)

69%
Fruits and fruit juices (limes, apples, oranges, grapes, pineapple, tangerines, watermelons, mangoes and strawberries), meats, (poultry, fish, shellfish) eggs, foods rich in carbohydrates with starch.

74%
Different types of meats (beef, pork, lamb, liver, other organs, sausages), poultry (chicken), fish (tilapia, sea bass, tuna), seafood (shrimp, prawns, squid) and chicken or quail eggs, “toxic vegetables” such as cabbage, cauliflower, broccoli, Brussels sprouts, onions, eggplants, tomatoes, turnips, potatoes and mellocos, an indigenous tuber similar to potatoes, white rice, wheat noodles, corn, barley and other foods with carbohydrates with starch.

Orloff, 2014
(9)

América, USA (n: 200)

Sweet foods (chocolate, candies), carbohydrates with high calories and flavors (pizza, chips) animal protein (meats, chicken), fruits, cheeses, creams, other carbohydrates, fast foods.

Not studied.

Orloff, 2016
(38)

América, USA (n: 83)

Sweet foods, as chocolate, cookies, ice creams and fast foods

Not studied.

Farland, 2015
(42)

América, USA (n: 2022)

45%
Sweet foods (candies, desserts, cookies, fruit, fruit juices, cereals with sugar, ice cream, yogurt), salty (chips, fried potatoes, cheeses, fried foods, tasty (eggs, meats, mixed dishes, seafood), starches (bread, rice, pasta, potatoes).

Not studied.

Flaxman, 2000
(10)

Systematic review

Cravings: 21 studies, n: 6239

Aversions: 20 studies, n: 5.432

67%
Fruits and fruit juices, sweet foods, desserts and chocolate, followed by dairy products and cream ice cream and, to a lesser extent, meat.

65%
Meat, fish, poultry and eggs, soft drinks and vegetables

aVariations in the selection according to ethnic origin.

Conclusion

Cravings and food aversions are frequent phenomena that affect the selection of food during pregnancy; its etiology is still unclear. Numerous hypotheses focused on biological, cultural and anthropological approaches attempt to explain their occurrence. Although the description of food cravings and aversions during pregnancy has been studied by various authors, there is no uniformity of criteria in the modalities used for their characterization. Different types of questionnaires, the vast majority of which have not been validated, have been used to identify these phenomena. Having diagnostic tools specially designed to know the occurrence and describe the cravings and aversions during pregnancy is an important step to learn more about the relationship these changes may have in the selection of foods with nutritional status and maternal-fetal health.

Acknowledgement

This Word was supported by the University of Buenos Aires (UBACyT Code: 20020170100385BA).

References

  1. Academy of Nutrition and Dietetics (2014) Position of the Academy of Nutrition and Dietetics: Nutrition and lifestyle for a healthy pregnancy outcome. J Acad Nutr Diet 114: 1099–1103.
  2. Gernand AD, Schulze KJ, Stewart CP, West Jr KP, Parul C (2016) Micronutrient deficiencies in pregnancy worldwide: Health effects and prevention. Nat Rev Endocrinol 12: 274–289.
  3. Tsegaye D, Muroki NM, Kogi-Makau W (1998) Food aversions and cravings during pregnancy: Prevalence and significance for maternal nutrition in Ethiopia. Food and Nutrition Bulletin  19: 85.
  4. Coronios-Vargas M, Toma RB, Tuveson RV, Schutz IM (1992) Cultural influences on food cravings and aversions during pregnancy. Ecol Food Nutr 27: 43–49.
  5. Young AG, Pike IL (2012) A Biocultural Framework for Examining Maternal Cravings and Aversions among Pastoral Women in East Africa. Ecol Food Nutr 51: 444–462.
  6. Patil CL, Young SL (2012) Biocultural considerations of food cravings and aversions: an introduction. Ecol Food Nutr 51: 365–373. [crossref]
  7. Mahaluf ZJ, Nader NA, Correa D, Vargas J, Arraztoa V, et al. (1991) El antojo en la embarazada definición inicial. Rev. Psiquiatr clín 28: 118–125.
  8. Bayley TM, Dye L, Jones S, DeBono M, Hill AJ (2002) Food cravings and aversions during pregnancy: relationships with nausea and vomiting. Appetite 38: 45–51. [crossref]
  9. Orloff NC1, Hormes JM (2014) Pickles and ice cream! Food cravings in pregnancy: hypotheses, preliminary evidence, and directions for future research. Front Psychol 5: 1076. [crossref]
  10. Flaxman SM1, Sherman PW (2000) Morning sickness: a mechanism for protecting mother and embryo. Q Rev Biol 75: 113–148. [crossref]
  11. Weigel MM, Coe K, Castro NP, Caiza ME, Tello N, et al. (2011) Food Aversions and Cravings during Early Pregnancy: Association with Nausea and Vomiting. Ecol Food Nutr 50: 197–214.
  12. Placek CD1, Hagen EH (2015) Fetal Protection : The Roles of Social Learning and Innate Food Aversions in South India. Hum Nat 26: 255–276. [crossref]
  13. López LB, Ortega Soler CR, Pita Martín de Portela ML (2004) La pica durante el embarazo: un trastorno frecuente subestimado. Arch Latinoam Nutr 54: 17–24.
  14. Poy MS, Weisstaub A, Iglesias C, Fernández S, Portela ML, et al. (2012) [Pica diagnosis during pregnancy and micronutrient dificiency in Argentine women]. Nutr Hosp 27: 922–928. [crossref]
  15. Meyer-Rochow VB (2009) Food taboos: their origins and purposes. J Ethnobiol Ethnomed 5: 18. [crossref]
  16. Vasilevski V, Carolan-Olah M (2016) Food taboos and nutrition-related pregnancy concerns among Ethiopian women. J Clin Nurs 25: 3069–3075.
  17. Carlin A, Alfirevic Z (2008) Physiological changes of pregnancy and monitoring. Best Pract Res Clin Obstet Gynaecol 22: 801–823. [crossref]
  18. Purizica M (2010) Modificaciones fisiológicas en el embarazo. Rev PeR Ginecol obstet 56: 57–69.
  19. Ojeda González J, Rodríguez Alvarez M, Estepa Pérez J, Piña Loyola, Cabeza Poblet B (2011) Cambios fisiológicos durante el embarazo. Su importancia para el anestesiólogo. Revista Electrónica de las Ciencias Médicas en Cienfuegos 9: 484–491.
  20. Soma-Pillay P, Nelson-Piercy C, Tolppanen H, Mebazaa A (2016) Physiological changes in pregnancy. Cardiovasc J Afr 27: 89–94. [crossref]
  21. Graves A (2010) Synapse. The Boston University Undergraduate Science magazine. http://www.bu.edu/synapse/2010/07/28/the-mystery-of-pregnancy-cravings/
  22. Irving FC (1940) The treatment of pernicious vomiting of pregnancy. Virginia Medical Monthly 67: 717–724 https://archive.org/details/virginiamedicalm67unse/page/n775.
  23. Flaxman SM, Sherman PW (2008) Morning sickness: adaptive cause or nonadaptive consequence of embryo viability? Am Nat 172: 54–62. [crossref]
  24. Hook EB (1978) Dietary cravings and aversions during pregnancy. Am J Clin Nutr 31: 1355–1362. [crossref]
  25. Profet M (1988) The evolution of pregnancy sickness as protection to the embryo against Pleistocene teratogens. The University of Chicago. Biology Department. Evolutionary theory 8: 177–190.
  26. Profet M (1995) Pregnancy sickness as adaptation: a deterrent to maternal ingestion of teratogens. Adapt Mind 327–365.
  27. Fessler DM (2002) Reproductive immunosupression and diet. An evolutionary perspective on pregnancy sickness and meat consumption. Curr Anthropol 43: 19–61.
  28. McKerracher L, Collard M, Henrich J (2016) Food Aversions and Cravings during Pregnancy on Yasawa Island, Fiji. Hum Nat 27: 296–315.
  29. Brown EA, Ruvolo M, Sabeti PC (2013) Many ways to die, one way to arrive: how selection acts through pregnancy. Trends Genet 29: 585–592. [crossref]
  30. Drewnowski A (1997) Taste preferences and food intake. Annu Rev Nutr 17: 237–253. [crossref]
  31. Haig D (1996) Altercation of generations: genetic conflicts of pregnancy. Am J Reprod Immunol 35: 226–232. [crossref]
  32. Huxley RR (2000) Nausea and vomiting in early pregnancy: its role in placental development. Obstet Gynecol 95: 779–782.
  33. Holland TD, O’Brien MJ (2003) On morning sickness and the Neolithic revolution. Current Anthrop 44: 707–711.
  34. Lumey LH (1998) Compensatory placental growth after restricted maternal nutrition in early pregnancy. Placenta 19: 105–111.
  35. Godfrey K, Robinson S, Barker DJ, Osmond C, Cox V (1996) Maternal nutrition in early and late pregnancy in relation to placental and fetal growth. BMJ 312: 410–414. [crossref]
  36. Tierson FD, Olsen CL, Hook EB (1985) Influence of cravings and aversions on diet in pregnancy. Ecol Food Nutr 17: 117–129.
  37. Räikkönen K, Pesonen AK, Järvenpää A-L, Strandberg TE (2004) Sweet babies: chocolate consumption during pregnancy and infant temperament at six months. Early Hum Dev 76: 139–145.
  38. Nordin S, Broman DA, Olofsson JK, Wulff M (2004) A longitudinal descriptive study of self-reported abnormal smell and taste perception in pregnant women. Chem Senses 29: 391–402. [crossref]
  39. Nordin S, Broman DA, Bringlöv E, Wulff M (2007) Intolerance to ambient odors at an early stage of pregnancy. Scand J Psychol 48: 339–343. [crossref]
  40. Institute of Medicine (2009) Weight Gain During Pregnancy: Reexamining the Guidelines. Washington, D.C. National Academy Press.
  41. Orloff NC, Flammer A, Hartnett J, Liquorman S, Samelson R, et al. (2016) Food cravings in pregnancy: Preliminary evidence for a role in excess gestational weight gain. Appetite 105: 259–265.
  42. Academy of Nutrition and Dietetics (2016) Position of the Academy of Nutrition and Dietetics: Obesity, Reproduction, and Pregnancy Outcomes. J Acad Nutr Diet 116: 677–691.
  43. Allison KC, Wrotniak BH, Pare E, Sarwer DB (2012) Psychosocial characteristics and gestational weight change among overweight, African-American pregnant women. Obstet Gynecol 2012: 878607.
  44. Belzer LM, Smulian JC, Lu SE, Tepper BJ (2010) Food cravings and intake of sweet foods in healthy pregnancy and mild gestational diabetes mellitus. A prospective study. Appetite 55: 609–615.
  45. Farland LV, Rifas-Shiman SL, Gillman MW (2015) Early Pregnancy Cravings, Dietary Intake, and Development of Abnormal Glucose Tolerance. J Acad Nutr Diet 115: 1958–1964.
  46. Hill AJ, Cairnduff V, McCance DR (2016) Nutritional and clinical associations of food cravings in pregnancy. J Hum Nutr Diet 29: 281–289. [crossref]
  47. Nyaruhucha CNM (2009) Food cravings, aversions and pica among pregnant women in Dar es Salaam, Tanzania. Tanzan J Health Res 11: 29–34.
  48. Patil CL (2012) Appetite Sensations in Pregnancy among Agropastoral Women in Rural Tanzania. Ecol Food Nutr 51: 431–443.
  49. Qureshi Z, Khan R (2015) Diet intake trends among pregnant women in rural area of Rawalpindi, Pakistan. J Ayub Med Coll Abbottabad 27: 684–688.

A rare case of distant metastasis of primary malign pericardial mesothelioma with 18F-FDG PET/CT

DOI: 10.31038/JCRM.2019234

ABSTRACT

Primary pericardial mesothelioma is a rare malignant tumor derived from the pericardial mesothelial cell layers. 65-year-old man was admitted to hospital with dyspnea and chest pain. Pericardial effusion and pericardial tamponade were observed with transthoracic echocardiography. Contrast-enhanced computed tomography (CECT) demostrated pericardial effusion, diffuse pericardial thickening and pleural effusion in both hemithorax. The final diagnosis was proven as primary malignant pericardial mesothelioma with histopathological evaluation. Subsequently, F-18 FDG PET-CT scan demonstrated high FDG uptake in pericardial thickening areas. Additionally, increased FDG uptake was also seen in the hypodense lesions in the both adrenal gland lesions and in liver.

Keywords

PET-CT, echocardiography, primary malign pericardial mesothelioma, FDG

INTRODUCTION

Malignant mesothelioma (MPM) is a rare, aggressive malignant tumor derived from the mesothelial cells of serosal membranes. Malignant mesothelioma may occur most frequently from the pleura (90%), less frequently from the peritoneum (6–10%) and from the pericardium, and very rarely from the tunica vaginalis in the testis [1]. Primary pericardial mesotheliomas (PPM) very rare malignancy (incidence 0,0022 %). It represents 6% of all mesothelioma cases [2]. It usually provides nonspecific findings such as dyspnea, fever, cough and chest pain. It is more common in men. The mean age was 46 (19–76) years [3]. Mesotheliomas particularly metastasize to the intratorasic lymph nodes or lung, distant extrathorasic metastasis is very rarely observed [4]. Various imaging methods can be used for the diagnosis such as echocardiography (ECO), chest X-ray, chest CT, magnetic resonance imaging (MRI) and positron emission tomography-computed tomography (PET-CT) [5]. PET-CT imaging have an important role in staging, treatment response, recurrence detection and prognosis in pleural mesothelioma [6]. In contrast to pleural mesothelioma, a few case reports with PPM is described by FDG PET-CT [7].

CASE

A 65-year-old male was admitted to the cardiology clinic with complaints of dyspnea and chest pain. He had no prior history of exposure to asbestos. Echocardiography showed pericardial effusion and tamponade findings. Diagnostic and therapeutic pericardiocentesis with pericardial drain was performed, all laboratory analyses showed normal results, cultivations and polymerasechain reaction (PCR) for tuberculosis were negative. Contrast-enhanced computed tomography (CECT) showed pericardial effusion, diffuse pericardial thickening and pleural effusion in both hemithorax (Figure 1-F).

JCRM 2019-112 - Tarik Sengoz Turkey_F1

Figure 1. A-MIP imaging of PET. B.C.D.E- Axial fusion imaging. B.C-Diffuse FDG uptake in pericardial thickining (SUVmax: 6,2). D- Focal FDG uptake in both adrenal glands (SUVinax: 3,l and 5,8). E-Focal FDG uptake in liver (SUVmax: 4,0). F-Axial CECT show diffuse pericardial thickining and effusion. G-liistopathological evaluation of malignant pericardial mesotheliomas (H&E).

F-18 FDG PET-CT scan demostrated intense uptake in diffuse pericardial thickening areas, with a maximum standardized uptake value (SUVmax) of 6.2 (Figure 1-A). Fused PET-CT images indicated the thickened pericardium with high FDG uptake (Figure 1-B,C). Furthermore, fused PET-CT images showed increased FDG uptake both in adrenal gland lesions (SUVmax: 3.1–5.8) (Figure 1-D) and in the hypodense lesion with a diameter of 1 cm in in liver segment 4A (SUVmax: 4.0) (Figure 1-E). Cytologic evaluation of pericardial effusion demonstrated with malignant pericardial mesothelioma. However, immunohistochemistry evaluation was not able to be performed. The case was evaluated as the PPM with liver and bilateral surrenal gland metastases. While the chemotherapy was planning, the patient had multiorgan insufficiency and emergency dialysis. Cardiac arrest developed two times during the dialysis and resulted in death.

DISCUSSION

PPM is a very rare malignant tumor of 6% of all mesotheliomas [8]. It can be seen in the form of mass formation or disseminated pericardial thickening. The effect of asbestos exposure is not as clear as pleural and peritoneal mesothelioma. The symptoms are usually nonspecific (fatigue, shortness of breath, chest pain, cough, etc.). It may indicate pericardial effusion, constrictive pericarditis, cardiac tamponade, and congestive heart failure in the clinic [9]. Imaging methods such as chest radiography, transthoracic echocardiography, CECT, MRI are used in the diagnosis.

In ECO and chest X-ray radiography, an enlarged heart silhouette and pericardial effusion are described, whereas the pericardial mass cannot be differentiated. In a review of 28 pericardial mesothelioma cases, mediastinel mass could be differentiated in only one of 24 cases with X-ray graph [3]. Although CECT is an effective examination to demonstrate tumor invasion and pericardial thickening, sometimes large pericardial effusion complicate the evaluation of the mass [10]. ECO and CECT have a low sensitivity (12–44%) in detecting pericardial mass (3). The use of MRI is limited, high signal intensity in T2-weighted image has been demonstrated in one patient [11].

FDG is a glucose analogue and offers metabolic information on the basis of increased glucose uptake due to the increased glucose requirement in cancer cells. PET-CT is frequently used in the diagnosis, staging and treatment response of many different cancers. Since the use of PET-CT in pleural mesothelioma has been well known [6], the knowledge in PPM is limited. There was no information about FDG PET-CT in the review of Thomson et al. with 27 PPM cases between 1972–1992 [3] and in the review of Nilsson et al. with 29 PPM cases between 1994–2008 [12]. After 2008, 5 PPM cases confirmed with PET-CT were found [13–17] . 3 of 5 cases were female and 2 of them were male. The average age is 52 (19–72). The characteristics of 5 cases are summarized in Table 1. In 3 of the patients, PET-CT showed no regional lymph nodes and distant metastases, while the other 2 cases had mediastinel lymph node metastasis [15,17]. In our case, liver and bilateral surrenal gland metastasis were detected. Thus, our case was the first case with liver and adrenal metastasis detected by PET-CT. Metastasis is seen in 25–45% of PPM cases. Generally, regional lymph nodes, lung and kidney metastases were detected [18]. Nilsson et al. study, metastasis was defined in 16 (55%) of 29 PPM cases (lymph nodes, liver and lung metastasis) [12]. Cytological examination of pericardial fluid in PPM does not always distinguish between reactive / malignant cells. Pericardial biopsy may be required for the final diagnosis [19]. Although the diagnosis was made after pericardiectomy in 5 cases in literature, our patient was diagnosed with pericardiocentesis (Table 1).

Table 1. Cases of pericardial mesothelioma with F-18 FDG PET/CT published in the literature

Case

Age

Sex

Symptom

Asbestos exposure

Radiological imaging

PET-CT

Pathology

Our case

65

M

Dyspnea, chest pain

none

USG: pericardial effusion

CT: pericardial effusion, pericardial thickining

PPM (SUVmax:6.2), liver (SUVmax:4.0) and bilateral adrenal (SUVmax:3.1-5.8) met

pericardiosentesis

3

72

F

unspecified

none

CT: pericardial thickining

PPM (SUVmax not specified)

pericardial biopsy

4

58

F

Fewer, fatigue

unspecified

X-ray: enlarged cardiac silhouette

USG: pericardial effusion without ventricul dilatation

CT: pericardial mass

PPM (SUVmax:12.9) and dissemine pericardial spread

Subtotal pericardiectomy

5

19

F

Dyspnea, chest pain, low exercise capacity

unspecified

X-ray: enlarged cardiac silhouette

USG: pericardial effusion without ventricul dilatation

CT: pericardial thickining/effusion

MR: pericardial mass

PPM (SUVmax:5.22) and mediastinel lymph node metastasis (SUVmax:1.6)

Partial pericardiectomy

7

54

M

Dyspnea

none

USG: pericardial effusion without ventricul dilatation

CT: pericardial thickining/effusion

PPM (SUVmax:7.5)

pericardiectomy

8

57

M

Dyspnea, ankle edema

unspecified

USG: constrictive pericarditis

PPM (SUVmax:19.5) and mediastinel lymph node metastasis

pericardiectomy

M: male, F:female, USG: transthoracic echocardiography, CT: Computed tomography, MR: Magnetic resonance imaging, PET-CT: positron emission tomography- computed tomography, PPM: primary pericardial mesothelioma

Treatment is often palliative, curative treatment is not possible in PPM. Surgical resection, chemotherapy and radiotherapy are the treatment options. Average survival was reported as 10 months in one study [19]. Our patient was died 16 day after the diagnosis.

Consequently, PET-CT can change the management of patients with PPM by showing the distant metastasis. However, the shortness of survival and the palliative treatment are the factors that limit the effect of PET-CT on the treatment plan. Our case is differentiated due to liver and bilateral surrenal metastasis from PPM confirmed by PET-CT in the literature. In the future, it can be predicted that PET-CT have an important role for PPM like pleural mesothelioma.

REFERENCES

  1. Adams VI, Unni KK, Muhm JR, et al. (1986) Diffuse malignant mesothelioma of pleura: Diagnosis and survival in 92 cases. Cancer 58: 1540–51. [Crossref]
  2. Ohmori T, Arita N, Okada K, et al. (1995) Pericardial malignant mesothelioma: case report and discussion of immunohistochemical and histological findings. Pathol Int. 45: 622–625. [Crossref]
  3. Thomason R, Schlegel W, Lucca M, et al. (1994) Primary malignant mesothelioma of the pericardium. Case report and literature review. Tex Heart Inst J 21: 170–174. [Crossref]
  4. Silvestri F, Bussani R, Pavletic N, et al. (1997) Metastases of the hearth and pericardium. G Ital Cardiol. 27: 1252–1255.
  5. Maisch B, Seferovic PM, Ristic AD, et al. (2004) Guidelines on diagnosis and management of pericardial diseases executive summary;The task force on the diagnosis and management of pericardial diseases of the European society of cardiology. Eur Hearth J. 25: 587–610. [Crossref]
  6. Gerbaudo VH, Sugarbaker DJ, Britz-Cunningham S, et al. (2002) Assessment of malignant pleuralmesothelioma with (18)F-FDG dual-head gamma-camera coincidence imaging: comparison with histopathology. J Nucl Med. 9: 1144–1149. [Crossref]
  7. Ceresoli GL, Chiti A, Zucali PA, et al. (2006) Early response evaluation in malignant pleural mesothelioma by positron emission tomography with [18F]fluorodeoxyglucose. J Clin Oncol. 24: 4587–4593. [Crossref]
  8. Burke A, Virmani R. (1996) Malignant mesothelioma of the pericardium. In: Rosai J, Sobin LH, eds. Tumors of the Heart and Great Vessels. Atlas of Tumor Pathology, Third Series, Fascicle 16. Washington, DC: Armed Forces Institute of pathology; 181–194.
  9. Eren NT, Akar AR. (2002) Primary pericardial mesothelioma. Curr Treat Options Oncol 3: 369–73. [Crossref]
  10. Quinn DW, Qureshi F, Mitchel IM. (2000) Pericardial mesothelioma: the diagnostic dilemma of misleading images. Ann Thorac Surg. 69: 1926–1927.
  11. Gössinger HD, Siostrzonek P, Zangeneh M, et al. (1988) Magnetic resonance imaging findings in a patient with pericardial mesothelioma. Am Heart J 115: 1321–2. [Crossref]
  12. Nilsson A, Rasmuson T. (2009) Primary pericardial mesothelioma: Report of a patient and literature review. Case Rep Oncol 2: 125–132. [Crossref]
  13. Sakuraba M, Tatsumori T, Hirama M, Ogura K.(2011) Malignant pericardial mesothelioma. European Journal of Cardio-thorasic Surgery 39: 420.
  14. Aga F, Yamamoto Y, Norikane T, Nishiyama Y. (2012) A case of primary pericardial mesothelioma detected by 18F-FDG PET/CT. Clin Nucl Med 37: 522–523. [Crossref]
  15. Ost P, Rottey S, Smeets P, et al. (2008) F-18 Fluorodeoxyglucose PET/CT scanning in the diagnostic work-up of a primary pericardial mesothelioma: a case report. J Thorac Imaging 23: 35–38. [Crossref]
  16. Sivrikoz İA, Onner H, Dundar EK, et al. (2016) F-18 FDG PET/CT images of rare primer cardiac tumour: primary pericardial mesothelioma. Anatol J Cardiol 16: 635–638. [Crossref]
  17. Edel JP, Balink H. (2018) 18F-FDG PET/CT revealing constrictive pericarditis as the only manifestation of malignant mesothelioma. Clin Nucl Med 00: 00 (accepted, but yet unpublished). [Crossref]
  18. Karadzic R, Kostic-Banovic L, Antovic A, et al. (2005) Primary pericardial mesothelioma presenting as constrictive pericarditis. Arch Oncol 13: 150–152.
  19. Kaul TK, Fields BJ, Kahn DR. (1994) Primary malignant pericardial mesothelioma: a case report and review. J Cardiovasc Surg. 35: 261–267. [Crossref]

Late Rise Human Chorionic Gonadotropin after Embryo Transfer: Causality and Significance! A mini review

DOI: 10.31038/IGOJ.2019233

Abstract

The reliable detection of hCG in maternal blood usually coincides with the embryonic implantation phase which is around 7 days post fertilization. It is believed that hCG levels taken post embryo transfers have a diagnostic and prognostic value when it comes to reproductive outcomes. Very low initial hCG levels predict a higher risk of chemical pregnancies, miscarriages and ectopic pregnancies. A review of the literature was performed so as to understand the mechanisms leading to late hCG rises as well as significance of such findings.

Introduction

Human chorionic gonadotropin (hCG) is produced by the placental syncytio-trophoblasts as early as 7–8 blastomere stage of the embryonic development i.e. before actual implantation takes place (M.-L.Bonduelle et al. 1988). The reliable detection of hCG in maternal blood usually coincides with the embryonic implantation phase which is around 7 days post fertilization (Ahmed et al. 1983). While serial hCG levels aren’t usually monitored in spontaneous pregnancies, women undergoing assisted reproductive technologies (ART) treatments usually necessitate such an approach especially after embryo transfer (ET). It is believed that hCG levels taken post ET have a diagnostic and prognostic value when it comes to miscarriages, ectopic pregnancies, predicting multiple gestations as well as live births (Schmidt et al., 1994, McCoy et al. 2009).

Discussion

Despite the lack of consensus on the hCG cutoff values that correlate with the best ART outcomes, a bulk of the studies use a value of 70 mIU/ml on day 14 post ovum pickup as an acceptable reference value (Sung et al. 2016). Values equivalent to 5 mIU/mL or below are judged as negative pregnancy tests (Sung et al. 2016, Maslow et al. 2016). It is believed that the amount of hCG produced reflects the mass of the trophoblast tissue as well as it’s function (Porat et al. 2007). Despite the discrepancies in the literature, there is a certain agreement that very low initial hCG levels are associated with adverse pregnancy outcomes and intra-uterine growth restriction. This can be explained by the small placental mass with a suboptimal function thus preventing normal fetal growth (Haddad et al. 1999, Krantz et al. 2004, Porat et al. 2007). A possible explanation for the latter might be that some embryos have a division lag, thus a later or abnormal implantation due to variances in trophoblast differentiation (invasive/extravillous versus hCG-producing/ villous phenotype) in an endometrium of decreased receptivity (Bolton et al. 1989, Woodward et al. 1993, Smith et al. 2004, Morse et al. 2016). Jukic et al. found out that smoking status and age at menarche affected the time of implantation by almost 24 hours and thus a late hCG rise. Current active or passive smoking status was significantly associated with delayed implantation. Younger age at menarche (younger than 12 years of age) was also found to be associated with a slow initial hCG rise (Jukic et al.2011). On another note, low initial hCG levels from 1.0 to 5.0 mIU/mL might be due to a false negative result related to laboratory methodology used for the hCG titration (Maslow et al. 2016). It s worth mentioning that it’s not only the initial hCG value but the doubling time as well as the hCG- rise curve is more correlated with the pregnancy outcome (Shamonki et al. 2009, Maslow et al. 2016, Morse et al. 2016). A doubling time of 2 days has been set as the best predictor of live birth rate although an increase rate as low as 53% can also predict a viable pregnancy (Shamonki et al. 2009, Seeber et al. 2012). Initial hCG value post ET is important to diagnose a possible pregnancy, however it doesn’t correlate alone with the possibility of a live birth. Serial hCG levels are important especially when the initial values are lower than the cut-off value.

References

  1. Ahmed, A. G., and A. Klopper. “Diagnosis of early pregnancy by assay of placental proteins.” BJOG: An International Journal of Obstetrics & Gynaecology 90.7 (1983): 604–611.
  2. Bolton VN, Hawes SM, Taylor CT, Parsons JH. Development of spare human preimplantation embryos in vitro: an analysis of the correlations among gross morphology, cleavage rates, and development to the blastocyst. J In Vitro Fert Embryo Transf 1989; 6: 30–5
  3. Bonduelle, M-L., et al. “Chorionic gonadotrophin-β mRNA, a trophoblast marker, is expressed in human 8-cell embryos derived from tripronucleate zygotes.” Human Reproduction 3.7 (1988): 909–914.
  4. Haddad, Bassam, et al. “Predictive value of early human chorionic gonadotrophin serum profiles for fetal growth retardation.” Human Reproduction 14.11 (1999): 2872–2875.
  5. Jukic, A. M. Z., et al. “The association of maternal factors with delayed implantation and the initial rise of urinary human chorionic gonadotrophin.” Human reproduction 26.4 (2011): 920–926.
  6. Krantz, David, et al. “Association of extreme first-trimester free human chorionic gonadotropin-β, pregnancy-associated plasma protein A, and nuchal translucency with intrauterine growth restriction and other adverse pregnancy outcomes.” American Journal of Obstetrics & Gynecology 191.4 (2004): 1452–1458.
  7. Maslow, Bat-Sheva L., et al. “Occult abnormal pregnancies after first post–embryo transfer serum beta-human chorionic gonadotropin levels of 1.0–5.0 mIU/mL.” Fertility and sterility 105.4 (2016): 938–945.
  8. McCoy, Travis W., Steven T. Nakajima, and Henry CL Bohler. “Age and a single day-14 β-HCG can predict ongoing pregnancy following IVF.” Reproductive biomedicine online19.1 (2009): 114–120.
  9. Morse, Christopher B., et al. “Association of the very early rise of human chorionic gonadotropin with adverse outcomes in singleton pregnancies after in vitro fertilization.” Fertility and sterility 105.5 (2016): 1208–1214
  10. Porat, Shay, et al. “Early serum β-human chorionic gonadotropin in pregnancies after in vitro fertilization: contribution of treatment variables and prediction of long-term pregnancy outcome.” Fertility and sterility 88.1 (2007): 82–89.
  11. Schmidt, Lila L., et al. “The predictive value of a single beta human chorionic gonadotropin in pregnancies achieved by assisted reproductive technology.” Fertility and sterility 62.2 (1994): 333–338.
  12. Seeber, Beata E. “What serial hCG can tell you, and cannot tell you, about an early pregnancy.” Fertility and sterility 98.5 (2012): 1074–1077.
  13. Shamonki, Mousa I., et al. “Logarithmic curves depicting initial level and rise of serum beta human chorionic gonadotropin and live delivery outcomes with in vitro fertilization: an analysis of 6021 pregnancies.” Fertility and sterility 91.5 (2009): 1760–1764.
  14. Sung, Nayoung, et al. “Serum hCG-β levels of postovulatory day 12 and 14 with the sequential application of hCG-β fold change significantly increased predictability of pregnancy outcome after IVF-ET cycle.” Journal of assisted reproduction and genetics 33.9 (2016): 1185–1194.
  15. Woodward BJ, Lenton EA, Turner K. Human chorionic gonadotrophin: embryonic secretion is a time-dependent phenomenon. Hum Reprod 1993;8: 1463–8.

Hydatid Disease and Pregnancy: A Short Note

DOI: 10.31038/IGOJ.2019232

Short Commentary

Tapeworm is the common name of the cestode worm, Echinococcus granulosus, which is the causal agent of hydatid disease in humans. This helminth infection is also known as cystic echinococcosis and hydatidosis, and is included in the zoonoses group. According to WHO [1]: (i) more than 1 million people are affected with echinococcosis at any one time; (ii) infection is globally distributed and found in every continent except Antarctica; (iii) robust surveillance is fundamental in order to show burden of disease and to evaluate progress and success of control programmes. However, as for other neglected diseases which are focused in underserved populations and remote areas, data is especially scarce and will need more attention if control programmes are to be implemented and measured; (iv) ultrasonography imaging is the technique of choice for diagnosis of cystic echinococcosis; (v) cysts can be incidentally discovered by radiography. Specific antibodies are detected by different serological tests and can support the diagnosis. Biopsies and ultrasound-guided punctures may also be performed for differential diagnosis of cysts from tumors and abscesses; (vi) cystic echinococcosis are often expensive and completed to treat, sometimes requiring extensive surgery and/or prolonged drug therapy.

As to transmission: (i) a number of herbivorous and omnivorous animals act as intermediate hosts of E. granulosus. They become infected by ingesting the parasite eggs in contaminated food and water, and the parasite then develops into larval stages in the viscera; (ii) carnivores act as definitive hosts for the parasite, and host the mature tapeworm in their intestine. They are infected through the consumption of viscera of intermediate hosts that harbor the parasite; (iii) humans act as so- called accidental intermediate hosts in the sense that they acquire infection in the same way as other intermediate hosts, but are not involved in transmitting the infection to the definitive host; (iv) several distinct genotypes of E. granulosus are recognized some having distinct intermediate hosts preferences. Some genotypes are considered species distinct from E. granulosus. Not all genotypes cause infections in humans. The genotype causing the  great majority of cystic echinococcosis infections in humans is principally maintened in a dog-sheep-dog cycle, yet several other domestic animals may also be involved, including goats, swine, cattle, camels and yaks; (v)  human infection with E. granulosus leads to the development of one or more hydatid cysts located most often in the liver and lungs, and less frequently in the bones, kidney, spleen, muscles, central nervous system and eyes; (vi) abdominal pain, nauseas and vomiting are commonly seen when hydatids occur in the liver. If the lung is affected, clinical signs include chronic cough, chest pain and shortness of breath. Other signs depend on the location of the hydatid cysts and the pressure exerted on the surrounding tissues.

These results of the parasitism for tapeworms in humans show that it may have direct and indirect consequences in human health, in general.  cause devastating morbidity with severe consequences in general and in female reproductive health.  Here our objective is to alert medical practitioners of gynecology and obstetrics for hydatid cyst in pregnancy.

The authors: (2) report that “Incidence of hydatid disease in pregnancy ranges from 1 in 20,000 to 1 in30,000. The diagnosis of liver hydatid cyst is not difficult but management during pregnancy is problematic. Both medical and surgical treatments are available but there is no consensus and each case has to be individualized”; (3) report “we present a 32-years old multigravida at 25 weeks of pregnancy in whom splenic and liver cysts were diagnosed by ultrasonography and magnetic resonance imaging (MRI). The splenic cyst was removed and a healthy baby was delivered vaginally at term”; (4) report “Case report A 25-year-old, gravida 1, para 0 pregnant female with history of liver cyst was admitted to the obstetric outpatient clinic for checkup. Patient who did not have any complaints was redirected to the radiology clinic for a second trimester ultrasound scan. Abdominal ultrasound revealed lesions of type-1, hydatid cyst 84×67 mm in size at the right lobe fifth segment, and 67×64 mm in size at the seventh segment of the liver, with millimetric echogenic female cysts and well-defined thickwalls. In addition, a type-2 hydatid cyst with membrane dissociation, 55×52 mm in size, was observed at the caudate lobe. An intrauterine fetus with fetal heart rate was observed with a bipariental diameter concordant with 21 weeks of gestation. Besides, there was a cystic lesion with fine septations surrounding the uterus. The patient was admitted to the obstetric care service with hydatid cyst hydatidosis in the vicinity of the uterus; (5) report “A young, apparently healthy from a rural area in South Africa presented in the third trimester of pregnancy with a symptomatic abdominal mass between the uterine fundus and liver. The etiology was established to be an echinococcus cyst of the liver and medical treatment was initiated. The fetal outcome was good but the mother died 3 days postpartum due to an unusual but devastating complication of the hydatid cyst; (6)  report the management of hydatid disease in pregnancy, and  they write that “in this review, we have attempted to summarize the presentation and available management approaches to hydatid disease, and have suggested evidence-based guidelines for its management during pregnancy; (7)  report  2 cases of hydatid disease of liver during pregnancy, and they also   made a review of literature; (8) report “A huge primary hydatid cyst of uterus” and they made also a review of literature.

Final conclusion: 1 – we think that it was here demonstrated the importance of the hydatid cyst as an underlying cause of negative effects in pregnancy; 2 – surgery in patients with hydatid cysts needs special care before, during or after surgery. Effectively, opening of a hydatid cyst requires special care not to spill the contents into the peritoneal cavity or tissues, since this may result in an anaphylactic reaction to the spilt fluid or dissemination and implantation of the immature scolices contained in the “sand” in the fluid. Incomplete removal of viable germinal epithelium from the liming of a hydatid cyst results in the formation of multiple cysts: 3 – we are in agreement with the conclusions of the authors (9): E. granulosus can affect any organ in the body from head to toe, and high suspicion of this disease is justified in endemic regions.

Keywords

Helminths; Cestodes; Tapeworms; Echinococcus granulosus; Hydatid Disease; Pregnancy; Gynecology; Obstetrics.

References

  1. WHO (18 February 2018) Echinococcosis Key facts.
  2. Ghosh JK, Goyal SK, Behera MK, Dixit VK, Jain AK. 2014 Hydatid cyst of liver presented as obstructive jaundice in pregnancy; Managed by PAIR. Journal of Clinical and Experimental Hepatology, https://doi.org/10.1016/j.jceh.2014.11.002
  3. Can D, Oztekin O, Oztekin O, Tinar S, Sanci M. Hepatic and splenic hydatid cyst during pregnancy: a case report. Archives of Gynecology and Obstetrics, August 2003, 268(3): 239–240.
  4. Tekin AF, Yilmaz H, Kara T, Seçkin E, Aybay MN, Alkan E, Case report A very rare case hydaid bcyst surrounding uterus and magnetic resonance imaging findings in the pregnant patient, 2018 Available online at www.sciencedirect.com.
  5. Robertson M, Geerts L, Gebhardt S. A case of hidatid cyst associated with postpartum maternal dead. Ultrasound Obstet Gynecol 2006; 27: 693–696.
  6. Rodrigues G, Seetharam P. Management of hydatid disease (echinococcosis) in pregnancy. Obstet Gynecol Surv, 2008 Feb; 63 (2): 116–123.
  7. Demirel E, Ekmekci E, Izmirkatip C., Keeckci S, Gencdal S. Hydatid disease of liver during pregnancy: Report of two cases and Review of literature. 2018, Jacobspublishers.com, email: erem.dr@hotmail.com
  8. Slimane NN, Taieb M, Khiali R, Rabehi H, Bekhouuche R, et al. A huge primary hydatid cyst of uterus. A case report and review of literature. J Univer Surg 2018; 6(2): 12 (5pags)
  9. Sachar S, Goyal S, Sangwan S. Uncommon locations and presentations of hydatid cyst. Ann Med Health Sci Res 2014; 4: 447–452.

Does Rider Weight have a Measurable Effect on the Horse’s Back Muscle Longissimus dorsi?

DOI: 10.31038/IJVB.2019315

Abstract

The topic of rider weight in relation to a horse´s body weight, the so called Body Weight Ratio (BWR), has been discussed widely with regard to both health and performance by the equestrian community. However, direct measurements of the effects of a riders weight on the back muscle of horses is lacking. This study uses non-invasive multi-frequency bioimpedance (mfBIA) and Acoustic Myography (AMG) to measure the health and performance of m.Longissimus dorsi in 10 horses and with three groups of riders; Light-weight (BWR 17%), Medium (BWR 19%) and Heavy-weight (BWR 27%). mfBIA values obtained from the horses prior to being ridden at the walk and trot, revealed information about muscle mass, swelling, resting tension and metabolic activity. AMG values revealed not only the real-time efficiency/coordination of the muscle, but also it’s spatial- and temporal-summation during periods of physical activity. The results revealed no significant effect of rider weight on the mfBIA parameters of the horses in this study, and AMG values were likewise not significantly different across the three rider groups. It is tentatively concluded, that rider weight, within the limits of this study, does not appear to affect back muscle health or performance.

Introduction

Despite a lack of scientific basis for the introduction of prescribed loading capacities for horses, the Japanese Riding for the Disabled Association describes a loading capacity of between 16–17% of the body weight of the horse, whilst Hadrill in their volume entitled “Horse Healthcare”, suggests a limit of 33 to 50% of the horse´s body weight [1,2].

Interestingly, Matsuura and colleagues published findings that short and wide horses are better suited to riding with disabled individuals, so called therapeutic riding, although their gait may be disrupted when riders are too heavy [3]. It has also been reported that horses carrying loads of 25–30% of their body weight have both elevated heart rates and respiration rates [4].

Then recently, a study of 8 Icelandic horses confirmed the findings of Powell and colleagues [4], by showing that body-weight ratios of 20–35% result in an increase in heart rate, an elevated frequency of breathing as well as a rise in rectal temperature, all physiological changes that one might expect with an elevated level of physical exertion [5]. More interestingly though, and in keeping with the results of Matsuura and colleagues [3], this same research group subsequently published findings that show that the stride length of horses becomes significantly shorter and more frequent with increasing rider weight [6]. This is not altogether surprising, as anyone who has walked whilst carrying something heavy will have noticed that they do not walk with long strides, but rather short and frequent movements of their feet.

Whilst these and other studies investigating the influence of the rider on the horse have evaluated weight and riding technique [7–9], there is still a lack of direct methodology, evaluating the effect of loading on the back muscles of ridden horses.

This study has therefore chosen to measure the changes in the back muscle Longissimus dorsi of horses ridden by riders of different body-to-weight ratios (Light-weight, Medium and Heavy-weight) using the non-invasive techniques of multi-frequency bioimpedance (mfBIA), and Acoustic Myography (AMG). mfBIA as a method, can be used to directly assess changes in muscle tension, metabolic status and cellular health, whilst AMG enables the real-time assessment of muscle contraction (coordination, spatial summation, temporal summation) [10–12]. The hypothesis being, that rider weight per se, does not affect muscle health or performance.

Materials and Methods

Subjects

Ten healthy horses were used for data collection. The population consisted of 2 mares and 8 geldings, of which there was 1 Danish Warmblood, 1 Oldenburg, 4 Icelandic horses, 1 OX Arabian, 1 Appaloosa and 2 Fjord horses. The mean age of the horses was 10.4 ± 2.5 years. The body weights of the horses in this study ranged from 334–732 kg.

In order to investigate muscle health and function of the ten subjects, mfBIA measurements and AMG recordings were conducted on m. Longissimus dorsi. The measurements were carried out at the respective home of the subjects, in order to avoid any stress or environmental interference. Furthermore, the riders were recommended not to exercise their horse for between 24–48 hours before the recordings were due to be made, in order to achieve the best possible mfBIA and AMG results. These measurements, which were non-invasive, were taken with the full informed consent of the owners and riders.

Equipment and Measurements

Acoustic Myography

A gel pad was placed under the saddle (Acavallo Gel; Lonato del Garda, IT), with the AMG recording unit (CURO-diagnostics ApS, Bagsværd, DK) attached to the pad behind the saddle. CURO sensors (CURO-diagnostics ApS) were placed on both the left and right sides of the horse at the region of m. Longissimus dorsi. The muscle sites measured were prepared with acoustic gel (CURO-diagnostics ApS), which was thoroughly rubbed into the overlying hair to ensure a good connection with the skin above the muscle. Similarly, the two sensors were prepared with acoustic gel and attached to the horse using flexible self-adhesive bandage (Animal Polster, Snögg Industry AS, Kristiansand, NO). Smaller pieces of self-adhesive bandage were used to secure sensor cables to avoid errors caused by irritation of the horse and contact between the cables and sensors. The sensors were then connected to the CURO unit. Recordings were made to both an iPad in real-time, as well as directly to the CURO unit itself, in the form of a WAV file. Data collection was made during walk and trot on both left- and right-hand circles. The subjects were ridden by their usual riders and with their usual saddle and riding equipment. For further details see [10,12].

Multi-frequency bioimpedance

For mfBIA measurements, the horse was restrained in a calm standing position. The region of m. Longissimus dorsi of interest was prepared by the application of conductive paste (Ten20; Weaver and Company, Aurora, Colorado USA), followed by placement of four pure platinum electrodes (1 x 3cm; made by AH) on to the prepared muscle. The mfBIA unit (ImpediVET BIS 1, Pinkenba, AU) providing a current of 1000 μA, was subsequently attached to the electrodes. Recordings were carried out at 256 frequencies ranging from 3 kHz to 850 kHz and repeated six times with a one second interval. By repeating the recordings, it was possible to avoid any slight movement artifacts or changes in the R or Xc values due to cable movement or change in body stance (Elbrønd et al., 2015). Throughout the recordings, the R-, Xc- and the full Cole-Cole plot was assessed for normality, in order to validate the strength and accuracy of the recordings. For further details see [11].

AMG data processing and analysis

Recorded data, stored on the CURO, was analyzed for its efficiency (E-score), amplitude (S-score; spatial summation) and frequency (T-score; temporal summation), using the CURO System Software (CURO-diagnostics ApS, Bagsværd, DK). The analysis was carried out with a maximum frequency (max T) of 160 Hz and a maximum amplitude of 0,99 (max S) equivalent to approx. 1V. Analysis was carried out for both sides of m. Longissimus Dorsi while riding on both circles.

The E-, S- and T-values from the two sides of the muscle were pooled and the means ± standard deviations calculated for walk and trot within the groups; Light-weight, Medium and Heavy-weight.

mfBIA data processing and analysis

The mfBIA data were analyzed using the ImpediVET software. At the time of recording, the Cole-Cole plots were assessed for a normal distribution and the R and Xc values and plots were examined to ensure precise recordings. Subsequently, a detailed analysis was performed at 50 kHz, where the parameters Z, R, Xc, fc, Re, Mc and Ri were obtained for each subject. The Phase Angle (PA) was calculated as (arctan Xc/R). The mean ± standard deviation for each group; Light-weight, Medium and Heavy-weight were calculated.

Statistical analysis

AMG and mfBIA data were initially assessed for normal distribution using a D’Agostino & Pearson normality test in GraphPad Prism 7 for Windows (La Jolla, CA, USA). Due to the small sample size (n=10), the normality test had very little power to discriminate between normal and non-normal distributions. Nevertheless, the majority of the tested data turned out to be normally distributed.

Results

AMG results

The AMG data for the measured horses during both walking and trotting revealed a non-significant difference for the E-, S- and T-scores for all three weight groups; Light-weight (BWR = 17%; n=2), Medium (BWR = 19%; n=6) and Heavy-weight (BWR = 27%; n=2) (see Figs 1 & 2).

At the walk, a very similar E-score and T-score were found for all three rider groups, indicating an identical degree of muscular efficiency/coordination and temporal summation (approx. 75Hz). Moreover, despite an apparently higher S-score for the Light-weight and Heavy-weight groups compared with the Medium group, there was no significant difference between the values in terms of spatial summation. This serves to indicate that muscle function for all three groups was not statistically different at this gait.

IJVB 2019-107 - Adrian Denmark_F1

Figure 1. The mean ± SD of the E-, S- and T-scores recorded during walking for m. Longissimus Dorsi. Values obtained from both sides have been pooled within the three groups. Red = Heavy-weight (n=4; 2 horses x 2 muscles), Blue = Light-weight (n=4; 2 horses x 2 muscles), Black = Medium groups (n=12; 6 horses × 2 muscles).

IJVB 2019-107 - Adrian Denmark_F2

Figure 2. The mean ± SD of the E-, S- and T-scores recorded during trotting for m. Longissimus Dorsi. Values obtained from both sides have been pooled within the three groups. Red = Heavy-weight (n=4; 2 horses x 2 muscles), Blue = Light-weight (n=4; 2 horses × 2 muscles), Black = Medium groups (n=12; 6 horses × 2 muscles).

At the trot, a very similar E-score, S-score and T-score was found for all three rider groups, indicating an identical degree of efficiency/coordination, spatial summation and temporal summation (approx. 40Hz). This likewise serves to indicate that muscle function for all three groups was not statistically different at this gait.

However, when comparing the AMG data from the two gaits, the E- and S-scores were found to be consistently higher during the walk for all three groups, whereas the highest T-score values were found during trotting.

.mfBIA results

No consistent body-weight-ratio patterns were noted for either the Light-weight, Medium or Heavy-weight groups, nor were any significant differences noted. When the Light-weight mfBIA values were plotted against those obtained for the Heavy-weight group (see Fig 3), it was found that values for muscle mass (Z; PA) were comparable, as was the indicator of resting tension (fc). Likewise, there were no signs of dehydration or inflammation (R; Re) between the two extremes. There was an elevated value for (Ri), which has been shown to be correlated with VO2-max at rest in the Heavy-weight cf Light-weight group, but this was not found to be significant.

IJVB 2019-107 - Adrian Denmark_F3

Figure 3. mfBIA values for the two extreme body weight groups, measured for m. Longissimus Dorsi. Red = Heavy-weight (n=2), and Blue = Light-weight groups (n=2). Values are mean ± SD.

Discussion

Whilst these findings represent a limited data set, they appear to suggest that the weight of the rider to the horse´s weight per se does not affect muscle function or muscle health, as documented by the AMG and mfBIA measurements.

In terms of possible confounding factors, it should be noted that whilst two horses from the Medium group had been competing in the days up to the study, a factor that might have influenced the accuracy of the measurements, this level of physical activity does not appear to have had any negative effect.

The mfBIA and AMG data reveal a very similar picture, that is one in which the back muscle Longissimus dorsi is quite relaxed (low fc value) and very comparable across the two extremes of Light-weight and Heavy-weight groups. The mfBIA data further reveals a very comparable muscle mass (Z, PA) for these two extreme groups, and there are no signs of swelling or inflammation (R, Re). Indeed, it can be concluded that this back muscle is fit and healthy for both extreme groups, as well as for the Medium group of riders, being comparable with previously published values [11].

The AMG data likewise, reveal fit and healthy scores for m. Longissimus dorsi. It is interesting to note a very similar E-score for the three groups, suggestive of a similar level of training and performance, as this value increases with highly trained horses, and falls with inactivity and convalescence. What is striking is that the T-score remains very consistent between the groups. One could have anticipated that some degree of muscle soreness was present in the Heavy-weight group of horses, and it is known that soreness/pain affects temporal summation, raising the firing frequency of afflicted muscles [13]. However, this was not observed either at the walk or the trot.

It is interesting though that the change in gait from walk to trot is reflected in the E,S,T-scores as has been reported previously in dogs [14]. It can be seen that there is a fall in the E-score as the muscle becomes more active with the change from walk to trot, contracting more of the time (E-score approx. 3 to 1–2). At the same time the S-score falls a little from 6–8 at the walk to approx. 5 at the trot, reflecting an increase in fibre recruitment (spatial summation). In contrast though, the T-score increases from approx. 5.5 at the walk (approx. 75Hz) to 7.5 at the trot (approx. 40Hz). This improvement in the T-score, which represents a drop in firing frequency, is very comparable with values for dogs and m.longissimus lumborum, as they change from walk to trot [14].

In conclusion, whilst these data do not reveal any suggestion that high rider-to-horse body weight ratios have an adverse effect on muscle health or function, as assessed by the non-invasive techniques of mfBIA and AMG, there is now a great need for a more detailed study in this field.

Acknowledgement

The authors are indebted to the horse owners for allowing us to measure them and their horses.

Conflicts of Interest

AH is in the process of forming a company with the aim of commercializing the AMG equipment.

Reference

  1. Matsuura A, Sakuma S, Irimajiri M, Hodate K (2013) Maximum permissible load weight of a Taishuh pony at a trot. Journal of Animal Science 91: 3989–3996.
  2. Hadrill D (2002) Horse Healthcare. 1st Edition. ITDG Publishing, London.
  3. Matsuura A, Ohta E, Ueda K, Nakatsuji H, Kondo, S (2008) Influence of equine conformation on rider oscillation and evaluation of horses for therapeutic riding. Journal of Equine Science 19: 9–18.
  4. Powell DM, Bennett-Wimbush K, Peeples A, Duthie M (2008) Evaluation of indicators of weight-carrying ability of light riding horses. Journal of Equine Veterinary Science 28: 28–33.
  5. Stefánsdóttir GJ, Gunnarsson V, Roepstorff L, Ragnarsson S, Jansson A (2017) The effect of rider weight and additional weight in Icelandic horses in tölt: part I. Physiological responses. Animal 11: 1558–1566.
  6. Gunnarsson V, Stefánsdóttir GJ, Jansson A, Roepstorff L (2017) The effect of rider weight and additional weight in Icelandic horses in tölt: part II. Stride parameters responses. Animal 11: 1567–1572.
  7. Clayton HM, Lanovaz JL, Schamhardt HC, Van Wessum R (1999) The effect of a rider´s mass on ground reaction forces and fetlock kinematics at the trot. Equine Veterinary Journal 30: 218–221.
  8. Roepstorff L, Egenvall A, Rhodin M, Byström A, Johnston C, et al (2009) Kinetics and kinematics of the horse comparing left and right rising trot. Equine Veterinary Journal 41: 292–296.
  9. De Cocq P, Duncker AM, Clayton HM, Bobbert MF, Muller M, et al (2010) Vertical forces on the horse´s back in sitting and rising trot. Journal of Biomechanics 43: 627–631.
  10. Riis KH, Harrison AP, Riis-Olesen K (2013) Non-invasive assessment of equine muscular function: A case study. Open Veterinary Journal 3: 80–84.
  11. Harrison AP, Elbrønd VS, Riis-Olesen K, Bartels EM (2015) Multi-frequency bioimpedance in equine muscle assessment. Physiological Measurements 36: 453–464.
  12. Jensen A-M, Ahmed W, Elbrønd VS, Harrison AP (2018) The efficacy of intermittent long-term bell boot application for the correction of muscle asymmetry in equine subjects. Journal of Equine Veterinary Science 68: 73–80.
  13. Graven-Nielsen T, Kendall SA, Henriksson KG, Bengtsson M, Sörensen J, et al (2000) Ketamine reduces muscle pain, temporal summation, and referred pain in fibromyalgia patients. Pain 85: 483–491.
  14. Fenger C, Harrison AP (2017) The application of acoustic myography in canine muscle function and performance testing. SOJ Veterinary Science 3: 1–6.