Archives

Osteomyelitis in Children, What to do?

DOI: 10.31038/IJOT.2019211

Introduction

Osteomyelitis is defined as inflammation of the bone with subsequent bone destruction [1]. Osteomyelitis in children has been a diagnostic challenge for decades. Hematogenous osteomyelitis presents clinically versatile, depending on age and causative organism. Historically osteomyelitis has been classified by pathogenesis and duration. Osteomyelitis in children is primary of haematogenous origin [2–5] and was thought to originate from the metaphysis of long bones due to low blood flow in end capillaries [6]. Metaphyseal vessels are open ended towards the physis (growth plate) in long bones. Therefore Stephen RF. et al. [7] suggested the junctions between epiphysis and metaphysis to be the origin of infection in acute osteomyelitis. Time between onset of symptoms and confirmed diagnosis defines acute (within 14 days), subacute (within 3 months) and chronic osteomyelitis (more than 3 months) [8, 9].

Osteomyelitis in children most often originates from long bones, the lower extremities being the most common site, distributed as femur (23–29%), tibia (19–26%) and fibula (4–10%) [5, 9].

Fractures and bony malignancies as Ewing’s sarcoma are important differential diagnoses to rule out during initial assesment. Complications of untreated osteomyelitis in children are septic arthritis, growth retardation due to damage to the physis, bone deformation, angular deformity, septicemia, organ failure and death [5, 10, 11].

Diagnostics

The diagnostic process is multimodal. Both biochemistry and image modalities are required to support the diagnosis sufficiently. Especially imaging modalities has evolved over recent years enabling detailed information on infection status. [3]

A systematic review on acute heamatogenous osteomyelitis [8] showed elevated C-reactive protein (CRP) in 80.5% of children on admission on presentation, 91% had raised Erythrocyte Sedimentation Rate (ESR) and 35.9% had leukocytosis. Pääkönen M. et al evaluated inflammatory markers in 265 children with septic arthritis, osteomyelitis or both. They found sensitivity of ESR and CRP to be 94% and 95% respectively. Raised CRP and ESR simultaneously have a sensitivity of 98% for osteoarticular infection [12]. CRP has short half-life and is inexpensive which makes it useful for monitoring treatment [8, 9].

Subacute osteomyelitis presents with mild symptoms and often no positive laboratory findings [13]. Several studies [13, 14] have presented case series of subacute osteomyelitis in children, with low sensitivities of CRP, ESR and leukocytes.

Standard radiographs have differential diagnostic value, whereas early diagnosis of infection is dependent on more dynamic image modalities. Visible infection on plain radiographs is seen two to three weeks after onset of symptoms [9].

Magnetic resonance imaging (MRI) is the preferred modality for detecting primary focus of infection and it can be helpful in planning surgery. Several studies have documented sensitivity of 82–100% and specificity of 75–99% [10, 15]

Ultra Sonography can reveal subperiosteal changes, evaluate soft tissue and joint effusion and hence have a role in supporting the diagnosis [5].

Bone scans can be useful in multifocal disease and when no clear origin of infection has been found. In neonates specificity is lower due to higher rate of false negative scans [5, 8]. In a recent study, white blood cell scintigraphy was found convincing in detecting post traumatic osteomyelitis [16] Another study reported sensitivity of 79% and a specificity of 97% in detecting fracture related bony infection in peripheral bones [17].

Microbiology and Antibiotics

Staphylococcus Aureus, streptococcus and gram-negative organisms are primary causative organisms in young children [8]. In recent years the facultative anaerobic Gram-negative bacillus Kingella Kingae has been recognized as among the most common pathogen in children between six months and four years of age with haematogenous osteomyelitis [4, 6]. Several published case series includes patients, in which no bacteriological causative organism is identified by microbiological tests on blood, pus or bone biopsy [11, 18].

Antibiotic treatment regimes of acute osteomyelitis in children have historically been 4–6 weeks in total [3, 5]. Two systematic reviews find short intravenous course (3–4 days) followed by 3 weeks of oral therapy as effective as longer intravenous treatment regimes, in uncomplicated cases of acute osteomyelitis.[8, 19] A recent open review concludes that definite guidelines for treatment length and route of administration are yet to be established [4].

Initial empirical treatment, if prevalence of Methicillin Sensitive Staphylococcus Aureus (MSSA) >90%, is in several studies recommended as short course intravenous antistaphylococcal penicillin. Benzylpenicillin/cephalosporin is added if patient is not immunized against Haemophilus Influenzae. When clinical improvement and lowered inflammatory markers treatment is finished by oral regime 3–4 weeks [3–5, 8]. In Methicillin Resistant Staphylococcus Aureus (MRSA) endemic areas, prevalence >10% in community Clindamycin or Vancomycin are recommended [3, 9].

Case Presentation

A nine year old boy was referred to our outpatient clinic from the general practitioner, with plain radiographic findings suspicious of bony malignancy in left proximal fibula (Figure 1). The patient was otherwise healthy and had followed standard Danish children vaccine program.

IJOT - 106_Rikke Thorninger_F1

Figure 1. Primary plain x-­ray when patient was admitted to our department showing isolated process in left proximal fibula.

The boy had 4 weeks lasting constant pain in proximal fibula of the left leg. There had been a minor contusion to the left knee prior to onset of pain. There had been no fewer, swelling or redness of the left leg at any time during period of pain.

Physical examination revealed slim inconspicuously looking legs with no difference between sides. Inspection showed no difference between healthy and affected leg. Palpation of the proximal fibula was painful.

Left leg movement was free and painless, and the neurovascular status was normal. X-ray and subsequently magnetic resonance scanning and computed tomography scan showed large sequester in the left proximal fibula (Figure 3), arising suspicion of sub-acute osteomyelitis. Blood sample inflammatory makers was all within normal range and there were no systemic signs of infection.

The sequester in left fibula was surgically removed with additional decortication above affected bone and clearing of the bone marrow canal. A Gentamicin implant was placed in the bone defect. The pathologic bone was microscopically evaluated and cultured. Cultures were all negative, microscopy showed no signs of acute or chronic inflammation. Morphology was found suspicious of osteofibrous dysplasia. Subsequent multidisciplinary team conference, at Aarhus University Hospital concluded that radiographic material and history suggested subacute osteomyelitis. Osteofibrous dysplasia and malignancy were excluded.

The patient underwent 14 days intravenous treatment postoperatively, with benzylpenicillin and dicloxacillin. After discharge treatment was completed with 4 weeks of per oral dicloxacillin. Amoxycillin/ Clauvulanic acid was primary per oral choice, but was stopped due to allergic skin reaction presenting within five days. Throughout the treatment period all blood tests were within normal range.

At three month follow up, the patient had recovered and had complete remission of pain. Radiographs showed healing in the defect area (Figure 2).

IJOT - 106_Rikke Thorninger_F2

Figure 2. Plain radiographs three months after surgery showed healing around bony defect in proximal fibula.

IJOT - 106_Rikke Thorninger_F3

Figure 3. Magnetic resonance image prior to sugery, showing sequestra in left proximal fibula.

Discussion

In the presented case, a multidisciplinary team discussed paraclinical findings and sustained subacute osteomyelitis as tentative diagnosis, although blood samples had been normal and there were no sign of inflammation in sequestral bone biopsies. In a retrospective study with 121 children diagnosed with acute haematogenous osteomyelitis, sensitivity of blood culture was 32.4% and sensitivity of biopsy culture was 46.6%. In this study 16.5% of patients included underwent surgery [11] Several studies suggest that surgery is reserved for those not responding to standard treatment, but may provide early microbiological diagnose and accelerate patient recovery [3–5]

The patient of this case was offered surgery and subsequently antibiotic therapy. The clinical follow up showed full recovery and remission of symptoms. Inflammatory markers, CRP, leukocytes and ESR was unchanged and within normal range. As pointed out in several studies [3, 4, 8, 20] there are no definite guidelines or clear consensus for assessment and treatment strategy for acute or especially subacute osteomyelitis in children. In this case treatment for suspected osteomyelitis was effectuated without final radiographic or microbiological diagnosis. Total remission of symptoms was seen within the first week after surgery, and there were no clinical sign of infection local or systemic.

The results of this treatment strategy were early recovery and minimal delay due to further diagnostic processes.

Bone abscess representing subacute osteomyelitis can clinically and radiographically mimic bony malignant tumors, being and important differential diagnosis [21]. Dhanoa A. et al. [20] presented six cases, including one child and three adolescents, with initial suspicion of bony malignancy. All cases where diagnosed with subacute osteomyelitis, confirmed by histopathological exam of needle biopsies and microbiological test. The diagnostic process represents a potential delay in relevant treatment of subacute osteomyelitis, and has been described as a clinical and diagnostic challenge [13, 20].

Our patient underwent surgical removal and in total 6 weeks of antibiotic treatment, although no microbiological diagnosis was obtained and biopsy showed no clear sign of osteomyelitis. For subacute osteomyelitis we recommend short antibiotic therapy, initial intravenously and shift to oral therapy guided primarily on clinical remission rather than laboratory testing. In cases with radiographically well defined abscesses, surgically debridement and cleansing of affected bone might support faster recovery and shorter antibiotic treatment regimes.

Further studies are needed to define and test diagnostic algorithms to support clinical decision making and minimize diagnostic delay.

References

  1. de Graaf  H, Sukhtankar P, Arch B, et al (2017) Duration of intravenous antibiotic therapy for children with acute osteomyelitis or septic arthritis: a feasibility study. Health Technol Assess 21: 1–164. [crossref]
  2. Schmitt SK (2017) Osteomyelitis. Infect Dis Clin North Am 31: 325–338. [crossref]
  3. Harik NS, MS Smeltzer (2010) Management of acute hematogenous osteomyelitis in children. Expert Rev Anti Infect Ther 8: 175- 181.
  4. Iliadis AD, Ramachandran M (2017) Paediatric bone and joint infection. EFORT Open Rev 2: 7–12. [crossref]
  5. Yeo A, Ramachandran M (2014) Acute haematogenous osteomyelitis in children. BMJ 348: 66. [crossref]
  6. Jaramillo D, et al (2017) Hematogenous Osteomyelitis in Infants and Children: Imaging of a Changing Disease. Radiology  283: 629–643.
  7. Stephen RF, MK Benson, S Nade (2012) Misconceptions about childhood acute osteomyelitis. J Child Orthop 6: 353–356.
  8. Dartnell J, M Ramachandran, M Katchburian (2012) Haematogenous acute and subacute paediatric osteomyelitis: a systematic review of the literature. J Bone Joint Surg Br 94: 584–595.
  9. Peltola H, Pääkkönen M (2014) Acute osteomyelitis in children. N Engl J Med 370: 352–360. [crossref]
  10. van Schuppen J, MM van Doorn, RR van Rijn (2012) Childhood osteomyelitis: imaging characteristics. Insights Imaging 3: 519–533.
  11. Chiappini E, et al (2017) Epidemiology and Management of Acute Haematogenous Osteomyelitis in a Tertiary Paediatric Center. Int J Environ Res Public Health 14(5).
  12. Paakkonen M, et al (2010) Sensitivity of erythrocyte sedimentation rate and C– reactive protein in childhood bone and joint infections. Clin Orthop Relat Res 468: 861–866.
  13. Spyropoulou V, et al (2016) Primary subacute hematogenous osteomyelitis in children: a clearer bacteriological etiology. J Child Orthop 10: 241–246.
  14. Foster CE, et al (2018) Brodie’s Abscess in Children: A Ten–Year Single Institution Retrospective Review. Pediatr Infect Dis J 2018.
  15. Thevenin–Lemoine C, et al (2016) MRI of acute osteomyelitis in long bones of children: Pathophysiology study. Orthop Traumatol Surg Res 102:  831–837.
  16. Govaert GA, IJpma FF, McNally M, McNally E, et al (2017) Accuracy of diagnostic imaging modalities for peripheral post-traumatic osteomyelitis – a systematic review of the recent literature. Eur J Nucl Med Mol Imaging 44: 1393–1407. [crossref]
  17. Govaert, GAM, et al (2018) High diagnostic accuracy of white blood cell scintigraphy for fracture related infections: Results of a large retrospective single–center study. Injury 49: 1085–1090.
  18. Floyed, RL, RW Steele (2003) Culture negative osteomyelitis. Pediatr Infect Dis J  22: 731–736.
  19. Howard–Jones, AR, D Isaacs (2013) Systematic review of duration and choice of systemic antibiotic therapy for acute haematogenous bacterial osteomyelitis in children. J Paediatr Child Health 49: 760–768.
  20. Dhanoa A, VA Singh (2010) Subacute osteomyelitis masquerading as primary bone sarcoma: report of six cases. Surg Infect (Larchmt) 11: 475–478.
  21. McCarville MB (2009) The child with bone pain: malignancies and mimickers. Cancer Imaging 9: 115–121. [crossref]

Predicting Voice Mutation by Larynx and Voice Modifications

DOI: 10.31038/SRR.2019212

Abstract

Objective: To determine whether the vocal folds length, along with the acoustic voice parameters measurements, can predict the moment of upcoming voice mutation and assess the process of a child’s maturation.

Study design: A cohort study started with examination of children at a premutation age, and a follow up 2.5 and 5 years later.

Setting: Referral center (Claros Otorhinolaryngology Clinic)

Subjects and methods: Children at a premutation age were examined, with a follow up at a mutation and postmutation age. During each visit a CT examination was performed to determine vocal folds length, followed by an examination of the acoustic voice parameters and a videolaryngoscopy and videostroboscopy. Obtained values were analyzed statistically to find the correlations between them and the reported age of mutation.

Results: 50 children (25 males aged 11.5, and 25 females aged 9.5, with a follow up 2.5 and 5 years later) were examined. A study started with 73 children, but 23 of them failed to attend the first or second follow up. Statistical significance was reported for a correlation between the age of mutation and loudness in boys aged 14 (r = 0.48, b = 0.31), vocal folds length in boys aged 14 (b = – 2.18), and loudness in boys aged 11.5 (b = -0.15); and for girls for a correlation between the age of mutation and decrease of fundamental frequency between ages 9.5 and 12 (r = 0.5, b = 0.01).

Conclusion: The parameters mentioned above have a correlation with the moment of mutation and might in future become an additional way of evaluating a child’s development.

Keywords

Voice mutation, Voice break, Vocal fold length, Voice acoustic parameters, Child’s development

Introduction

Proper development in a child can determine his/her educational, professional and emotional future. We watch carefully during child’s growth if this process is not disturbed. However, it is not easy to evaluate; especially during puberty, which is unique to every child and is determined by such an unpredictable and complex factor as the game of hormones [1]. Many authors agree that, while assessing the moment of puberty in girls is easy because of the presence of menarche and breast growth, it is more difficult in boys because of a lack of these concrete breaking moments and its extended character [2, 3]. It is well known that, in contrast, the situation is opposite with respect to mutation; i.e. it happens in a much more subtle way for girls, whilst for boys mutation happens suddenly, more dramatically, and more noticeably [2, 4, 5]. The interesting phenomenon of voice break during puberty has tempted many authors to evaluate the development of a child by assessing the age of voice break as a clean sign of puberty.1, 6, 7 Although exploring the subject of mutation by evaluating the acoustic parameters of the voice has received a reasonable amount of attention in the literature [6, 8–11], the other ways of predicting the time of mutation, especially by examining the length of vocal folds based on CT scans, are to the best of our knowledge underexplored. We conducted our research to address this gap.

Our Clinic is a widely known consultancy for professional opera singers of the Gran Teatro del Liceo in Barcelona, specializing in the issue of voice since 1970, and also providing medical support for a large number of Spanish children. The medical data presented in this article is the result of our work over the past five years. The objective of our research was to establish correlations between the change of vocal folds length and acoustic parameters and signs of voice break described by children and their parents, and therefore to determine which combination of parameters would be the best to evaluate a child’s development.

Changes in the vocal box over the growth of a child are the consequence of complex coordination between the respiratory, digestive and nervous systems [12], as well as anatomical, histological and neurological modifications [13]. In comparison to the adult larynx, the pediatric larynx has disadvantages in voice production on an anatomical level [4], insofar as the ratio of the membranous vocal fold length to the total vocal fold length is lower, the cartilaginous framework is less rigid, and the incidence and degree of posterior glottic chink is increased [14]. Histologically, the pediatric larynx also varies a lot compared to the adult one, which manifests mainly in increased cellularity and decreased cellular differentiation and organization [15], as well as in the lamina propria which begins as a monolayer [16, 17], and changes into a bilayer around the age of 10 and into a trilayer after puberty [18]. Some authors argue that the triple structure of lamina propria occurs already at the age of 7 [4, 19], however, it is widely accepted that the distribution and composition of the collagen and elastic fibers do not mimick those of adults until puberty [15, 16, 18, 20]. Other differences in the pediatric larynx include elevated overall subglottic pressure and recruitment of a greater percentage of pulmonary capacity [4, 21], which changes during mutation.

The reason for these changes lies mainly in the histological structure of the vocal fold – female and male vocal folds alike express androgen receptors in the cytoplasm of the laryngeal gland, progesterone receptors in the nuclei of the same cells, and estrogen receptors in the epithelial cells of the larynx [4, 22, 23], leading to muscle thickening, final development of the trilayered lamina propria, changes in elastin and collagen deposition between the layers, variable lubrication and vocal fold elongation [24]. The expression of the receptors is similar for boys and girls, however differences in the level of hormones between genders causes differences in vocal fold development. In contrast, the other histological features vary: there is more elastin in the cover than in the ligament of male vocal folds, while the elastin in the female lamina propria is more compact [20, 25]. These differences lead to enormous distinctions in the male and female mutations. Apart from the difference in its dynamics, for girls, voice break happens earlier [26–28], starting from the age of 10 and finishing about the age of 14 years, whilst for boys it happens around the age of 12–16 years [29], with some period of voice instability [30, 31]. For both genders it results in the enlargement of arytenoids, expansion of the laryngeal muscles and ligaments [32, 33], completing of the glottal closure, lengthening of the framework of the larynx, and lengthening and rounding of the vocal folds, 4 which is highly related to changes of the acoustic parameters. It is important to note that nowadays mutation occurs much earlier than in the past [2, 34]. This was widely described by Daw, who recorded the age of voice break in members of J. S. Bach’s choirs in Leipzig in 17271749 as being 18 years old [35].

Materials and Methods

The study protocol was acknowledged, reviewed and approved by the internal ethics committee of our medical center, Claros Otorhinolaryngology Clinic Institutional Review Board. All of the parents and children were informed about the examination technique and provided written informed consent. We examined children of a premutation age, with a follow up 2.5 and 5 years later (at the mutation and postmutation age). Exclusion criteria were: vocal fold pathologies, history of neck trauma, previous intubations or laryngeal, head and neck or torso surgeries that have caused changes in vocal folds structure. For the power of a test equal to 0.9 (90%), the smallest sample size was calculated for each checked independent variable, and for statistically significant variables it varied from 10 to 41.

As advised by the pediatric voice assessment guidelines and European Laryngological Society (ELS), subjective and instrumental acoustic evaluations of the voice and aerodynamic performance, as well as visual evaluation of the larynx, were performed [36–38]. During each of the three appointments that the child attended, the voice parameters were measured by a speech- language pathologist. We chose these specific parameters based on advice from the literature: fundamental frequency as the basic, classical objective parameter of the voice [13], vocal range as quite a broad parameter, and because of that a strong sign of a voice disorder if pathological, shimmer and jitter as described as non-invasive, relatively easily applicable and objective [13, 39–41], and, furthermore, highly related to voice problems and dysphonia, [36, 42–44] loudness because it is believed to be a necessary parameter to objectify the result of checked jitter and shimmer [39, 45, 46], and maximum phonation time because it is believed to be the simplest, most easily measured aerodynamic parameter of phonation [47]. To perform the examinations we used sustained vowels taking examples from the approved authors [13, 39, 48, 49]. The vocal recording was performed in accordance with the Union of European Phoniatricians recommendations, with the child in a standing position, in a silent room, with noise level no higher than 40 dB, and with a microphone placed in front of the mouth at a 30 cm distance [50]. We used a microphone from Bruel & Kjaer Rhino-larynx Stroboscope—Type 4914 (Bruel & Kjaer Sound & Vibration, Denmark). All children were examined and recorded in the same conditions. Based on approved literature we defined the norms of all checked parameters [47, 51–59], and we compared them to obtained values. Finally, an ENT consultant examined the vocal folds during every visit to exclude any pathologies, performing a videolaryngoscopy with a rigid endoscope followed by a videostroboscopy (Hopkins II telescope 70 degrees, Karl Storz, Germany).

On every single visit, every 2.5 years, after parents and children provided written informed consent again, CT scanning was performed the way confirmed to be accurate before in our different study [60], using Philips Brilliance ICT 256 (Medical Systems, Netherlands), in the supine position, from the level of the frontal to the level of the aortic arch. Acquisition parameters consisted of a tube current—250 mA, 120 kV, 128×0.625 detector collimation, 0.75-second rotation time, pitch 0.993, scan field of view of250, standard resolution, raw slice thickness – 1 mm. For laryngeal evaluation we added a set of axial reconstruction 2×2 angled through C4 C6 disc spaces. The reconstruction interval was 0.5 mm and the slice thickness was 1 mm. Using standard CT software, a radiologist measured the precise length of the vocal folds in the axial view of the glottis, the longitudinal size of the glottis was estimated in a midsagittal plane (from anterior to a posterior boundary), and in the axial plane, and the length of vocal folds was measured between the anterior commissure and the most posterior part of vocal folds.

Finally, after the third examination (five years after the initial one), the children and their parents answered a survey. The first questions included gender, current age and presumed age of mutation. The following parts of the survey included questions about signs of mutation and voice problems during voice break. The next set of questions related to the age of menarche and breast growth for girls and the age of the first signs of puberty for boys. Lastly, they were asked to complete with the speech-language pathologist the GRBAS scale, which gives scores from 0 to 3 for hoarseness, roughness, breathiness, asthenia, and vocal strain [61].

Data was then implemented into Statistica 13.1 (StatSoft Poland, Cracow) software. Statistical significance was reported at the alpha level of 0.05. P value below 0.05 was considered significant. While analyzing the data we performed the Pearson correlation coefficient test, as well as an analysis of multiple regression and simple linear regression. Correlation coefficients were interpreted to determine whether the effect size was low (correlation coefficient-O.lO), medium (correlation coefficient~0.30) or high (correlation coefficient~0.50). Hypothesis tests were designed as two-tailed. A hypothesis null was formulated as HO: there is no correlation between the change of vocal folds length or acoustic parameters and the moment of voice break (r = 0, b = 0), against the alternative hypothesis H1: there is a correlation (r≠0, b≠0). We created graphs and classification trees to present our findings. The power of the test was determined, and the confidence intervals (Cl) were established for the obtained values.

Results

50 children of a premutation age were our final study group (25 males and 25 females) with a follow up 2.5 and 5 years later (in the mutation and postmutation age). Exactly half of them were males examined at age 11.5, age 14 and age 16.5, and the other half were females examined at age 9.5, 12 and 14.5.

While analyzing the correlations between all the obtained variables and the age of mutation with the Pearson correlation coefficient test, we reported statistical significance in the correlation between the age of mutation and loudness in boys aged 14 (positive correlation coefficient r = 0.48, 0.48, 95%, CI:0, 10–0.73, P = .015, power of the test = .7). Multiple regression analysis showed statistical significance in the correlation between the age of mutation and vocal fold length in boys aged 14 (negative coefficient b = -2.18, P = .044), as well as loudness in boys aged 11.5 (negative coefficient b = -0.15, P = .047), loudness in boys aged 14 (positive coefficient b = 0.31 , P = .022), and loudness in boys aged 16.5 (negative coefficient b = -0.31, P = .040\ however, loudness in boys aged 16.5 cannot be treated as a predictor of mutation, which presumably had occurred earlier). The effect size for these coefficients was R2 = 0.88 (0.88, 95%, CI: 0.72–0.93) and the Cohen’s coefficient was f2 = 7.33. Deeper analysis of these calculations is shown in the classification trees (Figures 1 and 2).

OTO-181055.pdf

Figure 1. Classification tree for loudness in boys aged 11, 5, loudness in boys aged 14, loudness in boys aged 16.5, and vocal folds length in boys aged 14.

Loudness in boys aged 14. and subsequently vocal folds length in boys aged 14, differentiate cases the best. Combined, they are a good prediction of the age of mutation.

SRR Pedro Carlos - 2018-102_F2

Figure 2. Classification tree for all the values obtained in boys aged 11.5 and 14. In these age groups vocal folds length in boys aged 11.5 was the best parameter differentiating cases

In the same calculations for girls, we reported statistical significance in the correlation between the age of mutation and the age of first menstruation (positive coefficient r = 0.84, 0, 84, 95%, CI:0, 66–0, 92, P<.001. power of the test = 1) and increase of fundamental frequency between the age of 9.5 and 12 years old (negative coefficient r = -0.5, 0, 5, 95%, CI:0.13–0.74, P = , 011, power of the test = .75). Since the correlation coefficient between the age of the mutation and the age of the first menstruation was high, we could perform an analysis of simple linear regression, results of which are shown in Figure 3. Multiple regression analysis also showed a statistically significant correlation between the age of mutation and the age of the first menstruation (positive coefficient b = 0.7, P<.001). and increase of fundamental frequency (negative coefficient b = -0.01, P = , 039), which is in agreement with previous calculations. The effect size for these coefficients was R2 = 0.76 (0.88, 95%, CI:0.54–0.86) and the Cohen’s coefficient was f2 = 3.1. Further analysis is shown in the classification trees (Figures 4 and 5).

SRR Pedro Carlos - 2018-102_F3

Figure 3. Scatterplot showing analysis of simple regression and a prediction zone of 95% for the mutation age. We can see that, e.g., for the menstrual age of 12 (axis x), with 95% of probability the mutation will occur between the age of 11.8 and 13.2 (axis y).

SRR Pedro Carlos - 2018-102_F4

Figure 4. Classification tree for the values obtained in girls aged 9.5, 12 and 14.5. Age of the first menstruation was the best parameter differentiating cases in respect of the mutation age.

SRR Pedro Carlos - 2018-102_F5

Figure 5. Classification tree for the increases of the values obtained in girls between ages 9.5 and 12. Age of the first menstruation was the best parameter differentiating cases.

Discussion

The main aim of our study was to find the parameter which correlates the best with the age of mutation, and therefore could possibly serve to predict the age of mutation and evaluate development of the child. We took under further considerations only the values with confirmed statistical significance.

With respect to boys, our calculations showed a statistically significant correlation between the age of mutation and loudness in boys aged 14. vocal fold length in boys aged 14, and loudness in hoys aged 11.5. For loudness in hoys aged 14 the correlation coefficient was positive, which tells us that the louder a child sings at the age of 14, the later he has the mutation. For loudness in boys aged 11.5 and vocal fold length in boys aged 14 the correlation coefficient was negative, which tells us that the louder boy sings at the age of 11.5, the lower the age of mutation, and – most importantly – the longer vocal folds are at the age of 14, the sooner the mutation will start. This is especially interesting in the case of boys, because despite of the obvious vocal folds lengthening with age, male mutation is well accepted to be a sudden and steep change, [2, 4, 5] with periods of higher voice interrupted by periods of lower voice, [30,31] and is dependent on numerous systematic changes described above, therefore it is not simply related to the change of vocal folds length.

It is worth emphasizing, that the correlation between the age of mutation and loudness in hoys aged 14 was confirmed to be statistically significant by all the statistical tests that we performed, and also was the best value differentiating the cases in respect of the age of mutation in the classification tree (Figure 1), therefore it is a variable worth special attention.

Our study also revealed interesting findings in girls. The calculations showed a statistically significant negative correlation between the age of mutation and increase of fundamental frequency between the age of 9.5 and 12. Which means that the more fundamental frequency drops between the age of 9.5 and 12 years old, the later mutation occurs. We have also confirmed a statistically significant positive correlation between the age of mutation and age of the first menstruation. Which means that the sooner the first menstruation appears, the sooner the voice break starts. This is not a surprising result; however, it gave us the opportunity to deepen our statistical analysis. Figure 3 illustrates an analysis of simple regression and the prediction zone of 95% for the mutation age, which means it allows us to predict with 95% of probability the age of voice break knowing the age of menstruation. This way of illustrating the correlation has the potential to be extremely useful in everyday medical and choral practice. The effect size of our results measured by the correlation coefficients was high.

It is important to point out that we have to consider the possible lack of precision in radiological measurements, however it is worth noting that our CT examinations had especially high resolution parameters, and that the CT scans were analyzed multiple times, in different views and planes. A further limitation of our study might be uncertainty about the proper understanding of our instructions during the acoustic examinations (which uncertainty accompanies scientists in every study involving children [62]), however, the age of children involved in our study was not so low as to make this a major concern.

Although several studies have investigated the subject of mutation and ways of predicting it, there is still room to explore it further. Decoster et al. investigated changes in acoustic parameters in girls, however boys were not the subject of the study [2]. Hacki and Heitmiiller, as well as Boltezar et al., did address the subject of mutation, yet in relation to acoustic voice parameters, not vocal folds length [6, 31]. Similarly, numerous studies examined acoustic voice parameters in pediatric population, though other examinations, such as vocal folds length measurements, were beyond the scope of the research [8–11]. Rogers et al. evaluated vocal fold growth as a function of age in a large group of patients [7], however using measuring sticks in total anaesthesia, and emphasized that it might have lengthened the vocal folds [63]. There are several other studies investigating vocal folds length in relation to age, however measurements were performed post mortem, and therefore did not reflect the actual conditions of the living human being’s body [18, 64–67]. Hollien, similarly as in our study, has used radiological imaging; however he has used X-ray images, which are less precise than the CT scans used in our research [68]. Thus, we are tempted to claim that our research is original, and to the best of our knowledge explores aspects not addressed before, adding an important contribution to still not exhausted research about a child’s development and the subject of mutation.

Conclusion

In the academic pursuit of knowledge, evaluating the proper maturation of a child has a special place of a particular concern. This is unsurprising, given that childhood can determine the future of a young human being. However, as we are all different, it is also difficult to determine whether development is proper, and, at the same time, so easy to miss the red flags. Undoubtedly, the period of puberty is the most challenging, both for the human body, which goes through multiple changes, and for scientists, who try to establish reference points to make the evaluation of maturing easier. We believe this hunt is never finished. In the future, one way to asses this might be a routine examination of vocal folds length and acoustic voice parameters. Our study attempted to make our contribution in bringing this future closer.

Acknowledgement

The authors report no conflicts of interest. The authors report no financial and material support for the research and the work reported in the manuscript.

References

  1. Fenichel P (2012) Delayed puberty. Endocr Dev 22: 138–159. [crossref]
  2. Decoster W, Ghesquiere S, Van Steenberge S. Great talent (2008) excellent voices-no problem for pubertal girls? Logoped Phoniatr Vocol 33: 104–112.
  3. Mumm R, Hermanussen M, Scheffler C (2016) New reference centiles for boys’ height, weight and body mass index used voice break as the marker of biological age. Acta Paediatr 105: e459–463. [crossref]
  4. Kerschner JE, Merati AL (2008) Science of Voice Production from Infancy Through Adolescence. In: Hartnick CJ, Boseley ME. Pediatric Voice Disorders. 1st edn. San Diego, California: Plural Publishing Inc; Pg No: 23–29.
  5. McAllister A, Sjölander P (2013) Children’s voice and voice disorders. Semin Speech Lang 34: 71–79. [crossref]
  6. Hacki T, Heitmiiller S (1999) Development of the child’s voice: premutation, mutation. Int J Pediatr Otorhinolaryngol 49: 141–144.
  7. Rogers DJ, Setlur J, Raol N, Maurer R, Hartnick CJ (2014) Evaluation of true vocal fold growth as a function of age. Otolaryngol Head Neck Surg 151: 681–686. [crossref]
  8. Böhme G, Stuchlik G (1995) Voice profiles and standard voice profile of untrained children. J Voice 9: 304–307. [crossref]
  9. McAllister A, Sederholm E, Sundberg J, Gramming P (1994) Relations between voice range profiles and physiological and perceptual voice characteristics in ten-year-old children. J Voice 8: 230–239.
  10. Sorenson DN (1989) A fundamental frequency investigation of children ages 6–10 years old. J Commun Disord 22: 115–123. [crossref]
  11. Pedersen MF, Moller S, Krabbe S, Bennett P, Svenstrup B (1990) Fundamental voice frequency in female puberty measured with electroglottography during continuous speech as secondary sex characteristic. Int J Pediatr Otorhinolaryngol 20: 17–24.
  12. Baken RJ, Orlikoff RF (1997) Voice measurement: is more better. Logop Phoniatr Vocol 22: 147–151.
  13. Nicollas R, Garrel R, Ouaknine M, Giovanni A, Nazarian B, et al. (2008) Normal voice in children between 6 and 12 years of age: database and nonlinear analysis. J Voice 22: 671–675. [crossref]
  14. Pabon JPH, McAllister A, Sederholm E, Sundberg J (2000) Dynamics and voice quality information in the computer phonetograms of children’s voices. In: Wide P, (ed). Child voice Stockholm: KTH Voice Research Centre Pg No: 85–100.
  15. Hartnick CJ, Rehbar R, Prasad V (2005) Development and maturation of the pediatric human vocal fold lamina propria. Laryngoscope 115: 4–15. [crossref]
  16. Hirano M, Sato K (1993) Histological color atlas of the human larynx. San Diego, California: Singular Publishing Group, USA.
  17. Hartnick CJ, Rehbar R, Prasad V (2005) Development and maturation of the pediatric human vocal fold lamina propria. Laryngoscope 115: 4–15. [crossref]
  18. Hirano M, Kurita S, Nakashima T (1983) Growth, development, and aging of human vocal folds. In: Bless DM, Abbs JH, ed. Vocal fold physiology. San Diego, California: College-Hill.
  19. Boseley ME, Hartnick CJ (2006) Development of the human true vocal fold: depth of cell layers and quantifying cell types within the lamina propria. Ann Otol Rhinol Laryngol 115: 784–788. [crossref]
  20. Chan RW, Fu M, Young L, Tirunagari N (2007) Relative contributions of collagen and elastin to elasticity of the vocal fold under tension. Ann Biomed Eng 35: 1471–1483. [crossref]
  21. Stathopoulos ET, Sapienza CM (1997) Developmental changes in laryngeal and respiratory function with variations in sound pressure level. J Speech Lang Hear Res 40: 595–614. [crossref]
  22. Newman SR, Butler J, Hammond EH, Gray SD (2000) Preliminary report on hormone receptors in the human vocal fold. J Voice 14: 72–81. [crossref]
  23. Brunings JW, Schepens JJ, Peutz-Kootstra CJ, Kross KW (2013) The expression of estrogen and progesterone receptors in the human larynx. J Voice 27: 376–380. [crossref]
  24. Kuhn MA (2014) Histological changes in vocal fold growth and aging. Curr Opin Otolaryngol Head Neck Surg 22: 460–465. [crossref]
  25. Kahane JC (1988) Histologic structure and properties of the human vocal folds. Ear Nose Throat J 67: 322, 324–325, 329–30. [crossref]
  26. Marshall WA, Tanner JM. Puberty. In: Falkner F, Tanner JM (1986) Human Growth-A Comprehensive Treatise 2: Postnatal Growth Neurobiology. 2nd ed. Plenum, New York: Springer, Pg No: 171–210.
  27. Tanner JM (1981) Growth and maturation during adolescence. Nutr Rev 39: 43–55. [crossref]
  28. Bogin B (1999) Patterns of human growth. (2nd edn) Cambridge University Press, London.
  29. Balasubramaniam RK, NN (2017) Voice Mutation During Adolescence in Mangalore, India: Implications for the Assessment and Management of Mutational Voice Disorders. J Voice 31: 511.e29–511.e33.
  30. Fuchs M, Fröehlich M, Hentschel B, Stuermer IW, Kruse E, et al. (2007) Predicting mutational change in the speaking voice of boys. J Voice 21: 169–178. [crossref]
  31. Boltezar IH, Burger ZR, Zargi M (1997) Instability of voice in adolescence: pathologic condition or normal developmental variation? J Pediatr 130: 185–190. [crossref]
  32. Fitch WT, Giedd J (1999) Morphology and development of the human vocal tract: a study using magnetic resonance imaging. J Acoust Soc Am 106: 1511–1522. [crossref]
  33. Ferlito A (2000) In: Ferlito A., ed. Diseases of the Larynx. London: Oxford; New York: Arnold. Oxford Univeristy Press.
  34. Gackle L (2000) Understanding voice transformation in female adolescents. In: Welch G, ed. Bodymind and Voice. Minnesota, USA: The Voice Care Network; Pg No: 739–744.
  35. Daw SF (1970) Age of boys’ puberty in Leipzig, 1727–49, as indicated by voice breaking in J.S. Bach’s choir members. Hum Biol 42: 87–89. [crossref]
  36. Cohen W, Wynne DM, KubbaH, McCartney E (2012) Development of a minimum protocol for assessment in the paediatric voice clinic. Part 1: Evaluating vocal function. Logoped Phoniatr Vocol 37: 33–38.
  37. Kelchner LN, Brehm SB, de Alarcon A, Weinrich B (2012) Update on pediatric voice and airway disorders: assessment and care. Curr Opin Otolaryngol Head Neck Surg 20: 160–164. [crossref]
  38. Hartnick C, Boseley M (2008) Pediatric Voice Disorders: Diagnosis and Treatment. San Diego, CA: Plural Publishing.
  39. Brockmann-Bauser M, Beyer D, Bohlender JE (2014) Clinical relevance of speaking voice intensity effects on acoustic jitter and shimmer in children between 5;0 and 9; 11 years. Int J Pediatr. Otorhinolaryngol 78: 2121–2126.
  40. Oates J, Kirkby R (1980) An acoustical investigation of voice quality disorders in children with vocal nodules. Australian J HumanCommDis 8: 28–39.
  41. Meal lister A, Sundberg J, Hibi SR (1998) Acoustic measurements and perceptual evaluation of hoarseness in children’s voices. Logoped Phoniatr Vocol 23: 27–38.
  42. Lopes LW, Barbosa Lima IL, Alves Almeida LN, Cavalcante DP, de Almeida AA (2012) Severity of voice disorders in children: correlations between perceptual and acoustic data. J Voice 26: 819.e7–819.el2.
  43. Shah RK, Engel SH, Choi SS (2008) Relationship between voice quality and vocal nodule size. Otolaryngol Head Neck Surg 139: 723–726. [crossref]
  44. Valadez V, Ysunza A, Ocharan-Hernandez E, Garrido-Bustamante N, Sanchez-Valerio A, et al, (2012) Voice parameters and videonasolaryngoscopy in children with vocal nodules: a longitudinal study, before and after voice therapy. Int J Pediatr Otorhinolaryngol 76: 1361–1365.
  45. Brockmann-Bauser M (2012) Improving Jitter and Shimmer Measurements in Normal Voices. Schulz-Kirchner Verlag GmbH Idstein 205.
  46. Brockmann-Bauser M, Drinnan MJ (2011) Routine acoustic voice analysis: time to think again? Curr Opin Otolaryngol Head Neck Surg 19: 165–170. [crossref]
  47. Pribuisiene R, Uloza V, Kardisiene V (2011) Voice characteristics of children aged between 6 and 13 years: Impact of age, gender, and vocal training. Logopedics Phoniatrics Vocology 36: 150–155.
  48. Glaze L, Bless D, Milenkovic P, Susser R (1988) Acoustic characteristics of children’s voice. J Voice 2: 312–319.
  49. Cohen SR, Perelman N, Nimni ME, Mahnovski V, Cheung DT (1993) Whole organ evaluation of collagen in the developing human larynx structures and adjoining anatomic structures (hyoid and trachea). Ann Otol Rhinol Laryngol 102: 655–659.
  50. Shutte HK, Seidner W (1983) Recommendations by the Union of European Phoniatricians (UEP): Standardizing voice area measurement/phonetography. Folia Phoniatr 35: 286–288.
  51. Bennett S (1983) A 3-year longitudinal study of school-aged children’s fundamental frequencies. J Speech Hear Res 26: 137–141. [crossref]
  52. Stathopoulos ET, Sapienza C (1993) Respiratory and laryngeal measures of children during vocal intensity variation. J Acoust Soc Am 94: 2531–2543. [crossref]
  53. Finnegan DE (1985) Maximum phonation time for children with normal voices. Folia Phoniatr (Basel) 37: 209–215. [crossref]
  54. Horii Y (1983) Automatic analysis of voice fundamental frequency and intensity using a VisiPitch. J Speech Hear Res 25: 467–471.
  55. Banik A, Arya S, Kant A (2015) Vocal Parameters in Children between 4 To 12 Years of Age: An Attempt to Establish a Prototype Database. International Journal of Scientific and Research Publications 11: 446–453.
  56. Ting HN, Chia SY, Manap HH, Ho AH, Tiu KY, Abdul Hamid B (2012) Fundamental Frequency and Perturbation Measures of Sustained Vowels in Malaysian Malay Children Between 7 and 12 Years Old. J Voice. 26: 425–30.
  57. Bonet M, Casan P (1994) Evaluation of dysphonia in a children’s choir. Folia Phoniatr Logop 46: 27–34. [crossref]
  58. Williamson G (2006) Human communication: A linguistic introduction. 2nd ed. Billingham, UK: Speech Language Services.
  59. Maturo S, Hill C, Bunting G, Ballif C, Maurer R, et al. (2012) Establishment of a normative pediatric acoustic database. Arch Otolaryngol Head Neck Surg 138: 956–961. [crossref]
  60. Claros P, Sobolewska AZ, Domenech-Claros A, Claros-Pujol A, Pujol C, et al. (2018) CT-based Morphometric Analysis of Professional Opera Singers’ Vocal Folds. J Voice 21: 30614–30618.
  61. Sundberg J (2000) Emotive transforms. Phonetica 57: 95–112. [crossref]
  62. Brockmann-Bauser M, Beyer D, Bohlender JE (2014) Clinical relevance of speaking voice intensity effects on acoustic jitter and shimmer in children between 5;0 and 9; 11 years. Int J Pediatr Otorhinolaryngol 78: 2121–2126.
  63. Su MC, Yeh TH, Tan CT, Lin CD, Linne OC, et al. (2002) Measurement of adult vocal fold length. J Laryngol Otol 116: 447–449. [[crossref]
  64. Eckel HE, Sprinzl GM, Sittel C, Koebke J, Damm M, et al. (2000) Anatomy of the glottis and subglottis in the pediatric larynx]. HNO 48: 501–507. [crossref]
  65. Eckel HE, Sittel C (1995) Morphometry of the larynx in horizontal sections. Am J Otolaryngol 16: 40–48. [[crossref]
  66. Friedrich G, Kainz J (1988) Morphometry of the larynx in horizontal sections: normal data for the quantitative evaluation of current imaging technics in German], Laryngol Rhinol Otol (Stuttg) 67: 269–274.
  67. Kahane JC (1978) A morphological study of the human prepubertal and pubertal larynx. Am J Anat 151: 11–19. [crossref]
  68. HOLLIEN H (1960) Some laryngeal correlates of vocal pitch. J Speech Hear Res 3: 52–58. [crossref]

Prevalence, Symptoms and Treatment of Vocal Fatigue in Professional Opera Singers: Clinician’s Experiences

DOI: 10.31038/SRR.2019211

Summary

Purpose and study design: The research aims to estimate the prevalence and characteristic symptoms of vocal fatigue in professional opera singers. Also, the paper is summary of many years of clinical experience with management of singers with vocal fatigue in Clarós Clinic. The research was designed as a retrospective observational study.

Material and method: In the group of 250 professional opera singers who were examined in Clarós Clinic in 10 years period, fifty-five cases of vocal fatigue were reported and evaluated. Among subjects were 21 men and 34 women. Mean age of participants was 46,78y (range 19–72 years old, standard deviation: 12.18 year). Representation of classical voice types was: 14 tenors, 5 baritones, 2 basses, 22 sopranos, 10 mezzos, 2 contralti.

Results: Prevalence of vocal fatigue in 10 years period in the study group was 22%. The three most frequent symptoms observed in the study group were: muscle pain (87.27%), muscle fatigue (76.36%) and diffuse sharp pain in the neck (70.37%). Statistical analysis showed significance only for the relationship between female opera singers and incidence of symptoms such as tremulous voice and muscle pain. All other symptoms were not statistically related to gender. Contradictory to expectations, application of anti-inflammatory drugs was statistically associated with the longer duration of the symptoms.

Conclusions: Vocal fatigue may be underestimated but is one of the most frequent problems encountered in the ENT practice that provides care for professional voice users. In the presented research, administration of anti-inflammatory drugs has not been associated with faster recovery from vocal fatigue.

Keywords

vocal fatigue, opera singers, treatment of vocal fatigue, retrospective observational study, the prevalence of vocal fatigue.

Introduction

Professional opera singers are considered to be the highest class artists among singers. In fact, they should be perceived as Olympian athletes when comes to quality and ability of their vocal folds. Exceptional singing is achieved by years of training and vocal regime. Unfortunately, the requirements set for the opera singers’ voice entail the unique susceptibility to vocal fatigue. The research reported fatigue to be a common complaint among professional voice users [1].

Vocal fatigue presents a challenge to research and clinical practice. Despite the amount data gathered on that matter, precise definition and guidelines are still not well established.

Unlike in case of muscle fatigue, the creation of the conditions that allow the investigation be far more difficult because of complicated mechanism of voice production. Many studies which attempted to induce vocal fatigue yielded a different and inconsistent result. In case of singing, the task is especially challenging because repertoire can vary significantly. Furthermore, aspect like frequency of the performance can play a role in the development of vocal fatigue. Some types of voice are particularly vulnerable, like a soprano. However, the data provided on the subject is anecdotal, obtained from clinicians’ experience instead of large case-control studies.

Mechanisms which underlay vocal fatigue are multifaceted. Titze listed some potential physiological and biomechanical factors that may contribute: fatigue of respiratory and laryngeal muscles, fatigue of non-muscular tissues of the larynx, and changes in vocal folds’ viscosity [2]. As one of the others, the neuromuscular fatigue express inability of muscles to sustain the tension under repeated stimulation [3].

The exceptional ability of the larynx to produce sound is possible because of vocal folds which are covered with non-muscular, pliable tissue that generates multiple and rapid vibrations [4]. Furthermore, viscous properties of vocal folds epithelium allow lubrication and shock absorption [5]. Research showed that prolonged, high-pitched phonation could increase: frictional energy loss, heat dissipation and tissue viscosity. All these factors can lead to tissue fatigue [4]. The influence of tissue biomechanics on phonation makes the study about vocal fatigue more complicated than the research of fatigue involving other skeletal muscles.

The expression vocal fatigue has been applied and arbitrarily understood. For presented research, vocal fatigue definition was employed from Solomon as the self- report of an increased sense of effort with prolonged phonation, whether or not there are observable or measurable decrements in phonation function [5]. The aspect of self-reporting is particularly crucial amid opera singers who are the harshest judges of their vocal abilities.

Moreover, vocal fatigue has been described clinically by several authors. Common symptoms enlisted in literature were: husky vocal quality, breathy vocal quality, loss of voice, pitch breaks, inability to maintain regular pitch, reduce pitch range, lack of vocal carrying power, reduce loudness range, need to use greater vocal effort [1].

Opera singers are interesting subjects to study vocal fatigue because in comparison to other professional types of vocalists their vocal abilities are challenged at the highest level. Furthermore, years of vocal regime provide them with high self-awareness of the vocal capabilities which helps to notice any vocal problems at first onset.

Clarós Clinic provides medical support for a large number of professional opera singers of Liceu Opera theatre in Barcelona, Music Conservatory students and other singers since 1970’. Authors decided to analyse reports of vocal fatigue from last ten years among opera singers and describe common symptoms, frequency and interventions that were applied.

The research aims to determine the prevalence of vocal fatigue, symptoms and factors which may underlay the occurrence of that problem.

Paper is summary of our experience with treatment and management of vocal fatigue among professional opera singers.

Overall, vocal fatigue is still an intriguing and persistent problem when presented in clinical practice and is the challenge in the face of consequences which may cause for the professional singer with a tight schedule. Furthermore, the struggle with finding a substitute for a famous singer who suffers from vocal fatigue provides additional pressure for the clinician who has to offer effective treatment.

Materials and Methods

Study design

The research was designed as a retrospective observational study. Evaluation of vocal fatigue cases presented in Clarós Clinic during ten years period was conducted to obtain prevalence, symptoms and to analyse the treatment.

The research protocol was approved by ethics committee of Clarós Clinic medical centre.

Participants

In the group of 250 professional opera singers who were treated in Clarós Clinic in 10 years, fifty-five cases of vocal fatigue were reported and evaluated for this research. Among subjects were 21 men and 34 women. Mean age of participants was 46,78y (range 19–72 years old, standard deviation: 12.18 year). Representation of voice types was: 14 tenors, 5 baritones, 2 basses, 22 sopranos, 10 mezzos, 2 contralti.

Medical evidence

Eleven most common symptoms and six risk factors of vocal fatigue identified in the study group were gathered in Table 1.

Table 1. Common symptoms of vocal fatigue and risk factors with definitions.

Symptoms

Description

Hoarseness

Patient complains of hoarse voice

Breathy voice

Breathy vocal quality, running out of breath while talking

Whispery voice

Patient is only able to whisper

Tremulous voice

Unsteady voice, voice affected by trembling or tremors

Neck muscle pain

Patient complains of muscular pain in the neck

Sharp pain localised on the neck: diffused or localised

Patient complains of sharp pain in the neck during speaking or singing

Neck muscle fatigue

Muscular fatigue present on the neck

Tissue fatigue

Increased viscosity of vocal folds’ mucosa and tissue stiffness

Neck strain

Increased tension in the neck

Stiffness of the vocal folds

Increased tension of vocal folds

Changes in vibrato

Inability to maintain proper vibrato

Risk factors

Muscle overstrained

Excessive effort during performance

Overuse of voice

Inadequate vocal rest regime

Incorrect technique

Insufficient training

Singing warm-up

Inappropriate singing warm-up

Shouting

High-pitched, forced phonation in short period

Inadequate repertoire

Prolonged singing beyond the appropriate tessitura (most acceptable and comfortable vocal range for the given singer [28])

Medical records were evaluated to search for possible causes and factor which may contribute to the development of vocal fatigue. Patients reported: overuse of voice, stress, incorrect technique, vocal warm-up, improper repertoire and shouting. Interventions which were used: voice rest regime, medications (anti-inflammatory drugs, steroids: hydrocortisone). Also, duration of the symptoms was measured. In some cases, the repetitive character of vocal fatigue was noticed.

 All cases of professional opera singers were presented to the same, senior, most experienced ENT consultant. He was responsible for the patient examination and evaluation. All medical records of patients with vocal fatigue were created by the senior consultant who followed the similar protocol in every case. Table 1 gathers the common symptoms and risk factors assessed in the study with the description of researcher interpretation.

In every case, the standard medical interview was gathered. Moreover, patients underwent ENT examination consisted of endoscopic evaluation and neck palpation.

A senior most experienced ENT consultant performed video laryngoscopy with conventional equipment to examine the vocal folds (Karl Storz® 70 degrees rigid endoscope and HD camera).

The table below shows typical symptoms and risk factors which were assessed in medical records. Description represents how researcher stated or understood given symptom or risk factor. Definitions were based on literature and authors experienced [3,6].

Statistical Analysis

Data was collected in Excel sheet and implemented to Statistica 13.1 (Statsoft) software for statistical analysis. Statistical significance was accepted at the alpha level of 0.05. A p-value below 0.05 was considered significant.

Contingency tables were used to analyse quality variable obtained from patients’ medical history. Percentage values for every symptom and risk factor were calculated for men, women and the complete group. The Chi2 test was used to assess statistical dependence between gender and incidence of given symptom and risk factor.

Contingency tables were also implemented to analyse the possible influence of anti-inflammatory medication on the duration of symptoms.

Due to the qualitative nature of the data obtained from medical history more complicated analyses were not possible.

It needs to be to highlight that some types of voice are very infrequent which influence the precision of statistical analysis. In this study, the contralti, basses and countertenors occurred in the minority.

Results

The results section is divided into two parts: descriptive data (tables and chart) and the statistical analysis. The precise characteristic of descriptive data obtained from medical history is presented in table 2, 3 and 4. Percentage values of symptoms incidence are illustrated in Chart 1.

SRR-2019-101-Pedro Carlos_F1

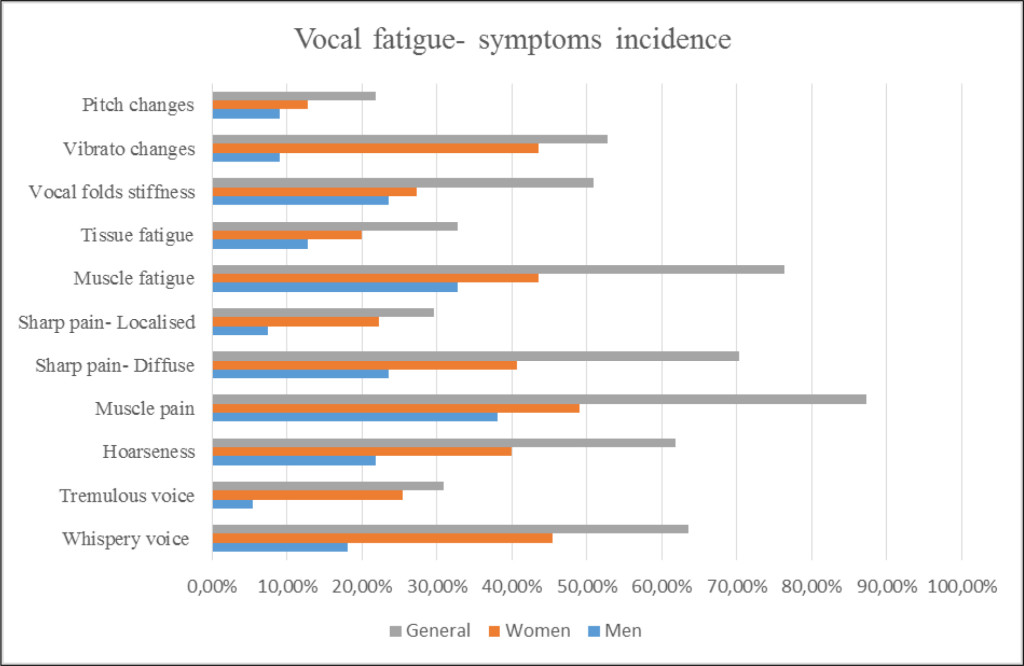
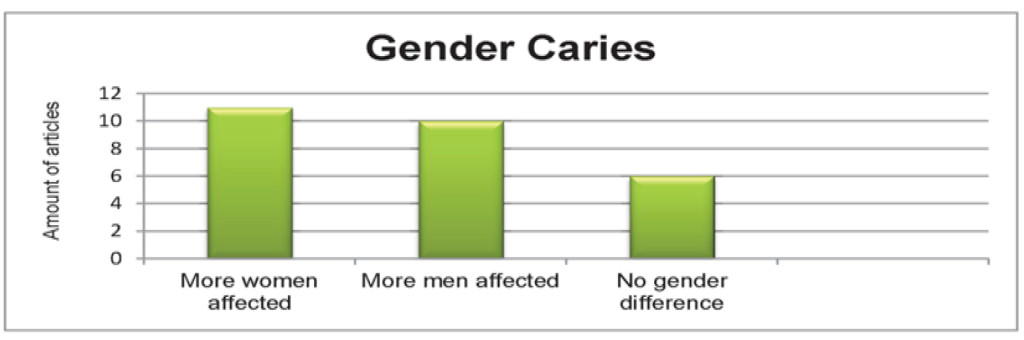
Chart 1. Bar chart. Percentage value of symptoms’ incidence.

Table 2.
Common symptoms of vocal fatigue in the study group.

Whispery voice

Tremulous voice

Hoarseness

Muscle pain

Sharp pain

Muscle fatigue

Tissue fatigue

Vocal folds stiffness

Vibrato changes

Pitch changes

Diffuse

Localised

Men

18.18%

5.45%

21.82%

38.18%

23.63%

7.41%

32.73%

12.73%

23.64%

9.09%

9.09%

Women

45.45%

25.45%

40.00%

49.09%

40.74%

22.22%

43.64%

20.00%

27.27%

43.64%

12.73%

General

63.64%

30.91%

61.82%

87.27%

70.37%

29.63%

76.36%

32.73%

50.91%

52.73%

21.82%

Chi2*

p = 0.052

p = 0.037

p = 0.574

p = 0.026

p = 0.23

p = 0.19

p = 0.93

p = 0.19

p = 0.779

p = 0.000

*The Chi2 for Independence test. Significant values (p≤0.05). NOTE: VF- vocal fatigue.

The table shows the percentage of VF occurrence and percentage of cases in which medications were applied in the groups. The results of the Chi2 test for independence between enlisted factor and gender are also given. Significance was reported at p-level below 0.05. None of given factors had gender predilection in the presented group.

Table 3. Risk factors of vocal fatigue analysed in the study group.

Muscle overstrain

Overuse of voice

Incorrect technique

Singing warm-up

Shouting

Inadequate repertoire

Reoccurrence VF

Medication

Men

32.73%

30.91%

3.64%

18.18%

20.00%

10.91%

7.27%

10.91%

Women

49.09%

49.09%

10.91%

21.82%

29.09%

18.18%

23.65%

14.55%

General

81.82%

80.00%

14.55%

40%

49.09%

29.09%

30.91%

25.24%

Chi2*

p = 0.55

p = 0.889

p = 0.406

p = 0.34

p = 0.7

p = 0.946

p = 0.13

p = 0.676

*The Chi2 for Independence test. Significant values (p ≤ 0.05). NOTE: VF- vocal fatigue.

The table shows the percentage value of risk factors incidence in the groups and results of the Chi2 test for independence between enlisted factor and gender. Significance was reported at p-level below 0.05. None of given risk factors had gender predilection in the presented group.

Table 4. Percentage value of vocal fatigue reoccurrence.  Percentage of cases in which anti-inflammatory medication was applied.

Reoccurrence VF

Medication

Men

7.27%

10.91%

Women

23.65%

14.55%

General

30.91%

25.24%

Chi2*

p=0.13

p=0.676

*The Chi2 for Independence test. Significant values (p≤0.05). NOTE: VF- vocal fatigue.

The Chi2 for Independence test was used to assess the relationship between gender and vocal fatigue symptoms. Results of the Chi2 test are also given in tables 2, 3.

Table 5 presents the percentage values of vocal fatigue recurrence among different types of classical voices.

Table 5. Recurrence of vocal fatigue among different voice types (tessitura- defined as most acceptable and comfortable vocal range for the given singer [28]).

Recurrence of vocal fatigue in different voice types

Yes

No

General

Soprano

12.73%

27.27%

40.00%

Mezzosoprano

10.91%

7.27%

18.18%

Contralto

0,00%

3.64%

3.64%

Tenor

5.45%

20.00%

25.45%

Baritone

1.82%

7.27%

9.09%

Bass

0.00%

3.64%

3.64%

General

30.91%

69.09%

100.00%

The table shows the percentage value of risk factors incidence in the groups and results of the Chi2 test for independence between enlisted factor and gender. Significance was reported at p-level below 0.05. None of given risk factors had gender predilection in the presented group.

The table presents the percentage of vocal fatigue reoccurrence among different voice types. In presented data sopranos and tenors were most frequently affected by the reoccurrence of VF. Examined contralti and basses had not experienced vocal fatigue more than one time at the moment of evaluation.

The chart shows the percentage value of symptoms which occurred in the whole group (general), men and women groups. Bars help to illustrate which symptoms were most common and compared them between groups. Therefore, three most frequent symptoms were muscle fatigue, diffuse sharp pain and muscle pain. Most common symptom among women as well as in men was muscle pain.

Results – Summary

The Clarós Clinic provided medical support for 250 professional opera singers during the time that the data was gathered. Symptoms of vocal fatigue were reported in 55 operatic vocalists, and these cases were enlisted to the research.

Prevalence of vocal fatigue in 10 years period among opera singers examined in the Clinic was 22%.

The three most frequent symptoms observed in the study group were: muscle pain (87.27%), muscle fatigue (76.36%) and diffuse sharp pain (70.37%). Most frequent complaints were pain-related, especially in female singers group.

Most common vocal complaints were: whispery voice (63.64%) and hoarseness (61.82%). More than a half of opera singers (52.73%) had difficulties with maintaining the vocal pitch during singing and quarter (21.82%) noticed changes in vibrato

The Chi2 test showed statistical significance only for the relationship between female opera singers and incidence of symptoms such as tremulous voice and muscle pain (test Chi2: p = 0.037, p = 0.026). All other symptoms were not statistically related to gender.

Most common risk factors were: muscle overstain and overuse of voice which were present in over 80% of cases. Much less frequently, singers reported incorrect technique and inadequate repertoire as contributors to vocal fatigue (table 3).

Recurrence of vocal fatigue was noted in one-third of the singers and was more distinctive for female singers, especially sopranos and mezzo-sopranos (table 4).

Mean duration of the symptoms was 3.8day (standard deviation: +/- 1.9day). The median value was 3 day.

Contingency tables were also used to estimate the relationship between duration of the symptoms and application of anti-inflammatory medications. Results of the Chi2 test showed that shorter length of the symptoms was related to lack of administration medication (test Chi2: p = 0.009).

Discussion

Vocal fatigue is an interesting and often debilitating condition, affecting many professional voice users. It gained much attention in the field of research, yet mechanisms which underlie the onset of this condition and its pathophysiology are still not fully understood. The amounts of vocal effort and specific elements which can trigger vocal fatigue are part of the ongoing debate. More research has to be done to develop reliable guidelines for management and treatment of vocal fatigue.

Every group of professional voice users have its characteristic which helps to study individual exposure factors. Opera singers have the individual susceptibility to fatigue which may interfere with social and occupational functioning.

The purpose of this study on vocal fatigue in opera singers was to state prevalence, characterise symptoms of this condition and review management.

Prevalence of vocal fatigue in studied group was 22%, which suggests that it might concern every fifth singer. As previous research showed among other types of professional singers, VF can cause voice impairment even more often. In a study conducted on the large group of various kinds of singers (opera singers- 49.8%), Phyland reported that participants experienced vocal fatigue in the previous year in 69% of cases [7]. In the research, fatigue was the second most frequent problem reported by singers after hoarseness [7].

Among most common symptoms reported by opera singers in the study group: two were pain related. Over 87% of singers pointed out the muscle pain as a single most common symptom of vocal fatigue. Female opera singers tended to suffer more from muscle pain than male singers, which was also confirmed statistically significant. Muscle pain was usually localised in throat, jaw and neck, but also in chest and back. These findings were consistent with previous reports which stated that most common pain present in singers were a sore throat (66%), pain during speaking (41%) and neck pain (35%). However, the study mentioned above pointed out the tendency for a sore throat among male vocalists, other types of body pains had no difference according to gender [8]. The presence of pain can severely compromise singer’s performance and negatively influence the quality of life. An important factor which helps to prevent the muscle pain is the concern for proper technique and vocal rest regimen.

Neuromuscular fatigue has been widely investigated in the literature. It can be presumed that muscle of the respiratory and phonatory system can fatigue and contribute to the deterioration of phonation or the perception of increased vocal effort, especially during prolonged high-pitched phonation. Undoubtedly, the research showed that respiratory muscles are highly unlikely to experienced fatigue. More recent findings presented evidence from whole body exercise suggesting that respiratory muscle fatigue occurs only following constant high-intensity training [9]. This situation cannot occur during regular physical activity, even as challenging as prolonged singing.

The distinction between fatigue of skeletal muscle and phonation muscles is relevant, because of the different histological structure. The capability of a muscle to maintain contraction over an extended period is related to a distribution of different motor units within the muscle body. In case of the larynx, the vast majority of intrinsic laryngeal muscle have fatigue-resistant muscle fibres (type I and IIa) rather than fatigable (type IIb) [10]. More recent studies provide interesting data showing the even more complicated histological structure of human intrinsic laryngeal muscles than presented in animal models [10]. These facts help to explain why singers usually complain about fatigue of muscle and experience discomfort in areas primarily localised in throat, jaw, and neck.

One of the unique aspects is non-muscular tissue fatigue which represents mechanical exhaustion. Mechanical deterioration represents the amount of strain that material can tolerate before breaking down. The fatigue represents progressive structural damage that results from mechanical stress (force per unit) imposed by strain on the material. Titze reported in one of his research that non-muscular tissue fatigue could cause damage to the laryngeal mucosa, but the quantity and duration of the physical stress were uncertain [11]. The author also described tensile stress which is required for high pitch phonation as a most significant mechanical stress in vocal folds vibration [11]

 Tissue viscosity plays a role in response to mechanical stress because that feature refers to individual properties of vocal folds’ mucosa responsible for lubrication and shock absorption. Research demonstrated that viscosity highly depends on the systemic and superficial hydration of mucosa. Singers in a situation of reduced systemic hydration may be particularly prone to experience the vocal fatigue [12]. Factor as prolonged, high-pitched phonation without proper hydration can lead to stress and strain which placed on the tissue can provoke fatigue. Furthermore, the viscosity of vocal folds mucosa can be affected by the decreased humidity of environment as in case of oral breathing [13].

The more recent study confirmed positive influence of systemic hydration on perceptual parameters of voice quality in singers. The improvement was seen in higher fundamental frequency, less cycle to cycle variation in pitch, or longer phonation time, depending on the individual. Hydrated vocal folds allow for optimal vibration, increase ease of phonation and prevent structural damage to vocal to vocal folds mucosa [14,15,16].

Non-muscular tissue biomechanical properties which include mucosal viscosity plays a significant role in the development of fatigue. In presented study 1/3 of singers have suffered from problems related to tissue fatigue.

Further, changes in vibrato were observed in over 52% singers. These changes represent acoustic differences related to vocal fatigue and can seriously interfere with performance. In previous research, Titze noted that muscle fatigue results in decreased ability to maintain stable tension in vocal folds [2]. In another interesting study, Boucher attempted to isolate acoustic signs of fatigue in laryngeal muscles. The study showed that 12 conventional acoustic parameters that were measured neither demonstrated consistent linear relationships with the fatigue estimates. Though, average values demonstrated the consistent peaks in vocal tremor and appeared near the points of critical shifts in muscle fatigue. In sum, rises in tremor corresponding to shifts in muscle fatigue appear robust in the face of fluctuations in modal pitch [17].

A more recent study helped to differentiate the acoustic changes related to vocal fatigue. The research was the first to demonstrate a link between tremor and observed muscle fatigue that is specifically attributable to voice effort and not only to fatigue linked with waking hours. Also, the results do not support applications of F0 or other conventional acoustic parameters as manifestations of fatigue in laryngeal structures. Even though many research showed significant rises in F0 as a result of vocal effort with reference to group averages, the recent reports showed that individual or cross-subject changes in F0, as in other conventional acoustic parameters do not consistently indicate fatigue in laryngeal structures [18].

Despite years of research, no consensus has emerged that could support the elaboration of guidelines for vocal fatigue. In the most basic approach, investigations on vocal fatigue have concentrated on identifying changes in voice in tests where fatigue was provoked by tasks of various “vocal load”. The assignments varied across different research; participants were asked to read or sing at varying pitch or intensities for a variable period extending from few minutes to several hours [19]. Those arguments make cross-study comparison useless with results on suggested vocal symptoms inconsistent and sometimes contradictory.

In our study as the first line of treatment, the vocal rest regime was applied in every case. Importance of vocal rest was underlined in many research and is usually required as first line intervention when vocal fatigue is experienced by singer [20]. Stress and anxiety management is also crucial for maintaining the good psychological condition of a singer. The aim of physical and mental approach to prevention of vocal fatigue is optimisation of the performance efficacy [21]. This translate to minimising muscular activation, achievable by improving posture and relaxing muscles [22].

Professional opera singers often follow the vocal routine which usually begins under the influence of their singing teacher and speech-language pathologist. Vocal hygiene practices contain moderation in amount and type of voice use, reduction of stress, avoidance of phonotraumatic behaviours like shouting, talking over crowds, aspects like systemic hydration and humidification to improve performance and ensure voice longevity [23]. Effects of systemic hydration and vocal rest were proved to have a significant influence on the decrease of vocal fatigue and maintaining good vocal quality in general [16,24].

In literature, researchers postulated to set safety limits of vibration dose (phonatory time) for professional voice users to protect people in several occupations (singers, teachers). For instance, proper recovery time has been worked out for professional athletes who abuse their body in different ways. Importantly, Titze divided recovery for short- and long-term. The first one takes place immediately when phonation is stopped [25]. The primary benefit from short recovery is for the muscles whose chemicals get reset before next contractions. On the contrary, traumatised epithelial cells need more prolonged healing. Some of them after being heavily bombarded during vocal folds contraction can degenerate and be shed off. New cells will grow underneath, but that requires time. Furthermore, some destruction of the structural matrix of the lamina propria may be present after prolonged phonation. Fibroblasts activity is necessary for the repairing to continue constantly. The recovery process may range from several hours to 72h to complete [25]. As was presented in the study, the actual phonation for opera singers in 2–3h opera was of the series 20–30min for leading role, and their schedule performance was on the order of 3 per week [25]. Overall, these facts put opera singers in the favourable position for proper vocal recovery. Nevertheless, the type and loudness of phonation were not considered in research calculation, but they can play a tremendous role. Given this points, more research is needed to create appropriate guidelines to prevent singers from vocal fatigue.

Singers appear to be at particular risk of developing voice problems. Formal assessments of singers experiencing a voice problem at any given moment in a time range from about 20 to 50% [26]. Moreover, the impact of voice problems on quality of life was widely investigated in the literature. Many studies proved that decrease in voice quality and other voice impairments affects severely quality of life. Of course, in case of professional singers, this problem grows to the crucial role because directly concerns the source of income.

Attempts at analysing vocal fatigue in patients who already experienced this condition are difficult because of subject heterogeneity and burden with problems of data interpretation. Even individuals selected for having only symptoms of vocal fatigue usually present variable baseline and outcome data.

Professional opera singers have high stakes in sustaining excellent vocal condition but also experienced unique vocal demands, making them important population to study.

Useful tools to adapt to everyday practice are scales which help to evaluate singers’ perceptions of physical aspects of singing status. A good example is EASE scale (Evaluation of the Ability to Sing Easily) which is clinical outcome test for symptomatic aspects of compromised vocal health but was not designed as the primarily disease-specific instrument [27]. This test serves as the measure of potential changes in the singing voice which may indicate effects of vocal effort and may help to detect singers with the increased risk of possible development of voice disorders. The EASE was designed to help singers in assessing vocal load threshold, recovery time to assist performance scheduling, help to predict the development of vocal problems, evaluate therapeutic outcome in management for specific needs of the singer’s voice, lastly to provide supportive data for determining performance fitness [27].

Conclusion

Vocal fatigue may be underestimated but is one of the most frequent problems encountered in the ENT practice which provides care for professional voice users. The most frequent symptoms were muscle fatigue, diffuse sharp pain and muscle pain. In the study group, administration of anti-inflammatory drugs has not been associated with faster recovery from vocal fatigue.

References

  1. Kitch JA, Oates J (1994) The perceptual features of vocal fatigue as self-reported by a group of actors and singers. J Voice 8: 207–214.
  2. Titze I.R. (1984) Vocal fatigue: some biomechanical considerations. In: Lawrence VL (ed). (Transcripts of the Twelfth Symposium: Care of the professional voice Part One:Scientific Papers. New York: The Voice. Foundation;) Pg No: 97–104.
  3. Welham NV, Maclagan MA (2003) Vocal fatigue: current knowledge and future directions. J Voice 17: 21–30. [crossref]
  4. Cooper DS, Titze IR (1985) Generation and dissipation of heat in vocal fold tissue. J Speech Hear Res 28: 207–215. [crossref]
  5. Solomon NP (2008) Vocal fatigue and its relation to vocal hyperfunction . Int J Speech Lang Pathol 10: 254–266. [crossref]
  6. Sataloff RT () Professional Voice: The Science and Art of Clinical Care, 3-Volume Set, Fourth Edition. https://books.google.es/books?id=ImVGDwAAQBAJ&pg=PA547&dq =the+performance+voice+benninger&hl=pl&sa=X&ved= 0ahUKEwiUhqbJlLPZAhWDWxQKHRS7ARIQ6AEIcTAJ#v = onepage&q&f = false. Accessed February 20, 2018.
  7. Phyland DJ, Oates J, Greenwood KM (1999) Self reported voice problems among three groups of professional singers. 13: 602–611.
  8. Rocha C1, Moraes M, Behlau M (2012) Pain in popular singers. J Soc Bras Fonoaudiol 24: 374–380. [crossref]
  9. Faghy MA, Brown PI (2014) Thoracic load carriage-induced respiratory muscle fatigue. Eur J Appl Physiol 114: 1085–1093. [crossref]
  10. Wu YZ, Crumley RL, Armstrong WB, Caiozzo VJ (2000) New perspectives about human laryngeal muscle: single-fiber analyses and interspecies comparisons. Arch Otolaryngol Head Neck Surg 126: 857.
  11. Titze IR (1994) Mechanical stress in phonation. J Voice. 8: 99–105.
  12. Pearl Solomon N, Stemmle DiMattia M (2000) Effects of a vocally fatiguing task and systemic hydration on phonation threshold pressure. J Voice 14: 341–362
  13. Sivasankar M, Fisher KV (2002) Oral breathing increases Pth and vocal effort by superficial drying of vocal fold mucosa. J Voice 16: 172–181. [crossref]
  14. van Wyk L, Cloete M, Hattingh D, van der Linde J, Geertsema S (2017) The Effect of Hydration on the Voice Quality of Future Professional Vocal Performers. J Voice 31: 111. [crossref]
  15. Verdolini K, Min Y, Titze IR, Lemke J, Brown K, et al. (2002) Biological mechanisms underlying voice changes due to dehydration. J Speech Lang Hear Res 45: 268–281. [crossref]
  16. Leydon C, Wroblewski M, Eichorn N, Sivasankar M (2010) A meta-analysis of outcomes of hydration intervention on phonation threshold pressure. J Voice 24: 637–643.
  17. Boucher VJ (2008) Acoustic Correlates of Fatigue in Laryngeal Muscles: Findings for a Criterion-Based Prevention of Acquired Voice Pathologies. J Speech Lang Hear Res 51: 1161.
  18. Boucher VJ, Ayad T (2010) Physiological Attributes of Vocal Fatigue and Their Acoustic Effects: A Synthesis of Findings for a Criterion-Based Prevention of Acquired Voice Disorders. J Voice 24: 324–336.
  19. Caraty MJ, Montacié C (2014) Vocal fatigue induced by prolonged oral reading: Analysis and detection. Comput Speech Lang 28: 453–466.
  20. Behlau M, Oliveira G (2009) Vocal hygiene for the voice professional. Curr Opin Otolaryngol Head Neck Surg 17: 149–154. [crossref]
  21. Boucher VJ, Ahmarani C, Ayad T (2006) Physiologic features of vocal fatigue: Electromyographic spectral-compression in laryngeal muscles. Laryngoscope. 116: 959–965.
  22. Angsuwarangsee T, Morrison M (2002) Extrinsic laryngeal muscular tension in patients with voice disorders. J Voice 16: 333–343. [crossref]
  23. Timmermans B1, Vanderwegen J, De Bodt MS (2005) Outcome of vocal hygiene in singers. Curr Opin Otolaryngol Head Neck Surg 13: 138–142. [crossref]
  24. Yiu EM, Chan RM (2003) Effect of hydration and vocal rest on the vocal fatigue in amateur karaoke singers. J Voice 17: 216–227. [crossref]
  25. Titze IR (1999) Toward occupational safety criteria for vocalization. Logop Phoniatr Vocology 24: 49–54.
  26. Verdolini K, Ramig LO (2001) Review: occupational risks for voice problems. Logoped Phoniatr Vocol 26: 37–46. [crossref]
  27. Phyland DJ, Pallant JF, Benninger MS, et al. (2013) Development and preliminary validation of the EASE: A tool to measure perceived singing voice function. J Voice 27: 454–462.
  28. Smith B (2013) Choral Pedagogy. In: Brenda J, Sataloff RT (eds). (3rdedn). Plural Publishing, North America: 344.

Intervention Breathing Exercises and Their Effect on Breathing Stereotype and Vital Lung Capacity

DOI: 10.31038/AWHC.2019211

Abstract

Objective: Breathing difficulties are abundant throughout the whole population spectrum. Breathing pattern dysfunctions are frequent despite the fact that correct breathing is a necessary prerequisite for optimal functioning of the musculoskeletal apparatus, correct body posture and mental well-being. Furthermore, good breathing ventilation is immensely important in endurance sports. The quality of breathing stereotype also influences vital lung capacity. Incorrect breathing can be caused by blocked ribs and vertebra, dysfunction of breathing and stabilisation muscles, allergies, lung diseases, heart failure and above all excessive stress. When stimuli causing unsuitable breathing stereotype prevail too long, the dysfunction becomes fixated and must be eliminated and consciously corrected (using compensation exercises).

Methods: In this research, muscle dynamometer MD03 was utilised for examination of the breathing stereotype, followed by Spirometric measurements of forced exhalation of the vital capacity and exhalation volume values for 1 second. Two months intervention of targeted breathing exercises was applied on a group of adolescent athletes (19 individuals contributing to the intervention and 18 used as a control group) aged on average 17.26 ± 1.80.

Results: Factual as well as statistically significant influence on the involvement and strengthening of breathing muscles activated during diaphragmatic breathing at rest, as well as during deep breathing was shown. Improved values of FVC (forced expiratory vital capacity) by 6 % from 4.51 ± 1.13 L to 4.78 ± 1.12 L were obtained together with improved FEV1 (the forced expiratory volume in 1 second) by 6.1 % from 3.54 ± 0.71 L.s-1 to 3.76 ± 0.66 L.s-1. Both changes are both factually and statistically significant although the factual change displays only a slight effect. Only minimal change could be sees for the control group where FVC increased by 0.45 % and FEV1 by 0.86 %. The test group also showed significant increase in breathing volumes.

Conclusion: This study has confirmed that a two-month intervention of targeted breathing exercises has both factually and statistically significant influence on the activation and strengthening of breathing muscles.

Keywords

breathing pattern, breathing exercises, posture, spirometry, vital capacity

Introduction

Dysfunctions of the breathing pattern can be first indicators of a problem within the human body, be it of mechanical, physiological or mental kind [1]. Incorrect breathing can be caused by blocked ribs or vertebra, dysfunction of breathing and stabilising muscles, allergies, lung diseases, heart failures and above all excessive stress. Major role also belongs to a change in posture control [2] or changed dynamic spine stabilisation [3]. The breathing process is perfectly coordinated and controlled by the brainstem and medulla oblongata [4]. Breathing movements happen automatically, induced by the autonomous nerves, although the depth and rhythm of the breathing can be consciously regulated. This otherwise spontaneous activity can thus be influenced by will [5, 6]. Breathing and breathing movements maintain not only the fundamental metabolic processes connected to gas exchange but they also strongly influence body posture [7]. This implies that breathing influences posture stability while at the same time the quality of postural stability influences breathing. According to Kolář et al. [8] postural stability is defined as the ability to maintain upright body posture and at the same time have the ability to react on changed external and internal forces so as to prevent an unintentional or uncontrolled fall. Dylevský, Druda and Mrázková [9] describe postural stability as a balanced and coordinated posture of the body as a unit and as a highly specialised process of maintaining body balance and position of the body and its parts in a constantly changing environment. It is a musculoskeletal regulatory body mechanism that precedes every movement and afterwards seeks to maintain the reached position. It is therefore not a simple taking of a position but a continuous maintaining of its stability [8]. Furthermore, breathing movements are influenced not only by internal and external environment but also by the state of mind. While happiness undermines extensive body posture and increases breathing movements, sadness and depression are exhibited by flexed body posture and hindrance of breathing movements [10].

Breathing movements are divided into three areas, namely abdominal, lower thoracic or diaphragmal and upper thoracic or subclavian. The thoracic breathing movements differ by the distinctive activation of the ribs in the given areas. Breathing movements go through rhythmical interchanging activity of the breathing muscles in dependence on the physical activity and the stress condition of the organism, with simultaneous activation of the axial organ muscles. Breathing muscles are further divided according to their anatomic function into primary and accessory inhalation and primary and accessory exhalation muscles with the most important breathing muscle being m. diafragma (the diaphragm) [8, 10]. During inhalation both the diaphragm and mm. intercostales externi compress. Muscle fascicles of the diaphragm are concentrically contracted causing pressure on the content of the abdominal cavity from above. This pressure is further transferred to the pelvic area, and in order to avoid prolapse of the abdominal organs the muscles of the pelvic area start contracting concentrically together with the diaphragm. These two muscle units then work as a sort of pistons working against each other from below and above forcing the content of abdominal cavity toward the remaining directions – forward and to the sides, respectively backwards. The relatively large area of the diaphragm induces an increase of the internal abdominal pressure while at the same time the lumbar spine area is heavily compressed using the function of the transverse abdominal muscle that is eccentrically activated and thus hinders the content of the abdominal cavity to move forward and to the sides causing the circumference of the waist to enlarge. On the other hand, the tendency of the abdominal cavity to move backwards during inhalation is for the majority of postural situations minimal [8, 11].

Simultaneously, the diaphragm is an important muscle for the postural function [4], with up to 75% of the volume change of the intrathoracic space during quiet breathing being caused by diaphragm function while its function alone is sufficient for 2/3 of the lung vital capacity [8]. The range of diaphragm movement is 1–2 cm during quiet breathing and up to 10 cm during heavy breathing which activates even the external intercostal muscles. Furthermore, during extreme breathing also the auxiliary respiratory muscles get activated which help to lift the first and second ribs together with sternum [12].

Clifton-Smith and Rowley [1] define dysfunction of the breathing stereotype as disproportionate breathing which is sufficient for the utterance of given symptoms even with no organic causes. Without such structural causes the dysfunction stems from muscular dysbalances, functional disorders of the muscular-skeletal system, that lead to ineffective breathing. This in its turn then induces muscular adaptational mechanisms towards the outside influences. Muscular dysbalance usually evolves due to a disturbed muscular synergy when one antagonistic muscle gains dominance over its counterpart. The cause of muscular imbalance can be even a remote dysfunction, such as reflexive change in a muscle that causes pain or influence other connected muscles which in its turn causes the organism toward an antalgic body posture not ideal for movement stereotypes [10, 11]. Therefore when trying to influence breathing functions it must be taken into consideration that the breathing and muscular-skeletal systems must be approached as interconnected [8].

In order to assess breathing stereotype, several methods can be used such as palpation examination, whole-body plethysmography, chest skiagram, spirometry or usage of different instruments that are able to detect movement of individual segments of the respiratory system [13–15]. Involvement of the individual muscle segments can be determined for instance through a 3D system [16]. Kaneko and Horie [16] conducted such measurements using thirteen probes in different positions, during quiet and deep breathing and found connections between breathing movements and age, body posture and gender. Monitoring of breathing movements is enabled by measurements of chest circumference over meso-sternale and xipho-sternale junctions, evaluating and registering the difference between in- and exhalation [13]. Bockenhauer et al. [17] measured chest broadening using a measuring tape at two different levels (heights). The upper measurement of chest expansion was conducted at the level of the spinous process of the fifth thoracic vertebra and third intercostal space in the middle of the clavicle, while the lower measurement proceeded at the level of the spinous process of the tenth thoracic vertebra and the baseplate tip. Three different people measured maximal inhalation and maximal exhalation circumference at both levels and obtained thus a value of the chest expansion. This study confirmed the objectivity of examination chest movements in the middle and upper sectors of the rib cage using a tape measure [17]. Moll and Wright [18] used two separate techniques to measure the expansibility of the chest, using the calliper and using the tape measure at the fourth intercostal space with the arms of the patient raised above the head. They then concluded that circumference measurements alone should suffice. Burgos-Vargas et al. [19] also measured the expansiveness of the chest with a tape measure at the fourth intercostal space (arms raised). The activity of the breathing muscles during breathing cycle can also be investigated through polyelectromyography examination [14]. In order to learn about the strength of the breathing muscles even non-invasive methods of examination of maximum inhalation and exhalation mouth pressures can be used [20, 21]. The performance of breathing movements is denoted as the breathing wave. It begins with inhalation, proceeds from the lower over the medium to the upper sector. The exhalation wave on the other hand starts with lowering of the abdominal wall and simultaneous caudal lowering of the chest. Further, the sternum constricts and exhalation process is finished by activated abdominal muscles [10]. The importance of measurements of the chest expansion was confirmed by Bockenhauer et al. [17], and also Fisher, Cawley and Holgate [22].Their studies all showed the important connection between the chest expansion and vital capacity of the lungs. Effectivity of highly trained long distance runners is often limited by their breathing system. Spirometric examination of the static and dynamic ventilation parameters belong to basic methods for diagnosis of the respiratory system [23].

Change in the breathing stereotype is possible through active training of deep breathing, as agreed by Thomas and McIntosh [24] in their work. During such training it is necessary to monitor the breathing pattern of the examined individual and make him aware of its possible insufficiencies [4]. In order for the consequences of the training to start showing, the training must proceed for a certain time with a minimum of ten breathing exercises which evoke an important regular rhythm in the body. One such technique is isolated breathing, where three different types of breathing are practiced, namely diaphragmal, chest and subclavian breathing. The aim of diaphragm breathing is above all to realise its activity and learn to use it. The focus of chest breathing is then to gain increased flexibility of the rib cage, while subclavian breathing is meant to loosen the area of the neck and teach about the accessibility of the upper lobes of the lungs [6].Training exercise of at least six to eight weeks is necessary in order to be able to influence intermuscular coordination and improve intermuscular cooperation. Adaptational changes in the form of hypertrophy then appear after longer time, within months or years [25].

In both clinical and sporting practice vital capacity of the lungs is most often measured using the FVC test (basic forced volume vital capacity), where also the velocity of exhalation is determined, for instance for the time period of one second (FEV1), which also points to the strength of the exhalation muscles, an important and surveyed factors in endurance sports. Higher values of vital capacity (VC) can be reached through endurance training, although the values are also influenced by body constitution and size of the rib cage [26]. During long-term submaximal training inhalation muscles experience fatigue which is a limiting factor in endurance training. However, breathing exercises can enhance the efficiency of the breathing muscles. Endurance athletes usually have higher values of vital capacity, although their performance needs not be directly dependent on those. Highest values of VC have been determined for swimmers (up to 8 litres) which results from their breathing into the water and therefore against resistance. Adapted breathing is exhibited by a lower breathing work during same load in comparison to the unadapted. A certain amount of oxygen then remains for other purposes. As a consequence of endurance training the respiratory tract increases its ability to transport oxygen, which will also show during load. On the other hand, the maximum static and dynamic values remain basically unchanged. The aim of this work was to determine the influence of the intervention breathing exercises on the breathing stereotype and values of the forced volume vital capacity of the lungs [26].

Methodology

This study was conducted in the Laboratory of stress diagnosis, at the Department of Physical Education and Sports, Pedagogical faculty of the South Bohemian University. 37 individuals aged 17.26 ± 1.80 participated in this study, where each does endurance sport training six times a week; they are mostly mid-distance and long-distance runners. 19 individuals were involved in the intervention (ten females and nine males), while eighteen individuals functioned as a control group (nine females and nine males). The age of the females at the time of the study was 17.40 ± 2.01 years of age, with average weight 59.07 ± 6.70 kg and height 169.47 ± 4.04 cm. The age of the male group at the time of the research was 17.11 ± 1.52 years of age, average weight 60.47 ± 14.32 kg and height 176.40 ± 9.49 cm. Targeted selection was conducted based on the fact that endurance athletes are expected to have above-average breathing functions with strong connection to their performance. The aim of this research was to prove the influence of breathing exercises on the values of vital capacity of the lungs (VC) and on the quality of the breathing pattern. It was presumed that there will be a transfer of increased values of VC to values of breathing volume under load, which in its turn will influence endurance performance, which consecutive research will prove.

Vital capacity was measured using basic forced volume vital capacity test (FVC) as well as exhalation values under 1s (FEV1). Thereafter, the test group got instructions to conduct breathing exercises for two months, minimum five times a week for at least ten minutes. At the same time, once a week a common exercise session was organised at the end of running training session, where the execution of the exercises was checked and corrected. The tested individuals would each day take notes of the time of the exercises into a prepared table that they continuously checked in. After two months a re-test was conducted of all followed variables. Same measurements were simultaneously conducted for the control group. Test methodology was conducted according to the instrument instructions: after quiet inhalation and exhalation follows maximal inhalation and forced maximal exhalation. This procedure is repeated three times and the best result is registered. The instrument registers if sufficient force and necessary length of exhalation were used. If the parameters of the test were insufficient, the experiment was not registered and experiment needed to be repeated. The FVC test was conducted in upright position with Spirometer Otthon instrument, while the evaluation was conducted using ThorSoft program. Figure 1 shows the development of the breathing curve as registered by the spirometer instrumentation.

Muscle dynamometer was used for the examination of breathing stereotype [27–30]. Due to the ability of the muscle dynamometer to register movement dynamics, it is possible to use it to monitor the dynamics of the breathing function. Breathing analysis is based on the concept of three sectors (parts) of the chest and therefore three measuring sensors were also used. The exact positions for placing the sensors were chosen based on the kinematics of the mentioned chest sectors [9].The lower chest sector (abdominal) is found below apertura thoracis inferior. Anatomically the abdominal muscles and their initiations on the cartilaginous parts of the false ribs and the breast bone participate in the build-up of this part of the chest. The correct spot for the first sensor is then on the ventral side at level of L4–5. For the central sector of the chest the correct placement is on the thoracic spine limited by the area between Th6-Th12 and the fifth to twelfth rib. The sensor for this sector was placed on the level of 8–9 rib on the ventral side just below the sternum. The upper chest sector (apical) spreads from C4 to Th3–4 to the upper aperture and the fifth rib. The third sensor was placed on the level of 3 to 4 rib on the ventral side in the area of the sternum. Movements of the thoracic spine sector influence the dynamics of breathing, while breathing will influence dynamics of the spine [8].The test of breathing dynamometry is conducted in the upright body position as this position is physiological for breathing [4]. The dynamometer instrument can register activation of the breathing muscles, as it measures immediate values of force activity of the muscles as a function of time. Both the strength and dynamics of the muscle force can be evaluated. Through the sensors the lifting of individual segments during quiet breathing for one minute and during deep breathing for one minute was monitored. During data analysis ten inhalations and exhalations was averaged. The test group trained the breathing exercises for eight weeks. The intervention program was focused on isolated breathing in different positions, training for the breathing wave, full breathing and rhythmical breathing. Full breathing was also trained in accordance with movements during short dynamical sets of exercises [31–33]. After input measurements, the test group was introduced to breathing exercises and their training was conducted under expert supervision. The test group was asked to conduct the given exercises at home at least five times a week for at least ten minutes. Once a week a mutual training session was organised, after running training session, where the exercises were checked and corrected by expert supervisor. An output examination similar to the input one was conducted. The control group did not do any breathing exercises. For evaluation of the collected data these tests were used: the determination of the effective significance Cohen’s d test for determination of practical significance and Student‘s paired t-test for dependent samples. The level of significance was determined based on α = 0.05. Data analysis was conducted using Microsoft Excel 2016 and Statistica 12.

Results

The test group athletes did breathing exercises for two months for 13.2 ± 3.87 minutes a day on average. The FVC results before the intervention exercises (Figure 1) were calculated to 4.51 ± 1.13 L and those after the intervention time equalled 4.78 ± 1.12 L (see Figures 2 and 3). For the control group the results amounted to 4.39 ± 1.21 L before the intervention and 4.41 ± 1.23 L thereafter. For the test group the improvement of the breathing volume during FVC was 6.0 % while for the control group 0.45 %. Therefore for the test group the factually significant improvement of the FVC (Cohen’s d = 0.24, small effect), is therefore statistically significant (Figure 2, 3). No significant differences between male and female individuals were found.

AWHC-18-116 - Renata Malátová_Czech Republic_F1

Figure 1. Breathing curve during FVC test.

AWHC-18-116 - Renata Malátová_Czech Republic_F2

Figure 2. FVC value for tested individuals before the intervention of breathing exercises and after.

AWHC-18-116 - Renata Malátová_Czech Republic_F3

Figure 3. The distribution of values of FVC in tested individuals before interventions breathing exercises and after.

During the analysis of the breathing movements (Figure 4) in the individual sectors of the chest after the intervention program, an improvement particularly for the abdominal breathing was found, for both the quiet breathing, increase by 46.5 % (Cohen’s d=0.56, medium effect), and deep breathing with increase by 61.5 % (Cohen’s d = 0.82, large effect). For subclavian breathing both factually and statistically significant increase by 19.2 % of its contribution to deep breathing was found (Cohen’s d = 0.42, small effect). An increase for quiet subclavian breathing by 6.9 % was observed, although the change is neither factually or statistically significant (Cohen’s d = 0.11). For chest breathing a decrease in values by 20.5 % during quiet breathing was found, a change that is factually (Cohen’s d = 29.4, small effect) although not statistically significant. For deep chest breathing the activity of breathing muscles decreased by 21.8 %, a change that is factually (Cohen’s d = 35.9, small effect) and statistically significant. For the control group no factually or statistically significant change was observed, with change not larger than 1.5 % for any breathing muscle segment was found.

AWHC-18-116 - Renata Malátová_Czech Republic_F4

Figure 4. Involvement of the different segments of the thorax during quiet breathing and deep breathing before the intervention and after (breathing: BK – abdominal quiet, BH – abdominal deep, HK – chest quiet, HH – chest deep, PK – subclavian quiet, PH – subclavian deep).

Discussion

In order to be able to strengthen the necessary breathing muscles during the intervention, the three sections of deep breathing must be consciously acknowledged, trained separately and then reunited. The first most important section of breathing is the diaphragmal or abdominal breathing that is responsible for 60% of the full breathing efficiency. Chest breathing corresponds to 30% and subclavian to 10% of efficient breathing. The given percentage ratio applies to most of everyday activities. During physical exercise or some (pathological) changes in the organism this ratio is significantly changed [34]. As Kolář et al. [8] state the fact remains that the diaphragm is responsible for 2/3 of the gas exchange in the lungs.

The aim of the intervention program was to achieve controlled optimal stabilisation interplay of the breathing muscles and make the correct breathing stereotype automated. The emergence and development of overload on the musculoskeletal system can thus be prevented. However, success of the therapy is highly dependent on active participation of the test group. The output examination concluded improvement of both quiet and deep abdominal, as well as deep subclavian breathing. At the same time the chest breathing was shown to decrease for both the quiet and deep breathing types. Breathing movements that led to improved diaphragm breathing and simultaneous decrease of activity of chest breathing represents a positive change towards optimal activation of breathing muscles [8].The reality that needs to be respected is the fact that postural functions, positioning of the body in certain position or during a movement and the breathing functions are strongly interconnected and the keystone of this connection is the diaphragm, the major breathing muscle. A positive influence on the breathing pattern will also improve the stabilisation function of the diaphragm. Véle [10] states that quite frequently we meet patients with inspiratory positioning of the thorax (horizontal progression of the ribs) with activated accessory muscles (auxiliary inhalation muscles) during quiet breathing. These muscles have multiple connections onto the spine and for long-term inspirational positioning these muscles become central for the positioning of individual segments of the spine. This is the primary objective necessary to alter and teach the patient how to relax these muscles and at the same time activate the muscles of the lower respiratory sector so that the dysfunction of the breathing mechanism can be eliminated and as a feedback the postural functions can be influenced. This aim has been achieved by the application of the intervention program and the diaphragmal breathing was improved.

The chest and diaphragm breathing complement and compensate each other, which is why their function must be optimised. If the chest expansion is malfunctioning and the chest is rigid, the participation from the diaphragm increases and starts to dominate and vice versa. Provided that the extension of the chest is desired, the abdominal wall muscles need first to become relaxed in order for the diaphragm to be able to get as low as possible. During exhale, the abdominal muscles must contract to cause the compressed bowels to push the diaphragm up in the cranial direction. This causes a decrease of the chest volume and the exhale deepens. During influence of the external forces abdominal muscles are gradually activated, fixating the lower section of the chest. At the same time the spine is stabilised and hinders inspirational positioning of the chest [8]. Success of the therapy presumes an active participation of the test group. This was not always the case and for some tested individuals the improvement was minor, for some even negative. Once a week the exercises were conducted under supervision and their correct performance checked and if necessary corrected. The rest of the week, though, the exercises were conducted in home environment outside supervisor control where the effect of the exercises could be influenced by the quality of their performance. The results of the FVC tests are therefore not uniform, with half of the test group showing improvement by more than 0.3 L, while two individual did not show any improvement. After the two-month intervention exercises an improvement in FVC values was achieved for 95 % of the followed individuals. This change is furthermore both factually and statistically significant. No factually significant differences were observed between male and female individuals. For the FEV1 values an improvement was observed for 78 % of the tested individuals, for half of them by more than 0.3 Ls-1. One quarter of the individuals exhibited worsened, if by minimum, FEV1 values.

Conclusion

This study has confirmed that a two-month intervention of targeted breathing exercises has both factually and statistically significant influence on the activation and strengthening of breathing muscles through diaphragm breathing during both quiet and deep breathing and has at the same time factually and statistically significant influence on elevation of FVC and FEV1 values.

Acknowledgement

This research was supported by Grant agency of the University of South Bohemia within Team research project no. 034/2015/S.

References

  1. Clifton-Smith T, Rowley J (2011) Breathing pattern disorders and physiotherapy: inspiration for our profession. Physical Therapy Reviews 16: 75–86.
  2. Baltich J, von Tscharner V, Nigg BM (2015) Degradation of postural control with aging. Proc Inst Mech Eng H 229: 638–644. [crossref]
  3. Karakoyun DO, Özkaya M, Okutan VC, Dalgıç A, Belen D, et al. (2015) Biomechanical comparison of unilateral semi-rigid and dynamic stabilization on ovine vertebrae. Proc Inst Mech Eng H 229: 778–785. [crossref]
  4. Smolíková L, Mácek M (2010) Respiratory Physiotherapy and Pulmonary Rehabilitation. Brno: National center of nursing and non-medical health care.
  5. Mourek J (2005) Physiology: textbooks for medical students. Prague: Grada.
  6. Votava J (1988) Yoga by the doctor‘s eye. Prague: Avicenum.
  7. Véle F (2006) Kinesiology: a review of clinical kinesiology and pathogenesis for the diagnosis and therapy of musculoskeletal disorders. Prague: Triton.
  8. Kolár P, Bitnar P, Dyrhonová O, Horáček O, Kríž J, Adámková M … Zumrová I (2009) Rehabilitation in Clinical Practice. Prague: Galén.
  9. Dylevsky I, Druda R, Mrázková O (2000) Functional anatomy of man. Prague: Grada.
  10. Véle F (2012) Investigation of motor functions from a neurophysiological point of view: a guide for therapists working in neurorehabilitation. Prague: Triton.
  11. Malátová R (2015) Breath stereotype disorders. In Brodáni, Movement and Quality of Life 2015. Nitra: KTVŠ PF UKF Nitra.
  12. Rokyta R (2000) Physiology: for Bachelor Studies in Medicine, Natural Sciences and Physical Education. Prague: ISV.
  13. Cahalin LP (2004) Pulmonary evaluation. In: DeTurkW. E. & Cahalin L. P. (eds.). Cardiovascular and pulmonary physical therapy. McGraw-Hill, New York, USA.
  14. Kandus J, Satinská J (2001) A brief guide to the treatment of lung function. Brno: Institute for Further Education of Worker in Health Care.
  15. Lewit K (2003) Manipulative treatment in myoskeletal medicine. Prague: Saving Technology.
  16. Kaneko H, Horie J (2012) Breathing movements of the chest and abdominal wall in healthy subjects. Respir Care 57: 1442–1451. [crossref]
  17. Bockenhauer SE, Chen H, Julliard KN, Weedon J (2007) Measuring thoracic excursion: reliability of the cloth tape measure technique. J Am Osteopath Assoc 107: 191–196. [crossref]
  18. Moll JM, Wright V (1972) An objective clinical study of chest expansion. Ann Rheum Dis 31: 1–8. [crossref]
  19. Burgos-Vargas R, Castelazo-Duarte G, Orozco JA, Garduño-Espinosa J, Clark P, et al. (1993) Chest expansion in healthy adolescents and patients with the seronegative enthesopathy and arthropathy syndrome or juvenile ankylosing spondylitis. J Rheumatol 20: 1957–1960. [crossref]
  20. Harik-Khan RI, Wise RA, Fozard JL (1998) Determinants of maximal inspiratory pressure, The Baltimore Longitudinal Study of Aging. Am J Respir Crit Care Med 158: 1459–1464.
  21. Rochester CL (2003) Exercise training in chronic obstructive pulmonary disease. J Rehabil Res Dev 40: 59–80. [crossref]
  22. Fisher LR, Cawley MI, Holgate ST (1990) Relation between chest expansion, pulmonary function, and exercise tolerance in patients with ankylosing spondylitis. Ann Rheum Dis 49: 921–925.
  23. Kenney WL, Wilmore J, Costill D (2015) Physiology of Sport and Exercise 6th Edition. Human kinetics.
  24. Thomas JA, McIntosh JM (1994) Are incentive spirometry, intermittent positive pressure breathing, and deep breathing exercises effective in the prevention of postoperative pulmonary complications after upper abdominal surgery? A systematic overview and meta-analysis. Physical Therapy 74: 3–10.
  25. Dovalil J, Choutka M, Svoboda B, Hošek V, Peric T, et al. (2005) Výkon a trénink ve sportu. Praha: Olympia.
  26. Bartunková S, Heller J, Kohlíková E, Petr M, Smitka K, et al. (2013) Fyziologie pohybové záteže. Praha: FTVS UK.
  27. Malátová R, Pucelík J, Rokytová J, Kolár P (2007) The objectification of therapeutical methods used for improvement of the deep stabilizing spinal system. Neuro Endocrinol Lett 3: 315–320.
  28. Malátová R, Pucelík J, Rokytová J, Kolár P (2008) Technical means for objectification of medical treatments in the area of the deep stabilisation spinal system. Neuro Endocrinol Lett 1: 125–130.
  29. Malátová R, Drevikovská P (2009) Testing procedures for abdominal muscles using the muscle dynamometer SD02. Proc Inst Mech Eng H 223: 1041–1048. [crossref]
  30. Malátová R, Rokytová J, Stumbauer J (2013) The use of muscle dynamometer for correction of muscle imbalances in the area of deep stabilising spine system. Proc Inst Mech Eng H 227: 896–903. [crossref]
  31. Polášek M (1990) Joga eight stages of training. Bratislava: Sport.
  32. Kombercová J, Svobodová M (2000) Autorehabilitační sestava. Prague: Fountain.
  33. Bursová M (2005) Compensation exercises. Prague: Grada.
  34. Sponar, D. (2003). The basics of breathing. http://www.cvicime.cz/pdf/prace_s_dechem.pdf.

Surface Roughness Evaluation of Different Polishing Techniques on Dental Porcelains By Atomic Force Microscopy

DOI: 10.31038/JDMR.2018124

Abstract

Introduction: This study was conducted to find out different polishing techniques’ effects on different porcelain materials by using atomic force microscopy (AFM).

Material and Methods: Samples were made from four different porcelain materials (VMK 95, Ceramco III, Matchmaker, Vitablocs Mark II). Nine groups (n = 5) were randomly formed from the samples of each ceramic and nine different polishing methods were applied on them. AFM was used to evaluate the external topography and roughness of dental porcelains. To analyze the results of the study ANOVA and Tukey test were used statistically ( = 0.05).

Results: Within the porcelain groups Ceramco and Matchmaker had higher Ra values, however VMK 95 and Mark II had lower Ra values. However when the different polishing techniques were compared, Gl (.1110) and SlPg (.2295) were found to have the lowest Ra values and no statistical differences were found between these two techniques (p > .05). In addition, no differences were found between glazed samples (Gl) and after polishing with Sof-lex and Prisma Gloss (Sl-Pg). On the other hand polishing with Sl and Pg together (Sl-Pg) significantly decreases the surface area.

Conclusions:There were statistically significance between the glazed and the other specimens. Different polishing methods influenced the surface topography of different porcelains significantly ( p < .001).

Key words

AFM, surface roughness, polishing, dental porcelain

Introduction

The key factor of an esthetic fixed restorations is dental porcelains. Transparency, conveyance of light, and biocompatibility supply dental ceramics with exceptionally advantageous esthetic properties [1]. A smooth surface is important for the function, esthetic and biocompatibility of dental porcelains [2] and also it’s preferable to decrease bacterial holding and to obtain a clear appearance [3]. The dental porcelain surface finishing procedure is achieved by glazing since their surfaces are smooth. In the delivery of porcelain fixed prosthesis, external alterations are crucial to improve occlusal obstructions and poor contours, to finalize the boundary of porcelains, and to enhance final look of restorations [4]. Generally, a smooth surface is essential because surface modifications of the porcelain damage glazing, thus creating rough, unpolished, nutrient-enhancing surfaces.

In this situation to refinish the porcelain surfaces intraorally with different polishing methods are mandatory to restablish surface smoothnes [4, 5]. To create the surface smoothness of dental porcelains there are many different mechanical polishing methods using rotary instruments such as diamond bars and drills, different pastes, stones, rubber discs or different polishing kits.

Atomic force microscopy (AFM) is an important tool for qualitative and quantitative evaluation of surfaces which is presented in 1986 by Binning et al [6] . With the help of mechanical scanning, AFM directly inspects the exterior of the sample without using any lens or photon. With a sharp tip on, it scans over a surface, and measures the deflection, it is possible to get a topographic photograph of the surface. The deflection sensor may help to measure with enough sensitivity in disclose profiles with nanometer scale resolution [7]. With the contact, noncontact and tapping modes it’s possible to have three different measurement records from different samples. AFM topographs give quantitive and structural (3D) information about surface of a material nanometrically which allows a high accuracy in finding out the external roughness. AFM can analyze the external roughness of dental porcelains [5, 8–11]. The null hypothesis in this research was that there are no differences between surface roughness of dental porcelains after different polishing methods by means of AFM evaluation.

Material and Methods

Four different commonly used dental porcelains (Vita VMK 95, Ceramco, Vitablocks Mark II and Matchmaker) and six different polishing systems glaze, finishing and polishing with polishing discs (Sof-Lex), polishing kit (Dialite II), polishing pastes (Sparkle, Zircate, Prisma Gloss) and combinations of them were investigated in this study (Table 1). One researcher prepared cylindrical samples (15x2mm) of four different dental porcelains by means of using polyvinylsiloxane mold to encapsulate the ceramics. All of the samples were mixed with a standart quantity of ceramic and liquid which were placed in the mold and condensed by using a plastic aparatus. A tissue (Selpak; Eczacıbaşı Holding, Sakarya, Turkey) was used to absorb excess moisture (Programat P80; Ivoclar Vivadent, Liechtenstein). The samples were taken away and putt into the oven in line with the producer’s instructions (roughly 920–960ºC ). The rectangular ceramic samples which were 12, 14, 18 mm in size were sliced into pieces of 2, 14, 18 mm in size with a Buehler Isomet Low Speed cutting machine (Lake Bluff,  Illinois,  60044–1699,  USA). For a period of ten seconds, 600 grit silicon carbide paper was used by using a 300-rpm grinding MetaServ polishing (MetaServ, Buehler, England) to wet-ground ceramic discs. The samples were grouped in nine subgroups (n = 5) and the following procedures were applied (Table 2):

Table 1. Materials used in the study.

Material

Manufacturer

Material

VMK 95

Vita Zahnfabrik, Germany

Feldspathic porcelain

Ceramco III

Degudent GmbH,USA

Feldspathic porcelain

Matchmaker MC

Schottlander,UK

Low fusing porcelain

Vitablocks Mark II

Vita Zahnfabrik, Germany

Machinable feldspathic porcelain

Sof-Lex

3M ESPE,USA

Finishing and polishing dics

NTI Cera Glaze

NTI-Kahla GmbH,Germany

Porcelain polishing kit

Dialite II

Brasseler,USA

Porcelain polishing kit

Sparkle

Pulpdent,USA

Diamond polishing paste

Zircate

Dentsply,USA

Zirconium silicate cleaning-prophy paste

Prisma Gloss

Dentsply,USA

Aluminium oxide polishing paste

Table 2. Different polishing groups.

Study Groups

Polishing Techniques

Group- Gl

Glaze

Group- Sl

Sof- lex discs

Group- Di

Dialite II polishing kit

Group- Sp

Sparkle diamond polishing paste

Group- Zr

Zircate polishing paste

Group- Pg

Prisma Gloss polishing paste

Group- SlSp

Sof- lex + Sparkle

Group- SlZr

Sof- lex + Zircate

Group- SlPg

Sof- lex + Prisma Gloss

Group Gl: with a predetermined glaze material, the samples were glazed.

Group Sl: the samples were polished with polishing discs of 12.7 mm diameter (Sof-Lex; 3M/ESPE, St. Paul, MN, USA) for ten seconds for fine and superfine discs at 30, 000 rpm and for ten seconds for coarse and medium discs at 10, 000 rpm by using an electric handpiece set by following the producer’s directions.

Group Di: Dialite II ceramic polishing kit which had pre, fine and high-shine wheels was used to polish the samples for ten seconds at 10, 000 rpm.

Groups Sp: Sparkle diamond polishing paste was applied for ten seconds to the samples with a prophylaxis rubber cup (Kenda Polishers, Kenda AG, Liechtenstein) mounted on an electric handpiece at 15, 000 rpm.

Groups Zr: Zircate zirconium silicate cleaning-prophy paste was applied as in the same method of Groups Sp above.

Groups Pg: Prisma Gloss aluminum oxide polishing paste was applied as in the same method of Groups Sp above.

Group SlSp: The samples were polished first by following the procedure in Group Sl and then by following the procedure in Group Sp.

Group SlZr: First by following the procedure in Group Sl, the samples were polished and then by following the procedure in Group Zr, zirconium silicate cleaning-prophy paste was applied.

Group SlPg: First polishing was done by following the procedure in Group Sl and then by following the procedure in group Pg aluminum oxide polishing paste was applied on the samples.

The same investigator performed all polishing procedures. Lastly, the specimens were cleaned ultrasonically for 10 min (Eurosonic Energy, Euronda, Italy) by using deionized water and then they were dried. Porcelain specimens were evaluated under an AFM (AFM, PSIA XE-100E, PSIA Inc, CA, USA) to obtain a quantitive and qualitative evaluation [5]. With a scan length of 20µm x 20µm and a scan rate of 0.5Hz [12]. AFM images were photographed (Figure 1a-4b). Following different external procedures, the average surface roughness (Ra) of the ceramic substrate was examined by a single operator and analyzed after different surface treatments. Three measurements were performed from three different areas all located in the centre of the specimens [13, 14]. Means and standart deviations of surface roughness measurements were determined. Two-way ANOVA was used to evaluate surface roughness data and SPSS (12.0.1; SPSS Inc, Chicago, IL, USA) was used for statistical analyses. Tukey was used to compare the mean values (p < 0.05).

Results

The null hypothesis of the study was rejected. Statistically significant differences occured due to the various polishing methods on the external topography of different porcelains (p < .001). In the figures (1a-4b) respectively three dimensional AFM images of different porcelain specimens subjected to different surface treatments are shown. There were statistically significance between the glazed and the other specimens (p < .05). On the other hand polishing with sof-lex and aluminum oxide polishing paste together (Sl-Pg) significantly decreases the surface area.

When the porcelain specimens are compared Mark II and VMK 95 were statistically different from Ceramco III and Matchmaker, and both of them presented similar result within as seen in (Table 3). When the polishing techniques are compared, group of Gl (.1110) and SlPg (.2295) were found to have the lowest Ra values and there were no statistically significant differences between the two groups (Table 4) (p > .05). The highest Ra value was obtained in the group of Sp (.8511) (p = .05).

Table 3. Mean surface roughness and differences between the groups of porcelains.

Porcelains

Ra

Difference*

VMK 95

,3895

A

Mark II

,3456

A

Ceramco

,4907

B

Matchmaker

,4967

B

* Mean Ra values for groups in non homogeneous subsets are displayed with different letters p= .05

Table 4.Mean surface roughness and differences between the groups of surface treatments.

Surface Treatment

Ra

Difference*

Gl

,1110

A

SIPg

,2295

Ab

SIZr

,3507

Bc

Zr

,4359

Cd

Pg

,4384

Cd

Di

,4609

Cd

SISp

,4727

Cd

SI

,5255

D

Sp

,8511

E

* Mean Ra values for groups in non homogeneous subsets are displayed with different letters p= .05

When all the porcelains’ surfaces were evaluated, the highest Ra value was in the group of Mark II Sp (1.147) (Figure 1a) and the lowest value was in Mark II Gl (0.0860) (Figure 1b) (Table 5). When the Ra value of VMK 95 porcelain evaluated the highest Ra was in the SlSp (Figure 2a) and the lowest was in Gl group (Figure 2b). There weren’t statistically significant differences between groups SlZr, Pg, SlPg, Zr, Sp and SlSp for VMK 95 porcelain (Table 6). When the Ra value of Mark II porcelain evaluated the highest Ra was in the Sp (Figure 1a) and the lowest was in Gl group (Figure 1b). There weren’t statistically significant differences between groups SlZr, Di, Pg, and Zr for Mark II porcelain (Table 5). When the Ra value of Matchmaker porcelain evaluated the highest Ra was in the Sl (Figure 3a) and the lowest was in Gl group (Figure 3b). No statistically significant differences were found between groups Gl, SlPg, SlZr and also the groups of Di, Pg, Zr, Pg, Sl ve Sp for Matchmaker porcelain (Table 7). When the Ra value of Ceramco porcelain evaluated the highest Ra was in the Sp (Figure 4a) and the lowest was in SlPg group (Figure 4b). No statistically significant differences were found between groups SlZr, Di, Pg, Zr, Pg, SlSp, Sl for Ceramco porcelain (Table 8).

JDMR-18-107-Goknil Ergun_Turkey_F1a

Figure 1a. Atomic force microscope image of Mark II Sp.

JDMR-18-107-Goknil Ergun_Turkey_F1b

Figure 1b. Atomic force microscope image of Mark II Glaze.

Table 5. Mean surface roughness and differences for the Mark II porcelain subjected to different surface treatments.

Surface Treatment

Ra

Difference *

Gl

,0860

A

SIPg

,2473

Ab

SIZr

,3660

Bc

Zr

,4293

Bcd

Pg

,4510

Bcd

Di

,4593

Cd

SISp

,5973

Bcd

SI

,6333

D

Sp

1,147

E

* Mean Ra values for groups in non homogeneous subsets are displayed with different letters p= .05

JDMR-18-107-Goknil Ergun_Turkey_F2a

Figure 2a. Atomic force microscope image of VMK SlSp.

JDMR-18-107-Goknil Ergun_Turkey_F2b

Figure 2b. Atomic force microscope image of VMK Glaze.

Table 6. Mean surface roughness and differences for the VMK 95 porcelain subjected to different surface treatments.

Surface Treatment

Ra

Difference *

Gl

,1163

A

SIPg

,2960

Ab

SIZr

,3303

Bc

Zr

,3680

Cd

Pg

,3703

Cd

Di

,3830

Cd

SISp

,4720

Cd

SI

,4837

D

Sp

,6860

E

* Mean Ra values for groups in non homogeneous subsets are displayed with different letters p= .05

JDMR-18-107-Goknil Ergun_Turkey_F3a

Figure 3a. Atomic force microscope image of Matchmaker Sl.

JDMR-18-107-Goknil Ergun_Turkey_F3b

Figure 3b. Atomic force microscope image of Matchmaker Glaze.

Table 7. Mean surface roughness and differences for the Matchmaker MC porcelain subjected to different surface treatments.

Surface Treatment

Ra

Difference*

Gl

,1353

A

SIPg

,1840

Ab

SIZr

,3817

Abc

Zr

,6187

Cde

Pg

,5360

Cde

Di

,6980

De

SISp

,4540

Bcd

SI

,7887

E

Sp

,6740

Cde

* Mean Ra values for groups in non homogeneous subsets are displayed with different letters p= .05

JDMR-18-107-Goknil Ergun_Turkey_F4a

Figure 4a. Atomic force microscope image of Ceramco Sp.

JDMR-18-107-Goknil Ergun_Turkey_F4b

Figure 4b. Atomic force microscope image of Ceramco SlPg.

Table 8. Mean surface roughness and differences for the Ceramco porcelain subjected to different surface treatments.

Surface Treatment

Ra

Difference *

Gl

,1063

a

SIPg

,1037

a

SIZr

,2870

ab

Zr

,2020

ab

Pg

,4180

b

Di

,2523

ab

SISp

,2913

ab

SI

,3497

ab

Sp

1,100

c

* Mean Ra values for groups in non homogeneous subsets are displayed with different letters p= .05

Discussion

The present study used AFM to examine the effect of various polishing techniques on four different conventional porcelain systems. Feldspathic VMK 95 and Mark II porcelain surfaces demonstrated significant lower Ra value than the other two porcelain systems after different polishing systems. The null hypothesis of the study was not accepted. There are several studies that report the effectiveness of porcelain polishing systems. Some authors report that there is no differences between the glaze and the polishing systems while others say that different polishing methods are not able to make a smooth surface as good as glazed [5, 15–24 ].

In the present study easy, useful and effective polishing systems were chosen. Sof-Lex is generally useful for the polishing of composites, and the manufacturer offers to use this system on the polishing of porcelains [16, 25]. NTI, CeraGlaze and Dialite II are two different polishing kits which are cheaper than diamond pastes. They are easy to use intraorally. Sparkle is a diamond paste which is indicated to use on porcelains, composites, gold and other alloys.

Zircate, is a zirconium silicate polishing paste which is indicated for tooth polishing [17, 26]. After periodontal threaphy polishing paste must not give damage to the restorative materials which are in the oral cavity. In this study we intend to observe the effect of zircate on porcelains. Prisma Gloss is an aluminium oxide polishing paste which is often used on composites [18, 27]. It’s also used in this study to observe its effectiveness on porcelains.

Flexural strength is affected by the material’surface roughness. Due to the decrease of the roughness of porcelain specimen surfaces, its flexural strength increases [19, 28 ].

The amount and the size of the abrasive fillers, and the shape of the polishing materials are the crictical issues for selection of the abrasive type for different contents of dental ceramics [18, 23]. It was observed that the surfaces of the ceramics were very rough and varied significantly for different polishing techniques and ceramic types. Vitablocs Mark II, which includes a glass matrix with nearly 30 vol% irregularly-shaped crystalline particles, is a modified feldspathic porcelain which is crystalline reinforced. It was stated by Yin et al [19] that surface finishing of Mark II which consisted of uniform and fine mica crystals was not succesful in decreasing surface roughness values. After mica crystals were cut with sharp Al2O3 abrasive particles, high peaks were left by Sof-lex disc. Leucite content of the dental ceramic seems to play an important role in surface roughness. Leucite porcelain involves fine leucite crystals which diffuse in glass matrix. Hence, when compared with porcelains with higher leucite content, lower leucite content were likely to show lower roughness after they were polished with rubber or disc followed by diamond pastes [18, 29]. In this study, lowest surface roughness was found in Glaze followed by Sof-Lex+Sparkle and Sof-Lex+ Prisma Gloss. However Sparkle polishing paste presented the highest Ra value with a mean of 1.147.

Different methods can be used to assess external roughness. In research on external roughness in dental materials, while qualitative methods such as SEM have been employed, quantitative methods such as surface profile analysis like profilometry and AFM have been employed. SEM has disadvantages in illustrating external topography, images allow only a two-dimensional view. In terms of both micron and nanometre scales, AFM has turned out to be a useful tool in examining material structure [20, 30]. To obtain the three-dimensional view and to evaluate the surface topography of various ceramics at nanometre scale, the surfaces were surveyed using AFM. SEM analysis confirmed the results obtained with profilometer in several studies [5, 15, 18, 22, 24].

In this study, polished ceramic types’ usual three diameter surfaces which were atained by AFM imaging (Figure 1b – 4b) showed a rougher surface for unglazed sample which included higher crystallites with pointed peaks coming out of the surface perpendicularly. In addition, when compared with glazed ceramics, this type was found to have deeper cracks. Glaze seals are known to crack and pore within the ceramic material. Three digital imaging of the glazed sample (Figure 1a) shows that glaze has smoothed the sharp edges. RMS values, Ra values and Z range were shown to be significantly (p < 0.01) higher in the unglazed samples as a result of statistical analysis.

In the study of Kakaboura et al [31], the surface characteristics of resin composites were illustrated through quantitative assessment of two-dimensional and three-dimensional profilometry and qualitative measurements by AFM and SEM. It was concluded that in distinguishing external roughness, AFM method was better when compared with two-dimensional profilometry and when compared with SEM, it defined external texture in more detail. Before this study Sarikaya and Guler [29] were evaluated surface roughness of the same materials subjected to the same polishing methods by profilometry. When we compared the results of the two study it’s obviously seen that AFM apperared to offer a powerful tool to directly evaluate the roughness of porcelain specimens. The differences between the two study may be due to the method of the surface roughness evaluation. In the results of their study it was seen that feldspathic ceramics (Mark II) had lower Ra values when compared with the others. In this study Mark II has lower Ra value (0, 3456) than feldspathic porcelain (VMK95) (0, 3895) but there wasn’t statistically differences between two materials. Also there were significantly differences among the polishing techniques for the Ra values of Mark II porcelain. Why the differences between the results of two study may be the effect of evaluation method of surface roughness measurements (profilometry and AFM).

Some authors have even recommended such polishing techniques as alternatives to glazing [15–24, 29, 32–34] but they concluded that it will be the object of further study. Also further studies are need with different composition of the particles and matrix substance, shape of the particles of abrasive ceramic polishing discs and wheels.

Conclusion

  1. The surface roughness of the glazed ceramic material was lower than of the other polishing treatments.
  2. The crystallites of the unglazed ceramic surfaces has higher and the pores were deeper compared to the glazed samples.
  3. Sof-Lex+Sparkle and Sof-Lex+ Prisma Gloss polishing techniques may be alternatives to glazing.
  4. AFM is a powerfull tool for the evaluation of surface roughness.

Conflicts of Interest: The authors declare that there is no potential conflicts of interest with respect to the authorship or publication of this article.

Funding Statement: This work is supported in part by Ondokuz Mayis University, PYO.DIS.1901.09.003

References

  1. Shillingburg HT, Hobo S, Whitsett LD, Jacobi R, Brackett SE (1997) Fundamentals of Fixed Prosthodontics. (3rdedn). Quintessence Publishing Co, Inc, Canada Pg No: 433–436.
  2. Yilmaz K, Ozkan P (2010) The methods for the generation of smoothness in dental ceramics. Compend Contin Educ Dent 31: 30–32, 34, 36–8 passim. [crossref]
  3. Craig RG, Powers JM, Wataha JC (2004) Properties and Manipulation. (8th edn). Mosby; Dent. Mat, China Pg No: 113.
  4. al-Wahadni A, Martin DM (1998) Glazing and finishing dental porcelain: a literature review. J Can Dent Assoc 64: 580–583. [crossref]
  5. Tholt de Vasconcellos B, Miranda-Júnior WG, Prioli R, Thompson J, Oda M (2006) Surface roughness in ceramics with different finishing techniques using atomic force microscope and profilometer. Oper Dent 31: 442–449. [crossref]
  6. Binnig G, Quate CF, Gerber C (1986) Atomic force microscope. Phys Rev Lett 56: 930–933. [crossref]
  7. Miller JD, Veeramasuneni S, Drelich J, Yalamanchili MR, Yamauchi G (1996) Effect of roughness as determined by atomic force microscopy on the wetting properties of PTFE thin films. Poly Eng Sci 36: 1849–1855.
  8. Botta AC, Duarte S Jr, Paulin Filho PI, Gheno SM (2008) Effect of dental finishing instruments on the surface roughness of composite resins as elucidated by atomic force microscopy. Microsc Microanal 14: 380–386. [crossref]
  9. Casucci A, Osorio E, Osorio R, Monticelli F, Toledano M, et al. (2009) Influence of different surface treatments on surface zirconia frameworks. J Dent 37: 891–897. [crossref]
  10. de Oyagüe RC, Monticelli F, Toledano M, Osorio E, Ferrari M, et al. (2009) Influence of surface treatments and resin cement selection on bonding to densely-sintered zirconium-oxide ceramic. Dent Mater 25: 172–179. [crossref]
  11. Clelland NL, Agarwala V, Knobloch LA, Seghi RR (2001) Wear of enamel opposing low-fusing and conventional ceramic restorative materials. J Prosthodont 10: 8–15. [crossref]
  12. Casucci A, Mazzitelli C, Monticelli F, Toledano M, Osorio R, et al. (2010) Morphological analysis of three zirconium oxide ceramics: Effect of surface treatments. Dent Mater 26: 751–760. [crossref]
  13. Fuzzi M, Zaccheroni Z, Vallania G (1996) Scanning electron microscopy and profilometer evaluation of glazed and polished dental porcelain. Int J Prosthodont 9: 452–458. [crossref]
  14. Martínez-Gomis J, Bizar J, Anglada JM, Samsó J, Peraire M (2003) Comparative evaluation of four finishing systems on one ceramic surface. Int J Prosthodont 16: 74–77. [crossref]
  15. Goldstein GR, Barnhard BR, Penugonda B (1991) Profilometer, SEM, and visual assessment of porcelain polishing methods. J Prosthet Dent 65: 627–634. [crossref]
  16. Wright MD, Masri R, Driscoll CF, Romberg E, Thompson GA, et al. (2004) Comparison of three systems for the polishing of an ultra-low fusing dental porcelain. J Prosthet Dent 92: 486–490. [crossref]
  17. Sarac D, Sarac YS, Yuzbasioglu E, Bal S (2006) The effects of porcelain polishing systems on the color and the surface texture of feldspathic porcelain. J Prosthet Dent 96: 122–128. [crossref]
  18. Sasahara RM, Ribeiro Fda C, Cesar PF, Yoshimura HN (2006) Influence of the finishing technique on surface roughness of dental porcelains of different microstructures. Oper Dent 31: 577–583. [crossref]
  19. Ling Yin, Song XF, Song YL, Huang T, Li J (2006) An overview of in-vitro abrasive finishing & CAD/CAM of bioceramics in restorative dentistry. Int J Machine Tools Manu 46: 1013–1026.
  20. Karan S, Toroglu MS (2008) Porcelain refinishing with two different polishing systems after orthodontic debonding. Angle Orthod 78: 947–953. [crossref]
  21. Flury S, Lussi A, Zimmerli B (2010) Performance of different polishing techniques for direct CAD/CAM ceramic restorations. Oper Dent 35: 470–481. [crossref]
  22. Anmol C, Soni S (2014) Effect of two different finishing systems on surface roughness of feldspathic and flourapatite porcelains in ceramo-metal restorations: Comparative in vitro study. J Int Soc Prevent Communit Dent 4: 22–28. [crossref]
  23. Han GJ, Kim JH, Lee MA, Chae SY, Lee YH, et al. (2014) Performance of a novel polishing rubber wheel in improving surface roughness of feldspathic porcelain. Dent Mater J 33: 739–748. [crossref]
  24. Manjuran NG, Sreelal T (2014) An in-vitro study to identify a ceramic polishing protocol effecting smoothness superior to glazed surface. J Indian Prosthodont Soc 4: 219–227. [crossref]
  25. 3M ESPE Dental Products Instructions for Use (2004) 3M ESPE AG, Germany.
  26. Zircate Material Safety Data Sheet (2003) Dentsply Int. Inc., USA.
  27. Roulet JF, Roulet-Mehrens TK (1982) The surface roughness of restorative materials and dental tissues after polishing with prophylaxis and polishing pastes. J Periodontol 53: 257–266. [crossref]
  28. Terry DA, Geller W, Tric O, Anderson MJ, Tourville M, et al. (2002) Anatomical form defines color: Function, form and aesthetics. Pract Proced Aesthet Dent 14: 59–67. [crossref]
  29. Sarikaya I, Güler AU (2010) Effects of different polishing techniques on the surface roughness of dental porcelains. J Appl Oral Sci 18: 10–16. [crossref]
  30. Jagger DC, Harrison A (1994) An in vitro investigation into the wear effects of unglazed, glazed, and polished porcelain on human enamel. J Prosthet Dent 72: 320–323. [crossref]
  31. Kakaboura A, Fragouli M, Rahiotis C, Silikas N (2007) Evaluation of surface characteristics of dental composites using profilometry, scanning electron, atomic force microscopy and gloss-meter. J Mater Sci Mater Med 18: 155–163. [crossref]
  32. Camacho GB, Vinha D, Panzeri H, Nonaka T, Gonçalves M (2006) Surface roughness of a dental ceramic after polishing with different vehicles and diamond pastes. Braz Dent J 17: 191–194. [crossref]
  33. Yuzugullu B, Celik C, Erkut S, Ozcelik TB (2009)The effects of extraoral porcelain polishing sequences on surface roughness and color of feldspathic porcelain. Int J Prosthodont 22: 472–475. [crossref]
  34. Mehulić K, Svetlicić V, Segota S, Vojvodić D, Kovacić I, et al. (2010) A study of the surface topography and roughness of glazed and unglazed feldspathic ceramics. Coll Antropol 34: 235–238. [crossref]

Gender Dentistry A Systematic Review of Literature on Caries And Periodontitis

DOI: 10.31038/JDMR.2018123

Abstract

Already in the 1980s, the World Health Organization (WHO) has postulated to analyze in all medical fields differences between the sexes. But until now there is a disturbing lack of scientifically based and meaningful data over the whole area of gender dentistry – for prevention as well as for treatment. The aim of this study was to evaluate the actual situation described as an IS-analysis of literature review on the topic of gender dentistry with the sub-themes periodontal disease and tooth decay in the leading medical databases (Medline, Embase, BIOSIS Previews, Your Journals@Ovid, The Cochrane Library). We discuss these on the basis of an evidence-based guideline. For periodontal diseases we found no clear trend. Some studies showed no gender difference, others showed a higher prevalence for women or a higher prevalence for men. At the juvenile periodontitis and the occurring bacteria of periodontitis there were conflicting results as well. No simple statement can be made with respect to tooth decay, too. Respective studies merely show age as an important item. Totally it has to be noted that the scientific validity of some studies is not without any doubt as they are conducted with a too low number of clinical trials. Several studies are more than 15 years old, therefor providing a serious gender specific treatment in dentistry, future studies must increasingly incorporate and intensively discuss gender specific aspects.

Keywords

Caries, Dentistry, Gender, Men, Periodontitis, Women

Introduction

Already in the 1980s the World Health Organization (WHO) has postulated to analyze differences between sexes in all areas of medicine [1]. In the Vienna Declaration on investment in health of the WHO in 1992 was strongly admonished: “Maximum attention and urgency must be given to women’s health” [2]. Ten years later, in 2002, the WHO gender policy was written. The main objective of this policy is to enable a better health for women and men through modern health research, contributing programs and policies and to give due attention to the gender aspect [3]. And in the action plan 2000, “Gender Mainstreaming was mandatory prescribed in the medicine for all EU countries and decided in consequence” by the Austrian Federal Government as Univ.‐Prof. Dr. Margarethe Hochleitner [4]. The term “Gender Mainstrea-ming” was discussed for the first time in Nairobi already in 1985 on the 3rd UN World Conference of women and ten years later in 1995 the term has been further developed on the 4th UN World Conference of Women [5]. “Gender Mainstreaming” implies according to the BMFSFJ (German Federal Ministry for Family, Senior Citizens, Women and Youth): „… to take into account from the outset and periodically the different life situations and interests of women and men at all social projects, since there is no gender-neutral reality” (Bundesministerium für Familie, Senioren, Frauen und Jugend (Federal Ministry for Family Affairs, Senior Citizens, Women and Youth) 2012). And in the Basic Law was even expressly postulated: “To the actual enforcement of the equality between women and men the Government is expressly obliged by article 3, paragraph 2, sentence 2 Basic Law, it is an integral part of the political action of the Federal Government in all policy areas” [6]. The importance of a differentiated analysis with respect to gender-specific aspects is therefore obvious. Gender-specific considerations are nowadays no longer indispensable from dentistry. However the level of knowledge on this subject is until now surprisingly low. There is a disturbing lack of scientifically founded and reliable data in gender dentistry. “So far only little attention was paid to this topic in the German-speaking world, unlike in other countries. While gender research has found long ago entrance into scientific projects and teaching in medicine, the gender-specific dental, oral and maxillofacial surgery moves only slowly in the awareness of researchers and the practitioners, ladies and gentlemen. This topic is interesting and up to date, because just in dentistry in addition to biological differences, gender plays an important role“, so Priv.-Doz. Dr. Christiane Gleissner, 2011 [7]. To ensure a better dental care for male and female patients in the future, the present study delivers a systematic literature review on the topic of “Gender Dentistry”. The aim of this work is to offer a guideline-oriented, quality-based literature review, based on disease patterns, relevant for “Gender Dentistry”. Additionally all relevant studies have been analyzed, whether they meet the criteria and requirements of the WHO-Guidelines.

Material and Methodology

In the following we describe the preparation, the implementation of the literature review, the selected medicine database and search items as well as the handling of the results. The methodical approach is based on a guideline creation according to recommendation Rec(2001)13 of the Council of Europe (47 European States comprehending European international organizations), the AWMF (Work Community Association of scientific medical companies) [8] and the ZZQ Berlin (Center for dental quality) [9]. The main literature database was chosen to identify the current state of research regarding “gender” dentistry for evidence-based results. The selection was done on five databases: Embase, Your Journals@Ovid, The Cochrane Library, Medline, BIOSIS Previews. Access to these databases was given by the network of the University of Ulm. The search was as follows: for each clinical picture a search item has been set:

  • Periodontitis: gender periodontitis
  • caries susceptibility: gender caries

Then the specified keyword was given into the database and search started. The number of results was recorded. To narrow this large amount of results step by step, the ability of the program was used to divide the results by relevance. High relevance: 5 stars, low till no relevance: 4 till 0 stars. Then the option “five stars only” was made to observe only items with the highest relevance. The amount of search results, which now appeared, was also recorded. Depending on the number of results, the year of publication was still restricted. This and the new amount of search results were also recorded. Then the search results were read and the relevant publications were saved on RefWorks, a reference management software. The corresponding references, which are identified as possible matches, were downloaded as full text or ordered via interlibrary loan to check their contents in detail. The received information was translated, summarized and explained under results. Sequence and classification in reference 1, 2, are ordered alphabetically by the author’s name. So there is no ranking. To ensure the relevance of the results of the literature review, a further update was carried out in September 2013. Here, all five medicine databases were searched again in the period August 2012 – September 2013, as described above. The newly found references were saved and added to the already existing and edited.

Periodontitis

Keyword: gender periodontitis (Table 1)

Table 1:

Table 1. Gender Periodontitis. Results of the literature review in the five databases BIOSIS Previews, The Cochrane Library, Embase, Your Journals@Ovid und Medline from August 2012 and September 2013 and the total amount of stored references

Results, references = articles

Medical database

Basic Search

Restriction to five stars

Stored references August 2012

Stored references September 2013

Total references

BIOSIS Previews

8 491 results

335 results

16 references

1 result

17 references

The Cochrane Library

5 496 results

26 results

1 references

0 results

1 reference

Embase

10 882 results

824 results
(Restriction 2000 – today):

611 results

14 references

6 results

20 references

Your Journals @Ovid

16 955 results

17 results

2 references

0 results

2 references

Medline

10 164 results

673 results
(Restriction 2000 – today): 357 results

7 references

6 results

13 references

Caries

Keyword: gender caries (Table 2)

Table 2. Gender caries. Results of the literature review in the five databases BIOSIS Previews, The Cochrane Library, Embase, Your Journals@Ovid und Medline from August 2012 and September 2013 and the total amount of stored references

Results, references = articles

Medical database

Basic Search

Restriction to five stars

Stored references August 2012

Stored references September 2013

Total references

BIOSIS Previews

9001 results

541 results
(Restriction 2000 – today): 227 results

14 references

4 results

18 references

The Cochrane Library

5513 results

73 results

4 references

0 results

4 references

Embase

16 371 results

1179 results
(Restriction 2000– today):
773 results

6 references

3 results

14 references

Your Journals @Ovid

17 004 results

14 results

0 references

0 results

0 references

Medline

16 716 results

1125 results
(Restriction 2000 –  today);
500 results

4 references

11 results

15 references

Results

Periodontitis (Table 3, 4 & Figure 1)

Table 3. Results of the literature review on the topic of periodontitis. The total identified studies and the ultimately evaluated.

Amount of articles total

53

Amount of evaluated articles

21

Table 4. Results for the articles about periodontal diseases, which appeared before and right/after the year 2000, as well as a subject number higher or equal or lower 500 subjects or any information on the number of the person being tested.

Year of publication before 2000

5

Year of publication after/right 2000

16

Number of subjects higher/equal than 500

4

Number of subjects lower than 500

7

No information about the number of subjects

10

JDMR-18-108 -Jana Schwarz_Germany_F1

Figure 1. Gender Periodontitis. Gender-specific distribution of the edited articles about periodontal disease.

Caries

(Table 5, 6 & Figure 2)

Table 5. Results of the literature review on the topic of caries. The total identified studies and the ultimately evaluated.

Amount of articles total

51

Amount of evaluated articles

29

Table 6. Results for the articles about caries, which appeared before and right/after the year 2000, as well as a subject number higher or equal or lower 500 subjects or any information on the number of the person being tested.

Year of publication before 2000

4

Year of publication after/right 2000

25

Number of subjects higher/equal than 500

14

Number of subjects lower than 500

9

No information about the number of subjects

5

JDMR-18-108 -Jana Schwarz_Germany_F2

Figure 2. Gender Caries. Gender distribution of the edited articles about caries.

Discussion

Methodology

The current state of research in gender dentistry was collected with the help of a literature review, based on the creation of evidence-based guidelines. These guidelines summarize current knowledge, expert opinions and results of various working groups. Known and respected medical database were analyzed within the period of 10th – 20th of August 2012, and with another search from 12th -14th of September 2013.

Discussion related to the analyzed diseases

We have to notice that no clear result could be found and no simple conclusion for practice and teaching can be drawn. There are still too few studies, which offer enough reliability on gender-specific aspects. Some papers offer inconsistent results lacking of possible general evaluations. Further research seems to be indicated.

Periodontitis

The available results of our investigation of the present studies on periodontal disease are not satisfying. There are eleven studies that have proven that men suffer more frequently from periodontitis than women [10–20] However, there are five studies showing no gender aspect at all [21–24].

There are four further studies that show that women would more often suffer from periodontal diseases than men [13, 23, 25–27] The latest studies show a higher incidence for men. Aggressive periodontitis is more common in women and chronic periodontal disease occurs more often in men [13]. The loss of attachment points towards men [12]. One study indicates juvenile periodontitis more often in women [25], but a different study suggests that the distribution of men and women is equal [21]. Furthermore there shown, that there were differences between men and women related to periodontal disease bacteria [16], another study, however, show no difference [26]. The majority of results indicates a higher incidence in men regarding periodontal disease.

When evaluating the aspect of periodontal disease, many other factors, such as age and hormone levels of women do play an important role, because the periodontal disease is known to be a multifactorial disease. All factors should be detected and examined. These aspects should be included in further studies, observed, presented and evaluated in order to get scientific based information, providing additional value for dental treatment. The evaluated studies are lacking to draw conclusions due to limited numbers of subjects and mixed timelines.

Caries

The examination of the studies on caries does not give a uniform result. There are six studies which show no gender-specific differences [28–33]. In contrary studies have proven that women have a greater rate of caries than men [33, 34–43].

The following studies however showed higher rates of tooth decay in men. Only one of these studies was performed in adults [44]. The other five studies have been conducted on children [37, 38, 45–51]. Therefore, there seems to be a tendency for higher caries rates in women. However, depending on the age of the subjects. There are studies demonstrating that boys have higher levels of tooth decay, but the tendency is expanding in adulthood towards women [37, 38].

Studies that examine a multicausal illness such as caries must include all ages and have to be divided into gender, age, eating habits, socioeconomic background, etc. to obtain useful information. Especially in countries with huge emphasis on prophylaxis and caries prevention, e.g. Germany, this study design is essential. On the subject of dental caries the actuality of the studies is satisfactory, the number of clinical trials however mediocre.

The authors declare that they have no competing interests.

References

  1. Kautzky-Willer A, Tschachler E (2012) Gesundheit: Eine Frage des Geschlechts. Orac/Verlag Kremayr & Scheriau KG, Wien.
  2. WHO (1992) (06.12.13) http://www.euro.who.int/__data/assets/pdf_file/0019/ 114238/E93952G.pdf.
  3. WHO (2002) (06.12.13): http://www.who.int/gender/documents/engpolicy.pdf,
  4. Hochleitner Margarethe (2013) (6.12.13) http://fgz.imed.ac.at/kongresse/pdf_kongr/saalfelden2013.pdf.
  5. Meuser Michael, Neusüß Claudia, (2002) Gender Mainstreaming – eine Einführung. In: dies. (Hrsg.): Gender Mainstreaming. Konzepte – Handlungsfelder – Instrumente. Bundeszentrale für politische Bildung S9–22.
  6. BMFSFJ 2012 (06.12.13): http://www.bmfsfj.de/BMFSFJ/gleichstellung,did= 192702.html.
  7. Gleissner Christiane (07.12.13) http://gendermed.info/Gerade-in-der-Zahnmedizin-spielt-der.79.0.2.html.
  8. AWMF (26.10.13) http://www.awmf.org/.
  9. ZZQ (23.08.2013) http://www.zzq-berlin.de/leit.htm.
  10. Bain JL, Lester SR, Henry WD, Bishop CM, Turnage AA, et al. (2009) Comparative gender differences in local and systemic concentrations of pro-inflammatory cytokines in rats with experimental periodontitis. J Periodont Res 44: 133–140.
  11. Desvarieux M, Schwahn C, Volzke H, Demmer RT, Ludemann J, et al. (2004) Gender Differences in the Relationship Between Periodontal Disease, Tooth Loss, and Atherosclerosis. Stroke 35: 2029–2035.
  12. Persson GR, Persson RE, Hollender LG, Kiyak HA (2004) The impact of ethnicity, gender, and marital status on periodontal and systemic health of older subjects in the trials to enhance elders‘ teeth and oral health (teeth). J Periodontol 75: 817–823.
  13. Reichert S, Stein J, Gautsch A, Schaller H, Machulla HKG (2002) Gender differences in HLA phenotype frequencies found in German patients with generalized aggressive periodontitis and chronic periodontitis. Oral Microbiology & Immunology 17: 360–368.
  14. Shiau HJ, Reynolds MA (2010) Sex differences in destructive periodontal disease: a systematic review. J Periodontol 81: 1379–1389. [crossref]
  15. Candore G, Balistreri CR, Colonna-Romano G, Lio D, Listi F, et al. (2010) Gender-related immune-inflammatory factors, age-related diseases, and longevity. Rejuvenation Research 2010: 13.
  16. Renk CM, Wilson J (2005) Comparison of age and gender differences in the prevalence of oral pathogens in subjects with periodontitis.
  17. Wasterlain SN (2012) Sex differences in periodontal disease and caries in a Portuguese identified skeletal sample from the late nineteenth and early twentieth centuries. Am J Phys Anthropol 147: 297–298.
  18. Borell LN, Talih M (2012) Examining periodontal disease disparities among U.S. adults 20 years of age and older: NHANES III (1988–1994) and NHANES 1999–2004. Public Health Rep 127: 497–506.
  19. Buchwald S, Kocher T, Biffar R, Harb A, Holtfreter B, et al. (2013) Tooth loss and periodontitis by socio-economic status and inflammation in a longitudinal population-based study. J Clin Periodontol 40: 203–211.
  20. Rivas-Tumanyan S, Campos M, Zevallos JC, Joshipura KJ (2013) Periodontal disease, hypertension, and blood pressure among older adults in puerto rico. J Periodontol 84: 203–211.
  21. Hart TC, Marazita ML, Lake KS, Diehl SR, Schenkein HA (1991) Sex Ratio among Individuals with Juvenile Periodontitis Jp S: 555.
  22. Sewón LA, Parvinen TH, Sinisalo TV, Larmas MA, Alanen PJ (1988) Dental status of adults with and without periodontitis. J Periodontol 59: 595–598. [crossref]
  23. Melvin WL, Sandifer JB, Gray JL (1991) The prevalence and sex ratio of juvenile periodontitis in a young racially mixed population. J Periodontol 62: 330–334.
  24. Haisman-Welsh RJ, Thomson WM (2012) Changes in periodontitis prevalence over two decades in New Zealand: evidence from the 1988 and 2009 national surveys. N Z Dent J 108: 134–138. [crossref]
  25. Hørmand J, Frandsen A (1979) Juvenile periodontitis. Localization of bone loss in relation to age, sex, and teeth. J Clin Periodontol 6: 407–416. [crossref]
  26. Slots J, Feik D, Rams TE (1990) Age and sex relationships of superinfecting microorganisms in periodontitis patients. Oral Microbiology & Immunology 5: 305–308.
  27. Mattson JS, Cerutis DR, Parrish LC (2002) Osteoporosis: a review and its dental implications. Compendium of continuing education in dentistry (Jamesburg, N.J.: 1995) 23: 1001–1004.
  28. Zerfowski M, Koch MJ, Niekusch U, Staehle HJ (1997) Caries prevalence and treatment needs of 7- to 10-year-old schoolchildren in southwestern Germany. Community Dentistry & Oral Epidemiology 25: 348–351.
  29. Lundegren N1, Axtelius B, Akerman S (2012) Oral health in the adult population of Skåne, Sweden: a clinical study. Acta Odontol Scand 70: 511–519. [crossref]
  30. Wang X, Willing M C, Marazita M L, Wendell S, Warren J J, Broffitt B, et al. Genetic and Environmental Factors Associated with Dental Caries in Children: The Iowa Fluoride Study. Caries Res.2012; 46: 177–184.
  31. Fisher E, Divaris K, Shugars D, White R (2012) Risk factors for third molar occlusal caries: A longitudinal clinical investigation. Journal of Oral and Maxillofacial Surgery.Conference: 94th Annual Meeting Scientific Sessions and Exhibition of the American Association of Oral and Maxillofacial Surgeons, AAOMS 2012 San Diego, CA United States.Conference Start: 20120910 Confer(truncated).,70: e-38.
  32. Dawkins E, Michimi A, Ellis-Griffith G, Peterson T, Carter D, et al. (2013) Dental caries among children visiting a mobile dental clinic in South Central Kentucky: a pooled cross-sectional study. BMC Oral Health 13: 19.
  33. Wang JD, Chen X, Frencken J, Du MQ, Chen Z (2012) Dental caries and first permanent molar pit and fissure morphology in 7- to 8-year-old children in Wuhan, China. International Journal of Oral Science 4: 157–160.
  34. Arantes R, Santos RV, Frazao P, Coimbra CE Jr (2009) Caries, gender and socio-economic change in the Xavante Indians from Central Brazil. Ann Hum Biol 36: 162–175. [crossref]
  35. Haugejorden O (1996) Using the DMF gender difference to assess the „major“ role of fluoride toothpastes in the caries decline in industrialized countries: A meta-analysis. Community Dentistry & Oral Epidemiology 24: 369–375.
  36. Heyduck C, Meller C, Schwahn C, Splieth CH (2006) Effectiveness of sealants in adolescents with high and low caries experience. Caries Res 40: 375–381. [crossref]
  37. Lukacs JR (2011) Gender differences in oral health in South Asia: Metadata imply multifactorial biological and cultural causes. Am J Hum Biol 23: 398–411.
  38. Lukacs JR (2012) Meta-analyses reveal direction and timing of sex and gender differences in oral health. American Journal of Physical Anthropology.Conference: 81st Annual Meeting of the American Association of Physical Anthropologists Portland, OR United States.Conference Start: 20120411 Conference End: 20120414.Conference Publication: (var.pagings). 2012; 147: 197.
  39. Lukacs JR (2010) Sex differences in dental caries experience: clinical evidence and complex etiology. Clinical Oral Investig 15: 649–656.
  40. Mantonanaki M, Koletsi-Kounari H, Mamai-Homata E, Papaioannou W (2013) Prevalence of dental caries in 5-year-old Greek children and the use of dental services: evaluation of socioeconomic, behavioural factors and living conditions. Int Dent J 63: 72–79.
  41. Pechenkina E, Fan W, Ma X (2012) Male-female oral health differences in early Chinese communities. Am J Phys Anthropol 147: 235.
  42. Pereira C, Veiga N, Chaves C, Nelas P, Amaral O, et al. (2013) Dental caries and oral health behaviours in a portuguese sample of adolescents. Am J Epidemiol 177: 37.
  43. Lee HY, Choi YH, Park HW, Lee SG (2012) Changing patterns in the association between regional socio-economic context and dental caries experience according to gender and age: a multilevel study in Korean adults. International Journal of Health Geographics [Electronic Resource] 11: 30.
  44. Unell L, Soderfeldt B, Halling A, Birkhed D (1999) Explanatory models for clinically determined and symptom-reported caries indicators in an adult population. Acta Odontol Scand 57: 132–138.
  45. Witt-Pawlowski K (2002) [Oral care indices (API, SBI) in young participants of a caries prophylaxis program.]. Roczniki Pomorskiej Akademii Medycznej w Szczecinie 48: 381–393.
  46. Wyne AH, Al-Ghannam NA, Al-Shammery AR, Khan NB (2002) Caries prevalence, severity and pattern in pre-school children. Saudi Me.J 23: 580–584.
  47. Ferracane J, Hilton T, Korpak A, Gillette J, McIntyre PS, et al, (2011) Northwest P R E C E D E N T. Use of caries prevention services in the Northwest PRECEDENT dental network. Community Dent Oral Epidemiol 39: 69–78.
  48. Masood M, Yusof N, Hassan MI, Jaafar N (2012) Assessment of dental caries predictors in 6-year-old school children – results from 5-year retrospective cohort study. BMC Public Health 12: 989.
  49. Matulaitiene ZK, Zemaitiene M, Zemgulyte S, Milciuviene S (2012) Changes in dental caries and oral hygiene among 7–8 year-old schoolchildren in different regions of Lithuania 1983–2009. Stomatologija / issued by public institution “Odontologijos studija” …[et al.] 14: 53–59.
  50. Khare V, Koshy A, Rani P, Srilatha S, Kapse SC, et al. (2012) Prevalence of dental caries and treatment needs among the orphan children and adolescents of Udaipur district, Rajasthan, India. Journal of Contemporary Dental Practice [Electronic Resource] 13: 182–187.
  51. Stephenson J (2012) A model for the analysis of caries occurrence in primary molar tooth surfaces. Caries Res 46: 452–459. [crossref]

Prevalence of Nonreactive Non-Stress Test in Low Versus High Risk Pregnancy

DOI: 10.31038/IGOJ.2019211

Abstract

Objective: To determine the prevalence of nonreactive nonstress test (NST) in low risk and high risk pregnant women.

Materials and Methods: This prospective cohort study enrolled pregnant women with gestational age of 32 weeks or more who had been offered NST by their obstetricians at the antenatal clinic, King Chulalongkorn Memorial Hospital. High risk group were defined as having any maternal, fetal or placental risk factors. The NST result was interpreted by at least two obstetricians. All participants were followed until delivery and perinatal outcomes were recorded.

Results: A total number of 1,168 participants with 1,261 NST tests were included. 782 tests (62%) were offered to low risk and 479 tests (38%) to high risk group. Decrease in weight and maternal diabetes mellitus was the most common indication for low risk and high risk group, respectively. Overall prevalence of nonreactive NST was 0.32% (0.38% in low risk and 0.21% in high risk group). Only one newborn with non-reactive NST in high risk group was admitted in the NICU due to meconium aspiration syndrome. However, there was no significant association between nonreactive NST and obstetric risks or adverse perinatal outcomes.

Conclusion: The prevalence of nonreactive NST in this study was only 0.32%. NST is not routinely recommended in low risk pregnant women due to no association between non-reactive NST and perinatal morbidity.

Keywords

Antepartum Fetal Monitoring, Nonstress test, Pregnancy

Introduction

Various non-invasive antepartum fetal surveillance techniques are available including fetal movement assessment, non-stress test (NST), biophysical profile (BPP), contraction stress test (CST), and maternal uterine artery and fetal umbilical artery Doppler velocimetry [1,2]. The aim of antepartum fetal surveillance is to confirm the well-being of the fetus and detect early neonatal injury [3]. NST is currently and widely used in antenatal clinics as a continuous measurement of fetal heart rate (FHR) because it is simple and does not harm pregnant women or their fetuses.

Early detection in the abnormal change of FHR is useful to prevent neonatal injury [4]. NST aims to confirm whether the brain of the fetus is sufficiently oxygenated. [2] Non-reactive NST is significantly associated with fetal distress and low Apgar scores [5]. Testing is recommended for pregnant women who are at risk of fetal hypoxic injury or fetal death. Indications for NST can be divided into three groups as follows: (1) Maternal indications such as diabetes, hypertension, cardiovascular diseases, anemia, kidney disease; (2) Fetal indications such as decrease fetal movement, abnormal fetal growth, post-term pregnancy, abnormal amniotic fluid; and (3) Placental indications such as abnormal placentation, chronic abruption [6].

Due to the uncomplicated nature of the test, obstetricians in general practice often perform NST to pregnant women with minimal obstetric risks such as mothers with poor weight gain, decreased/static weight, or passed date [7]. No clear evidence exists to support the benefit of NST in this group. Even though NST is not an invasive testing method, it is not free of charge and the patient is required to spend at least 20 minutes in the examination room. Moreover, NST results can influence the decisions of the obstetricians. Based on a previous study, non-reactive NST results increased the incidence of labor induction by 90% and doubled the rate of cesarean delivery [8]; therefore, patients may be subjected to unnecessary obstetrics procedures.This study was conducted to determine the prevalence of non-reactive NST for each indication and also identify the necessity for the test in low risk group. We anticipate that this knowledge will be useful in making decisions whether to offer NST to pregnant women.

Materials and Methods

This prospective observational study was conducted at the antenatal clinic, King Chulalongkorn Memorial Hospital. Pregnant women with gestation age of 32 weeks or more who had been offered NST by their obstetricians were invited to participate. We excluded pregnancies with antepartum diagnosed fetal congenital anomalies and those who have had multiple pregnancies. After the participants gave their informed consent, the participants were interviewed. This study was approved by the Institutional Review Board, Faculty of Medicine, Chulalongkorn University (IRB351/55). The high risk group was defined as participants at risk for fetal hypoxia or fetal death according to the antepartum surveillance bulletin of the American College of Obstetricians and Gynaecologists as described previously [6]. While the low risk group was defined as participants who did not show any maternal, fetal or placental risks. Demographic data and indications of NST were recorded in well-designed individual case records.

NST examination requires at least 20 minutes. Participants were placed in a supine position and a fetal heart rate monitor was attached to an abdominal belt. The participants were asked to record any fetal movements by clicking a button. In cases where there was suspicion that the baby was asleep, vibroacoustic stimulation was performed. Results were interpreted by at least two obstetricians. Results are classified as reactive or non-reactive. Reactive NST is diagnosed if there are at least two times of FHR acceleration in 20 minutes, with each acceleration 15 beats per minute (bpm) or more above baseline and lasting for at least 15 seconds. The baseline FHR should be between 110–160 bpm with moderate variability of 6–25 bpm. If the FHR is elevated less than 15 bmp within a 20–40 minute period, the interpretation is non-reactive. [9] Two obstetricians were required to agree with the interpretation of each result. If their analyses differed, a third obstetrician was consulted. If the final results showed a non-reactive then further investigations including biophysical profile, CST or ultrasonography were immediately performed. If the participants were offered NST more than once, the worst pattern was analyzed and included in the research results. All participants were monitored until delivery, with data and perinatal outcome collected and recorded in detail. Participants who did not deliver their babies at the King Chulalongkorn Memorial Hospital or lost their medical data were excluded from the study. Statistical analysis was performed using the Statistical Package for the Social Sciences (SPSS) for Windows, version 22. Descriptive data were analyzed using frequency and percentage, while significant associations between the categorical data were assessed by Fisher’s exact test or Chi-square test. When the p-value was < 0.05, this was considered statistically significant.

Results

A total of 1,536 pregnant women were offered NST. After obtaining informed consent, 1,297 women participated in this study. A total of 129 were not included because their medical records after follow-up was incomplete or unavailable. The remaining participants in final analysis were 1,168 participants. Mean age was 29.7 ± 6.3 years with mean gestational age on the testing day was 36.6 ± 3.0 weeks. Basic clinical characteristics of the participants are shown in (Table 1).

Table 1. Demographic data.

Demographic data

Number of cases
(N= 1,168)

Mean age, years (SD)

29.7 (6.3)

Mean gestational age on the testing day, weeks (SD)

36.6 (3.0)

Primigravida

573 (49.1%)

Mean BMI, kg/m2 (SD)

22.8 (4.8)

Concomitant medical diseases

412 (35.3%)

History of previous surgery

278 (23.8%)

Smoking

12 (1.0%)

Illicit drug use

4 (0.3%)

Alcohol consumption

16 (1.4%)

Ninety-three participants were offered NST twice; therefore, a total of 1,261 tests were analyzed in our study. A total of 782 NSTs were offered to low risk participants and 479 tests were offered to high risk pregnant women. For women in the low risk group, decrease in weight was the most common reason for requesting NST (275 cases). Maternal indications, especially diabetes mellitus were the most common indication for high risk participants (Table 2).

Table 2. Indications for NST.

Indications

Number
(Total number = 1,261)

Low risk group

   Static weight gain

   Decrease in weight

   Poor weight gain

   Passed date (GA 40+1–41+6 weeks)

   Other

782 (62.0%)

193 (15.3%)

275 (21.8%)

84 (6.7%)

98 (7.8%)

132 (10.5%)

High risk group

   Maternal indications

   Fetal indications

   Placental indications

   Maternal and fetal indications

479 (38.0%)

346 (27.4%)

119 (9.4%)

8 (0.6%)

6 (0.5%)

Obstetrics and perinatal outcomes were shown in (Table 3). Mean gestational age at delivery was 38.7 ± 1.3 weeks. The rate of spontaneous vaginal delivery was 53.5% and cesarean delivery rate was 43.5%. Neonatal morbidity occurred in 11.9% of infants with 5.7% of them required admission. Four participants had non-reactive NST with overall prevalence at 0.32%; three out of 782 (0.38%) from the low risk group and one out of 479 (0.21%) from the high risk group had non-reactive NST. Only one new born with non-reactive NST in high risk group was admitted in the Neonatal Intensive Care Unit (NICU) for 5 days due to meconium aspiration syndrome. This newborn had complete recovery and discharged with mother. The other three non-reactive NST in low risk group, intrauterine resuscitation was given, and repeated tests became reactive. These three newborns had no perinatal morbidity (Table 4). Fisher’s exact test showed there was no association between NST result and pregnancy risk (P = 1.00). There were no associations between NST results and adverse perinatal outcomes such as Apgar scores, neonatal morbidity, NICU admission, perinatal ventilator requirement and fetal anomalies (Table 5).

Table 3. Obstetrics and perinatal outcomes.

Delivery data

Number of delivery (N=1,168)

Mean gestational age at delivery, weeks (SD)

38.7 (1.3)

Mean birth weight, grams (SD)

3,142.5 (455.5)

Delivery route

 Spontaneous vaginal delivery

 Cesarean delivery

 Forceps extraction

 Vacuum extraction

625 (53.5%)

507 (43.5%)

30 (2.6%)

6 (0.5%)

Sex of fetus

 Male

 Female

621 (53.2%)

547 (46.8%)

Fetal anomalies

 No

 Yes

1,127 (96.5%)

41 (3.5%)

Neonatal morbidity

 No

 Yes

1,029 (88.1%)

139 (11.9%)

NICU admission

 No

 Yes

1,120 (94.3%)

66 (5.7%)

Ventilator required

 No

 Yes

1,149 (98.4%)

19 (1.6%)

Table 4. Clinical characteristics of non-reactive NST cases.

Gravida

G4P1

G1P0

G2P1

G1P0

GA at testing day (weeks)

39

37

40

39

Indication for NST

Gestation diabetes

(High risk)

Decrease in weight

(Low risk )

Decrease in weight

(Low risk)

 Unspecified

(Low risk)

Delivery route

Emergency cesarean section

Cesarean section due to breech presentation

Vaginal delivery

Cesarean section due to CPD

Neonatal outcomes

Male fetus 3,325 grams

Male fetus 2,935 grams

Male fetus

2,800 grams

Male fetus

3,220 grams

APGAR scores

at 1 and 5 mins

9,9

9,10

9,10

9,10

Perinatal morbidity

Maconium aspiration syndrome

5 days of NICU admission

No

No

No

GA = Gestational age

Table 5. Association between NST results and perinatal outcomes including Apgar score, neonatal morbidity, NICU admission, perinatal ventilator requirement and fetal anomalies.

NST

P value

Perinatal outcomes

Reactive

Non-reactive

Apgar score at 1 min*

<7

25

0

1.00

7–10

1,138

4

Apgar score at 5 min*

<7

3

0

1.00

7–10

1,160

4

Neonatal morbidity

Yes

138

1

0.40

No

1,026

3

NICU admission

Yes

65

1

0.21

No

1,099

3

Perinatal ventilator need

Yes

19

0

1.00

No

1,145

4

Fetal anomalies

Yes

41

0

1.00

No

1,123

4

* one missing data

Discussion

This study showed the rate of non-reactive NSTs was low only 0.32%. Most NSTs (62.5%) were conducted in low risk participants. Prevalence of non-reactive testing was 0.38% and 0.21% in the low and high risk pregnant women, respectively. Overall prevalence of non-reactive NSTs in our study was very low compared to previous studies. Rayburn et al. conducted a prospective study of 315 pregnancies and determined 12% of NSTs had non-reactive patterns [10], while Abitbol et al. reported 10.9% of patients had non-reactive NSTs [11]. The results from these two studies were different compared to our study. These 2 studies were conducted before 1990, most patients had risk factors and different terminologies of abnormal NST result might be plausible explanation. The use of vibroacoustic stimulators in these two previous studies might be another possibility. There is clear evidence that vibroacoustic stimulation can reduce testing time but can contribute to higher rates of false non-reactive results [12].

Data from our study confirmed that offering NST to low risk pregnant women was pointless, waste of time and resources. Although, NST is simple and widespread use, there is poor evidence that it can reduce perinatal morbidity or mortality. One major drawback is high frequency of false positive rates. Pregnant women usually placed on supine position during the test. Compression of abdominal aorta results in reduction of uterine blood flow and associated with fetal heart rate change. [11] Repeated test in lateral decubitus position usually returns into normal results. Our study confirmed that non-reactive NST in low risk participants did not associated with perinatal morbidity. However, it may not conclude in high risk participants due to very low percentage of non-reactive results. Only 1 patients with maternal risk factors (gestational diabetes) showed non-reactive NST and meconium aspiration syndrome was diagnosed in this newborn. Despite low specificity to predict perinatal morbidity, antepartum NST is still recommended to use only in pregnant women with risk factors for adverse perinatal outcome [13].

To the best of our knowledge, this is the first and large study that looked at the results of NST in low risk pregnant women. The results indicated that NST is unnecessary for low risk pregnant women. However, there were some limitations in our study. Firstly, the prevalence of non-reactive NST was very low in both low and high risk pregnant women. As this result, it may not have enough power to significantly confirm our findings. Secondly, about 10% of the pregnant women who were lost to follow-up were excluded from the final analysis.

Conclusions

Overall, non-reactive NST was 0.32% (0.38% in low risk and 0.21% in high risk groups). NST is unnecessary for low risk pregnant women. There was no association between NST results and adverse perinatal outcomes including Apgar score, neonatal morbidity, NICU admission, perinatal ventilator requirements and fetal anomalies.

Declaration of interests: The authors declared no conflicts of interest.

Acknowledgement: This study was supported by Ratchadapiseksompoch Fund (RA55/69), Faculty of Medicine, Chulalongkorn University, Bangkok, Thailand.

References

  1. Williams KP, Farquharson DF, Bebbington M, Dansereau J, Galerneau F, et al (2003) Screening for fetal well-being in a high-risk pregnant population comparing the nonstress test with umbilical artery Doppler velocimetry: a randomized controlled clinical trial. Am J Obstet Gynecol 188: 1366–1371.
  2. Liston R, Sawchuck D, Young D (2018) No. 197a-Fetal Health Surveillance: Antepartum Consensus Guideline. J Obstet Gynaecol Can 40: 251–271.
  3. Esin S (2014) Factors that increase reactivity during fetal nonstress testing. Curr Opin Obstet Gynecol 26: 61–66.
  4. Gobillot S, Fontecave-Jallon J, Equy V, Rivet B, Gumery PY, et al. (2018) Non-invasive fetal monitoring using electrocardiography and phonocardiography: A preliminary study. J Gynecol Obstet Hum Reprod 47: 455–459. [crossref]
  5. Flynn AM, Kelly J (1977) Evaluation of fetal wellbeing by antepartum fetal heart monitoring. Br Med J 1: 936–939. [crossref]
  6. [No authors listed] (2000) ACOG practice bulletin. Antepartum fetal surveillance. Number 9, October 1999 (replaces Technical Bulletin Number 188, January 1994). Clinical management guidelines for obstetrician-gynecologists. Int J Gynaecol Obstet 68: 175–185. [crossref]
  7. Mancuso A, De Vivo A, Fanara G, Denaro A, Lagana D, et al. (2008) Effects of antepartum electronic fetal monitoring on maternal emotional state. Acta Obstet Gynecol Scand 87: 184–189.
  8. Evertson LR, Gauthier RJ, Schifrin BS, Paul RH (1979) Antepartum fetal heart rate testing. I. Evolution of the nonstress test. Am J Obstet Gynecol 133: 29–33. [crossref]
  9. Preboth M (2000) ACOG guidelines on antepartum fetal surveillance. American College of Obstetricians and Gynecologists. Am Fam Physician 62: 1184, 1187–1188. [crossref]
  10. Rayburn WF, Motley ME, Zuspan FP (1982) Conditions affecting nonstress test results. Obstet Gynecol 59: 490–493. [crossref]
  11. Abitbol MM, Monheit AG, Poje J, Baker MA (1986) Nonstress test and maternal position. Obstet Gynecol 68: 310–316. [crossref]
  12. Smith CV, Phelan JP, Platt LD, Broussard P, Paul RH (1986) Fetal acoustic stimulation testing. II. A randomized clinical comparison with the nonstress test. Am J Obstet Gynecol 155: 131–134.
  13. Freeman RK, Anderson G, Dorchester W (1982) A prospective multi-institutional study of antepartum fetal heart rate monitoring. II. Contraction stress test versus nonstress test for primary surveillance. Am J Obstet Gynecol 143: 778–781.

Admission Potassium / Sodium Ratio Linearly Predicts Mortality Outcome Following an Emergency Medical Admission

DOI: 10.31038/IMROJ.2019411

Abstract

Background: Disturbance of sodium and potassium chemistry is commonly present during an emergency medical admission; we analyse the interaction of these ions and relate K+/ Na+ Ratios to hospital mortality outcomes.

Methods: All emergency medical admissions between 2002 and 2017 were studied. We log transformed sodium and potassium values and calculated their respective ratios as a predictor of 30-day mortality outcomes using a multivariable logistic model.

Results: There were 106,586 admissions in 54,928 patients. Patients with higher K+/ Na+ ratios at admission were older at 66.5 years (IQR 47.0–79.3) compared with 59.0 years (IQR 39.9–75.5) and more likely to be female (51.9% vs. 45.5%). They had a higher 30-day hospital mortality rate – 5.4% vs 3.5% (p<0.001). Across consecutive deciles of K+, rising admission levels linearly predicted outcomes unlike Na+ where falling levels linearly predicted an increased mortality. Disturbed K+/ Na+ balance (log ratio) was prognostic – 30-day mortality OR 1.12 (95%CI 1.11–1.13). Increasing age predicted an increased likelihood of an abnormal K+/ Na+ balance.

Conclusion: Disturbed K+/ Na+ is linearly predictive of 30-day hospital mortality and is strongly age associated; possibly it is a consequence of Na+ leaving the extracellular space (ECF) and K+ transit to the ECF due to impaired cellular membrane homeostatic function.

Keywords

Emergency Medical Admission, Potassium Sodium Balance

Introduction

An emergency hospital admission with an urgent clinical condition requiring immediate or specialist management 1] is a high risk period but has shown improved outcomes over time 2,3] particularly since the establishment of Acute Medical Admission Units [4,5]. Risk management of critical admissions requires reliable predictors and there has been debate regarding disturbance of sodium [6–10] and potassium homeostasis [11,12] in this regard.

In terms of sodium levels, abnormalities in the laboratory range are said to occur in about 15% of hospitalized patients [7]; a U-shaped curve is described with major morbidity and mortality at the extremes of the sodium distribution in many patient groups including general internal medicine patients (13–15). Hyponatraemia in particular is prognostic for specific groups of patients with cardiovascular disease, such as congestive heart failure [16,17] but also for patients with pulmonary hypertension [18]. In terms of potassium levels, a U-shaped curve for mortality is also described with lowest all-cause mortality for potassium values between 4.0 and <5.0 mEq/L. [19]; in a geographically diverse population (n = 911,698) 27.6% had a potassium <4.0 mEq/L, and 5.7% had a value ≥ 5.0 mEq/L. A further commentary on two large studies, of the relationship between cardiovascular outcomes and potassium levels, noted that there were not a significant association between hypokalaemia and mortality in the fully adjusted Cox model, but there was a trend toward higher mortality at lower serum potassium [20].

The problem with such analyses is that the conclusions drawn will not be identical if based on a unit versus a frequency based analysis. The unit based analysis (by K+ / Na+ interval) is unintentionally biased as some intervals may contain small numbers who are actually outliers in the distributions; the results in generalisation from the specific to the general population. However, a decile based analysis for sodium, indicated that, for emergency medical admissions, the highest quantile (decile) had the lowest mortality risk and that mortality progressively increased over every other decile [21]. As a generality, the same applies to potassium except that rising deciles determine worse outcomes. The exception, dictating bad outcomes for a few, should not confuse an overall understanding of the mortality relationship to the admission levels of sodium and potassium. We have previously shown that mortality is far more influenced by other factors such as the Acuity Illness Severity Score (AISS) [22,23], sepsis status [24] and the overall burden of disease as reflected by summative comorbidities – Charlson Comorbidity Index [25] or Chronic Disabling Disease Score [26]. In this paper we consider the relevance of the balance between potassium and sodium, at time of an emergency medical admission, in determining 30-day mortality in over 100,000 emergency medical admissions and draw inferences from these findings.

Methods

Background

St James’s Hospital, Dublin serves as a secondary care centre for emergency admissions in a catchment area with a population of 270,000 adults. All emergency medical admissions were admitted from the Emergency Department to an AMAU, the operation and outcome of which have been described elsewhere [2,3,27,28]. As a city centre hospital St James’s admits persons resident elsewhere but working in the capital in addition to visitors to Dublin who became acutely ill. The number of emergency medical admissions resident in the catchment area was 74.5%; this compares with a figure of 59% for ED presentations where the social influences on emergency department visitations on two London hospitals have been examined [29].

Data Collection

During any emergency hospital admission information on the clinical episode is entered into the Patient Administration System (PAS), admission metrics are determined and entered into the emergency room database and following admission data is recorded on the patient electronic record, different laboratory systems; abstracted data is subsequently processed by dedicated staff for downloading to the National Hospital In-Patient Enquiry (HIPE) scheme. HIPE is a national database of coded discharge summaries from acute public hospitals in Ireland [30,31]. International Classification of Diseases, Ninth Revision, Clinical Modification (ICD-9-CM) has been used for both diagnosis and procedure coding from 1990 to 2005 with ICD-10-CM used since then. Data included parameters such as the unique hospital number, admitting consultant, date of birth, gender, area of residence, principal and up to nine additional secondary diagnoses, principal and up to nine additional secondary procedures, and admission and discharge dates. We in 2002 designed programs to extract the HIPE data and admission biochemistry and haematological variables (linked via the Medical Record Number) to monitor the performance of the Acute Medical Admission Unit. These data were then anonymized using an ID sequence and the MRN to link the data that is held on our system in multiple separate files. These files are assembled into memory at time of statistical analysis (using Stata coding). The data does not exist as a discrete database; it is updated annually and is a closed system accessible only by the Principal Investigators. GDPR does not apply to anonymous datasets.

Acute Illness Severity Score

Derangement of biochemical parameters may be utilised to predict clinical outcome. We derived an AISS based on laboratory data – this is an age adjusted 30-day in-hospital mortality risk estimator, representing an aggregrate laboratory score based on the admission serum sodium, serum potassium, serum urea, red cell distribution width, white blood cell count, serum albumin and troponin values at admission (23, 32); the score predicts 30-day in-hospital mortality from the biochemical parameters recorded in the Emergency Department (33). The AISS can be enhanced with data from the ICD9/10 discharge codes to compute Co-Morbidity (as per the Charlson Index (25)) or Disability (26) status. This Risk Score is exponentially related to the 30-day mortality outcome with a range of mortality outcomes from 0.5% (0.40%–0.53%) to 39% (37.8%-40.2%). We have demonstrated using a nomogram that this laboratory model derives most of its predictive power from the admission values of albumin, urea and haemoglobin (34).

Comorbidity Instrument

Hospital HIPE codes [30,31] were interrogated to construct a measure of multi-morbidity. To devise the score, we searched ICD9 hospital episode discharge codes (back-mapping ICD10 codes to ICD9 as appropriate) based on the definition proposed by the US Department of Health and Human Services for chronic physical or mental health disorders, that limit people ‘in activities that they generally would be expected to be able to perform’. These ICD codes were similar to those proposed by the Canadian group for multi-morbidity (35) and the work of Quan [36,37]; they were grouped by system into the following ten groups: (i) cardiovascular, (ii) respiratory, (iii) neurological, (iv) gastrointestinal, (v) diabetes, (vi) renal, (vii) neoplastic disease, (viii) others (including rheumatological disabilities), (ix) ventilatory assistance required and (x) transfusion requirement. We have previously detailed the ICD9 codes for chronic physical or mental health disorders utilized as a supplementary Table [38]. In addition, we searched other hospital databases for evidence of diabetes (Diamond database), respiratory insufficiency (FEV1 < 2 L data pulmonary function laboratory), troponin status (high sensitivity troponin > 25 ng/L) [33], low albumin (<35 G/dL) and anaemia (haemoglobulin levels < 10 G/dL) or chronic renal insufficiency – MDRD < 60 mL/min*1.73 m2 [39]. The ‘morbidity score’ for each individual’s clinical episode during the study, was weighted by its relative important against the 30-day mortality outcome in the multivariable regression analysis.

Statistical Methods

Descriptive statistics were calculated for background demographic data, including means/standard deviations (SD), medians/interquartile ranges (IQR), or percentages. Comparisons between categorical variables and mortality were made using chi-square tests.

We employed a logistic model with robust estimate to allow for repeated admissions; the correlation matrix thereby reflected the average dependence among the specified correlated observations [23]. Logistic regression analysis identified potential mortality predictors and then tested those that proved to be significant univariate predictors (p<0.01 by Wald test). Mortality results have been presented either by admission (all admissions counted) or by patient (only one admission considered – last admission if > one). In an extended time series (16 yr.), 48.7% of patients were readmitted at least once, 9.3% > 5 times and 20 patients > 50 times each; whether per admission or per patient mortality analysis is optimal is uncertain. We used the margins command in Stata to estimate and interpret adjusted predictions for sub-groups, while controlling for other variables such as time, using computations of average marginal effects. Margins are statistics calculated from predictions of a previously fitted model at fixed values of some covariates and averaging or otherwise over the remaining covariates. In the multivariable model (logistic), we adjusted univariate estimates of effect, using the previously described outcome predictor variables. The model parameters were stored; post-estimation intra-model and cross-model hypotheses could thereby be tested.

Adjusted odds ratios (OR) and 95% Confidence Intervals (CI) were calculated for those predictors that significantly entered the model (p<0.10). Statistical significance at P<0.05 was assumed throughout. Stata v.15 (Stata Corporation, College Station, Texas) statistical software was used for analysis. This study had no interventional component, used anonymised routinely collected data, complied with data protection legislation and was undertaken as part of the Hospital Quality Improvement Programme to assess the overall impact of the Acute Medical Admission Initiative.

Results

Patient Demographics

During the 16-year study period (2002–2017), there were a total of 106,586 admissions in 54,928 unique patients. This represented all emergency medical admissions, including patients admitted directly into the Intensive Care Unit or High Dependency Unit. The proportion of males was 48.5%. The median (IQR) Length Of Stay (LOS) was 4.3 days (1.7–8.9). The median (IQR) age was 58.9 years (38.2–76.3) with the upper 10% boundary at 85.0 years.

The demographic characteristics (Table 1) are outlined with a cut at the midpoint of the calculated admission K+ / Na+ ratio. The K+ and Na+ data was log (natural) transformed prior to the analysis mainly to equalize the data spread of the two elements despite their numerical difference – anticipated to make the data easier to handle and interpret. Above and below that midpoint, the patient group characteristics are tabulated by Acute Illness Severity [23,32], Charlson Index [25], Co-Morbidity and Sepsis status [24]. Patient in the upper half of the K+ / Na+ ratio distribution were older 66.5 years (IQR 47.0–79.3) compared with 59.0 years (IQR 39.9–75.5) but had equivalent hospital LOS – 4.9 days (IQR 1.9–9.7) versus 5.1 days (IQR 2.3–9.7). Admissions with a K+ / Na+ ratio distribution above the median were more likely to be female (51.9% vs. 45.5%) and had a higher 30-day hospital mortality rate – 5.4% vs 3.5% (p<0.001). Those with a K+ / Na+ ratio distribution above the median had a higher Acute Illness Severity Score (top two groups 66.1% vs. 53.4%) and higher Charlson Comorbidity Index (top two groups 39.6% vs. 33.0%).

Mortality related to admission K+ / Na+ levels

The 30-day per patient mortality declined between 2002 and 2017 from 12.4% to 4.8%. This represented a relative risk reduction (RRR) of 61.3% with a number needed to treat (NNT) of 13.1. Lower admission sodium levels were associated with a linear increase in patient mortality rate across all deciles (OR 0.89 (95% CI 0.88–0.90); from decile 1 (lowest sodium) – 16.9% (95% CI 16.0%-17.8%) to decile 5 – 11.4% (95% CI 11.0%-11.8%) and decile 10 – 6.7% (95% CI 6.2%-7.2%). Higher admission potassium level predicted mortality – OR 1.07 (95%CI: 1.06, 1.09) and there was a progressive increase in 30-day in-hospital mortality across all deciles from decile 1 (lowest) – 8.9% (95%CI: 8.3%, 9.4%) to decile 5 – 11.0% (95%CI: 10.6%, 11.3%) and decile 10 – 14.2% (95%CI: 13.5%, 14.8%). This is a different interpretation to the conventional wisdom of a U shaped curve for both K+ and Na+ and mortality outcomes. However, an analysis by decile lacks numerical bias where very difference frequencies fall within discrete ranges. For Na+ for example, and taking decile 10 with the lowest overall mortality risk, the lower boundary is 142 mEq/l, with the median, 75% and 95% points at 144, 145 and 150 mEq/l. For K+ for example, and taking decile 1 with the lowest overall mortality risk, the upper boundary is 3.4 mEq/l, with the median, 75% and 95% points at 3.2, 3.0 and 2.6 mEq/l. Therefore the correct distribution mortality relationship is that 30-day mortality outcome, as determined by K+ and Na+ admission values, is that mortality increases with each decile of K+ decile, from lowest to highest with the opposite being true for admission Na+ levels.

Table 1. Characteristics of Emergency Admissions by Median K+ / Na+ Ratio.

Lower
(N= 45,135)

Upper
(N= 50, 726)

p-Value

Age (yr.)

 Mean (SD)

57.4 (20.78)

62.5 (20.29)

<0.001

 Median (Q1, Q3)

59.0 (39.9, 75.5)

66.5 (47.0, 79.3)

Length Stay (day)

 Mean (SD)

7.2 (6.45)

7.0 (6.51)

<0.001

 Median (Q1, Q3)

5.1 (2.3, 9.7)

4.9 (1.9, 9.7)

Gender

 Male

20530 (45.5%)

26321 (51.9%)

<0.001

 Female

24605 (54.5%)

24405 (48.1%)

30-day Hospital Mortality

 Alive

43542 (96.5%)

48000 (94.6%)

<0.001

 Dead

1593 (3.5%)

2726 (5.4%)

Acute Illness Severity

 1

1835 (4.3%)

1094 (2.5%)

<0.001

 2

3916 (9.2%)

2595 (5.8%)

 3

6234 (14.7%)

4630 (10.4%)

 4

7768 (18.3%)

6773 (15.2%)

 5

8638 (20.3%)

8329 (18.7%)

 6

14072 (33.1%)

21064 (47.4%)

Co-Morbidity Score

 < 6

11387 (38.3%)

11247 (32.4%)

<0.001

 >=6 < 8

8547 (28.7%)

9744 (28.0%)

 >=8 < 12

8181 (27.5%)

11098 (31.9%)

 >=12 < 20

1643 (5.5%)

2674 (7.7%)

Charlson Index

8638 (20.3%)

8330 (18.7%)

 0

22226 (49.3%)

21771 (43.0%)

<0.001

 1

12063 (26.8%)

13830 (27.3%)

 2

10768 (23.9%)

15042 (29.7%)

Sepsis Group

 1

33695 (74.7%)

39653 (78.2%)

<0.001

 2

9828 (21.8%)

9426 (18.6%)

 3

1612 (3.6%)

1647 (3.2%)

*LOS: length of stay, MDC: Major Disease Category, IQR: Inter-Quartile Range

Mortality related to admission K+ / Na+ Ratio (Figs 1 / 2)

The admission K+ / Na+ Ratio was predictive of episode 30-day hospital mortality – OR 1.12 (95% CI 1.11–1.13). This compared with the predictive capacity of the Acute Illness Severity Score of OR 3.28 (95% CI 3.03–3.56) , the Charlson Comorbidity Index of OR 1.20 (95% CI 1.18–1.23) and sepsis status OR 1.61 (95% CI 1.51–1.71). The admission K+ / Na+ Ratio was a linear predictor (Fig 1) of 30-day hospital mortality over the range of deciles from the lowest D1 with predicted mortality of 5.6% (95% CI: 5.2%, 5.9%), to D5 6.2% (95% CI: 6.0%, 6.4%) and D10 7.2% (95% CI: 6.9%, 7.5%), After adjustment for the above predictors, the predictive value of K+ / Na+ Ratio was reduced to 1.03 (95% CI 1.02–1.04).

IMROJ_2019-101-Bernard Silke_F1

Figure 1. The relationship between the admission K+ / Na+ ratio and 30-day in-hospital mortality. For each decile of the ratio, the 30-day in-hospital mortality rate was derived from the logistic regression model and adjusted for the Charlson Co-Morbidity, Co-Morbidity and Sepsis Scores.

IMROJ_2019-101-Bernard Silke_F2

Figure 2. The relationship between the admission K+ / Na+ ratio and patient age. The Decile of the Ratio, at time of admission, was regressed against the age group (Zero Poisson truncated) and adjusted for the Acute Illness Severity and Co-Morbidity and Sepsis Status. The Decile of K+ / Na+ ratio at time of admission was a linear function of age.

We also examined the likelihood that the admitted K+ / Na+ Ratio was age related – over the admitted age range by relating the likelihood that older admissions would fall into higher K+ / Na+ Decile Ratios. We regressed the age groups < 40, 40 + – 60, 60+ – 75, 75+ – 85 and >85 against counts of K+ / Na+ Ratio (zero truncated Poisson regression) by patient and adjusted for the Acute Illness Severity (22, 23), Charlson Comorbidty Index (25) and Sepsis Status (24). There was a linear relationship between the underlying age and the likelihood of being in a higher K+ / Na+ Decile Ratio.

Discussion

Our data shows that over a period of 16 years potassium and sodium levels at the time of an emergency medical admission were predictive of 30-day mortality outcomes. Although the mortality outcomes have improved over time, the predictive value consistent irrespective of such quality improvements. Falling deciles of sodium were associated with increasing mortality outcomes; the 30-day patient mortality comparing the highest and lowest decile was 6.7% vs 16.9%. For potassium the opposite was true; rising deciles were associated with increasing mortality from lowest decile rate of 8.9% to highest rate of 14.2%. Therefore in overall terms neither hypokalaemia nor hypernatraemia were prognostic risk factors of a 30-day hospital death. That is not to argue that specific patients with very disturbed admission hypokalaemia or hypernatraemia were not at risk. However, for high sodium levels (top decile > 142 mEq/l) only 25% of that decile were > 145 mEq/l. and 5% > 150 mEq/l. For the lowest potassium decile (<3.4 mEq/l), only 25% of that decile were < 3.0 mEq/l. and only 5% < 2.6 mEq/l. Thus taking what might occur in a small minority of any population distribution, and seeking to make statements regarding the overall population risk is an approach that may result in a misconceived view of the risk reality in the mind of the clinician.

If increasing potassium or decreasing admission levels are linearly prognostic, as our model relating deciles of each to 30-day mortality outcome, then a reasonable presumption might be that the disturbance in both would be linked. Sodium being the principal extracellular ion and potassium being intracellular might leak from their respective domains as the system aged; disorder of the pair might be thought of as reflecting impaired membrane function and the energetic process involved in maintaining the transmembrane electro-chemical gradient. The likelihood of being in a higher risk decile certain was strongly age dependent in our analysis. We wondered if the relationship of the two ions, as reflected in the K+ / Na+ Ratio, might be a better prognostic indicator that their individual ability to predict mortality outcome. The univariate prediction of the K+ / Na+ Ratio was considerably attenuated when other independent outcome predictors such as Acute Illness Severity Score, Charlson Comorbidity Index and sepsis status were accounted for in the multivariable model. This would suggest that in overall terms, disorders of these ions, whilst of clinical relevance in certain specific patient subsets, in general are part of more complex disorder of homeostasis, driven by illness severity and the overall burden of disease [40,41]. As linking the analysis to the combined behaviour, with the K+ / Na+ Ratio, did not improve the prognostic prediction over that from independent analysis of each, one cannot assume that the behaviour of the K+ and Na+ is linked in emergency medical admissions on average.

Of course, the practicing physician is rightly focused on clinical outcomes at the extremes of distribution due to the high mortality rates [42] and the need for urgent interventions to correct the disorder and mitigate the consequences [43]. Generally speaking disturbed biochemistry has been recognised to predict hospital mortality outcomes and been incorporated into laboratory score systems [44–46]. We must however distinguish a population based interpretation of the risk relating a predictor variable that is disturbed to mortality outcomes in general from that at the extremes of population or in certain specific high-risk subgroups, and as to whether patients die with or as a consequence of hyponatraemia [47] or if most deaths are caused by underlying diseases [42]. The widely quoted work of Gheorghiade et al. demonstrated a marked correlation between serum sodium < 135 mEq/l and both hospital LOS and mortality and an apparent “U shaped’ curve with increased mortality if serum sodium was greater than 140 mEq/l [16]. However, a recent large meta-analysis on dysnatraemia concluded that hyponatremia (HR 1.34; 95% CI: 1.15–1.57) but not hypernatremia (HR 1.12; 95%: CI 0.93–1.34), was independently associated with increased risk of all-cause mortality, when compared than the normonatremia category [48].

In respect of potassium levels and mortality outcomes, in 6515 patients prior to randomization in the MERLIN-TIMI trial, the lowest risk of cardiovascular death was observed in patients with admission potassium levels between 3.5 and 4.5 mEq/L. Both lower and higher levels of potassium were associated with tachyarrhythmias and bradyarrhythmias, suggesting a potential mechanistic explanation for the increased risk of cardiovascular death at the extremes of potassium homeostasis [49]. Krogager et al. [50] reported, in a cohort of nearly 2600 patients post myocardial infarction, a U-shaped relationship between serum potassium concentration on hospitalization and 90-day mortality; these observations of increased mortality also applied to low and high normal serum potassium levels. Hughes-Austin et al. [51]  found that high serum potassium concentration is significantly associated with a higher risk for all-cause mortality independent of kidney function or other cardiovascular disease risk factors; no significant association between hypokalaemia and mortality was found in the fully adjusted Cox model. We found that from lower to higher deciles of potassium a progressively rising risk of an adverse mortality outcome. Similarly, Loprinzi and Hall [12] investigated the potassium-mortality relationship in the general population of the United States, using data from the 1999–2006 National Health and Nutrition Examination Survey were employed, with follow-up through 2011. In a Cox proportional hazards model, after adjusting for confounding variables found that a 1-mmol/L increase in potassium was associated with a 40% increased risk of mortality (adjusted hazard ratio 1.40; 95% CI, 1.15–1.70).

Broadly speaking then we would conclude, that in an unselected population admitted with medical emergencies over 16 years that although disturbances of potassium or sodium were predictive of 30-day mortality outcomes in general, the lowest decile of admission potassium or the highest decile of sodium conferred the lowest risk, when adjusted for other major independent outcome predictors. Over all deciles of admitted potassium, rising levels were positive associated with increased mortality; the contrary applied to sodium where the greatest risk was for the lowest admitted levels, and all higher deciles demonstrated a falling mortality trend. Furthermore, although both rising potassium levels and falling sodium levels were independently predictive, in the full model with adjustment as described, the influence of each of the combined ratio was attenuated This implies that disorders of potassium and sodium and their ratio is a secondary phenomenon, reflecting system disorder and a ‘sick cell’ or unbalanced homeostasis due to major illness associated with comorbidity.

Our study utilises comprehensive data gathered over a prolonged period of time, however this information is in essence extracted from the medical record through coding and other standard procedures; therefore the robustness of our data is entirely dependent on the accuracy of the original recordings. The external validity of our results will need to be established by complementary studies in other institutions and settings. We do not collect information on the specific treatment of individual patients, therefore we were not able to analyse any potential effects of interventions in those with abnormalities of potassium or sodium. Finally, the design of our study by its nature assesses for associations rather than causation, while we adjust for multiple variables in our analyses we cannot comment on any potential causative role for electrolyte imbalance on mortality.

In conclusion this study demonstrates that the ratio of admission serum potassium to sodium is both strongly associated with age and linearly predictive of 30-day hospital mortality. The interpretation of sodium and potassium homeostasis as an interdependent ratio did not add significant material value to analysing the cations independently.

References

  1. Langlands A, Dowdle R, Elliott A, Gaddie J, Graham A, Johnson G, et al. (2009) RCPE UK Consensus Statement on Acute Medicine, November 2008. British journal of hospital medicine 70: 6–7.
  2. Rooney T, Moloney ED, Bennett K, O’Riordan D, Silke B (2008) Impact of an acute medical admission unit on hospital mortality: a 5-year prospective study. Qjm 101: 457–65.
  3. Conway R, O’Riordan D, Silke B (2014) Long-term outcome of an AMAU–a decade’s experience. QJM 107: 43–49. [crossref]
  4. Byrne D, Silke B (2011) Acute medical units: review of evidence. Eur J Intern Med 22: 344–347. [crossref]
  5. Scott I, Vaughan L, Bell D (2009) Effectiveness of acute medical units in hospitals: a systematic review. Int J Qual Health Care 21: 397–407. [crossref]
  6. Whelan B, Bennett K, O’Riordan D, Silke B (2009) Serum sodium as a risk factor for in-hospital mortality in acute unselected general medical patients. QJM 102: 175–82.
  7. Asadollahi K, Beeching N, Gill G (2006) Hyponatraemia as a risk factor for hospital mortality. QJM 99: 877–880. [crossref]
  8. Stachon A, Segbers E, Hering S, Kempf R, Holland-Letz T, et al. (2008) A laboratory-based risk score for medical intensive care patients. Clin Chem Lab Med 46: 855–862. [crossref]
  9. Waikar SS, Mount DB, Curhan GC (2009) Mortality after hospitalization with mild, moderate, and severe hyponatremia. Am J Med 122: 857–865. [crossref]
  10. Conway R, Byrne D, O’Riordan D, Silke B (2014) Hyponatraemia in Emergency Medical Admissions-Outcomes and Costs. Journal of clinical medicine 3: 1220–1233.
  11. Conway R, Creagh D, Byrne DG, O’Riordan D, Silke B (2015) Serum potassium levels as an outcome determinant in acute medical admissions. Clinical medicine (London, England) 15: 239–243.
  12. Loprinzi PD, Hall ME (2017) Effect of Serum Potassium on All-Cause Mortality in the General US Population. Mayo Clin Proc 92: 320. [crossref]
  13. Nardi R, Fiorino S, Borioni D, Agostini D, D’Anastasio C, et al. (2007) Comprehensive complexity assessment as a key tool for the prediction of in-hospital mortality in heart failure of aged patients admitted to internal medicine wards. Arch Gerontol Geriatr 44 Suppl 1: 279–288.
  14. Wartenberg KE, Schmidt JM, Claassen J, Temes RE, Frontera JA, et al. (2006) Impact of medical complications on outcome after subarachnoid hemorrhage. Crit Care Med 34: 617–623.
  15. Kraft MD, Btaiche IF, Sacks GS, Kudsk KA (2005) Treatment of electrolyte disorders in adult patients in the intensive care unit. Am J Health Syst Pharm 62: 1663–1682. [crossref]
  16. Gheorghiade M, Abraham WT, Albert NM, Gattis Stough W, Greenberg BH, et al. (2007) Relationship between admission serum sodium concentration and clinical outcomes in patients hospitalized for heart failure: an analysis from the OPTIMIZE-HF registry. Eur Heart J 28: 980–988.
  17. Mohammed AA, Kimmenade RRJv, Richards M, Bayes-Genis A, Pinto Y, et al. (2010) Hyponatremia, natriuretic peptides, and outcomes in acutely decompensated heart failure: results from the International Collaborative of NT-proBNP Study. Circ Heart Fail 3: 354–3561.
  18. Forfia PR, Mathai SC, Fisher MR, Housten-Harris T, Hemnes AR, et al. (2008) Hyponatremia Predicts Right Heart Failure and Poor Survival in Pulmonary Arterial Hypertension. Am J Respir Crit Care Med 177: 1364–1369.
  19. Collins AJ, Pitt B Fau-Reaven N, Reaven N Fau-Funk S, Funk S Fau-McGaughey K, McGaughey K Fau – Wilson D, et al. (2017) Association of Serum Potassium with All-Cause Mortality in Patients with and without Heart Failure, Chronic Kidney Disease, and/or Diabetes. Am J Nephrol 46: 213–221
  20. Toto RD (2017) Serum Potassium and Cardiovascular Outcomes: The Highs and the Lows. CJASN 12: 220–221.
  21. McCarthy K, Conway R, Byrne D, Cournane S, Deirdre OR, et al. (2018) Hyponatraemia during an emergency medical admission as a marker of illness severity & case complexity. Eur J Intern Med (in press).
  22. Royston P, Reitz M, Atzpodien J (2006) An approach to estimating prognosis using fractional polynomials in metastatic renal carcinoma. Br J Cancer 94: 1785–1788.
  23. Silke B, Kellett J, Rooney T, Bennett K, O’Riordan D (2010) An improved medical admissions risk system using multivariable fractional polynomial logistic regression modelling. Quarterly Journal of Medicine 103: 23–32.
  24. Chotirmall SH, Callaly E, Lyons J, O’Connell B, Kelleher M, et al. (2014) Blood cultures in emergency medical admissions: a key patient cohort. Eur J Emerg Med
  25. Charlson ME, Pompei P, Ales KL, MacKenzie CR (1987) A new method of classifying prognostic comorbidity in longitudinal studies: development and validation. J Chronic Dis 40: 373–383. [crossref]
  26. Chotirmall SH, Picardo S, Lyons J, D’Alton M, O’Riordan D, et al. (2014) Disabling disease codes predict worse outcomes for acute medical admissions. Intern Med J 44: 546–553.
  27. Coary R, Byrne D, O’Riordan D, Conway R, Cournane S, Silke B (2014) Does admission via an acute medical unit influence hospital mortality? 12 years’ experience in a large Dublin hospital. Acute medicine 13: 152–158.
  28. Conway R, Byrne D, Cournane S, O’Riordan D, Silke B (2018) Fifteen-year outcomes of an acute medical admission unit. Ir J Med Sci 187: 1097–1105. [crossref]
  29. Beeknoo N, Jones R (2016) Factors Influencing A & E Attendance, Admissions and Waiting Times at Two London Hospitals. British Journal of Medicine & Medical Research 17: 1–29.
  30. O’Loughlin R, Allwright S, Barry J, Kelly A, Teljeur C (2005) Using HIPE data as a research and planning tool: limitations and opportunities. Ir J Med Sci 174: 40–45. [crossref]
  31. O’Callaghan A, Colgan MP, McGuigan C, Smyth F, Haider N, et al. (2012) A critical evaluation of HIPE data. Ir Med J 105: 21–23. [crossref]
  32. O’Sullivan E, Callely E, O’Riordan D, Bennett K, Silke B (2012) Predicting outcomes in emergency medical admissions – role of laboratory data and co-morbidity. Acute medicine 2: 59–65.
  33. Courtney D, Conway R, Kavanagh J, O’Riordan D, Silke B (2014) High-sensitivity troponin as an outcome predictor in acute medical admissions. Postgrad Med J 2014: 1–7.
  34. Cournane S, Conway R, Byrne D, O&apos;Riordan D, Silke B (2017) Predicting Outcomes in Emergency Medical Admissions Using a Laboratory Only Nomogram. Computational and Mathematical Methods in Medicine 2017: 1–8.
  35. Tonelli M, Wiebe N, Fortin M, Guthrie B, Hemmelgarn BR, et al. (2015) Methods for identifying 30 chronic conditions: application to administrative data. BMC Med Inform Decis Mak 15: 31. [crossref]
  36. Quan H, Li B Fau-Saunders LD, Saunders Ld Fau-Parsons GA, Parsons Ga Fau-Nilsson CI, Nilsson Ci Fau -Alibhai A, et al. (2008) Assessing validity of ICD-9-CM and ICD-10 administrative data in recording clinical conditions in a unique dually coded database. Health Serv Res 43: 1424–1441.
  37. Quan H, Sundararajan V, Halfon P, Fong A, Burnand B, et al. (2005) Coding algorithms for defining comorbidities in ICD-9-CM and ICD-10 administrative data. Med Care 43: 1130–1139. [crossref]
  38. Ronald J. Ozminkowski PD MWS, Rosanna M. Coffey, Tami L. Mark, Cheryl A. Neslusan, John Drabek (2000) Private Payers Serving Individuals with Disabilities and Chronic Conditions 2000.
  39. Stevens PE, Levin A (2013) Evaluation and management of chronic kidney disease: synopsis of the kidney disease: improving global outcomes 2012 clinical practice guideline Ann Intern Med 158: 825–30.
  40. Byrne D, Conway R, Cournane S, O’Riordan D, Silke B (2018) Relationship of the clinical acuity & complexity to the outcome of an emergency medical admission. Acute medicine 17: 18–25.
  41. Conway R, Byrne D, O’Riordan D, Silke B (2015) Patient risk profiling in acute medicine: the way forward? QJM 108: 689–696. [crossref]
  42. Sterns RH (1987) Severe symptomatic hyponatremia: Treatment and outcome: a study of 64 cases. Annals of Internal Medicine 107: 656–664.
  43. Sonnenblick M, Friedlander Y, Rosin AJ (1993) Diuretic-induced severe hyponatremia. Review and analysis of 129 reported patients. Chest 103: 601–606. [crossref]
  44. Prytherch DR, Sirl JS, Schmidt P, Featherstone PI, Weaver PC, et al (2005) The use of routine laboratory data to predict in-hospital death in medical admissions. Resuscitation 6: 203–207.
  45. Froom P, Shimoni Z (2006) Prediction of hospital mortality rates by admission laboratory tests. Clin Chem 52: 325–328.
  46. Hucker TR, Mitchell GP, Blake LD, Cheek E, Bewick V, Grocutt M, et al (2005) Identifying the sick: can biochemical measurements be used to aid decision making on presentation to the accident and emergency department. Br J Anaesth 94: 735–741.
  47. Chawla A, Sterns RH, Nigwekar SU, Cappuccio JD (2011) Mortality and serum sodium: do patients die from or with hyponatremia? Clin J Am Soc Nephrol 6: 960–965. [crossref]
  48. Sun L, Hou Y, Xiao Q, Du Y (2017) Association of serum sodium and risk of all-cause mortality in patients with chronic kidney disease: A meta-analysis and sysematic review. Scientific reports 7: 15949-.
  49. Patel RB, Tannenbaum S, Viana-Tejedor A, Guo J, Im K, Morrow DA, et al (2017) Serum potassium levels, cardiac arrhythmias, and mortality following non-ST-elevation myocardial infarction or unstable angina: insights from MERLIN-TIMI 36. European heart journal Acute cardiovascular care 6: 18–25.
  50. Korgaonkar S, Tilea A, Gillespie BW, Kiser M, Eisele G, Finkelstein F, et al (2010) Serum potassium and outcomes in CKD: insights from the RRI-CKD cohort study. Clinical journal of the American Society of Nephrology : CJASN 5: 762–769.
  51. Hughes-Austin JM, Rifkin DE, Beben T, Katz R, Sarnak MJ, Deo R, et al (2017) The Relation of Serum Potassium Concentration with Cardiovascular Events and Mortality in Community-Living Individuals. Clin J Am Soc Nephrol 12: 245–252.

Endothelial Cell Growth Promoting Activity in Graves’ Disease Sera is Neutralized by Anti-Basic Fibroblast Growth Factor Antibodies in Patients with Fat Expansive but Not Infiltrative Orbitopathy

DOI: 10.31038/EDMJ.2019313

Abstract

Purpose: To report a case of orbital fat expansion leading to globe prolapse in a Graves’ disease patient undergoing high-dose glucocorticoid therapy. To evaluate the growth factor receptor specificities of plasma autoantibodies in Graves’ disease patients who exhibited contrasting subtypes of thyroid-associated ophthalmopathy, i.e. orbital fat expansion-type vs. infiltrative.

Methods: Sera from Graves’ orbitopathy and control patients with or without Graves’ disease were subjected to protein-A affinity chromatography to obtain immunoglobulin G. A (1/50th to 1/1600th) range in dilutions of the protein-A eluate fraction was incubated for four days at 37 degrees C with bovine pulmonary artery endothelial cells to test for endothelial cell inhibition or stimulation. Growth stimulatory autoantibodies were co-incubated with specific neutralizing anti-insulin like growth factor 1 receptor antibodies or anti-basic fibroblast growth factor antibodies to assess autoantibody specificity in contrasting Graves’ orbitopathy subtypes.

Results: We observed increased mean endothelial cell growth promoting activity in the protein-A eluates of serum from eighteen patients with active Graves’ disease (117 ± 28%, n = 18) compared to mean endothelial cell activity (89 ± 10%, n = 13, P = 0.003) in thirteen adults without Graves’ disease. The protein-A eluate fraction in acute infiltrative-type Graves’ orbitopathy contained a high titer (> 1: 1000) of endothelial cell stimulatory activity which was significantly neutralized by specific monoclonal anti-human insulin-like growth factor 1 receptor antibodies. The protein-A eluate fraction in fat expansion-type Graves’ orbitopathy contained endothelial cell inhibitory activity (at low titers) and stimulatory activity (at high titers), and the latter stimulatory activity was completely neutralized by specific anti-basic fibroblast growth factor antibodies.

Conclusion: Graves’ disease suffering globe prolapse secondary to marked orbital fat-expansion had coexisting plasma fibroblast growth factor-inhibitory and -stimulatory autoantibodies. The latter was completely neutralized by anti-basic fibroblast growth factor antibodies.

Keywords

Graves’ disease, thyroid associated ophthalmopathy, autoantibodies, fibroblast growth factor

Introduction

Thyroid-associated ophthalmopathy (TAO) is a vision-threatening complication of Graves’ disease (GD) which can cause significant morbidity and impaired quality of life [1]. Extraocular muscle hypertrophy and local inflammation contribute to a severe infiltrative form of the disease whose underlying pathophysiology has been the focus of recent investigations [2]. Evidence suggests that increased local orbital glycosaminoglycan production (a hallmark in infiltrative- type Graves’ orbitopathy) results (in part) from circulating agonist insulin- like growth factor 1 receptor autoantibodies [2] and increased expression of insulin-like growth factor 1 receptor (IGF- 1R) in orbital fibroblasts [3] and in T and B lymphocytes [4].

Orbital fat expansion can accompany Graves’ extraocular muscle hypertrophy, but its underlying pathophysiology is less clearly defined. We report increased mean endothelial cell growth promoting activity in the protein-A eluates of serum from active Graves’ disease compared to adult controls without GD. We also report a patient with type 2 diabetes mellitus, active Graves’ disease, and focal segmental glomerulosclerosis (FSGS) who experienced acute globe prolapse secondary to severe orbital fat expansion in the setting of high-dose glucocorticoid therapy. The patient’s orbitopathy was characterized by a lack of extra-ocular muscle enlargement and his plasma contained novel growth stimulatory endothelial cell plasma autoantibodies whose activity (in vitro) was completely neutralized by specific anti-bovine basic fibroblast growth factor (FGF) antibodies. These data suggest a possible role for circulating fibroblast growth factor-like autoantibodies in rare cases of Grave’s orbitopathy characterized by pure orbital fat expansion.

Participants and Methods

Participants

Graves’ disease (GD) Pt 1: A 45-year-old man with hyperthyroidism who presented with infiltrative-type orbitopathy, diplopia and a triiodothyronine (T3) level of 663 ng/dL (59- 174). He was treated with radioactive iodine (RAI) ablation, methylprednisolone and underwent orbital decompression surgery. Thyroid stimulating immunoglobulin was elevated at 194% (0–130) and anti-microsomal antibody was 4128 IU/mL (0–34).

Graves’ disease (GD) Pt 2: A 53-year-old man with chronic Graves’ disease (treated with tapazole), type 2 diabetes mellitus, macular edema, nephropathy, fat expansion-type orbitopathy and idiopathic focal segmental glomerulosclerosis (FSGS) for which the patient was treated with high- dose glucocorticoids. Thyroid stimulating immunoglobulin was elevated at 199% (0–130) and anti-microsomal antibody was 2367 IU/mL (0–34). During steroid taper, the patient experienced prolapse of the right globe while driving his car. Magnetic resonance imaging of the orbits revealed markedly increased retrobulbar fat bilaterally with resulting proptosis. The extraocular muscles and optic nerves were normal. Doppler ultrasound of the thyroid revealed a‘thyroid inferno pattern’ suggestive of intrathyroidal angiogenesis. The patient progressed to end-stage-renal disease requiring dialysis and died suddenly of unknown causes six years later. Patient 3: A 72-year-old man with Graves’ disease treated with methimazole. He experienced progression in orbitopathy (over a three-year period) characterized by marked enlargement in extra-ocular muscles and moderate increase in retrobulbar fat.

Patient 4: A 64-year-old man with type 2 diabetes, macular edema, and nephropathy who experienced bilateral supero-temporal orbital fat prolapse (left> right) within 9 months of receiving high-dose oral prednisone followed by intra-tympanic injection of solumedrol to treat autoimmune sensorineural hearing loss.

Methods

Blood drawing/Protein-A Chromatography

Informed consent for the local Institutional Review Board-approved study was obtained from each participant prior to blood drawing which was performed in the morning. Protein-A affinity chromatography of serum was carried out as previously reported [5].

Cell culture

Bovine pulmonary artery (BPA) endothelial cells (EC) (Clonetics, Inc. San Diego, CA, USA) were maintained at 37°C in 5% CO2/95% air in Medium 199 (M199) plus 10% fetal calf serum (FCS). BPA endothelial cells were passaged continuously and used between passages 4 and 7. Bovine pulmonary artery endothelial cells are exquisitely sensitive to low concentrations of basic fibroblast growth factor and are an optimal test system for the detection of fibroblast growth factor-like inhibitory and -stimulatory substances [5].

Endothelial cell proliferation assays

Endothelial cell number assays were carried out as previously reported [5]. Confluent cells were trypsinized and plated at 1 to 10 × 103 cells/well in Medium 199 plus 10% fetal calf serum in 96- well plates. After 1 or 2 days incubation for cells to reach 60–80% confluency, test fractions (30 μg/mL of the protein- A eluates of serum) were added to wells in quadruplicate. After 4 days’ incubation in the presence of test fractions, cells were washed with phosphate- buffered saline and colorimetric estimation of cell number was determined as previously described [5]. Each point represents the mean of quadruplicate determinations.

Antibodies

Purified mouse monoclonal anti-human insulin-like growth factor-1 receptor antibodies were obtained from BD Biosciences (San Jose, CA). Polyclonal rabbit, anti-bovine basic fibroblast growth factor antibodies were obtained from R & D Systems, Inc. (Minneapolis, MN).

Protein determinations

Protein concentrations were determined by a bicinchoninic acid protein assay kit (Pierce Chemical Co., Rockford, IL, USA).

Results

Graves’ disease autoantibodies induce endothelial cell proliferation

We observed increased mean endothelial cell growth promoting activity in the protein-A eluates of serum from eighteen patients with active Graves’ disease (117 ± 28%, n = 18) compared to mean endothelial cell activity (89 ± 10%, n = 13, P = 0.003) in an identical 30 µg/mL concentration of the protein-A eluate in thirteen adults without Graves’ disease (including six normal participants, three patients with rheumatoid arthritis, and one patient each with polycystic ovarian syndrome, systemic lupus erythematosus, sarcoidosis or Sjogrens’ syndrome) (Fig 1). Graves’ disease patients did not differ significantly in their mean age, or male: female ratio from the control group of 13 participants (Table 1). Mean endothelial cell activity (30 µg/mL concentration of the protein-A eluate) did not differ significantly in Graves orbitopathy (124 ± 23%, N = 9) compared to Graves without orbitopathy (115 ± 32%, N = 9, P = 0.53). The mean thyroid stimulating hormone, thyroid stimulating immunoglobulin, anti-thyroid peroxidase antibody, or anti-thyroglobulin antibody levels did not differ significantly in active Graves’ disease patients affected (GO+, N = 9) or not affected by orbitopathy (GO-, N = 9) (Table 1).

EDMJ - Mark B Zimering-F1

Figure 1. Endothelial cell growth-promoting activity in a one-fiftieth dilution (30 µg/mL) of the protein-A eluate fraction of serum from active Graves’ disease (inverted, open diamonds) and control patients without Graves or thyroid disease (closed diamonds). Mean endothelial cell growth promoting activity in GD sera significantly exceeded activity in control sera. Bovine endothelial cells were incubated for four days in the presence of test fractions and % of basal activity was determined as described in Methods.

Table 1. Baseline characteristics in Graves’ disease patients and control participants.

Risk factor

Graves’ disease (N=18)

Systemic autoimmunity and normals (N=13)

P-value*

Age

46.4(13.0)

40.9(11.2)

0.25

Gender (M/F)

7/11

5/8

1.0**

GO+(N=9) GO- (N=9)

TSH (μIU/mL)

2.28(3.19) 0.12(0.10)

NT

0.09

TSI AB (%)

216 (91) 241(110)

NT

0.65

Anti-TPO AB (IU/mL)

1374(1449) 726(778)

NT

0.32

Anti-TG AB (IU/mL)

42(50) 97(111)

NT

0.35

Results are mean (SD); GO Graves orbitopathy, + present, -absent; M-male; F-female

TSH- thyroid stimulating hormone; TSI- thyroid stimulating immunoglobulin; TPO- thyroid peroxidase; TG- thyroglobulin; AB-antibody.

^ N = 6 normal participants, 3 rheumatoid arthritis, 1 systemic lupus erythematosus, 1 sarcoidosis, 1 polycystic ovarian syndrome, 1 Sjogren’s syndrome patient.

*T-test; ** Fischer’s exact test

Lack of association between EC activity in GD protein-A eluates and thyroid autoantibodies

There was no significant correlation between thyroid stimulating immunoglobulin (TSI) level and endothelial cell growth activity in the protein-A eluates of all eighteen active GD sera (Fig 2A). There was no significant correlation between endothelial cell growth activity in the protein-A eluates of GD sera and either anti-thyroglobulin antibody (n = 13) or anti-thyroid peroxidase antibody (n = 15) level (Fig 2B, 2C). We next sought to characterize the endothelial cell growth stimulatory activity in the protein-A eluates of a subset of Graves’ disease orbitopathy patients presenting with contrasting subtypes of ophthalmopathy, i.e. infiltrative vs. fat- expansion type.

EDMJ - Mark B Zimering-F2

Figure 2. Correlation between endothelial cell growth promoting activity in the protein-A eluate of Graves’ disease serum and level of A) thyroid stimulating immunoglobulin, B) anti-thyroid peroxidase antibody or C) anti-thyroglobulin antibody. R2= [correlation coefficient].2

Endothelial cell activity in protein-A eluates of Graves’ disease having infiltrative vs. fat- expansion type orbitopathy

Active Graves’ disease manifesting with moderately-severe acute infiltrative TAO, i.e. GD1, was characterized by extraocular muscle enlargement with subtle fatty degeneration in the lateral rectus muscle (Fig 3A). The GD1 protein-A eluate fraction contained a high titer of endothelial cell stimulatory activity (dashed black line, Fig 3C). Active Graves’ disease presenting with globe prolapse, i.e. GD2, was characterized by severe orbital fat expansion (Fig 3B). The GD2 protein- A eluate contained a low-titer of endothelial cell inhibitory activity together with higher titer endothelial cell stimulatory IgG activity (GD Pt 2, dashed gray line, Fig 3C).

Patients who had experienced either long-standing infiltrative-type TAO (Pt 3) or orbital fat prolapse after receiving high-dose glucocorticoid therapy (Pt 4) were included as controls for the results in GD1 and GD2. The Pt 3, infiltrative-type TAO GD protein- A eluate contained a monophasic low titer of endothelial cell growth stimulatory activity (solid green line, Fig 3C), similar to GD1. The Pt 4, diabetic, orbital fat prolapse, protein- A eluate elicited biphasic endothelial cell- inhibitory and -stimulatory responses at low and higher titers, respectively (solid blue line, Fig 3C), similar to GD2.

A

EDMJ - Mark B Zimering-F3a

B

EDMJ - Mark B Zimering-F3b

C

EDMJ - Mark B Zimering-F3c

Figure 3. Contrasting infiltrative (A) and fat expansion (B) subtypes of thyroid associated ophthalmopathy and (C) corresponding dose-endothelial cell proliferation curves in protein-A eluates from patients having predominantly muscular hypertrophy or orbital fat expansion.

A) Computed tomography scan of the orbits (GD, Patient 1) showed bilateral proptosis, enlargement of the extraocular muscles sparing the tendons associated with fatty
degen­eration consistent with the clinical diagnosis of Graves ophthalmopathy. Optic nerves are within normal limits. B) Magnetic resonance imaging of the orbits (GD, Patient 2) revealed markedly increased retrobulbar fat bilaterally with resulting proptosis. The extraocular muscles and optic nerves were normal. Fat expansion caused complete loss of normal architecture of the orbit which together with shallow orbits predisposed to globe prolapse. C) Dose-endothelial cell proliferation curves of protein-A eluates in representative patients with Graves’ disease having infiltrative-type orbitopathy (GD 1), retrobulbar fat expansion-type (GD2), or mixed infiltrative and fat expansion type orbitopathy (Pt 3); and in a diabetic nephropathy patient who experienced bilateral retrobulbar fat enlargement and orbital fat prolapse (Pt 4). Each point represents the mean of quadruplicate determinations which varied by 5–15%. DM-diabetes mellitus, GD- Graves disease, TAO-thyroid associated ophthalmopathy, expans(ion).

Neutralization of EC bioactivity in GD with acute infiltrative TAO sera by anti-IGF1 receptor antibodies

Peak endothelial cell stimulatory activity in the protein-A eluate from GD1 infiltrative-type TAO patient was significantly neutralized (P< 0.01)) (~67%) by co-incubation endothelial cells with a 5 µg/mL concentration of monoclonal anti-human insulin-like growth factor 1 receptor (IGF1R) antibodies (e.g. Pt 1; Fig 4A). Seventy to one-hundred percent neutralization of endothelial cell activity (mean 123%) was observed in the protein -A eluates in two additional GD patients (one each having mild GD orbitopathy or no orbitopathy) following co-incubation with (5 µg/mL) monoclonal anti- human IGF1R antibodies (data not shown in Fig 4). The anti-IGF1R antibodies alone had no significant effect on EC proliferation (Fig 4A). Endothelial cell stimulatory activity in the protein- A eluate of GD1 was not significantly affected by co-incubation with a 5 µg/mL concentration of specific anti-bovine basic fibroblast growth factor (bFGF) antibodies (Fig 4B).

A

EDMJ - Mark B Zimering-F4a

B

EDMJ - Mark B Zimering-F4b

Figure 4. Neutralization of GD1 infiltrative-type ophthalmopathy autoantibodies by specific insulin-like growth factor 1 receptor antibodies.

Neutralization of endothelial cell proliferative activity in A) GD1 protein-A eluate fraction by specific anti-insulin like growth factor 1 receptor antibodies. Similar results were observed in three Graves’ disease patients tested. B) Lack of effect of specific anti-bFGF antibodies on endothelial cell growth promotion by Graves’ disease protein-A eluate autoantibodies. A, B) Ten micrograms/mL concentrations of the protein-A eluate from Pt 1, Graves’ disease serum was incubated in the presence (black bar) or absence (open bar) of 5 µg/mL concentrations of anti- IGF1R antibodies (A) or 5 µg/mL concentrations of anti-bFGF antibodies (B). Each point represents the mean (+ SD) of quadruplicate determinations as described in Methods. AA-autoantibodies, IGF1R-insulin-like growth factor 1 receptor, GD1- Graves’ disease patient 1, AB-antibodies, AntibFGF AB- anti-basic fibroblast growth factor antibodies.

Neutralization of EC bioactivity in GD with retrobulbar fat expansion TAO sera by specific anti- bFGF antibodies

Peak EC stimulatory activity in the protein-A eluate from GD Patient 2 suffering globe prolapse was completely neutralized by co-incubation with 5 µg/mL anti-bovine basic fibroblast growth factor antibodies (Fig 5A). The anti-bFGF antibodies alone had no significant effect on endothelial cell proliferation (Fig 5A). Co-incubation with a 5 µg/mL concentration of monoclonal anti-human insulin-like growth factor 1 receptor antibodies had no significant effect on endothelial stimulatory activity in the GD Patient 2 protein-A eluate fraction (data not shown in Fig 5). Peak EC stimulatory activity in the protein- A eluate fraction in Pt 4 suffering orbital fat prolapse was completely neutralized following co-incubation with 5 µg/mL specific anti- bFGF antibodies (Fig 5B).

A

EDMJ - Mark B Zimering-F5a

B

EDMJ - Mark B Zimering-F5b

Figure 5. Neutralization of fat-expansion type ophthalmopathy autoantibodies by anti-basic fibroblast growth factor antibodies.

Neutralization of endothelial cell proliferative activity in A) GD2 protein- A eluate fraction or B) Pt 4 diabetic nephropathy, orbital fat prolapse patient’s protein- A eluate fraction by specific anti-bFGF antibodies. B) Two micrograms/mL concentrations of the protein-A eluate from GD, Pt 2 or Pt 4 serum was incubated in the presence (black bar) or absence (open bar) of 5 µg/mL concentrations of specific anti-bovine bFGF antibodies as described in Methods. Complete neutralization of endothelial cell growth stimulatory activity was observed in the protein-A eluates from GD2 and Pt 4 diabetic nephropathy patient suffering with idiopathic retrobulbar fat expansion and fat prolapse. Each point represents the mean (±SD) of quadruplicate determinations. GD2-Graves’ disease, Patient 2, Diab Neph(ropathy), OFP AA- orbital fat prolapse autoantibodies.

Discussion

The present data are the first to suggest increased circulating endothelial cell stimulatory autoantibodies in active Graves’ disease. Angiogenesis is a characteristic feature of the thyroid gland in Graves’ disease as evidenced by a characteristic “thyroid inferno” color Doppler flow sonography pattern [6] in Graves’ disease patient 2 in the present study. Goiter formation in the rat was accompanied by increased basic fibroblast growth factor expression in the thyroid follicular cells, stroma and endothelial cells as well as neovascularization [7]. Basic fibroblast growth factor (basic FGF) is a highly potent autocrine endothelial cell mitogen which lacks an amino terminal signal sequence needed for efficient secretion from cells [8]. Basic fibroblast growth factor does not normally circulate in healthy, nonpregnant adults [9, 10], however, plasma basic fibroblast growth factor immunoreactivity was increased in certain pituitary tumors, e.g. sporadic acromegaly [9] and in micro- or albuminuric diabetic nephropathy [11]. The occurrence of fibroblast growth factor-like autoantibodies in subsets of sporadic acromegaly [12] and in diabetic nephropathy [13] suggested a role for elevated insulin-like growth factor 1 [14] or chronic inflammation in enhanced autoantibody production [14] to circulating basic fibroblast growth factor or its receptors. The present data are the first to suggest that fibroblast growth factor-like autoantibodies in diabetic nephropathy suffering with co-morbid Graves’ disease or a different systemic autoimmune disease may be a driver of orbital fat expansion-type orbitopathy.

Prior reports suggested a possible local role for angiogenic factors such as basic fibroblast growth in promoting Graves’ orbitopathy. For example, basic fibroblast growth factor expression was increased in the orbital fibroblasts and adipocytes of patients suffering with severe Graves’ orbitopathy [15]. In addition, basic FGF acted synergistically with platelet derived growth factor in promoting orbital fibroblast production of hyaluronan and interleukin-6 [16]. Macrophages present in chronically- inflamed Graves’ orbital tissues [15] express a number of different angiogenic factors including basic FGF and insulin-like growth factor 1 [17]. Increased expression of insulin-like growth factor 1 receptor on T and B lymphocytes reported in Graves’ disease [4] may provide a mechanism for enhanced systemic autoimmunity to locally- or systemically-elaborated basic FGF via activation of the insulin-like growth factor 1 receptor on immune cells by subsets of circulating Graves’ disease immunoglobulins [18]. Although endothelial cell stimulatory autoantibody activity was not preferentially increased in a subset of Graves’ orbitopathy vs. Graves’ without orbitopathy in the present study, the sample sizes were small precluding a definitive conclusion.

In acute severe infiltrative Graves’ orbitopathy (GD patient 1), autoantibody-mediated endothelial cell stimulatory activity was neutralized (~67%) by specific anti-insulin-like growth factor 1 receptor antibodies, but was unaffected by specific anti-basic fibroblast growth factor antibodies. The autoantibody-mediated endothelial cell stimulatory activity in two of two additional newly-diagnosed Graves’ disease sera tested was also substantially or completely blocked by specific anti-insulin-like growth factor antibodies suggesting that fibroblast growth factor-like autoantibodies are not likely to play a significant role in early, active Graves’ disease patients lacking co-morbid diabetic nephropathy. Endothelial cell inhibitory autoantibody activity was largely absent in the protein-A eluates in seventeen of eighteen active Graves’ disease patients (Fig 1) consistent with a prior report of a low prevalence of anti-endothelial cell autoantibodies in thyroid autoimmunity patients having suppressed TSH [19]. Anti-endothelial cell autoantibodies were reported to occur at a (four-fold) significantly higher prevalence in thyroid autoimmunity patients having elevated TSH [19]. This may explain in part an increased occurrence of low-titer anti-endothelial cell autoantibodies in previously-treated, chronic Graves’ disease patients compared to newly-diagnosed Graves’ disease. In subsets of diabetic macular edema [20] and/or diabetic nephropathy [13] anti-endothelial cell autoantibodies targeted heparan sulfate proteoglycan, the low affinity FGF receptor, which is required for FGF-mediated endothelial cell survival and proliferation [21].

A possible dual role for endothelial cell inhibitory and fibroblast growth factor like stimulatory autoantibodies in promoting orbital fat expansion (in the setting of high-dose glucocorticoid therapy) is suggested by several observations. First, abrogation of basic fibroblast growth factor signaling (via knockout of the FGF2 gene in mice), promoted differentiation of bone marrow stromal cells into adipocytes [22]. Second, dexamethasone is known to promote adipocyte differentiation in pluripotent mesenchymal stem cells which have the potential to develop into osteoblasts or fat cells [23]. Third, basic fibroblast growth factor is a mitogen abundantly expressed in osteoblasts [24] and in preadipocytes [25], and in the latter cell type, basic fibroblast growth factor prevented adipocyte differentiation [25]. Taken together, fibroblast growth factor-like autoantibodies might drive expansion in a pool of precursor cells which later differentiate into fat cells under the dual influences of high-dose glucocorticoids and FGF- inhibitory autoantibodies. This proposed mechanism requires spatially- and temporally- independent actions by FGF-inhibitory and -stimulatory autoantibodies. Since FGF-like stimulatory, but not inhibitory autoantibodies displayed uniquely high affinity for hydroxyapatite which is a normal constituent of bone matrix [5] stimulatory autoantibodies might localize to a different region in the orbital- retro-orbital connective tissue space than soluble FGF-inhibitory autoantibodies.

The etiology of muscle enlargement in thyroid-associated ophthalmopathy is still a subject of debate with evidence supporting involvement of either TSH receptor autoantibodies and/or insulin-like growth factor 1 receptor autoantibodies [18]. A ten nanomolar concentration of insulin-like growth factor 1 was reported to cause an 80% increase in basal DNA synthesis in microvascular endothelial cells [26] and phosphorylation of the insulin-like growth factor 1 receptor in macrovascular endothelial cells [27]. Thus a subset of Graves’ disease IgG autoantibodies having specificity for the insulin-like growth factor 1 receptor may have accounted (in part) for the significant endothelial cell proliferation we observed here in a subset of newly-diagnosed Graves’ disease patients with infiltrative-type orbitopathy.

In summary, these data are the first to suggest a possible association between fibroblast growth factor-like stimulatory autoantibodies and subsets of orbital fat-expansion/fat prolapse in patients with Graves’ disease, diabetes and focal segmental glomerulosclerosis or in diabetes having a different systemic autoimmune co-morbid condition which also required treatment with high-dose glucocorticoids. More study is needed to determine whether coexisting endothelial cell inhibitory and stimulatory autoantibodies in Graves’ disease serum may be a useful biomarker for an increased risk of fat expansion- type orbitopathy following high-dose glucocorticoid therapy.

Acknowledgement

Presented in part at the 92nd Annual Meeting of the Endocrine Society, Boston, MA. June 4, 2011. We thank Terry J. Smith, MD for his valuable contributions to an earlier draft of the manuscript.

The authors report no multiplicity of interest affecting the objectivity of the presented findings. Supported in part by a grant from the Veterans Biomedical Research Institute, East Orange, New Jersey, USA to MBZ.

Abbreviations

BPA – Bovine Pulmonary Artery

EC – Endothelial Cells

FCS – Fetal Calf Serum

FGF2 – Fibroblast Growth Factor 2

bFGF – basic Fibroblast Growth Factor

FSGS – Focal Segmental Glomerulosclerosis

GD – Graves’ Disease

IGF1 – Insulin–Like Growth Factor 1

IGF1R – Insulin–Like Growth Factor 1 Receptor

M199 – Medium 199

TAO – Thyroid Associated Ophthalmopathy

T3 – Triiodothyronine IgG-Immunoglobulin G

References

  1. Hiromatsu Y, Eguchi H, Tani J, Kasaoka M, Teshima Y (2014) Graves’ ophthalmopathy: epidemiology and natural history. Intern Med 53: 353–360. [crossref]
  2. Tsui S, Naik V, Hoa N (2008) Evidence for an association between thyroid-stimulating hormone and insulin-like growth factor 1 receptors: a tale of two antigens implicated in Graves’ disease. J Immunol 181: 4397–4405.
  3. Smith TJ, Hegedüs L, Douglas RS (2012) Role of insulin-like growth factor-1 (IGF-1) pathway in the pathogenesis of Graves’ orbitopathy. Best Pract Res Clin Endocrinol Metab 26: 291–302. [crossref]
  4. Douglas RS, Naik V, Hwang (2008) CJ B cells from patients with Graves’ disease aberrantly express the IGF-1 receptor: implications for disease pathogenesis. J Immunol 181: 5768–5774.
  5. Zimering MB, Thakker-Varia S (2002) Increased fibroblast growth factor-like autoantibodies in serum from a subset of patients with cancer-associated hypercalcemia. Life Sci 71: 2939–2959.
  6. Ralls PW, Mayekawa DS, Lee KP, Colletti PM, Radin DR, et al. (1988) Color-flow Doppler sonography in Graves disease: “thyroid inferno”. AJR Am J Roentgenol 150: 781–784. [crossref]
  7. Patel VA, Hill DJ, Eggo MC, Sheppard MC, Becks GP, et al. (1996) Changes in the immunohistochemical localisation of fibroblast growth factor-2, transforming growth factor-beta 1 and thrombospondin-1 are associated with early angiogenic events in the hyperplastic rat thyroid. J Endocrinol 148: 485–499. [crossref]
  8. Abraham JA, Mergia A, Whang JL (1986) Nucleotide sequence of a bovine clone encoding the angiogenic protein, basic fibroblast growth factor. Science 233: 545–548.
  9. Zimering MB, Katsumata N, Sato Y, Brandi ML, Aurbach GD, et al. (1993) Increased basic fibroblast growth factor in plasma from multiple endocrine neoplasia type 1: relation to pituitary tumor. J Clin Endocrinol Metab. 76: 1182–1187.
  10. Hill DJ, Tevaarwerk GJ, Caddell C, Arany E, Kilkenny D, et al. (1995) Fibroblast growth factor 2 is elevated in term maternal and cord serum and amniotic fluid in pregnancies complicated by diabetes: relationship to fetal and placental size. J Clin Endocrinol Metab 80: 2626–2632. [crossref]
  11. Zimering MB, Eng J (1996) Increased basic fibroblast growth factor-like substance in plasma from a subset of middle-aged or elderly male diabetic patients with microalbuminuria or proteinuria. J Clin Endocrinol Metab 81: 4446–4452. [crossref]
  12. Zimering MB, Katsumata N, Friesen HG (1997) Fibroblast growth factor-like autoantibodies in plasma from patients with multiple endocrine neoplasia type 1 and prolactinoma. In, B Lymphocytes and Autoimmunity Ann NY Acad of Sciences 815: 520–524.
  13. Zimering MB, Zhang JH, Guarino PD, Emanuele N, McCullough PA, et al. (2014) Investigators for the VA NEPHRON-D. Endothelial cell autoantibodies in predicting declining renal function, end-stage renal disease, or death in adult type 2 diabetic nephropathy. Front Endocrinol (Lausanne) 5: 128.
  14. Robbins K, McCabe S, Scheiner T, Strasser J, Clark R, et al. (1994) Immunological effects of insulin-like growth factor-I–enhancement of immunoglobulin synthesis. Clin Exp Immunol 95: 337–342. [crossref]
  15. Pawlowski P, Reszec J, Eckstein A (2014) Markers of inflammation and fibrosis in the orbital fat/connective tissue of patients with Graves’ orbitopathy: clinical implications. Mediators Inflamm 412158.
  16. Virakul S, Heutz JW, Dalm VA (2016) Basic FGF and PDGF-BB synergistically stimulate hyaluronan and IL-6 production by orbital fibroblasts. Mol Cell Endocrinol 433: 94–104.
  17. Sunderkötter C, Goebeler M, Schulze-Osthoff K, Bhardwaj R, Sorg C (1991) Macrophage-derived angiogenesis factors. Pharmacol Ther 51: 195–216.
  18. Smith TJ (2003) The putative role of fibroblasts in the pathogenesis of Graves’ disease: evidence for the involvement of the insulin-like growth factor-1 receptor in fibroblast activation. Autoimmunity 36: 409–415.
  19. Wangel AG, Kontiainen S, Melamies L, Weber T (1993) Hypothyroidism and anti-endothelial cell antibodies. APMIS 101: 91–94. [crossref]
  20. Zimering MB, Anderson RJ, Moritz TE, Ge L (2009) Investigators for the VADT. Endothelial cell inhibitory autoantibodies are associated with laser photocoagulation in adults from the Veterans Affairs Diabetes Trial. Metabolism 58: 882–887.
  21. Zimering MB, Pan Z (2009) Autoantibodies in type 2 diabetes induce stress fiber formation and apoptosis in endothelial cells. J Clin Endocrinol Metab 94: 2171–2177.
  22. Xiao L, Sobue T, Esliger A, Kronenberg MS, Coffin JD, et al. (2010) Disruption of the Fgf2 gene activates the adipogenic and suppresses the osteogenic program in mesenchymal marrow stromal stem cells. Bone 47: 360–370. 360–370. [crossref]
  23. Q Chen, P Shou, C Zheng, M Jiang, G Cao, et al. (2016) Fate decision of mesenchymal stem cells: adipocytes or osteoblasts? Cell Death Differ 23: 1128–1139.
  24. Marie PJ (2012) Fibroblast growth factor signaling controlling bone formation: an update. Gene 498: 1–4. [crossref]
  25. Teichert-Kuliszewska K, Hamilton BS, Deitel M, Roncari DA (1994) Decreasing expression of a gene encoding a protein related to basic fibroblast growth factor during differentiation of human preadipocytes. Biochem Cell Biol 72: 54–57.
  26. Bäck K, Islam R, Johansson GS, Chisalita SI, Arnqvist HJ (2012) Insulin and IGF1 receptors in human cardiac microvascular endothelial cells: metabolic, mitogenic and anti-inflammatory effects. J Endocrinol 215: 89–96.
  27. Chisalita SI, Arnqvist HJ (2004) Insulin-like growth factor I receptors are more abundant than insulin receptors in human micro- and macrovascular endothelial cells. Am J Physiol Endocrinol Metab 286: 896–901.

Best and Effective Practices of Wound Care and Healing Among Patients with Diabetes Mellitus

DOI: 10.31038/EDMJ.2019312

Abstract

Aim: With the continuing trend in the incidence of diabetic ulcer, current researches from evidence-based practice augment best and effective practices on wound care and healing among patients suffering from diabetes mellitus.

Methods: This study utilized a systematic review of literatures in light of wound care through Pub Med database with the key words “Diabetes Mellitus,” “wound practices,” “wound healing,” and “systematic review.” The searched literatures were of case reports, interventional studies, and review papers whose main texts were in English.

Results: There were 7,988 published articles yielded from the keywords used and 16 were included in this study. The practiced management and techniques in these literatures focused on comfortable and cost efficient means of wound care and healing with the involvement of group participation than individual plan of care.

Conclusions: There are meager evidences for vigorous wound and healing options that needs further studies in resolving wound issues among patients with Diabetes Mellitus. This systematic review establishes the insufficiency of high level of evidence based studies on wound healing in DM patients and brings a track for continuity of rigid studies concerning this topic.

Implications for Nursing Practice and/or Health Policy: Understanding innovative wound care is the chance for nursing professionals to associate evidence, expert opinion and patients’ preference for a best and effective practices of wound care and healing and thus eventually make them a step above their skills. The evolution of different treatment regimens like hyperbaric O2 therapy, TCOT device, natural latex associated with the LED circuit, low-level laser therapy, PRP treatment, salt-based spray, Telemedicine follow up, cord platelet gel application, Human Reticular Acellular Dermal Matrix, and acellular reticular allogenic human dermis will not only aid in the management of wound care and healing but also in strengthening the comprehensive and practical skills among nurses.

Keywords

Diabetes Mellitus, Systematic Review, Wound Care and Practices, Wound Healing

Introduction

Wounds are commonly categorized as chronic or acute and could rise from any traumatic damage or through a collapse of an unharmed skin [1]. Healthy people have strong skin integrity with a significant ability for healing but can be exposed to outer and inner harm brought about by older age and changed in physiology [2]. This can be intrinsic or extrinsic in nature. In people suffering from diabetes, healing of lesions is slow but progresses faster. It is therefore essential to understand diabetes and appropriate wound care along with the complexities of wound management and understanding for a better life and longevity. The incidence of diabetes is escalating faster in the countries of middle and low revenues and in 2014; a global data of 8.5% came from people aging 18 years old and above [3]. But the occurrence of diabetic foot ulcers is within 4% and 10% with 1:4 threat of having diabetic foot ulcer in their life [4].

Although minor injuries like burns, abrasions and lesions are normal accidents; these can bring severe medical concerns to people with diabetes [5]. Local infection can extend fast to the internal parts of the body and can be fatal. Studies suggests that curing of wounds is affected by: weakening in producing hormones related with development and therapy, decreasing in producing and repairing of new blood vessels, weakening of skin protection, and decreasing in the production of collagen [5]. There are recent studies that can help in bringing effective management of wound care among patients with diabetes. These are helpful practices that can save limbs for amputation.

This review is an investigation on the efficacy of different practices of healthcare professionals in the conduct of wound care and healing among patients suffering from diabetes. It has unveiled comfortable management of diabetic wounds as well as hopes to patients with DM to salvage their limbs. It is with the same reason why the author conducted this review. Results stated different practices and effects and there is a solid reason for more evidence-based studies that will heighten the rate of wound healing and introduce patients with DM easy to carry out wound care and practices. This study commenced to explore the different practices in wound care for patients with diabetes using systematic review of published evidence-based studies on wound management in diabetes.

Methods

The research composition of this systematic review to unveil different practices on wound care and healing among patients with diabetes mellitus. Pub Med database was searched for relevant literatures through keywords “Diabetes Mellitus,” “wound practices,” “wound healing,” and “systematic review.” It was piloted on November 1, 2018 and focused the search on case reports, interventional studies, and review papers written in English language. The focus of the search is practices and wound care that would lead to wound healing. Yielded published articles were systematically evaluated based on the country of the author, year the article is published, site of the study, method and design of the study, management team, and the results. Prior synthesis, data is extracted via two reviewers and reviewed for accuracy by another reviewer. Inconsistencies are being identified for illegibility and consensus while recognizing ineligibles based on the criteria.

Results

With the use of keywords yielded 7,988 published articles on wound management among patients with DM but only 16 fulfilled the criteria set in this study for review. Relevant data is summarized in (Table 1).

Table 1.Physiognomies of Selected Studies: Best and Effective Practices of Wound Care and Healing Among Diabetic Patients.

Author; year published; title of the study

Sample; wound type

Study design

Team composition

Intervention and period of coverage

Primary Outcome

Major results

Chang (2018)

274, Diabetic foot

Single-center retrospective study

Surgeon

Patient evaluation, wound preparation, improving vascularity, surgery and dressing, and rehabilitation

2005–20017

Infection and arterial occlusion

Improved vascularity

Chen et al. (2017)

38, Chronic diabetic foot ulcer

Randomized controlled trial

Doctor, nurse

Intervention group receives standard care and HBOT while control group receives standard care only.

20 days

Wound closure

Improved wound healing

Crews & Candela (2018)

25, Diabetic foot ulcer

Randomized controlled trial

Doctor, PT

Patients at risk for DFU’s with removable cast walkers in 20 mins walking trials using 5 footwear conditions

Bilateral shoes brought better comfort

Ankle-high removable cast walker combined with contralateral limb lift increases offloading and improve healing

Driver (2017)

130, Foot ulcer

A prospective, randomized, blinded, multicenter, parallel study

Not mentioned

TCOT device given to intervention groups following assessment and standard care while the control group received the sham device following standard care.

12 weeks treatment

Good wound results in both groups

Beneficial to older population

Eraydin & Avsar (2018)

65, Diabetic foot ulcer

Randomized control trial

Nurses

Intervention group given standard wound care and foot exercises for 12 weeks while the control group had standard wound care with no exercise

12 weeks

Difference in the ulcer areas in the two groups

Significant decrease of ulcer area in the intervention group.

Health Quality Ontario (2017)

8; Ulcer

7 randomized controlled trials, 1 nonrandomized controlled trial

Experts, end users, and applicants

Review and assessment of studies concerning efficacy and cost effectiveness of HBOT utilizing the standpoint of the Ministry of Health and Long-Term Care and assessed the clinical evidence with the use of GRADE.

Mixed results on standard of care in rates of amputation while there is impact on standard care and HBOT and no difference on the adverse events on both.

Satisfaction on patients using HBOT and positive perceptions on healing

Lopez-Delis (2018)

15, Lower limb ulcer

Randomized controlled trial

Nurses, patients

Group 1: recipients of dressing system adhesive of the natural latex associated with the LED circuit.

Group 2: recipients of dressing at home with calcium alginate or silver foam

Group 3: recipients of dressing at home with adhesive derived from the natural latex associated with the LED circuit.

1 month

Significant decrease in ROS formation

Latex and phototherapy brought better debridement and healing process

Mathur et al. (2017)

30, Grade 1 foot ulcer

Randomized clinical trial

Doctors, Nurses

Intervention group received low-level laser therapy with conventional therapy while control group only received conventional therapy

6 weeks

absolute and relative wound size reduction at 2 weeks compared to the baseline parameter.

results suggest that LLLT is beneficial as an adjunct to conventional therapy in the treatment of diabetic foot ulcers.

Mohammadi,et al. (2017)

100 Diabetic foot ulcer

A single-arm clinical trial

Doctor,

nurses

Weekly PRP treatment following primary wound care

Significant decrease of the area of wound

Platelet-rich plasma gel as treatment for non-healing DFU

Park et al. (2018)

167 Diabetic foot ulcer

A phase III multicenter, double-blind, randomized, placebo-controlled trial

nurses

Routine wound care and topical or spray of saline with 0.005% rhEGF (n=82) or (n=85) twice a day

12 weeks

Comparable results between placebo groups and the rhGF groups

Faster healing velocity and higher complete healing rate regardless of HbA1c levels.

Pougatsch (2017)

10, Diabetic foot ulcer

Prospective, case-cohort study,

Pilot study

Not mentioned

Used acceptable methods of cleansing and the use of salt-based spray then gauze sponges soaked with the spray is used to dress the ulcer and then covered with dry foam or gauze and wrap with ACE.

12 weeks

Wound closure

Viable natural wound care therapy

Santema et al. (2018)

120 Ischemic wound

DAMO2CLES multicenter randomized clinical trial

Not specified

40 sessions of HBOT was used for five days weekly or till complete wound healing was reached

One month

Limb salvage and

wound healing

Freedom from any amputation

Smith-Strøm et al. (2018)

165, Diabetic foot ulcer

cluster-randomized controlled non-inferiority trial

Doctors,

Healthcare personnel,

Community nurses

Intervention group utilized TM follow-up care in the community while the control group received SOC.

2012–2016

Faster Healing time

Technology as relevant alternative to wound care

Volpe et al. (2017)

20 Diabetic wound

Non-blinded, consecutive series, randomized clinical trial

Nurses

Surgeons

Group A is managed with standard wound care while Group B is managed with topical application of CBPG consisted of platelet gel application 2 times a week in 4 weeks and then once a week for an additional 4 weeks.

2 months

Ulcer reduction

Rapid healing than standard technique

Zelen et al. (2017)

20, Diabetic foot

A retrospective crossover study

Not mentioned

Indolent DFUs are given acellular matrices

12 weeks

12 out of 20 were eligible for crossover treatment

Complete healing achieved

Zelen et al. (2017)

40, Chronic diabetic ulcer

A prospective, randomized, controlled, multi-centre

clinical study

Doctor

Nurse

SOC group receives dressing change daily combined with collagen alginate while

HR-ADM group received grafts.

12 weeks

Healing proportion of wounds in 6 weeks.

Clinical superiority of HR-ADM and considered cost effective

Country and Year of Publication

The selected studies were authored by researchers from Finland (2), Netherlands (2), Korea (2), USA (2), Italy (1), Norway (1), Iran (1), India (1), Brazil (1), Canada (1), Turkey (1), and Taiwan (1). These are written in English and were published from 2017–2018. Therefore, the papers used for review were recent and current as these are being published in a year time.

Sample

Only four of the 16 studies are of small sample (8, 10, 15, 20, and 20 cases). Most of the selected studies were of large sample (25, 30, 38, 40, 65, 100, 120, 130, 165, 167, and 274 cases correspondingly) resulting to a mean of 105 cases (SD: 77 cases). The kinds of wounds were specified in all cases and the leading type was diabetic foot ulcer.

Study Design

Five (5) studies used randomized control trials (RCTs). Others were combination of designs like: two (2) utilized retrospective study where one is a single centered while the other one is a cross-over; three (3) are prospective studies where one is randomized, blinded, multicenter, and parallel study, the second is prospective, case-cohort study, and a Pilot study, and the third is prospective, randomized, controlled, multi-center clinical study. One (1) study used 7 randomized controlled trials and 1 nonrandomized controlled trial. Others studies are: one (1) single-arm clinical trial; one (1) phase III multicenter, double-blind, randomized, placebo-controlled trial; one (1) DAMO2CLES multicenter randomized clinical trial; one (1) cluster-randomized controlled non-inferiority trial; and one (1) Non-blinded, consecutive series, randomized clinical trial.

Management Team

Included studies were mostly composed of nurses and doctors. One had collaboration with experts, end users, and applicants. Two of the studies did not identify the composition of the healthcare team while another two studies included surgeons. There is no mention of inclusion of podiatry and orthotic studies

Intervention

Selected studies utilized both intervention and control groups where the control groups are given standard wound care following evaluation and rigid assessment. Some studies incorporate exercises while other studies add follow up care. The intervention groups are also given standard wound care and additional management that includes like hyperbaric O2 therapy (HBOT), transdermal continuous oxygen therapy (TCOT) device, natural latex associated with the LED circuit, low-level laser therapy, PRP treatment, salt-based spray, Telemedicine follow up, cord platelet gel application, Human Reticular Acellular Dermal Matrix, and acellular reticular allogenic human dermis. The identified interventions are of usual units of weeks.

Primary Outcome

Primary outcomes are of diverse occurrence. There is infection and arterial occlusion in improving vascularity, surgery, and rehabilitation as resulted in the single-center retrospective study of Chang [6]. In the use of HBOT, there is wound closure in the RCT of Chen et al., [7] utilizing HBOT while satisfaction and positive insights on healing is the result of 7 randomized controlled trials, 1 nonrandomized controlled trial by Health Quality Ontario [8] with primary outcomes of mixed results on standard of care in rates of amputation whereas there is impact on standard care and HBOT and no difference on the adverse events on both. The use of 5 footwear conditions as brought about by RCT of Crews and Candela [9] resulted to comfort from bilateral shoes. Santema et al. [10] used 40 sessions of HBOT five days a week or until complete wound healing was reached for limb salvage and wound healing.

TCOT on the other hand is used in intervention group in the prospective, randomized, blinded, multicenter, parallel study of Driver [11] brought no difference with the controlled group utilizing standard care. But in the RCT of Eraydin & Avsar [12] in the RCT, there is difference in the ulcer areas in the two groups where the intervention group is given standard wound care and foot exercises for 12 weeks while the control group had standard wound care with no exercise. The first elicited better wound area. The RTC of Lopez-Delis [13] used three groups for dressing. Group 1 is with natural latex related with LED circuit, group 2 is with calcium alginate or silver foam, and group 3 is with adhesive derived from the natural latex associated with the LED circuit. The primary outcome is significant decrease in reactive oxygen species (ROS) formation. Regarding laser therapy, RTC of Mathur et al. [14] brought out absolute and relative wound size reduction at 2 weeks compared to the baseline parameter where the intervention group had low-level laser therapy along with conventional therapy while control group only had conventional therapy. Another literature used Platelet-rich plasma (PRP) gel in the management of diabetic foot ulcer and Mohammadi, et al. [15] used a single-arm trial through weekly treatment after primary wound care and resulted primarily with significant decrease of the area of wound.

Comparable results between placebo groups and the recombinant human epidermal growth factor (rhGF) groups in the phase III multicenter, double-blind, randomized, placebo-controlled trial of Park et al [16] where routine wound care and topical or spray of saline with 0.005% rhEGF is used two times a day. This means a faster healing velocity. Pougatsch [17] made a pilot study using acceptable methods of cleansing combined with salt-based spray then gauze sponges soaked with the spray to dress the ulcer and then covered with dry foam or gauze and wrap with ACE to bring a wound closure. Volpe et al. [18] used three groups for a non-blinded, consecutive series, randomized clinical trial where Group A is managed with standard wound care while Group B is managed with topical application of CBPG consisted of platelet gel application 2 times a week in 4 weeks and then once a week for an additional 4 weeks. The primary outcome resulted to ulcer area reduction. There is a faster healing time in the cluster-randomized controlled non-inferiority trial of Smith-Strøm et al. [19] using TM follow-up care in the community while control group received SOC. Zelen et al. [20, 21] made 2 studies. First is a retrospective crossover study where Indolent DFUs are given acellular matrices and 12 out of 20 were eligible for crossover treatment and a prospective, randomized, controlled, multi-centre clinical study using daily dressing change that is combined with collagen alginate while HR-ADM group received grafts for healing proportion of wounds. All these are suggestive of wound healing and limb improvement with regards to appearance and function.

Discussion

With the aim of the study to bring out evidence based practice on wound care and healing, systematic review was undertaken. The key words “Diabetes Mellitus,” “wound practices,” “wound healing,” and “systematic review” yielded articles focused on the comfort and efficiency of patients with the identified and utilized practices on wound care and healing. The researchers explored case reports, interventional studies, and review papers written in the English language. Extracted data includes name and country of the author, year the article is published, site of the study, method and design of the study, management team, and the results. The studies were reviewed by two reviewers and the third reviewer checked and identified inconsistencies based on the set criteria. Therefore, the search was carried out systematically well.

The studies were reviewed by two reviewers and the third reviewer checked and identified inconsistencies based on the set criteria. Therefore, the search was carried out systematically well. The setting of the studies selected for review is of diverse origin. Two studies came from Finland, Netherlands, Korea, and USA respectively while one study came from the countries; Italy, Norway, Iran, India, India, Brazil, Canada, Turkey, and Taiwan. These are published from 2017–2018. With the evolution of research in the medical arena today, evolution of treatment will come next. As diabetes is the medical condition, wound healing becomes a problem. Wound types among the selected literatures are of diabetic ulcer. The study consists of large sample with a mean of 105 cases (SD: 77). This suggests validity and reliability. There are 5 studies of randomized control trials while other studies mixed their designs.

There are 3 prospective studies; first, a randomized, blinded, multicenter, and parallel study, the second is prospective, case-cohort study, and a Pilot study, and the third is prospective, randomized, controlled, multi-center clinical study. One of the selected study utilized 7 randomized controlled trials and 1 nonrandomized controlled trial. Other methods and designs used: single-arm clinical trial; phase III multicenter, double-blind, randomized, placebo-controlled trial; DAMO2CLES multicenter randomized clinical trial; cluster-randomized controlled non-inferiority trial; and non-blinded, consecutive series, randomized clinical trial. The dates of publication considered for inclusion are from studies published from 2017–2018. This means that the current and newest practices on wound care and healing are collated for review and these were based from the past practices that gained the reputation of healing and care. Most of the studies are published in journals.

In the study, the compositions of the teams who carried out the intervention are mostly doctors and nurses. One study collaborated with experts, end users, and applicants while two of the studies did not pinpoint the composition of the team while another two studies included surgeons. Regarding identified management, there is an intervention group and the control group where the former use additional treatment regime after the standard wound assessment and care while the later receives the conventional or traditional standard care and assessment alone.

In the study, the compositions of the teams who carried out the intervention are mostly doctors and nurses. One study collaborated with experts, end users, and applicants while two of the studies did not pinpoint the composition of the team while another two studies included surgeons. Regarding identified management, there is an intervention group and the control group where the former use additional treatment regime after the standard wound assessment and care while the later receives the conventional or traditional standard care and assessment alone.

The said intervention group received HBOT, TCOT device, natural latex associated with the LED circuit, low-level laser therapy, PRP treatment, salt-based spray, Telemedicine follow up, cord platelet gel application, Human Reticular Acellular Dermal Matrix, and acellular reticular allogenic human dermis simultaneously. This brought relative results to wound healing. It also heightened healthcare practice to a more evolved and acceptable treatment level of comfort and healing. Also, the identified regimen is of faster time treatment with the usual unit, weeks. Although the identified practices are of varieties, these are of the same results. It brought comfort and it brought healing faster than the traditional care and assessment alone. The data suggests the same dilemma of patients in different places with regards to wound/ulcer healing. One researcher is as engaged as the other to promote skin integrity and wound healing. And since the studies are of recent evidences and breakthroughs, wound healing is empowered to bring patients with diabetes better physicality and grip of hope against diabetic ulcer. Therefore, as per data suggests there is relative reduction of wound size.

Implications for Nursing and Health Policy

Understanding innovative wound care is the chance for nursing professionals to associate evidence, expert opinion and patients’ preference for a best and effective practices of wound care and healing and thus eventually give them a step above their skills. The evolution of nurses’ role in wound care contributed to bridge the need for specialist wound care guidance and globally, this role evolved to bring varieties of labels [22]. With the continuum of evidence-based studies empowered with technologies and other breakthroughs, nurses can improve their skills and hasten their knowledge for effective diabetic wound care. The influence of evidence-based practice and technology resonated through nursing practice, learning, and teachings patients’ self-care.

 Duttob, Chiarella & Curtis [22] discussed that there are claims directing to nurses contributory services resulting to improvement of patient care although it was hard to produce data concerning their impact on wound care but some researches direct to that bearing. Being part of the multidisciplinary team, nurses gain better skills and efficacy. Wounds International [23] in the article entitled, “International Best Practice Guidelines: Wound Management in Diabetic Foot Ulcers appraised the recommendations of the International Diabetes Foundation concerning the expert foot care group in including physicians having distinct attention in diabetes, individuals with informative skills, and individuals having recognized preparation in foot care. Comprehensively, this will be augmented by other specialists in the medical arena and soon, there will be improvement in the nursing practice along with the policies that strengthen it.

Acknowledgment

Engaging inspiration from those who helped in this review and the great minds in the medical research that never stop to give light on better management…

References

  1. Armstrong D, Meyr A (2018) Up To Date. [online] Uptodate.com. Available at: https: //www.uptodate.com/contents/basic-principles-of-wound-healing [Accessed 23 Nov. 2018].
  2. Moncrieff G, Van Onselen J, and Young T (2015) The role of emollients in maintaining skin integrity. Wounds UK 11: 68–74.
  3. World Health Organization (2018) Diabetes. [online] Available at: http: //www.who.int/news-room/fact-sheets/detail/diabetes [Accessed 23 Nov. 2018].
  4. World Union of Wound Healing Societies, Florence Congress, Position Document. Management of Biofilm. Wounds International 2016.
  5. Villines Z (2018) Diabetes and wound healing: What to know [Internet]. Medical News Today. MediLexicon International; 2018 [cited 2018Nov17]. Available from: https: //www.medicalnewstoday.com/articles/320739.php
  6. Chang JW, Heo W, Choi MSS, Lee JH (2018) The appropriate management algorithm for diabetic foot: A single-center retrospective study over 12 years. Medicine (Baltimore) 97: 11454. [crossref]
  7. Chen CY (2017) Adjunctive Hyperbaric Oxygen Therapy for Healing of Chronic Diabetic Foot Ulcers: A Randomized Controlled Trial. J Wound Ostomy Continence Nurs 44: 536–554.
  8. Health Quality Ontario (2017) Hyperbaric oxygen therapy for the treatment of diabetic foot ulcers: a health technology assessment. Ont Health Technol Assess Ser 17: 1–142.
  9. Crews RT, Candela J (2018) Decreasing an Offloading Device’s Size and Offsetting Its Imposed Limb-Length Discrepancy Lead to Improved Comfort and Gait. Diabetes Care 41: 1400–1405. [crossref]
  10. Santema K (2018) Hyperbaric oxygen therapy in the treatment of ischemic lower-extremity ulcers in patients with diabetes: results of the DAMO2CLES Multicenter Randomized Clinical Trial. Diabetes Care 41: 112–119.
  11. Driver V (2017) A prospective, randomized, blinded, controlled trial comparing transdermal continuous oxygen delivery to moist wound therapy for the treatment of diabetic ulcers. Osteotomy Wound Management 63: 12–28.
  12. Eraydin S, Avsar G (2018) The effect of foot exercises on wound healing in type 2 diabetic patients with a foot ulcer: A randomized control study. J Wound Ostomy Continence Nurs 45: 123–130.
  13. Lopez-Delis A (2018) Characterization of the cicatrization process in diabetic foot ulcers based on the production of reactive oxygen species. J Diabetes Res 2018: 4641364.
  14. Mathur RK, Sahu K, Saraf S, Patheja P, Khan F, et al. (2017) Low-level laser therapy as an adjunct to conventional therapy in the treatment of diabetic foot ulcers. Lasers Med Sci 32: 275–282. [crossref]
  15. Mohammadi MH (2017) Evaluation of wound healing in diabetic foot ulcer using platelet-rich plasma gel: A single-arm clinical trial. Transfus Apher 56: 160–164.
  16. Park, KH (2018) Topical epidermal growth factor spray for the treatment of chronic diabetic foot ulcers: A phase III multicenter, double-blind, randomized, placebo-controlled trial. Diabetes Res Clin Prac 142: 335–344.
  17. Pougatsch DA, Rader A, Rogers LC (2017) The Use of a Sea Salt-based Spray for Diabetic Foot Ulcers: A Novel Concept. Wounds 29: E5–5E9. [crossref]
  18. Volpe P, Marcuccio D, Stilo G, Alberti A, Foti G, et al. (2017) Efficacy of cord blood platelet gel application for enhancing diabetic foot ulcer healing after lower limb revascularization. Semin Vasc Surg 30: 106–112. [crossref]
  19. Smith-Strøm H (2018) The effect of telemedicine follow-up care on diabetes-related foot ulcers: a cluster-randomized controlled noninferiority trial. Diabetes Care 41: 96–103.
  20. Zelen C (2017) Human Reticular Acellular Dermal Matrix in the Healing of Chronic Diabetic Foot Ulcerations that Failed Standard Conservative Treatment: A Retrospective Crossover Study. Wounds 29: 39–45.
  21. Zelen CM (2017) A prospective, randomised, controlled, multicentre clinical trial examining healing rates, safety and cost to closure of an acellular reticular allogenic human dermis versus standard of care in the treatment of chronic diabetic foot ulcers. Int Wound J 14: 307–315.
  22. Dutton M, Chiarella M, Curtis K (2014) The role of the wound care nurse: an integrative review. Br J Community Nurs Suppl 39–40, S42–47. [crossref]
  23. International Best Practice Guidelines: Wound Management in Diabetic Foot Ulcers. Wounds International, 2013. Available from: www.woundsinternational.com