Archives

fig 5

Flexible Electrochromic Devices based on Linear Monosubstituted Viologen Derivatives

DOI: 10.31038/NAMS.2022523

Abstract

Three monosubstituted viologen derivatives: 1-(4-indolylphenyl)-4,4′-bi-pyridine hexafluorophosphate (IV), 1-(4-phenothiazinylphenyl)-4,4′-bipyridine hexa-fluorophosphate (PV) and 1-(4-benzimidazolylphenyl)-4,4′-bipyridine hexafluoro-phosphate 1(BV), were synthesized. The electrochemical and electrochromic properties of these monosubstituted viologen derivatives were investigated. The flexible and rigid electrochromic devices (ECD) were prepared by using the synthesized viologen derivatives as active materials. The structure of the device is ITO-PET (or ITO-glass)/ electrochromic gel film/ITO-PET (or ITO-glass). The flexible and rigid ECDs exhibited reversible color changes under applied voltage. Upon applied voltage from 0.0 V to -1.4 V, IV-based flexible ECD exhibited optical contrast 33.5% at 564 nm, PV-based flexible ECD exhibited optical contrast 37.4% at 564 nm and BV-based flexible ECD exhibited optical contrast 45.8% at 466 nm.

Keywords

Monosubstituted viologen derivatives, Electrochromic, Electrochromic device, Flexible device, Optical contrast

Introduction

Electrochromism refers to the phenomenon that materials can exhibit reversible electrochemical oxidation or reduction and change their color reversibly under the application of appropriate voltage [1-3]. After years of development, the technology of electrochromism has been applied in some fields such as information display device [4], smart window [5] and anti-glare rearview mirror [6]. In general, electrochromic materials can be divided into inorganic and organic electrochromic materials. Inorganic electrochromic materials include transition metal oxides such as WO3 [7], NiO [8,9], MoO3 [10,11] and Prussian blue [12]. Organic electrochromic materials include small molecule optoelectronics materials [13], oligomer [14-16] and conjugated polymers [17-19]. As a typical of organic electrochromic materials, 1,1′-disubstituted-4,4′-bipyridinium salts (viologen) are widely reported due to their good electrochromic properties [20-25]. However, a large number of reports on viologen mainly focus on disubstituted viologen derivatives [26-29], and there are few reports on monosubstituted viologen derivatives [30,31].

In this paper, three monosubstituted monosubstituted viologen derivatives (Figure 1): 1-(4-indolylphenyl)-4,4′-bipyridine hexafluorophosphate (IV), 1-(4-phenothiazin-ylphenyl)-4,4′-bipyridine hexafluorophosphate (PV) and 1-(4-benzimidazolylphenyl)-4,4′-bipyridine hexafluorophosphate (BV), were synthesized. The electrochromic properties of these monosubstituted viologen derivatives were investigated.

fig 1

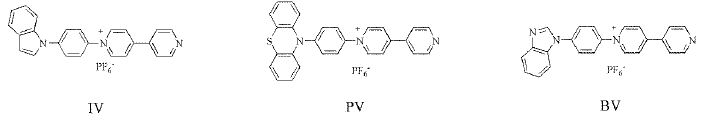
Figure 1: The molecular structural of three monosubstituted viologen derivatives

Materials and Methods

Materials

All the solvents were purified and dried using standard methods. Indole, phenothiazine, benzimidazole, 1-fluoro-4-nitrobenzene, 4,4’-bipyridine, 2,4-dinitrochlorobenzene, ammonium hexafluorophosphate (NH4PF6), 10% palladium on carbon (Pd/C), hydrazine hydrate and polymethylmethacrylate (PMMA) were purchased from Beijing HWRK Chem Co., Ltd. Ferrocene, tetrahydrofuran (THF), potassium carbonate (K2CO3) and N,N’-dimethylformamide (DMF) were purchased from Shanghai RichJoint Chemical Reagents Co., Ltd. Petroleum ether, ethanol, ethyl acetate, dichloromethane (DCM) and dimethyl sulfoxide (DMSO) were purchased from Shanghai Titan Scientific Co., Ltd. Methanol, propylene Carbonate (PC) and anhydrous tetra-n-butylammonium perchlorate (TBAP) were purchased from Sinopharm Chemical Reagent Co., Ltd. Indium tin oxide (ITO) glasses (10 Ω/sq) and ITO polyethylene terephthalate (PET, 30-35 Ω/sq) were purchased from Zhuhai Kaivo Optoelectronic Technology Co., Ltd.

Instrumentation

Nuclear magnetic resonance (NMR) spectra were recorded on a Bruker AVANCE-600 NMR spectrometer. Mass spectra were carried out on Bruker Agilent 1290 mass spectrometer. UV-vis spectra of compounds were measured on a Thermo Helios-γ spectrometer. Electrochemical properties of compounds were measured on CHI750A electrochemical workstation. A saturated calomel electrode (SCE), platinum wire, and ITO-glass were used as the reference electrode (RE), counter electrode (CE), and working electrode (WE), respectively. Electrochemical impedance spectroscopy (EIS) of ECDs was measured at a frequency in the range of 0.01 Hz–100 kHz on CHI750A electrochemical workstation to calculate the ionic conductivity of the prepared ion gels. Electrochromic properties of ECDs were measured on CHI750A electrochemical workstation and UV-vis spectrometer integrated with an electrochromic cyclic tester (Zhuhai Kaivo Optoelectronic Technology Co., Ltd.).

Synthesis

The synthetic routes to IV, PV and BV are shown in Scheme 1.

scheme 1

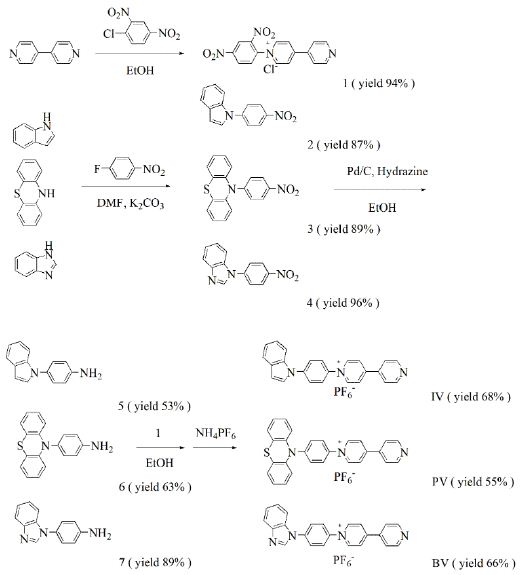
Scheme 1: Synthetic routes for the viologen derivatives

Compound 1

4,4’-Bipyridine (3.6 g, 23.0 mmol), 2,4-dinitrochlorobenzene (2.3 g, 11.7 mmol) and ethanol (60 mL) were added to a three-necked flask. The mixture was stirred at 80℃ in N2 atmosphere for 48 h. After the reaction, solution was cooled to room temperature, evaporated to give a crude product and washed with DCM (100 mL) to obtain grey solid (3.96 g, yield 94%). 1H NMR (D2O, 600 MHz, ppm) δ 9.41 (d, 1H), 9.27 (d, 2H), 8.96 (d, 1H), 8.84 (s, 2H), 8.70 (s, 2H), 8.31 (s, 1H), 8.04 (s, 2H).

Compound 2

Indole (1.1 g, 9.4 mmol), 1-fluoro-4-nitrobenzene (1.4 g, 9.9 mmol), K2CO3 (1.3 g, 9.4 mmol) and DMF (20 ml) were added to a three-necked flask. The mixture was stirred at 110°C for 24 h under a N2 atmosphere. After the reaction, solution was cooled to room temperature, cold water was added, precipitated and filtered to obtain crude product. The crude product was purified by silica gel column chromatography using ethyl acetate/petroleum ether (1:10, v/v) to obtain a yellow powder (1.96 g, yield 87%). 1H NMR (DMSO-d6, 600 MHz, ppm): δ 8.41 (d, 2H), 7.92 (d,2H), 7.83 (d,1H), 7.76 (d,1H), 7.70 (d, 1H), 7.29 (t, 1H), 7.21 (t, 1H), 6.83 (d, 1H).

Compound 3

Phenothiazine (2.0 g, 10.0 mmol), 1-fluoro-4-nitrobenzene (1.5 g, 10.6 mmol), K2CO3 (1.4 g, 10.1 mmol) and DMF (35 ml) were added to a three-necked flask. The mixture was stirred at 110°C for 24 h under a N2 atmosphere. After the reaction, solution was cooled to room temperature, cold water was added, precipitated and filtered to obtain crude product. The crude product was purified by silica gel column chromatography using DCM/petroleum ether (1:10, v/v) to obtain a yellow powder (2.85 g, yield 89%). 1H NMR (DMSO-d6, 600 MHz, ppm): δ 8.12 (d, 2H), 7.64 (d, 2H), 7.58 (d, 2H), 7.49 (t, 2H), 7.36 (t, 2H), 7.05 (d, 2H).

Compound 4

Benzimidazole (2.5 g, 21.1 mmol), 1-fluoro-4-nitrobenzene (3.3 g, 23.7 mmol), K2CO3 (3.3 g, 23.8 mmol) and DMF (60 mL) were added to a three-necked flask. The mixture was stirred at 110°C for 24 h under a N2 atmosphere. After the reaction, solution was cooled to room temperature, cold water was added, precipitated and filtered to obtain crude product. The crude product was purified by silica gel column chromatography using ethyl acetate/petroleum ether (1:2, v/v) to obtain a yellow powder (4.91 g, yield 96%). 1H NMR (DMSO-d6, 600 MHz, ppm) δ 8.75 (s, 1H), 8.47 (d, 2H), 8.04 (d, 2H), 7.80 (dd, 2H), 7.39 (dt, 2H).

Compound 5

2 (1.0 g, 4.2 mmol), 10% Pd/C (0.15 g), hydrazine hydrate (3.5 mL) and ethanol (65 ml) were added to a three-necked flask. The mixture was stirred at 80℃ in N2 atmosphere for 15 h. After the reaction, solution was filtered while hot, and the filtrate was evaporated to give a crude product. The crude product was purified by silica gel column chromatography using acetate/petroleum ether (1:4, v/v) to obtain a brown oily liquid (0.46 g, yield 53%). 1H NMR (DMSO-d6, 600 MHz, ppm): δ 7.61 (d, 1H), 7.44 (d, 1H), 7.37 (d, 1H), 7.17 (d, 2H), 7.15-7.11 (m, 1H), 7.09 – 7.04 (m, 1H), 6.72 (d, 2H), 6.59 (d, 1H), 5.30 (s, 2H).

Compound 6

3 (1.5 g, 4.7 mmol), 10% Pd/C (0.16 g), hydrazine hydrate (4 ml) and ethanol (40 ml) were added to a three-necked flask. The mixture was stirred at 80℃ in N2 atmosphere for 15 h. After the reaction, solution was filtered while hot, and the filtrate was evaporated to give a crude product. The crude product was purified by silica gel column chromatography using acetate/petroleum ether (1:10, v/v) to obtain a white solid (0.86 g, yield 63%). 1H NMR (DMSO-d6, 600 MHz, ppm): δ 7.00 (t,4H), 6.92 – 6.87 (m, 2H), 6.79 (t,4H), 6.21 (d, 2H), 5.43 (s, 2H).

Compound 7

4 (3.0 g, 12.7 mmol), 10% Pd/C (0.31 g), hydrazine hydrate (10 mL) and ethanol (60 ml) were added to a three-necked flask. The mixture was stirred at 80℃ in N2 atmosphere for 15 h. After the reaction, solution was filtered while hot, and the filtrate was evaporated to give a crude product. The crude product was purified by silica gel column chromatography using acetate/petroleum ether (1:1, v/v) to obtain a red oily liquid (2.37 g, yield 89%). 1H NMR (DMSO-d6, 600 MHz, ppm) δ 8.35 (s, 1H), 7.75 (dd, 1H), 7.46 (dd, 1H), 7.31-7.24 (m, 4H), 6.79-6.74 (m, 2H), 5.45 (s, 2H).

1-(4-Indolylphenyl)-4,4′-Bipyridine Hexafluorophosphate (IV)

1 (0.4 g, 1.1 mmol), 5 (0.3 g, 1.4 mmol) and ethanol (40 mL) were added to a three-necked flask. The mixture was stirred at 80℃ in N2 atmosphere for 48 h. After the reaction, solution was cooled to room temperature, evaporated to give a crude product and washed with DCM (100 mL) to give orange solid. The crude product was dissolved in water/methanol (1:1, v/v) to obtain saturated solution. NH4PF6 (1.7 g) was added to the solution. The mixture was stirred at room temperature for 0.5h, and then the mixture was filtered to obtain yellow solid (0.38 g, yield 68%). 1H NMR (DMSO-d6, 600 MHz, ppm) δ 9.63 (d, 2H), 8.93 (d, 2H), 8.87 (d, 2H), 8.20 (dd, 4H), 8.04 (d, 2H), 7.83 (d, 1H), 7.72 (d, 2H), 7.30 (t, 1H), 7.21 (t, 1H), 6.83 (d, 1H). 13C NMR (DMSO-d6, 151 MHz, ppm) δ 153.6, 151.6, 145.9, 141.8, 141.1, 140.1, 135.3, 130.1, 128.9, 127.0, 125.8, 124.9, 123.4, 122.6, 121.7, 121.4, 110.9, 105.4. HRMS (ESI) C24H18N3+ found [M]+: 348.1509, calcd. 348.1495.

1-(4-Phenothiazinylphenyl)-4,4′-Bipyridine Hexafluorophosphate (PV)

1 (0.2 g, 0.5 mmol), 6 (0.2, 0.7 mmol) and ethanol (50 mL) were added to a three-necked flask. The mixture was stirred at 80℃ in N2 atmosphere for 48 h. After the reaction, solution was cooled to room temperature, evaporated to give a crude product and washed with DCM (100 mL) to give orange solid. The crude product was dissolved in water/methanol (1:1, v/v) to obtain saturated solution. NH4PF6 (0.8 g) was added to the solution. The mixture was stirred at room temperature for 0.5 h, and then the mixture was filtered to obtain yellow solid (0.12 g, yield 55%). 1H NMR (DMSO-d6, 600 MHz, ppm) δ 9.57 (d, 2H), 8.92 (d, 2H), 8.85 (d, 2H), 8.20 (d, 2H), 8.04 (d, 2H), 7.53 (d, 2H), 7.38 (d, 2H), 7.25 (t, 2H), 7.14 (t, 2H), 6.90 (d, 2H). 13C NMR (DMSO-d6, 151 MHz, ppm) δ 153.3, 151.5, 145.8, 145.7, 142.5, 141.1, 139.2, 128.4, 128.1, 127.4, 126.6, 125.8, 125.4, 124.9, 122.6, 122.0. HRMS (ESI) C28H20N3S+ found [M]+: 430.1388, calcd. 430.1372.

1-(4-Benzimidazolylphenyl)-4,4′-Bipyridine Hexafluorophosphate (BV)

1 (0.9 g, 2.5 mmol), 7 (0.9 g, 4.3 mmol) and ethanol (40 mL) were added to a three-necked flask. The mixture was stirred at 80℃ in N2 atmosphere for 48 h. After the reaction, solution was cooled to room temperature, evaporated to give a crude product and washed with DCM (100 mL) to give yellow solid. The crude product was dissolved in water/methanol (1:1, v/v) to obtain saturated solution. NH4PF6 (4.0 g) was added to the solution. The mixture was stirred at room temperature for 0.5 h, and then the mixture was filtered to obtain yellow solid (0.58 g, yield 66%). 1H NMR (DMSO-d6, 600 MHz, ppm) δ 9.62 (d, 2H), 8.93 (d, 2H), 8.87 (d, 2H), 8.76 (s, 1H), 8.23 (d, 2H), 8.20 (d, 2H), 8.16 (d, 2H), 7.80 (dd, 2H), 7.41 (dt, 2H). 13C NMR (DMSO-d6, 151 MHz, ppm) δ 153.81 (s), 151.61 (s), 146.05 (s), 144.44 (s), 143.82 (s), 141.34 (s), 141.04 (s), 138.75 (s), 133.13 (s), 127.27 (s), 125.76 (s), 125.13 (s), 124.46 (s), 123.49 (s), 122.57 (s), 120.69 (s), 111.23 (s). HRMS (ESI): [C23H17N4+]+: 349.1452, calcd. For 349.1448.

The Fabrication of Electrochromic Devices

Two ITO-PET (2 cm × 5 cm, or ITO-glass: 2 cm × 3 cm) were used as the working electrode and the counter electrode, respectively. Electrochromic gel (TBAP: PMMA: PC=3:7:90, w/w) contain 0.01 M monosubstituted viologen derivatives and 0.01 M ferrocene was injected into the sealing device. The thickness of the electrochromic gel film is 1 mm. The structure of the device was ITO-PET (or ITO-glass)/electrochromic gel film/ITO-PET (or ITO-glass). EIS of rigid ECDs based on IV, PV and BV are shown in Figure S17(a)-(c). Figure S17(d) is the corresponding analog equivalent circuit. Rs is resistance of the gel electrolyte. Rct is charge transfer resistance. CPE is double-layer capacitance. Zw is Warburg impedance. According to formula (1), ionic conductivity (σ) of IV, PV and BV-based gel were 1.21×10⁻⁵ S/cm, 1.59×10⁻⁵ S/cm and 1.88×10⁻⁵ S/cm, respectively. S is area of gel film (Scheme 2).

σ=d/(Rs×S)                            (1)

scheme 2

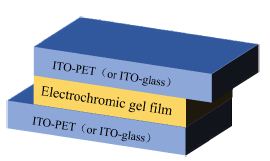
Scheme 2: Structure diagram of electrochromic device

Results and Discussion

Optoelectrochemical Properties of Monosubstituted Viologen Derivatives

Cyclic voltammograms (CVs) of IV, PV and BV were recorded at a scan rate of 50 mV/s in PC solution containing 0.1 M TBAP. As is shown in Figure S18, the initial reduction potentials (Eredonset) of IV, PV and BV were -0.64 V, -0.19 V and -0.24 V, respectively. UV-Vis absorption spectra of IV, PV and BV in PC solution are shown in Figure S19. The absorption peaks(λmax)of IV, PV and BV were located at 361, 394/424 and 333/421 nm, respectively. The band edge wavelength (λedge) of IV, PV and BV were 496, 564 and 434 nm respectively. According to formula (2), (3) and (4), optical band gap (Egopt), HOMO energy levels (EHOMO) and LUMO energy levels (ELUMO) of monosubstituted viologen derivatives were calculated. Table S1 shows the optoelectrochemical properties of IV, PV and BV.

Egopt = 1240/λedge                           (2)

ELUMO=-e(Eredonset+4.4)                    (3)

EHOMO=ELUMO-Egopt                           (4)

Electrochromic Properties of ECDs based on Monosubstituted Viologen Derivatives

Figure 2 shows CVs of flexible ECDs based on the monosubstituted viologen derivatives at a scan rate of 50 mV/s. All CVs of flexible ECDs exhibited one pair of redox peaks during the redox process which corresponded to the redox processes of monosubstituted viologen derivatives. The reduction peaks of flexible ECDs based on IV, PV and BV were -1.61, -1.64 and -1.52 V, respectively, which correspond to the reduction of cations to neutral state of monosubstituted viologen derivatives. Rigid ECDs based on monosubstituted viologen derivatives were fabricated by using ITO-glass instead of ITO-PET. As is shown in Figure S20, flexible and rigid ECDs based on monosubstituted viologen derivatives exhibited the same redox behavior.

fig 2

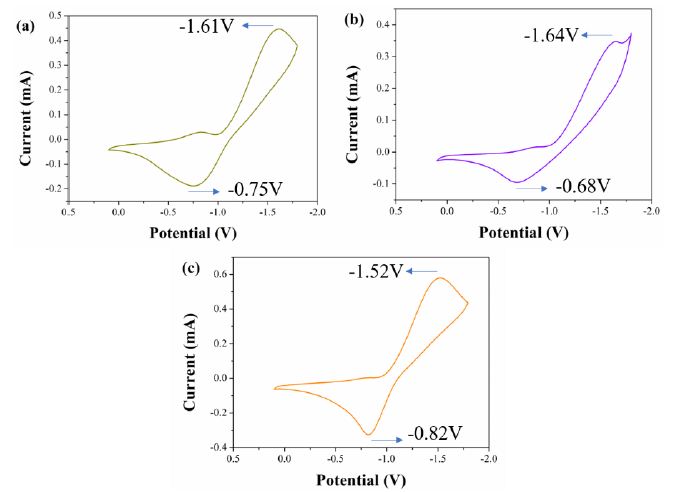
Figure 2: CVs of (a) IV-based flexible ECD, (b) PV-based flexible ECD and (c) BV-based flexible ECD at a scan rate of 50 mV/s

The spectroelectrochemistry of flexible ECDs based on viologen derivatives under different applied voltages and the color change of flexible ECDs are shown in Figure 3. With the increase of applied voltage, the transmittance of flexible ECDs based on synthesized viologen derivatives in the visible region decreased. For flexible ECD based on IV, it was yellow under no voltage applied. When the applied voltage was -1.4 V, it exhibited a color change from yellow to orange. For flexible ECD based on PV, it was yellow under no voltage applied. When the applied voltage was -1.4 V, it exhibited a color change from yellow to orange red. For flexible ECD based on BV, it was light yellow under no voltage applied. When the applied voltage was -1.4 V, it exhibited a color change from light yellow to light brown. The spectroelectrochemistry of flexible ECDs based on monosubstituted viologen derivatives showed that three kinds of flexible ECDs had reversible color change, which indicated the introduction of groups of indole, phenothiazine and benzimidazole can effectively adjust the electrochromic properties of viologen derivatives. In addition, under the bending state, the flexible ECDs still exhibited reversible color change under the applied voltage.

fig 3

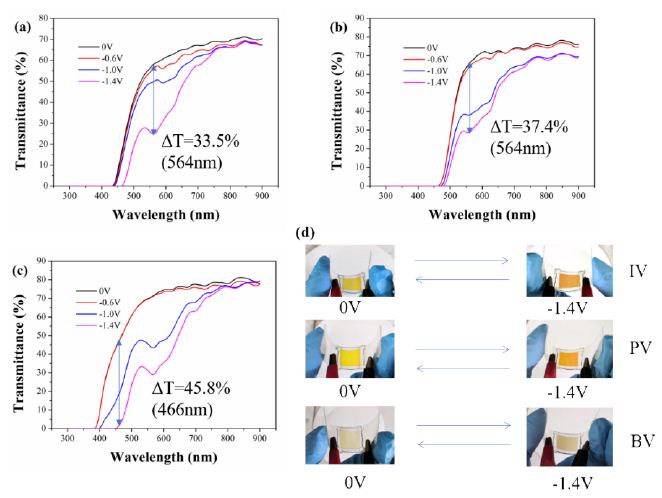
Figure 3: Spectroelectrochemistry of (a) IV-based flexible ECD, (b) PV-based flexible ECD and (c) BV-based flexible ECD under different applied voltages and the image of corresponding devices

The optical contrast is defined as difference of transmittance under different applied voltage at the same wavelength. According to Figure 3, the optical contrast of the flexible ECDs based on IV, PV and BV reached 33.5% (564 nm), 37.4% (564 nm) and 45.8% (466 nm) , respectively. As is shown in Figure S21, the electrochromism of rigid ECDs was consistent with that of flexible ECDs. The optical contrast of the rigid ECDs based on IV, PV and BV reached 42.4% (582 nm), 44.1% (584 nm) and 44.0% (568 nm), respectively.

Switching time is defined as time required for the current to change by 95% under the applied voltage. Switching time includes response time from bleached state to colored state (coloring time) and response time from colored state to bleached state (bleaching time), which was measured using double-step chronoamperometry. The current-time curves of flexible ECDs based on IV, PV and BV are shown in Figure 4. For flexible ECD based on IV, the coloring and bleaching times were 46.0 s and 4.9 s, respectively. For flexible ECD based on PV, the coloring and bleaching times were 84.2 s and 9.9 s, respectively. For flexible ECD based on BV, the coloring and bleaching times were 52.9 s and 7.5 s, respectively. The current-time curves of rigid ECDs based on IV, PV and BV are shown in Figure S22. The results showed that the coloring times of flexible ECDs were longer than those of rigid ECDs. The reason may be that ITO-PET has higher surface resistance than that of ITO-glass, which makes it difficult for cations to get electrons at the cathode.

fig 4

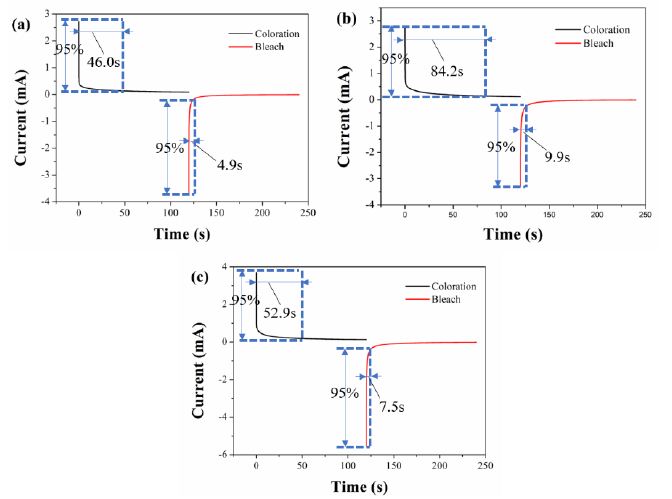
Figure 4: Current-time curves of (a) IV-based flexible ECD, (b) PV-based flexible ECD and (c) BV-based flexible ECD (switched upon voltages between 0.0 V and -1.4 V with a switching interval of 120 s)

The stability of flexible ECDs based on 2IV, 2PV and 2BV were also measured using chronoamperometry. As is shown in Figure 5, the flexible ECD based on IV, PV and BV remained 51.1%, 97.6% and 72.7% of the original electric charge after 1000 cycles, respectively. The stability of rigid ECDs based on 2IV, 2PV and 2BV was shown in Figure S23. All the ECDs exhibited suitable cyclic stability.

fig 5

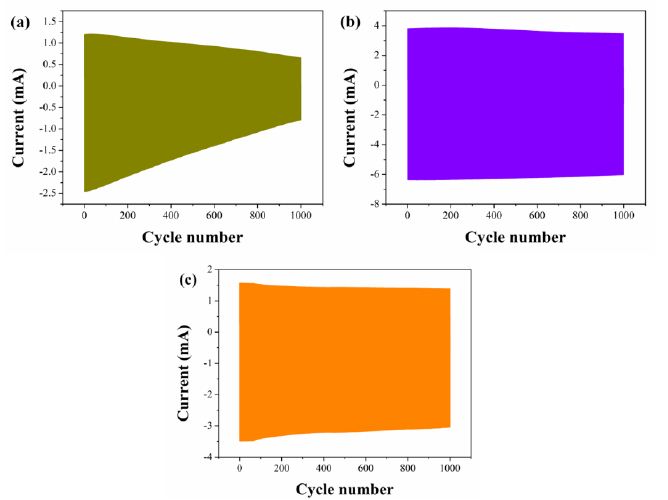
Figure 5: Properties in write-erase ability of (a) IV-based flexible ECD, (b) PV-based flexible ECD and (c) BV-based flexible ECD

The coloration efficiency (η) refers to the ratio of the change of optical density to charge at a specific wavelength which is used to measure the charge utilization of the device. According to Formula (5), coloration efficiency of ECDs based on IV, PV and BV was calculated. Flexible ECDs based on IV, PV and BV have coloration efficiency of 129.67 cm2/C (564 nm), 87.78 cm2/C (564 nm) and 107.22 cm2/C (466 nm), respectively. Rigid ECDs based on IV, PV and BV have coloration efficiency of 197.84 cm2/C (582 nm), 198.70 cm2/C (584 nm) and 201.50 cm2/C (568 nm), respectively. Electrochromic properties of ECDs based on 2IV, 2PV and 2BV are presented in Table S2.

η = ΔOD/Q; ΔOD = log (Tb/Tc)                         (5)

ΔOD is the change in optical density; Q is the amount of charge injected (or extracted) per unit area (C/cm2); Tc is the transmittance (%) of the colored state; Tb is the transmittance (%) of the bleached state.

Conclusion

In summary, three monosubstituted viologen derivatives IV, PV and BV were synthesized and corresponding flexible and rigid electrochromic devices were fabricated. All flexible and rigid ECDs exhibited reversible color changes upon applied voltage. In addition, flexible ECDs still exhibited reversible color change under bending state. IV-based flexible ECD exhibited reversible color changes from yellow to orange upon applied voltage from 0.0 V to -1.4 V, and it exhibited optical contrast 33.5% at 564 nm. PV-based flexible ECD exhibited reversible color changes from yellow to orange red upon applied voltage from 0.0 V to -1.4 V, and it exhibited optical contrast 37.4% at 564 nm. BV-based flexible ECD exhibited reversible color changes from light yellow to light brown upon applied voltage from 0.0 V to -1.4 V, and it exhibited optical contrast 45.8% at 466 nm. All ECDs exhibited suitable switching time and suitable coloration efficiency.

Author Contributions

Weijie Ye: Methodology, Formal analysis, Investigation, Writing-original draft, Conceptualization, Software, Data curation. Xu Guo: Visualization. Peng Wang and Chao Qian: Validation. Ping Liu: Resources, Writing-review and editing, Supervision, Project administration, Funding acquisition.

Funding

This research was financially supported by the NSFC (Grant no. 20674022, 20774031, and 21074039), the Natural Science Foundation of Guangdong (Grant no. 2014A030313241, 2014B090901068, 2016A010103003, and 2021A1515010929), and the Ministry of Education of the People’s Republic of China (Grant no. 20090172110011).

Data Availability Statement

The authors confirm that the data supporting the findings of this study are available within the article.

Conflicts of Interest

There are no conflicts to declare.

References

  1. Liu W, Zhang X, Liu J, Ma X, Zeng J, et al. (2017) Electrochromic properties of organic-inorganic composite materials. Journal of Alloys and Compounds 718: 379-385.
  2. Li M, Wei Y, Zheng J, Zhu D, Xu C (2014)Highly contrasted and stable electrochromic device based on well-matched viologen and triphenylamine. Organic Electronics 15: 428-434.
  3. Wang Z, Wang X, Cong S, Geng F, Zhao Z (2020) Fusing electrochromic technology with other advanced technologies: A new roadmap for future development. Materials Science and Engineering: R: Reports 140.
  4. Zhang W, Wang X, Wang Y, Yang G, Gu C, et al. (2019) Bio-inspired ultra-high energy efficiency bistable electronic billboard and reader. Nature Communications.10: 1559.[crossref]
  5. Song R, Li G, Zhang Y, Rao B, Xiong S, He G (2021) Novel electrochromic materials based on chalcogenoviologens for smart windows, E-price tag and flexible display with improved reversibility and stability. Chemical Engineering Journal 422: 130057.
  6. Rosseinsky DR, Mortimer RJ (2001) Electrochromic Systems and the Prospects for Devices. Advanced Materials 13: 783-793.
  7. Chen J, Wang Z, Chen Z, Cong S, Zhao Z (2020) Fabry–Perot Cavity-Type Electrochromic Supercapacitors with Exceptionally Versatile Color Tunability. Nano Letters 20: 1915-1922.[crossref]
  8. Kim KH, Jeong SJ, Koo BR, Ahn HJ (2021) Surface amending effect of N-doped carbon-embedded NiO films for multirole electrochromic energy-storage devices. Applied Surface Science 537: 147902.
  9. Ma D, Shi G, Wang H, Zhang Q, Li Y (2013) Hierarchical NiO microflake films with high coloration efficiency, cyclic stability and low power consumption for applications in a complementary electrochromic device. Nanoscale 5: 4808-4815.[crossref]
  10. Novak TG, Kim J, Tiwari AP, Kim J, Lee S, et al. (2020) 2D MoO3 Nanosheets Synthesized by Exfoliation and Oxidation of MoS2 for High Contrast and Fast Response Time Electrochromic Devices. ACS Sustainable Chemistry & Engineering.8: 11276-11282.
  11. Santhosh S, Nanda Kumar AK, Kennedy J, Subramanian B (2020)Electrochromic response of pulsed laser deposited oxygen deficient monoclinic β-MoO3 thin films.Electrochimica Acta 354: 136745.
  12. Li X, Chu J, Cheng Y, Yang F, Xiong S (2020) Novel prussian blue@Carbon-dots hybrid thin film: The impact of carbon-dots on material structure and electrochromic performance. Electrochimica Acta 355: 136659.
  13. Zhang X, Zeng J, Xu Z, Zhu M, Liu P (2021) A fast-response electrochromic device based on a composite gel film comprising triphenylamine derivatives and WO3. New Journal of Chemistry 45: 5503-5508.
  14. Wan Z, Zeng J, Li H, Liu P, Deng W (2018) Multicolored, Low-Voltage-Driven, Flexible Organic Electrochromic Devices Based on Oligomers. Macromolecular Rapid Communications 39: 1700886.[crossref]
  15. Zeng J, Wan Z, Zhu M, Ai L, Liu P.et al. (2019) Flexible electrochromic energy-saving windows with fast switching and bistability based on a transparent solid-state electrolyte. Materials Chemistry Frontiers 3: 2514-2520.
  16. Zeng J, Zhang X, Zhu X, Liu P (2017) Synthesis and Electrochromic Properties of Star-Shaped Oligomers with Phenyl Cores. Chemistry – An Asian Journal 12: 2202-2206.[crossref]
  17. Zeng J, Li H, Wan Z, Ai L, Liu P, et al. (2019)Colorless-to-black electrochromic materials and solid-state devices with high optical contrast based on cross-linked Poly(4-vinyltriphenylamine) Solar Energy Materials and Solar Cells 195: 89-98.
  18. Zeng J, Wan Z, Li H, Liu P, Deng W (2018) Visible and near-infrared electrochromic properties of polymers based on triphenylamine derivatives with acceptor groups.Solar Energy Materials and Solar Cells 178: 223-233.
  19. Zeng J, Yang H, Zhong C, Rajan K, Sagar RUR, et al. (2021)Colorless-to-black electrochromic devices based on ambipolar electrochromic system consisting of cross-linked poly(4-vinyltriphenylamine) and tungsten trioxide with high optical contrast in visible and near-infrared regions. Chemical Engineering Journal 404: 126402.
  20. Zhu M, Zeng J, Li H, Zhang X, Liu P (2020) Multicolored and high contrast electrochromic devices based on viologen derivatives with various substituents. Synthetic Metals 270: 116579.
  21. Oh H, Seo DG, Yun TY, Kim CY, Moon HC (2017) Voltage-Tunable Multicolor, Sub-1.5 V, Flexible Electrochromic Devices Based on Ion Gels. ACS Applied Materials & Interfaces 9: 7658-7665.[crossref]
  22. Kim KW, Oh H, Bae JH, Kim H, Moon HC, et al. (2017) Electrostatic-Force-Assisted Dispensing Printing of Electrochromic Gels for Low-Voltage Displays. ACS Applied Materials & Interfaces 9: 18994-19000.
  23. Shah KW, Wang SX, Soo DX, Xu J (2019) Viologen-Based Electrochromic Materials: From Small Molecules, Polymers and Composites to Their Applications. Polymers[crossref]
  24. Xiao S, Zhang Y, Ma L, Zhao S, Wu N, et al. (2019) Easy-to-make sulfonatoalkyl viologen/sodium carboxymethylcellulose hydrogel-based electrochromic devices with high coloration efficiency, fast response and excellent cycling stability. Dyes and Pigments.
  25. Shi Y, Wang G, Chen Q, Zheng J, Xu C (2020) Electrochromism and electrochromic devices of new extended viologen derivatives with various substituent benzene. Solar Energy Materials and Solar Cells 208: 110413.
  26. Shi Y, Liu J, Li M, Zheng J, Xu C (2018) Novel electrochromic-fluorescent bi-functional devices based on aromatic viologen derivates. Electrochimica Acta 285: 415-423.
  27. Qian Y, Yang H, Wang Y (2020) A novel bis(terpyridine) with π−conjugated phenyl viologen and its met allo- supramolecular polymers: Synthesis and electrochromism. Dyes and Pigments 176: 108251.
  28. Sydam R, Ghosh A, Deepa M (2015) Enhanced electrochromic write–erase efficiency of a device with a novel viologen: 1,1′-bis(2-(1H-indol-3-yl)ethyl)-4,4′-bipyridinium Organic Electronics 17: 33-43.
  29. Yu HF, Chen KI, Yeh MH, Ho KC (2019)Effect of trifluoromethyl substituents in benzyl-based viologen on the electrochromic performance: Optical contrast and stability. Solar Energy Materials and Solar Cells 200: 110020.
  30. Zhu CR, Long JF, Tang Q, Gong CB, Fu XK (2018) Multi-colored electrochromic devices based on mixed mono- and bi-substituted 4,4′-bipyridine derivatives containing an ester group. Journal of Applied Electrochemistry 48: 1121-1129.
  31. Liu S, Huang ZJ, Li F, Zhang WJ, Zhu CR, et al. (2020) Star-shaped monosubstituted 2,6-diphenyl-4,4′-bipyridinium salts with good electrochromic switching stability. Synthetic Metals 262: 116330.
fig 1

Prevalence and Associated Factors of Bronchial Asthma among Adult Patients in Jigjiga University Sultan Sheikh Hassan Yabere Referral Hospital, Jigjiga, Somali region, Ethiopia 2020

DOI: 10.31038/PEP.2022311

Abstract

Background: The magnitude of asthma in developing countries increased in 50% per decade for the last 40 years and approximately 250,000 deaths occur in each year. It was the common conditions that affected 5-10% of the population during the past 20 years.

Objectives: The aim of this study was to assess the Prevalence and associated factors of bronchial asthma among adult patients in Jigjiga University Sultan Sheikh Hassan Yabere Referral Hospital, Jigjiga, Somali Region, Ethiopia 2020.

Methods: Hospital based cross sectional study design was conducted at Sultan Hassan yabare referral hospital during May-June 2020. Three hundred fifty two (352) patients who visited adult OPD over two months period were included in the study using simple random sampling. The data was checked for completeness, cleaned and then entered into Epi-data version 3.1 then exported to SPSS version 23 for analysis. Bivariate & multivariate binary logistic regression analysis was used to see the associations between bronchial asthma and factors. Adjusted odd ratios were measured at 95% confidence level and P-Value of less than 0.05 was considered significant.

Result: Prevalence of bronchial asthma among adult patients was 9.4%. Being an urban resident (AOR: 3.425:95% CI 1.036-11.319), having family history of asthma (AOR: 5.796: 95% CI 2.31-, 14.540), and presence of vermin in the house (AOR: 2.999: 95% CI 1.106-8.129) were significantly associated with bronchial asthma. The authors concluded that the prevalence of bronchial asthma among adult patients was high. Therefore, educational program about the risk factors and preventive measures of asthma are highly recommended.

Keywords

Adult patient, Bronchial asthma, Shiekh Hassan Yabere Referral Hospital, Jigjiga, Ethiopia

Introduction

Asthma is defined as a “chronic inflammatory disease of the airways” that can cause any or all of the following symptoms: -shortness of breath, tightness in the chest, coughing and wheezing [1]. The chronic inflammation is associated with airway hyper responsiveness that leads to recurrent episodes of wheezing, breathlessness, chest tightness and coughing, particularly at night or in the early morning. These episodes are usually associated with widespread, but variable airflow obstruction within the lung that is often reversible either spontaneously or with treatment [2].

Asthma imposes a large burden on the individual and on health care systems. Currently, asthma prevalence is approximately 10%-13%globaly. Unexplained temporal and geographic variations in asthma prevalence have been reported with asthma prevalence increasing over the past few decades [3].

In Africa, problems including those arising from the over-utilization of health services, lack of trained staff and diagnostic apparatus, and non-availability and unaffordability of inhaled medications have hindered efforts to improve the management of asthma. The lack of organized health promotion programs, such as effective control strategies for environmental triggers, air pollutants, and occupational dusts have also contributed to the growing burden [4].

WHO has reported that the levels of asthma control and health responses in the continent have been below recommended standards, and that have contributed to the size of the disease burden [4]. In addition, though many African countries have national guidelines for the management of asthma and other CRDs, these guidelines has not been implemented in most rural areas . Economic analyses in many African settings have shown that direct costs from asthma are usually greater than the indirect costs. It has been suggested that education of health care providers and the public is a vital element of the response to the challenge posed by asthma in Africa [4].

The prevalence of asthma in developing countries increased in 50% per decade for the last 40 years and approximately 250,000 deaths occur in each year. It was the common conditions that affect 5-10% of the population during the past 20 years [5].

Bronchial asthma is one of the most common public health problems in Ethiopia. Its prevalence increased over the last few decades with different contributing factor such as cigarette smoking [6], household economic status [7], occupational condition of the patients [7], residence of the patients [8], presence of vermin at household [7] and family history of asthma [9]. It is coming another burden for the country next to those communicable diseases [10]. In one study conducted, in south west Ethiopia, asthma accounted for 2% of outpatient and 5.4% of medical admission [10], and different risk factors are responsible for this problem like poor compliance for the drugs, lack of awareness about the disease, low socio economic status and hyper sensitivity [3].

There is significant physical and socio-economic burden with asthma related health cost. It results is an estimated 420,000 deaths every year [11]. In developing countries, where poverty and non-communicable respiratory disease have long been linked Bronchial asthma is often diagnosed after a long time because of the patients low medical seeking behavior. This may be an important factor for increasing morbidity and mortality as a result of asthma [12,13]. It represents a substantial economic and social burden throughout the world [14]. In developing countries, an additional problem is that health planners have limited resources hence it is one of the factors for emergency department visit [15,16].

The global initiative for asthma (GINA) estimates that the global prevalence of asthma ranges from 1 to 18% [17]. In study conducted in Portugal Prevalence of diagnosed asthma was 5.0% and the ‗Lifetime asthma ‘prevalence was 10.5%. The prevalence was similar in men and women and in all age [18], and another study done In the Kingdom of Saudi Arabia in 2001, the prevalence of asthma was 12% [19]. In Malaysia, it was estimated that there is 1.6 to 2 million asthmatics in 1996 and was leader cause for outpatient visit [20].

Factors that contribute to the bronchial asthma and associated factors among adult patients has not been studied earlier in Somali region. So, the aim of this study was to determine the prevalence and associated factors of bronchial asthma among adult patients in Jigjiga University Sultan Sheikh Hassan Yabere Referral Hospital.

Methods and Materials

Study Area and Study Period

The study was conducted in Jigjiga University Sultan Sheikh Hassan Yabere Referral Hospital, which is the only referral hospital in the region found in Jigjiga town capital of Somali region. It is located 636 km eastern of Addis Ababa (the capital city of Ethiopia). According to 2007 Central Statistical Agency census report, the projected population of Jigjiga town in 2019 is 166,664 of whom 5267 (3.16%) and 16833 (10%) pregnant women and children aged 6-59 months respectively. The study was conducted from May to June 2020.

Study Design

Institution based cross sectional study design was employed.

Source and Study Population

Source Population

All adult patients who visited adult OPD and adult emergency department of Jigjiga University Sultan Sheikh Hassan Yabere Referral Hospital during the study period were source population.

Study population

Randomly selected adult patients who visited adult emergency department and adult OPD of Jigjiga University Sultan Sheikh Hassan Yabere Referral Hospital during the study period were study population.

Inclusion and Exclusion Criteria

Inclusion criteria

Adult patients who were visited adult OPD and adult emergency were included in the study.

Exclusion criteria

Patients that were unable to respond or serious illness were excluded from the study.

Sample Size Determination

The sample size was determined using single population formula Assumptions: 95% confidence interval, 5% margin of error and proportion prevalence of bronchial asthma (29.6%) from Debre Berhan ,Ethiopia [7].

for 1

Where: n= the minimum sample size required for the study

Z= standard normal distribution (Z=1.96) with 95% confidence interval

P= prevalence of bronchial asthma (0.296) .(7)

d=is a tolerable margin of error (d=5%=0.05)

for 2

Then by adding 10% (0.1) non-response rate, the total sample size (n) is n=320+ (320×0.1) =320+32=352. Final Sample size is to be 352.

Sampling Techniques and Procedures

Systematic sampling technique was used to select study participants. Jigjiga University Sultan Sheikh Yabere Referral Hospital was selected purposefully. First the average monthly adult patient visiting emergency department calculated which was 1052 adult patient visited Emergency. So eligible patients were recruited using systematic sampling technique. Every K interval calculated i.e. K= 1052 /352=3, so that every third patient was included until the required sample size was achieved. The first patient was taken using lottery method.

Data Collection Tools and Methods

The data was collected using structured questionnaires by interviewing the respondents. The questionnaires was initially prepared in English and then translated into Somali and then back translated into English to check for any inconsistencies or distortion in the meaning of words and concepts. Five Nurse Data collectors and two supervisors were recruited and training was provided on the tools, data collection procedures, the objectives, questionnaires and ways of conducting interview by the principal investigator for two days before the actual data collection time.

Study Variables

Dependent Variable

Bronchial asthma in Adult Patients.

Independent Variables

Socio-demographic factors

  • Age,
  • Sex,
  • Income,
  • occupational,
  • Family literacy status,
  • Residence,
  • cost,

Individual behavior and health‑ related condition

  • Smoking status
  • Co -morbid disease (COPD, Pneumonia, other chronic disease, recurrent URTI

Environmental and housing characteristics of the study participants

  • Vermin

Data Quality Control

Data quality was assured through training of data collectors, the questionnaire was evaluated by experts to assess its relevance, and their comments were taken in consideration then questionnaire had pretested on another facility before beginning the actual data collection process and continuous supervision at the time of data collection was conducted. Supervisors together with principal investigator discussed findings of pretest questionnaires checked and modified before the actual data collection. The collected questionnaire was checked in each day on the actual data collection time for completeness and consistency by supervisors and principal investigator. Code was given for completed questionnaire. Double data entry was done to make comparisons of two data clerks and resolve if there was being some difference,

Data Processing and Analyses

The data was coded and entered using Epi-data version 7.2.3.1 then exported, processing and analyzing were done using SPSS version 23. Descriptive statistics of different variables were done by cross tabulation. Binary logistic regression models using bivariate [crude odds ratio, [COR] and multivariable analysis [adjusted odds ratio, AOR] with 95% Confidence interval [CI] were used. From the bivariate analysis, variables that has with a significance level of p<0.25 was being retained for inclusion into the multivariable analysis in the final model. Variables with p<0.05 with being considered as statistically significant and independently associated with bronchial asthma.

Ethical Consideration

An ethical clearance was obtained from Ethics Review Committee of Jigjiga University School of Graduate studies. Written and verbal consent was obtained from each participant after explaining the purpose and nature of the research. Participation in the study was on a voluntary basis and participants were informed their right to quit their participation at any stage of the study if they did not want to continue. Moreover, confidentiality of the information was assured by using an anonymous questionnaire.

Results

Socio-Demographic Characteristics of the Study Participants

Three hundred fifty-two study participants primarily sampled for the study, 340 have participated in the study they made a response rate of 96.7%. The reason for non-response was not willing to participate in the study. The mean age of the study participants was 28.08 with SD of +6.139. The age range of the study participants were 15 and 47 years respectively. One hundred seventy-one (50.3%) males and 169 (49.7%) females were participated in the study. Major ethnic group of this study participant 313 (92.1%) were Somali. About 296 (87.1%) were living in urban and 258(75.9%) were married by their marital status. Most of the study participants 277 (81.7%) were categorized under middle income (Table 1).

Table 1: Distribution of Socio-Demographic Characteristics of the Study Participants in Jigjiga University Sultan Sheikh Hassan Yabere Referral Hospital, Jigjiga, Somali region, Ethiopia 2020 G.C.

Variable

Category Frequency

 (No)

Percentages

 (%)

Age of the patient 15-24

77

22.7

25-34

83

24.6

35-44

78

23.1

45-54

55

16.1

>=55

46

13.6

Marital status 1. Single

72

21.2

2. Married

258

75.9

3. Divorced

6

1.8

4. Widowed

4

1.2

Sex 1. Male

171

50.3

2. Female

169

49.7

Residence 1. Urban

296

87.1

2. Rural

44

12.9

Ethnicity


1. Somali

313

92.1

2. Amhara

17

5.0

3. Gurage

4

1.2

4. Others

6

1.8

Occupational status 1. Government employee

30

8.8

2. Farmer

57

16.8

3. Daily laborer

61

17.9

4. Marchant

20

5.9

5. Others

172

50.6

Family income 1. High

55

16.2

2. Middle

277

81.5

3. Low

8

2.4

Presenting Symptoms

Most of the study participants the commonest presenting asthma symptom was cough reported by 24.4 % of the patients. The second common symptoms were also rhinitis and sinusitis reported by 18.5% and 17.4% of the patients respectively while the least presenting symptoms were atopic dermatitis 13.5% reported by the patients (Table 2).

Table 2: Distribution of presenting symptoms of the Study Participants in Jigjiga University Sultan Sheikh Hassan Yabere Referral Hospital, Jigjiga, Somali region, Ethiopia 2020 G.C.

Variable

Category Frequency (No)

Percentages (%)

Wheezing 1. Yes

55

16.2

2. No

285

83.8

Cough 1. Yes

83

24.4

2. No

257

75.6

Dyspnea (shortness of breath) 1. Yes

37

10.9

2. No

303

89.1

Rhinitis

1. Yes

63

18.5

2. No

277

81.5

Sinusitis 1. Yes

59

17.4

2. No

281

82.6

Atopic dermatitis 1. Yes

46

13.5

2. No

294

86.5

Cyanosis 1. Yes

55

16.2

2. No

285

83.8

Health Related Characteristics

Among the participants, 37.7% had family history of asthma. Fifty-six (21.8%) of the study participants had an experience of pneumonia in the last 12 months (Table 3).

Table 3: Distribution of health related characteristics of the Study Participants in Jigjiga University Sultan Sheikh Hassan Yabere Referral Hospital, Jigjiga, Somali region, Ethiopia 2020 G.C.

Variable

Category Frequency

 (No)

Percentages

 (%)

Does a patient diagnosis for asthma For now or before? 1. Yes

32

9.4

2. No

308

90.6

Family history of asthma?


1. Yes

178

52.4

2. No

162

47.6

3. don’t know
Do you think that is there anything that triggers your asthma?


1. Yes

32

9.4

2. No

308

90.6

3. don’t know
If yes to Q.no 303, what are your trigger factors that exacerbate your asthma?


1. Dust

4

1.2

2. Smoke

12

3.5

3. Cold weather

14

4.1

4. Strong smell

2

0.6

5. Other (s)

4

1.2

Have you ever faced any asthma exacerbation symptoms in the last 12 month 1. Yes

32

9.4

2. No

308

90.6

3. don’t know    
Bronchodilators drug utilization

1. Yes

155

45.6

2. No

185

54.4

Experienced of drug discontinuation 1. Yes

15

4.4

2. No

325

95.6

History of Chronic diseases like CHD 1. Yes

37

10.9

2. No

303

89.1

Presence of pneumonia in the last 12 months 1. Yes

37

10.9

2. No

303

89.1

Individual Behavior

Fifty-four (15.9%) of the study participants were ever smoke cigarette while 38(11.2%) were currently smokers. Among the participants, 24(7.4%) had habit of frequent utilization of perfume and 55(16.2%) had no habit of exercise (Table 4).

Table 4: Distribution of individual behavior of the Study Participants in Jigjiga University Sultan Sheikh Hassan Yabere Referral Hospital, Jigjiga, Somali region, Ethiopia 2020 G.C.

Variable

Category Frequency

 (No)

Percentages

 (%)

Do you ever smoke cigarette?


1. Yes

54

15.9

2. No

286

84.1

Are you currently a smoker?


1. Yes

38

11.2

2. No

302

88.8

Do you think that is there anything that limits your daily activities?


1. Yes

55

16.2

2. No

285

83.8

Is your habit of frequent usage of perfume 1. Yes

25

7.4

2. No

315

92.6

Environmental Factors

More than half of the study participants 188(55.3%) their house have vermin/dust. Three hundred-ten (91.2%) households used charcoal as source of energy, followed by electricity 6.2%, kerosene 1.5% and wood only 1.2%. Almost all of the study participants 340(100%) reported that did not use biomass fuel (Table 5).

Table 5: Distribution of environmental factors of the Study Participants in Jigjiga University Sultan Sheikh Hassan Yabere Referral Hospital, Jigjiga, Somali region, Ethiopia 2020 G.C.

Variable

Category Frequency

 (No)

Percentages

 (%)

Is there presence of vermin/dust in the home?


1. Yes

188

55.3

2. No

152

44.7

How many rooms are there in your house (Including the sitting room)? 1.>4 rooms

262

77.1

2.<4 rooms

78

22.9

Number of windows in the house 1. Yes

119

35.0

2. No

221

65.0

With what type of fuel source do you cook at home?  1. Charcoal

310

91.2

2. Wood

4

1.2

3. Electricity

21

6.2

4. Kerosene

5

1.5

Did you use biomass fuel for work or home? 1. Yes

0.00

0.00%

2. No

340

100%

Prevalence of Bronchial Asthma

In this study the overall prevalence of bronchial asthma among adult patients in Jigjiga University Sultan Sheikh Hassan Yabere Referral Hospital Somali region was found 9.4%with (95%CI: 6.5, 12.9) (Figure 1).

fig 1

Figure 1: Prevalence of bronchial asthma in Jigjiga University Sultan Sheikh Hassan Yabere Referral Hospital, Jigjiga, Somali region, Ethiopia 2020.

Factors Associated with Bronchial Asthma

Bi-variable Analyses on Factors Associated with Bronchial asthma

In the variables included in Bivariate analyses were: Residence, Wheezing, Cough, Dyspnea (shortness of breath), Rhinitis, Sinusitis, atopic dermatitis, Family history of asthma and Presence of vermin/dust in the home.

This study revealed that urban residents were 3.726 times [COR=3.726; 95%CI: (1.274, 10.903)] more likely to develop bronchial asthma than rural residents.

This study indicated that patients who come from the family history of asthma were 6.625 times [COR=6.625; 95%CI: (2.872, 15.280)] more likely to develop bronchial asthma than from non-asthmatic family.

In this study, presence of vermin at household level were 2.694 times [COR=2.694; 95%CI: (1.072, 6.768)] increased the probability of developing asthma among adult patients (Table 6).

Table 6: Bi-variable Analyses for Factors affecting Bronchial asthma among Adult Patients in Jigjiga University Sultan Sheikh Hassan Yabere Referral Hospital, Jigjiga, Somali region, Ethiopia 2020.

Variable

Category Bronchial asthma COR (95%CI) P-value
Yes

No (%)

No

No (%)

Residence 1. Urban

28 (12.2)

201 (87.8) 3.726 (1.274, 10.903) 0.016

2. Rural

4 (3.6) 107 (96.4)

1.00

Wheezing 1. Yes

8 (14.0)

49 (86.0) 1.762 (0.748, 4.149) 0.195

2. No

24 (8.5) 259 (91.5)

1.00

Cough 1. Yes

11 (13.3)

72 (86.7) 1.717 (0.790, 3.730) 0.172

2. No

21 (8.2) 236 (91.8)

1.00

Dyspnea (shortness of breath) 1. Yes

6 (5.2)

31 (83.8) 2.062 (0.788, 5.397) 0.140

2. No

26 (8.6) 277 (91.4)

1

Rhinitis 1. Yes

12 (19.0)

51 (81.0) 3.024 (1.391, 6.571) 0.005

2. No

20 (7.2) 257 (92.8)

1

Sinusitis 1. Yes

14 (24.7)

45 (76.3) 4.546 (2.112, 9.785) 0.000

2. No

18 (5.4) 263 (93.6)

1

Atopic dermatitis 1. Yes

7 (15.2)

39 (84.8) 1.931 (0.783, 4.764) 0.153

2. No

25 (8.5) 269 (91.5)

1.

Family history of asthma 1. Yes

24 (20.0)

96 (80.0) 6.625 (2.872, 15.280) 0.000

2. No

8 (3.6) 212 (96.4)

1.00

Is your habit of frequent usage of perfume 1. Yes

7 (19.4)

29 (80.6) 3.756 (1.503, 9.381) 0.035

2. No

25 (7.2) 279 (91.8)

1.00

Presence of vermin/dust in the home 1. Yes

26 (13.6)

165 (86.4) 2.694 (1.072, 6.768) 0.005

2. No

6 (4.0) 143 (96.0)

1.00

Multivariable Analyses on Factors Associated with Bronchial asthma

Those variable which had association during bivariate analysis and other candidate variables with P<0.25 in the bivariate analysis were included in the final model of multivariate analysis in order to control all possible confounders. In multivariable analyses, in multivariable logistic regression analysis revealed that sinusitis, residence, family history and vermin/dust were risk factors significantly associated with bronchial asthma.

This study revealed that urban residents were 3.425 times [AOR=3.425; 95%CI: (1.036, 11.319)] more likely to develop bronchial asthma than rural residents.

This study indicated that patients who come from the family history of asthma were 5.796 times [AOR=5.796; 95%CI: (2.311, 14.540)] more likely to develop bronchial asthma than from non-asthmatic family.

In this study, present of vermin at household level were 2.999 times [COR=2.999; 95%CI: (1.106, 8.129)] increased the probability of developing asthma among adult patients.

This study indicated that patients who have sinusitis were 2.971 times [AOR=2.971; 95%CI: (1.193, 7.397)] more likely to develop bronchial asthma than from non-sinusitis (Table 7).

Table 7: Multivariable Logistic Regression Analyses for Factors Bronchial asthma among Adult patients in Jigjiga University Sultan Sheikh Hassan Yabere Referral Hospital, Jigjiga, Somali region, Ethiopia 2020 G.C.

Variable

Category Dx of Bronchial asthma COR (95%CI) AOR (95%CI)
Yes

No (%)

NO

No (%)

Residence 1. Urban

28 (12.2)

201 (87.8) 3.726 (1.274, 10.903) 3.425 (1.036, 11.319)

2. Rural

4 (3.6) 107 (96.4) 1.00

1.00

Wheezing 1. Yes

8 (14.0)

49 (86.0) 1.762 (0.748, 4.149) 2.240 (0.822, 6.104)

2. No

24 (8.5) 259 (91.5) 1.00

1.00

Cough 1. Yes

11 (13.3)

72 (86.7) 1.717 (0.790, 3.730) 1.597 (0.597, 4.273)

2. No

21 (8.2) 236 (91.8) 1.00

1.00

Dyspnea (shortness of breath) 1. Yes

6 (5.2)

31 (83.8) 2.062 (0.788, 5.397) 1.924 (0.578, 6.400)

2. No

26 (8.6) 277 (91.4) 1

1.00

Rhinitis 1. Yes

12 (19.0)

51 (81.0) 3.024 (1.391, 6.571) 1.847 (0.690, 4.949)

2. No

20 (7.2) 257 (92.8) 1

1.00

Sinusitis 1. Yes

14 (24.7)

45 (76.3) 4.546 (2.112, 9.785) 2.971 (1.193, 7.397)

2. No

18 (5.4) 263 (93.6) 1

1.00

Atopic dermatitis 1. Yes

7 (15.2)

39 (84.8) 1.931 (0.783, 4.764) 1.387 (0.481, 4.002)

2. No

25 (8.5) 269 (91.5) 1

1.00

Family history of asthma 1. Yes

24 (20.0)

96 (80.0) 6.625 (2.872, 15.280) 5.796 (2.311, 14.540)

2. No

8 (3.6) 212 (96.4) 1.00

1.00

Is your habit of frequent usage of perfume 1. Yes

7 (19.4)

29 (80.6) 3.756 (1.503, 9.381) 2.180 (0.724, 6.570)

2. No

25 (7.2) 279 (91.8) 1.00

1.00

Presence of vermin/dust in the home 1. Yes

26 (13.6)

165 (86.4) 2.694 (1.072, 6.768) 2.999 (1.106, 8.129)

2. No

6 (4.0) 143 (96.0) 1.00

1.00

Discussion

In this study the prevalence of Bronchial asthma was 9.4% (95%CI: 6.5, 12.9). This finding is comparable with study conducted in the Kingdom of Saudi Arabia in 2001; the prevalence of asthma was 12 % [19]. This also in line with study done in Africa estimated that a prevalence of 11.7% for asthma, totaling over 74 million people in 1990, and 2010 prevalence was 12.8%, about 120 million people (4). This also in line with study done In Africa the prevalence of asthma was estimated 9.6% in Swaziland, 7.8 in Comoros, 7.54% in Mauritania and in range of 0-10% in Ethiopia [21]. This may be due to similarity of study design and sample size.

This finding is higher than study done in Portugal on Prevalence of asthma which states that the prevalence of diagnosed asthma was 5.0%. This finding is higher than another study done in Addis Ababa which was the prevalence of asthma and factors that lead patients to visit adult emergency room of Zewditu Memorial Hospital, Ethiopia was revealed that the prevalence of bronchial asthma was 1.5% [14].

This finding is lower than study done in Malaysia, 73% out-patient clinic attendants are treated for respiratory symptoms and asthma is one and major cases. It is estimated that there is 1.6 to 2 million asthmatics in Malaysia [20]. This finding is lower than another study done in Addis Ababa which was the prevalence of asthma and factors that lead patients to visit adult emergency room of Zewditu Memorial Hospital, Ethiopia was revealed that the prevalence of bronchial asthma was 1.5% [14]. This finding is also lower than another studies mentioned that (cumulative prevalence of asthma) was highest in South Africa (53%, 5-12 years) in 1997,followed by Egypt (26.5%, 11-15 years) in 2005, Nigeria (18.4%, 15-35 years) in 1995, and Ethiopia(16.3%, >20 years) in 1997.

This study revealed that urban residents were 3.425times [AOR=3.425; 95%CI: (1.036, 11.319)] more likely to develop bronchial asthma than rural residents. It was consistent with the report in Brazil and Ethiopia [15,16]. This might be explained outdoor air of urban area is highly polluted due to high levels of traffic and industry related emissions that could increase the risk of asthma. In contrast, study done in India [17] showed that being a rural resident was significantly higher the odds of having asthma. Research conducted in Ethiopia [18] revealed that no association between asthma and residence of the patients. These variations might be due to the difference in the characteristics of the study population, geographical distribution and case definitions used to ascertain asthma.

Patients having sinusitis were 4.546 times [AOR=2.971; 95%CI: (1.193, 7.397)] more like to encounter bronchial asthma compared to those who have not yet faced this co-morbid. This might be due to the fact that large number of the study subjects live in urban area and in this place there are many chemicals, gases and the like that will worsen the sinusitis status then end up with acute attack. Both seasonal and viral chronic sinusitis are among the most common triggers of acute severe exacerbations and may invade epithelial cells of the lower as well as the upper airways and there is an increase in airway inflammation with increased numbers of eosinophil and neutrophils along with nasal congestion as well as airway tract edema in addition to increment in airway hyper-responsiveness [19,20].

This study indicated that patients who come from the family history of asthma were 5.796 times [AOR=5.796; 95%CI: (2.311, 14.540)] more likely to develop bronchial asthma than from non-asthmatic family. Similar findings have been reported by other studies in developed and developing countries that showed a significant association between family history of asthma and asthma occurrence among adult patients [20,21]. This association could be either due to genetic factors or a shared environment by the family members.

In this study, present of vermin at household level were 2.999 times [AOR=2.999; 95%CI: (1.106, 8.129)] increased the probability of developing bronchial asthma among adult patients. The world health organization report in 2008 report also showed that evidence for a relationship between asthma and domestic exposure to cockroaches, mice and dust mites is strong. This could be explained by house which have vermin’s concerns with the use of insecticides prays at home, with more frequent use being associated with bronchial asthma. Similar results can be found in the literature regarding the link between the use of home aerosolized cleaning products and asthma.

Conclusion

This finding the prevalence of Bronchial asthma was 9.4% (95%CI: 6.5, 12.9). However, Bronchial asthma was significantly associated Type of Residence, Wheezing, Cough, and Rhinitis, Family history of asthma and Presence of vermin/dust in the home was identified as the most important risk factor for Bronchial asthma.

Recommendation

Based on the findings of the study the following recommendations could be mentioned

For Health Professionals

  • Health care providers should work on improving patients’ awareness on their medications adherence, avoidance of asthma triggering factors for decreasing the progression of the disease and better asthma controls.

For the Hospital

  • Staffs should teach about asthma triggering factors.

References

  1. Adams JY, Sutter ME (2012) The patient with asthma in the emergency department. Bronchial Asthma: Springer 179-202. [crossref]
  2. Kirenga J, Okot-Nwang MJAhs (2012) The proportion of asthma and patterns of asthma medications prescriptions among adult patients in the chest, accident and emergency units of a tertiary health care facility in Uganda 12(1): 48-53. [crossref]
  3. Lawson JA, Janssen I, Bruner MW, Hossain A, Pickett WJBpm (2014) Asthma incidence and risk factors in a national longitudinal sample of adolescent Canadians: a prospective cohort study; 14(1): 51. [crossref]
  4. Adeloye D, Chan KY, Rudan I, Campbell HJCmj (2013) An estimate of asthma prevalence in Africa: a systematic analysis 54(6): 519-31. [crossref]
  5. Gupta RS, Weiss KBJP (2009) The 2007 National Asthma Education and Prevention Program asthma guidelines: accelerating their implementation and facilitating their impact on children with asthma. 123(Supplement 3): S193-S8. [crossref]
  6. Tefereedgn E, Ayana AJOJA (2018) Prevalence of asthma and its association with daily habits in Jimma Town, Ethiopia 2(1): 011-7.
  7. Shine S, Muhamud S, Demelash AJBrn (2019) Prevalence and associated factors of bronchial asthma among adult patients in Debre Berhan Referral Hospital, Ethiopia 2018: a cross-sectional study. 12(1): 608. [crossref]
  8. Sharma S, Sood M, Sood AJCPR (2011) Environmental risk factors in relation to childhood asthma in rural area 15(1): 29-32.
  9. Elfaki N, Shiby AJJCRDC (2017) Risk factors associated with asthma among Saudi adults in Najran 3(133): 2472-1247.1000133.
  10. Mekonnen D, Andualem MJEjohs (2010) Clinical Effects of Yoga on Asthmatic Patients: A Preliminary Clinical Trial, Jimma, Southwest Ethiopia 20(2). [crossref]
  11. Asthma GIf. 2018 GINA report, global strategy for asthma management and prevention.
  12. Aggarwal A, Chaudhry K, Chhabra S, D Souza G, Gupta D, Jindal S, et al. (2006) Prevalence and risk factors for bronchial asthma in Indian adults: a multicentre study 48(1): 13. [crossref]
  13. Mulat T (2015) Assesment of Prevalence and Pattern of Medication Prescription for Bronchial Asthma, at Adult Emergency Department of Tikur Anbesa Specialsed Hospital. Addis Ababa University.
  14. Fentahun S (2017) A Study on the Assessement of Prevalance of Asthma and Factors that Lead Patients to Visit Adult Emergency Room Of Zewditu Memmorial Hospital, Addis Ababa. Addis Ababa University.
  15. Aït-Khaled N, Enarson D, Bousquet JJBotWHO (2001) Chronic respiratory diseases in developing countries: the burden and strategies for prevention and management 79: 971-9. [crossref]
  16. Hamdan Al-Jahdali AAJB, PUL. MED (2012) Salim bathrooms, factors associated with patients visit to the emergency department for asthma therapy 12: 80. [crossref]
  17. Amoah AS, Forson AG, Boakye DAJGMJ (2012) A review of epidemiological studies of asthma in Ghana 46(2): 23-8. [crossref]
  18. Sa-Sousa A, Morais-Almeida M, Azevedo LF, Carvalho R, Jacinto T, Todo-Bom A, et al. (2012) Prevalence of asthma in Portugal-The Portuguese National Asthma Survey 2(1): 15. [crossref]
  19. Al-Mazam A, Mohamed AGJJof medicine c (2001) Risk factors of bronchial asthma in Bahrah, Saudi Arabia 8(1): 33. [crossref]
  20. Ngui R, Lim YAL, Chow S, de Bruyne J, Liam CJMJoM (2011) Prevalence of bronchial asthma among Orang Asli in Peninsular Malaysia 66(1): 27-31. [crossref]
  21. Barry A, Caesar J, Klein Tank A, Aguilar E, McSweeney C, Cyrille AM, et al. (2018) West Africa climate extremes and climate change indices 38: e921-e38. [crossref]
fig 1

A Reappraisal of the Foundations of the Special Relativity Theory

DOI: 10.31038/NAMS.2022522

Introduction

The first purpose of the present paper is to clarify the scientific approach Einstein [1] adopted when he developed the Specia Relativity Theory (→SRT). This can be done when we compare his approach with two long-established and characteristically different methods in use to gain relevant scientific knowledge: the phenomenological and the axiomatic method.

The second aim of this paper will then be to analyse from an immanent-logical point of view:

(i)  Einstein’s postulates of the SRT and their implications;

(ii) How Einstein – starting from the postulates he had introduced – attempted to derivate the Lorentz [2] Transformations.

Said in other terms: I shall concentrate my attention on the inner consistency of the SRT.

Two Classical Methods for Scientific Knowledge

The Phenomenological Approach

(i)  We often start our observations and investigations with appearances of sensory modality. Consider, for instance, the following experiences (1. – 6.): 1. We look at the sun, the moon, the planets, and unexpectedly begin to wonder about their respective movements; 2. We perceive several flowers, and suddenly set on to wonder what traits they may have in common and wherein they could differ from each other – and this sets in motion a closer look at them and a comparison of their striking structures; 3. We gaze at several birds, and suddenly find ourselves engaged in observing and comparing their behaviour; 4. We look at tides and sea currents and begin to wonder about the rhythms they are involved in; 5. We investigate the phenomena of electromagnetic induction – and go over to arrange an experimental setting, varying it in the course of our observations, etc.

(ii)  Many of the investigations hinted at set off from “open” intentions, which we specify when intending to clarify the relations implicit in the phenomena that puzzle us.

(iii)  We are thus led to the formulation of rules, tendencies, laws; we become aware of certain probabilities – and are thereby encouraged to modify our primordial intention, to ask new questions, to foster new investigations, always endeavouring to remain close to the phenomena, saving the appearances.

The Axiomatic Approach

First systematically presented by Euclid [3,4] in his Elements of Geometry, further developed and specified by logicians and mathematicians (e.g. B. Pascal [5], G. Frege [6-8], P. Finsler [9]) in the course of 2000 years, the characteristic features of an axiomatic approach can be summarized as follows:

(i)  If we aim to open a field of knowledge according to the axiomatic method, we start from a cognitive intention which we specify step by step, formulating clear postulates. We thereby establish what kind of mental processes we intend to be engaged in.

(ii)  We will then set forth to introduce certain words, signs, terms, defining unambiguously what these expressions shall henceforth mean and refer to within the context at issue.

(iii)  Constitutive to the axiomatic method is the fact that if we steadily hold to the postulates we are led to elementary, fundamental insights, i.e. axioms. Epistemologically speaking, the axioms follow necessarily from the postulates. They are basic insights which cannot be reduced to yet more fundamental assertions. We can therefore look upon the axioms as being self-evident.

(iv)  Starting from the axioms, we can derive higher structured propositions, i.e. theorems, by means of logical reasoning. This holds true, even if many a researcher may catch sight of the content of a theorem, before realizing that the theorem in question can be logically traced back to the axioms.

(v)  If we develop an axiomatic system, we implicitly acknowledge that the Principles of Logic are unrestrictedly valid – at all levels of our investigation. The two main principles I’ll be concerned with in the present paper are: a) The Principle of Identity, requiring that every term we have introduced maintain its univocal meaning throughout the entire investigation; b) The Principle of Non-Contradiction, demanding that neither postulates nor axioms (and, consequently, theorems) contradict one another.

(vi)  Accordingly, in fields of knowledge opened and determined by the axiomatic method (e.g. in pure mathematics), a mental item (a “thing”) exists, and an assertion is true if the former and the latter are exempt from contradictions.

A Short Comparison of the Two Approaches to Scientific Knowledge Reveals

(i)  A scientist working phenomenologically does not a priori question the reality of the objects and appearances he deals with in his investigations; he simply tries to unveil the rules and correlations hidden in them.

(ii)  A mathematician embracing the axiomatic method formulates postulates of exclusively mental content, advancing to axioms and theorems. The existence of the objects he is concerned with, as well as the truth of his findings, depends entirely on the non-contradiction of the postulates – and this includes the axioms and the theorems that correspond to the postulates. A mathematician has the right to declare that certain signs, ciphers, symbols, drawn figures represent the mental objects he conceives and deals with, but the signs and symbols lack value of their own – they rather are a mnemonic that helps us to pursue the line of thought expressed in the postulates and axioms of purely mental content.

(iii)  Although the phenomenological and the axiomatic approaches differ from one another, each one of them is clearly determined, and both are – in principle – free from contradictions.

Dogmatic-deducible Approaches to Scientific Cognition

A third, completely different approach to achieve scientific cognition is practised by researchers who, imitating mathematicians, introduce postulates, but extend their enunciations to include elements which essentially belong to the modalities of the world of sensory perceptions. In other words: their postulates are not restricted to purely mental categories which – as a mere aid for grasping their content – can be illustrated by diagrams, figures, symbols; on the contrary, the postulates we are now talking about – which, as I said, include elements belonging to the world of sensory perceptions – prescribe how these latter elements must appear and evolve according to the postulates. These do not hint at tentative models, meant to explain certain phenomena – they are strict, rigid prescriptions of the sensory modalities to be expected under clearly defined settings.

I call such an approach a dogmatic-deducible theory. A good example of such theory (or approach) is Einstein’s introduction to his Special Relativity Theory (=SRT) in the papers of 1905 and 1922/56.

The Special Relativity Theory (SRT) – A Dogmatic-Deducible Theory

Einstein based his SRT on two explicit postulates:

Postulate 1: The Postulate of Relativity (=PoR), demanding that in two inertial frames of reference K° and K’, moving reciprocally at a constant speed v along their parallel x°- and x’-axes, identical laws of Nature are valid;

Postulate 2: The Postulate of Constant Speed of Light (=PoL), originally introduced by declaring that for observers firmly placed along the x°-axis of K°, a flash of light L°, emitted by a source of light Q° of K° in the positive direction of the x°-axis, will always be propagated and arrive at an equal speed c, independently of any motion of Q° along the x°-axis at the time it emits L°.

I shall call this arrangement: Configuration I.

I have formulated both postulates of the SRT in a clear, unambiguous way – in complete accord with the formulations advanced by Einstein in his papers of 1905 and 1922/56.

The postulates reveal that each one of them contains several elements that do not belong to the realm of the purely mental concepts of mathematics and logic:

(i)  In Postulate 1, the PoR, we find “frames of reference that are moving reciprocally at a constant speed v”; and also “laws of Nature”;

(ii)  In Postulate 2, the PoL, we have “a flash of light will always be propagated and arrive at an equal speed c, independently of any motion of Q° along the x°-axis at the time it emits L° “.

Such terms as ‘speed’, ‘motion’, ‘flash’, ‘Laws of Nature’ form an essential part of what is demanded in the Einsteinian Postulates. These postulates demand and determine how certain elements of sensory perceptive modality must appear and have to evolve within the system presented and specified by the PoR and the PoL. They strictly prescribe what an observer in K° and K’ must observe and measure.

Let us now look at Configuration I, as introduced by Einstein: (Figure 1).

fig 1

Figure 1: K°, K’: frames of reference (inertial systems); v: relative speed of K’ with respect to K°; Q°: source of light, placed at the zero point of the coordinates of K°, which emits the flash of light L° in the positive direction of the x°-axis. The figure represents Configuration I.

Let us now change to Configuration II: (Figure 2).

fig 2

Figure 2: K’, K°: frames of reference (inertial systems); v: relative speed of K° with respect to K’; Q’: source of light, placed at the zero point of the coordinates of K’, which emits the flash of light L’ in the positive direction of the x’-axis. The figure represents Configuration II.

If we compare Configuration II with Configuration I, we see that the two configurations are completely symmetrical. One of the most important points to consider is, that the PoR has been applied correctly: The source of light Q°, placed at the zero point of the coordinates of K° in Configuration I, has been replaced by the source of light Q’, correctly situated at the zero point of the coordinates of K’. And, of course, whereas in Configuration I it was stipulated, that the flash of light L° would move with velocity c with respect to observers firmly placed on the positive x°-axis of K°, independently of any motion of Q° in relation to these observers of K° – we now see that in Configuration II we have established completely symmetric conditions, resulting in an enunciation that proclaims that the flash of light L’, emitted by Q’ in the positive direction of the x’-axis will move with the same velocity c with respect to observers of K’ that are firmly located on the x’-axis, independently of any motion of Q’ at the time it emits L’. If we transform Configuration I into Configuration II taking care to install completely symmetric conditions, the result is totally free from contradictions.

Einstein’s Logic Fallacies in His Papers of 1905 and 1922/56:

The Lack of Symmetric Conditions

Einstein wrote that the flash of light L° in K° in Configuration I moves with constant speed c for all observers firmly placed in K° and would “… in connection with the Principle of Relativity [i.e. PoR] also [propagate] with velocity V [i.e. c] when measured in the moving system [i.e. K’]”… In other words: also move with the same speed c for observers firmly placed on the x’-axis of K’. In short: Einstein argued that the same light-signal L°, emitted by the source of light Q° of K° and moving at speed c for observers at rest in K°, would also propagate itself for observers at rest in K’ at equal speed c, notwithstanding the premise that the systems K° and K’ were moving in relation to each other at the constant speed v. Einstein erroneously applied the PoR together with the PoL directly to the flash of light L°, without transferring the source of light from K° to K’. He didn’t arrange for K’ a configuration symmetric to the one he had established for K°. This lack of symmetry between K° and K’ definitely rules out any application of the PoR. By neglecting to introduce strictly symmetric configurations in K’ to those in K°, Einstein violated the Principle of Non-Contradiction – since K’ is, in his case, no longer equivalent to K°, although he had begun with the premise that the conditions were to be equivalent.

The Mutual Relative Speed of K° and K’

Besides the lack of symmetry, there is yet another point worth looking at: Einstein established as a premise that the mutual relative speed of K° and K’ is to be v ≠ 0, when measured by observers in K°, and also when measured by observers in K’. This implies that exactly the same units of measurement are to be valid in K° and in K’. By strictly holding to this premise, it follows that the flash of light L°, emitted by Q° in K° cannot move at same speed c for observers at rest in K’ as for observers at rest in K°. If the mutual relative velocity between K° and K’ remains v ≠ 0 – with the same value, when determined by observers in K’ and in K°-, the flash of light L° can only move artificially with the same numerical value c for observers in K’ as in K°, if we deliberately change the units of measurement in K’ in a way that the same numerical value issues. But by acting in such a way and implicitly – and tacitly – maintaining the very same symbols ‘m’ for meters and ‘s’ for seconds in K’, as well as in K°, we convey different meanings to these symbols in K’ with respect to the meaning they have in K°- and this is an obvious transgression of the Principle of Identity.

Conclusion

Einstein’s 1905 and 1922/56 papers on the introduction of his Special Relativity Theory are logically inconsistent. Einstein misapplied the Postulate of Relativity, since he neglected to establish symmetric conditions in the equivalent frames of reference K° an K’ he had introduced at the outset of his papers. Furthermore, Einstein transgressed the Principle of Identity, since he maintained the same symbols for length and time throughout his papers, but changed their meaning, i.e. what they referred to at the beginning. Finally, Einstein maintained that the same units of measurement were to be valid in both systems K° and K’ as far as the determination of their mutual relative velocity was concerned, but untenably changed the units with regard to the determination of the speed of a light-flash in the two systems he considered. It follows that Einstein’s Special Relativity Theory is inconsistent. It violates the Principle of Identity and the Principle of Non-Contradiction. As such, the SRT cannot be corroborated experimentally. Experimental findings have to be interpreted on a consistent line of thought.

References

  1. Einstein A (1969) Grundzüge der Relativitätstheorie. Springer.
  2. Lorentz HA, Einstein A,Minkowski H (1974) Das Relativitätsprinzip. Eine Sammlung von Abhandlungen. Darmstadt: Wissenschaftliche Buchgesellschaft.
  3. Euclides (1791) The Elements of Euclid. London, Wingrove.
  4. Euclides (1814-1818) Les Oeuvres d’Euclid, en grec, latin et en français. T : 1-3
  5. Pascal B(1986) L’esprit de la géométrie. De l’art de persuader.
  6. Frege G (1961) Die Grundlagen der Arithmetik. Eine logisch-mathematische Untersuchung über den Begriff der Zahl. Darmstadt: Wissenschaftliche Buchgesellschaft.
  7. Frege G (1967) Kleine Schriften, herausgegeben von I. Angelelli. Darmstadt: Wissenschaftliche Buchgesellschaft.
  8. Frege G (1969) Nachgelassene Schriften, herausgegeben von H. Hermes, F. Kambartel, F. Kaulbach. Hamburg: Meiner.
  9. Finsler P (1966) Finsler Set Theory: Platonism and Circularity.

Everywhere in China All Air Conditioners, Ice Chestn and Refrigerators have been Consuming and Emitting the Freon and Alike Chemicals: What Effect to the Climate Change?

DOI: 10.31038/JPPR.2022534

Abstract

As China is the biggest country in the world with 1.4billions people and top economic power. China must also be the leader to control the Freon and alike chemicals, so as the green house effect and the global warming. But now, China has been still being the top consumer of the Freon and alike chemicals or the top consumer of refrigerant. How can China contribute to control the green house effect and the global warming? As China has been striving for “The Belt and Road initiative”, “Creating a community of shared future for mankind”, “Together for a Shared Future”. We must face squarely what shortcomings we have had. And correct it at once. In this occasion, what and how many the China really has been consuming the Freon and alike chemicals in the past and at the present must be clear. So we can create new policy and science to reduce and control the Freon and alike chemicals at once. And so on the green house effect and the global warming. The concrete policies must be created as soon as possible. How to do? The basic method must be value and treasure the talented people. Throw away unlawful competition and green-eyed monster. The mankind and the Earth live on the real talent politicians.

Keywords

Climate change, Environmental protection, Freon, Ozone depletion, Health promotion

Introduction

It is a perfect fact that the climate change in the Earth has been being heavy and heavy or worse and worse. As the WHO data showed that air pollution kills an estimated seven million people worldwide every year. Which need not waste time and energy to write the research facts and green house effect and sufferings from the global warming. Up to now, the green house effect and the global warming have not been controlled. As the Earth people even the space has been suffering from the green house effect and the global warming. It is imperative to control it as soon as possible. Because the Freon and alike chemicals have been considering the main reason to destroy the ozonosphere and bring greenhouse effect. So controlling the productions and usages of the Freon and alike chemicals must be the main way to prevent and control the green house effect and the global warming.

As China is the biggest country in the world with 1.4billions people and top economic power. China must also be the leader to control the Freon and alike chemicals, so as the green house effect and the global warming. But now, China has been still being the top consumer of the Freon and alike chemicals or the top consumer of refrigerant. How can China contribute to control the green house effect and the global warming? As China has been striving for “The Belt and Road initiative”, “Creating a community of shared future for mankind”, “Together for a Shared Future”. We must face squarely what shortcomings we have had. And correct it at once. In this occasion, what and how many the China really has been consuming the Freon and alike chemicals in the past and at the present must be clear. So we can create new policy and science to reduce and control the Freon and alike chemicals at once. And so on the green house effect and the global warming. The Freon and alike chemicals in China

  • In the time of CFC of Freon

At this time, in the Earth, all did not know the bad effects of CFC of Freon. And then the world had been knowing the CFC of Freon had destroyed the ozonosphere and bring greenhouse effect. It has been reported that China had been producing main part of CFC of Freon in the world at this time.

Everywhere in China there has been being all air conditioners, ice chest and refrigerators have been consuming and emitting the Freon and alike chemicals.

After China had been producing main part of CFC of Freon in the world. And the CFC of Freon have been banned. China has been changing to HCFC of Freon and HFC of Freon as substitutes.

It has been being known to all that every place in China, where people live and work. There must have air conditioners, ice chestn and refrigerators. From family households, factories, government offices, hospitals, tools of transportation, even the spacecrafts have been being equipped with air conditioners, ice chestn and refrigerators. All the air conditioners, ice chestn and refrigerators have been consuming and emitting the HCFC of Freon and HFC of Freon after CFC of Freon.

Because the China is the biggest country in the world. The population of China is the much too more than any other country in the world. So the family households, factories, government offices, hospitals, tools of transportation must be much too more than any other country in the world. Therefore, the air conditioners, ice chestn and refrigerators also must be much too more than any other country in the world. At present, China must have been consuming and emitting the HCFC of Freon and HFC of Freon more than other countries.

  • The storage of the banned CFC of Freon has been being the fact in China

It is accepted fact by the international professionals and officials that there has been being more than 160 million tons of banned CFC of Freon storaged around the world. As China had been being the main producer and consumer of the banned CFC of Freon. Therefore, China must have lots of storages of the banned CFC of Freon. Whether some Chinese secretly have been using the banned CFC of Freon cannot be eliminated.

  • In summary, China has been being the biggest and main producer and consumer of the banned CFC of Freon and the biggest and main producer and consumer of the HCFC and HFC of Freon.
  • HCFC and HFC of Freon are not green products and environmental protection products.

Though HCFC of Freon has less effect to deplete the Ozone Layer. But it is not the perfect substances. Some HCFC of Freon have been being banned from usage. Which indicate that the HCFC of Freon are not green products and environmental protection products. While theoretically, the ODP (The Ozone Depletion Potential) of HFC of Freon is 0. But the Global warming potential (GWP) is very high. Therefore, the HFC of Freon are also not green products and environmental protection products. While China has been being the biggest and main producer and consumer of the banned CFC of Freon and the biggest and main producer and consumer of the HCFC and HFC of Freon. So Chinese air conditioners, ice chestn and refrigerators must make more Ozone Depletion and Global warming substances.

  • China must reform what she has been doing the critical wrong policy.

As China has been striving for “The Belt and Road initiative”, “Creating a community of shared future for mankind”, “Together for a Shared Future”. China must not be allowed to lead the world producing more and more Ozone Depletion and Global warming substances with shared future for mankind. Which must be shared to be warmed to death and destroying the Earth in the future [1,2].

Discussion and Conclusion

On this World Health Day (April 7, 2022), WHO is issuing an urgent call for accelerated action by leaders and all people to preserve and protect health and mitigate the climate crisis as part of an “Our planet, our health” campaign marking the organization’s founding day, which falls at a time of heightened conflict and fragility [2].

As the climate change and green house effect, global warming have been being heavy and heavy. Worse effects of the climate change and green house effect, global warming have been being suffered from by the mankind from beginning up to now. Now, the deadly COVID-19 has been being in pandemic and in killing  around the world more than two years. The pandemic and the killing have not had the syndrome of recovering. The root reason for the pandemic and the killing may the climate change, green house effect and global warming. The concrete policies must be created as soon as possible. How to do? The basic method must be value and treasure the talented people. Throw away unlawful competition and green-eyed monster.

The mankind and the Earth live on the real talent politicians.

Competing Interests

There are no competing interests. 

Funding Statement

The research supported by author himself.

References

  1. Air pollution. World Health Organization.
  2. WHO urges accelerated action to protect human health and combat the climate crisis at a time of heightened conflict and fragility. World Health Organization.
fig 1

Plasma Serotonin 2A Receptor Autoantibodies Predict Rapid, Substantial Decline in Neurocognitive Performance in Older Adult Veterans with TBI

DOI: 10.31038/EDMJ.2022614

Abstract

Aim: Traumatic brain injury (TBI) was associated with increased plasma serotonin 2A receptor (5-HT2AR) autoantibodies in adults who experienced neurodegenerative complications. We tested whether the baseline presence of plasma serotonin 2A receptor (5-HT2AR) autoantibodies was a significant predictor of the two-year rate of cognitive decline in middle-aged and older adult TBI.

Methods: Plasma from thirty-five middle-aged and older adult veterans (mean 65 years old) who had suffered traumatic brain injury was subjected to protein-A affinity chromatography. One-fortieth dilution of the resulting immunoglobulin (Ig) G fraction was tested for binding (in ELISA) to a linear synthetic peptide corresponding to the second extracellular loop region of the human 5-HT2A receptor. All available patients completed baseline and two-year follow-up neurocognitive tests of memory (St Louis University Mental Status), processing speed (Digit Symbol Substitution Test) and executive function (Trails-making Test, Part B). Change in cognitive performance was computed as (two-year – baseline) raw test score.

Results: Eighteen patients completed both baseline and two-year follow up neurocognitive tests. TBI patients harboring plasma 5-HT2AR autoantibodies at the baseline examination (n=13) did not differ significantly in their baseline clinical characteristics (age, education level) compared to TBI patients lacking baseline plasma autoantibodies (n=5). Plasma serotonin 2AR antibody-positive patients experienced a significantly greater post-baseline decline in performance on the St Louis University Mental Status test (P=0.0118) and in the Digit Symbol Substitution Test (P=0.011), but not in Trails-making Part B (P=0.129) compared to serotonin 2AR antibody-negative patients. In multivariable linear regression analyses that adjusted for age, baseline presence of plasma 5-HT2AR autoantibody was a significant predictor of the two-year rate of decline in memory, and processing speed. Binding of plasma autoantibody to the serotonin 2A receptor peptide in the enzyme linked immunosorbent assay was also significantly higher (at 1/160th titer of the protein-A eluate= 1 µg/mL IgG) in TBI patients harboring vs. those not harboring baseline plasma 5-HT2AR autoantibodies.

Conclusion: These data suggest that plasma 5-hydroxytryptamine 2A receptor autoantibodies which were increased in approximately two-thirds of middle-aged and older adults following traumatic brain injury predicts rapid and substantial declines in cognitive function (memory and processing speed), independent of age.

Introduction

The human serotonin 2A receptor (5HT2AR) plays a diverse role in cognition, learning and memory, appetite, and mood regulation [1]. In human post-mortem [2] and imaging studies [3] from Alzheimer’s dementia patients, 5HT2AR receptor binding was decreased generally in cerebral cortex [3] and in specific brain regions, i.e. temporal lobe [2] subserving memory. On the other hand, 5-HT2AR binding was increased in the temporal lobe from patients with vascular dementia compared to age-matched individuals [4].

A role for dysregulation of central 5-HT2AR signaling in Alzheimer’s dementia and the underlying mechanism is still poorly understood. We reported spontaneously occurring neurotoxic plasma IgG autoantibodies in older adults suffering with certain neurodegenerative disorders, e.g. Parkinson’s disease and dementia [5], including lifelong  traumatic brain injury, sufferers affected with these specific neurodegenerative disorders [6]. The IgG autoantibodies displayed increased binding to   a synthetic peptide corresponding to the second extracellular loop of the 5HT2AR and they caused accelerated  neuroblastoma  cell death  in cell culture [5,7] by a mechanism involving sustained activation of G-protein coupled PLC/IP3R/Ca2+ signaling [5,7]. Here we tested a hypothesis that baseline presence of the agonist serotonin 2A receptor IgG autoantibodies in plasma in older adult TBI-sufferers predicts accelerated decline in neurocognitive functioning. There is currently no plasma biomarker(s) that can predict accelerated cognitive decline following TBI. We used a battery of neuropsychological tests performed at baseline and repeated two years later to test whether the baseline presence (vs.absence) of plasma serotonin 2A receptor autoantibodies predicts the rate of decline in working memory, processing speed and/or executive function in thirty-five middle-aged and older adult men veterans who had suffered a TBI.

Patients

Thirty-five middle-aged and older adult men (> 50 years old) were enrolled in the study between Sept 2019 and March 2020. A local Institutional Board Review-approved consent was obtained in all study participants prior to initiating study procedures. The patients underwent baseline blood drawing in the morning followed by administration of three neuropsychological tests (St. Louis University Mental Status, Digit Symbol Substitution Test, and the Trails-Making Test Part B). Each of the cognitive tests was repeated at mean interval of 2 years (range 22-26 months) following baseline testing. The baseline clinical characteristics in the study cohort were previously reported [6]. Most patients had suffered a mild direct force TBI. A few patients had a history of moderate TBI with loss of consciousness > 30 minutes or longer. Five patients reported multiple TBI exposures.

Blood Drawing

Blood was drawn in the morning after an overnight fast. Plasma or serum was stored at -20°C or used immediately in protein-A affinity chromatography to obtain IgG fraction.

Protein-A Affinity Chromatography

Protein A chromatography was carried out as previously reported [5].

Human Serotonin 2A Receptor Peptide

An 18-meric linear synthetic peptide corresponding to the second extracellular loop of the human 5-HT2AR was synthesized at Lifetein, Inc (Hillsborough, NJ), catalog number 701781. It had purity of 95% or greater.

Enzyme Linked Immunosorbent Assay for 5-HT2AR Autoantibodies

Linear synthetic human 5-HT2AR receptor  peptide  was  used as the solid phase antigen. A 1/40th dilution of human protein-A eluate fraction was incubated in the presence of antigen as previously described [7]. Binding more than two-fold above assay background level (blank= 0.05 absorbance units, AU) was defined as indicative of the baseline ‘presence’ of 5-HT2AR plasma autoantibodies. In a subset of patients, serial dilution of protein A eluate fraction (1/40th, 1/160th, 1/320th) was performed to assess the autoantibody titer.

Protein Concentration

Protein concentration was determined using a bicinchoninic assay (Thermo-Fischer, Inc) as previously reported [5].

Neuropsychological Tests

The St. Louis Mental Status examination [8], digit symbol substitution test [9] and the Trails-making Test, Part B (TMT-B) [10,11] were administered at baseline and repeated at the two-year study interval. Change in neurocognitive test scores was calculated as the difference between year 2 and baseline raw scores. A negative value for the difference is indicative of a decline in cognitive test performance (SLUMs, and DSST).

Higher raw score in the TMT-B is indicative of worse cognitive performance. Lay staff was trained in the administration of neuropsychological test battery prior to testing study participants. Normative data for the TMT-B, adjusted for age and education level [12], were used to convert raw scores to a scaled score in order to make comparison between the present results and results reported in non- TBI population having similar mean age and co-morbidities [13].

Medication Use

Medications to treat highly prevalent conditions, e.g. diabetes (78%) included a wide range of different classes including insulin, incretins, GLP- 1 agonists, and SGLT2 inhibitors. Baseline anti-depressant medication use (in 33% of patients) included: selective serotonin reuptake inhibitors, tetracyclic antidepressants, and atypical antipsychotics.

Statistics

Comparisons were made using paired t-test (Tables 1, 2 and Figure 3); multivariable linear regression analysis was conducted using SAS 9.4 (SAS Institute Inc, Cary, NC) (Tables 3-5).

Table 1: Baseline characteristics in eighteen male TBI patients who completed baseline and 2-year follow up cognitive testing.

Risk factor

Antibody (13) No Antibody (5)

P-value

Serotonin 2AR peptide binding (AU)+

0.129 ± 0.029

0.07 ± 0.02

0.001*

Age (years)

66.4 ± 7.5

63.8 ± 9.3

0.56*

Beck depression inventory

19.2 ± 10.4

14.4 ± 13.5

0.47

Education (12+ yrs) (yes/no)

12/1

5/0

1.00^

Diabetes (yes/no)

11/2

3/2

0.53

Hypertension (yes/no)

8/5

3/2

1.00

Moderate-severe obesity (BMI >/=34 kg/ m2)(yes/no)

5/8

1/4

0.62

Antidepressant med (yes/no)

4/9

2/3

1.00

Results are mean ± SD or number; AU-absorbance units +Binding to an 18-meric linear synthetic peptide comprised of the 2nd extracellular loop of the human serotonin 2A receptor in a 1/40th dilution of the protein-A eluate of plasma was determined as described in Materials & Methods.
*Student’s t-test.
^Fischer’s exact test.

Table 2: Mean two-year change in cognitive test performance on the St. Louis University Mental Status, Digit Symbol Substitution test, and Trails Making Test Part B according to baseline presence or absence of plasma autoantibody binding to serotonin 2A receptor peptide.

Test

Antibody No Antibody

P-value*

SLUMS

-4.5 + 3.26 (13)

-0.6 + 1.14 (5)

0.018

DSST

-5.45 + 5.0 (11)

2.25 + 1.71 (4)

0.011

TMT-B

51.45 +58.3 (11)

1.25 + 29.6 (4)

0.129

*Student’s t-test. Results are mean ± SD.
( ) number of participants.
SLUMS- St Louis University Mental Status test. DSST- Digit Symbol Substitution test.
TMT-B Trails-making Test Part B.

Table 3: Age-adjusted model of risk factors associated with 2-year change in St. Louis University mental status exam in male TBI sufferers.

Estimate

Standard Error

P-value

Age (years)

-0.048

0.089

0.598

Serotonin2AR Antibody (present/absent)

-3.712

1.527

0.028

N=18 TBI patients.

Table 4: Age-adjusted model of risk factors associated with 2-year change in Digit Symbol Substitution test score in male TBI sufferers.

Estimate

Standard Error

P-value

Age (years)

-0.143

0.1449

0.343

Serotonin2AR Antibody (present/absent)

-7.711

2.591

0.012

N=15 TBI patients.

Table 5: Age-adjusted model of risk factors associated with 2-year change in Trails making Test Part B score in male TBI sufferers.

Estimate

Standard Error

P-value

Age (years)

-0.6407

1.679

0.7095

Serotonin2AR Antibody (present/absent)

51.67

32.28

0.135

N=15 TBI patients.

Results

Baseline Clinical Characteristics in Older Adult Male TBI Cohort

The thirty-five TBI patients who underwent baseline blood drawing for autoantibody determination had mean age of 64.8 ± 8.4 years (not shown in Table 1). Total 18 patients completed both baseline and at least one of the three neuropsychological tests at    the two-year follow-up visit. In thirteen patients a 2-year change in neurocognitive function could not be determined for several reasons: three patients failed to undergo baseline cognitive testing, two older patients (both having PD) died prior to their 2-year follow-up testing date, and eight patients were ‘lost to follow-up testing’ because of transportation or another social issue. In four additional patients, data was excluded either because of a co-morbid CNS pathology (e.g. focal cortical deficit, lacunar infarcts) independently associated with progressive cognitive decline (n=3) or because baseline plasma autoantibody neurotoxicity had specificity for a different G-protein coupled receptor than 5HT2AR (n=1).

Mean plasma autoantibody binding to a serotonin 2A receptor peptide corresponding to the second extracellular loop was significantly increased in patients having baseline autoantibody vs. those lacking baseline autoantibody (0.129 ± 0.029 vs. 0.07 ± 0.02; P= 0.001; Table 1). Patients having or not having baseline 5-HT2AR peptide plasma autoantibodies did not differ significantly in their mean age, education level, medical co-morbidities, baseline depressive symptoms (Beck Depression Inventory score) or anti-depressant medication use (Table 1). Association between baseline presence of 5HT2AR autoantibodies and 2-year cognitive change we next compared mean change in the individual two-year neurocognitive test score in patient who had presence or absence of baseline plasma 5-HT2AR autoantibodies. Baseline presence of autoantibodies was associated with significantly larger mean decrease in test performance in the St. Louis University Mental Status Exam (P=0.018), and in the Digit Symbol Substitution Test (P= 0.011; Table 2) after two years follow-up. There was no significant difference in mean (two-year) change in Trails-Making Test, Part B test score in patient subgroups having vs. lacking baseline autoantibodies (Table 2).

These findings are further illustrated in Figures 1 and 2. Baseline and two-year SLUMs  test scores were relatively stable and unchanged  in all five TBI patients who lacked plasma 5-HT2AR peptide binding autoantibodies (Figure 1A). SLUMs scores fell sharply over the same two- year interval in eleven of thirteen patients who had baseline significant autoantibody (Figure 1B). Five of eleven antibody-positive patients experienced a substantially large two-year decline in test score to result in having met or exceeded the test’s diagnostic threshold for ‘dementia.’

fig 1

Figure 1: Change in SLUMS test performance in TBI patients in the absence A) or presence B) of baseline plasma serotonin 2A receptor autoantibodies.

Antibody-positive, TBI patients also experienced a significant decline in Digit Symbol Substitution test performance after two years (Figure 2A). The (two-year) DSST test performance was stable or improved somewhat in patients lacking baseline plasma 5-HT2AR peptide binding autoantibodies (Figure 2B).

fig 2

Figure 2: Change in Digit Symbol Substitution Test Performance in TBI patients having A) low, undetectable or B) present baseline plasma serotonin 2A receptor autoantibodies.

Best-fitting Model of Predictors of Cognitive Decline in Adult TBI

In multivariable linear regression analysis that adjusted for age, baseline presence (vs.absence) of 5-HT2A receptor peptide binding autoantibody was a significant predictor ((P=0.028) of the rate of decline in SLUMS test performance (Table 3). Serotonin 2A receptor peptide autoantibody positivity was also a significant predictor (P=0.0116) of the rate of decline in DSST test performance (Table 4), but it did not significantly predict (P=0.139) the rate of decline  in Trail-making Test Part B performance (Table 5). Baseline diabetes, hypertension, moderate-severe obesity, depressive symptomatology (Beck depression inventory score) or anti-depressant  medication  use  was  not  significantly  associated  with  the  rate  of  decline    in neurocognitive test performance. There was no significant interaction effect of (age x baseline antibody presence) on the rate of neurocognitive decline.

Titer in Representative Autoantibody-positive or -negative TBI Patients

Protein-A eluate was assayed  at  two  different  concentrations in a subset of antibody-positive (n=3) and antibody-negative (n=2) patients. Mean binding to the 5-HT2AR linear synthetic peptide enzyme linked immunosorbent assay (ELISA) was significantly higher (P<0.05) in ~1 µg/mL concentration (1/160th dilution) of IgG obtained from three ‘antibody-positive’ TBI patients compared to   an identical concentration of IgG from two ‘antibody-negative’ TBI patients (Figure 3).

fig 3

Figure 3: Titer of plasma serotonin 2A receptor autoantibodies in representative patients having baseline low, undetectable or elevated autoantibodies. Protein-A eluates from three representative antibody-positive or two representative antibody-negative patient plasmas were assayed at the indicated dilutions in the serotonin 2A receptor peptide ELISA as described in Materials and Methods. Mean binding in the ELISA (at 1/160th dilution=~1 µg/mL IgG) of the protein-A eluate from patients having baseline autoantibodies was significantly increased (*P < 0.05) compared to patients not having baseline autoantibodies.

Discussion

Chronic inflammation is a hallmark feature in sporadic forms of human neurodegenerative diseases, including Parkinson’s disease and Alzheimer’s dementia. Systemic inflammation was associated with increased plasma serotonin 2A receptor autoantibodies in a number of different disease conditions [5,7,14] including TBI [6].

The present finding that (binding in an enzyme linked immunosorbent assay (ELISA) specific for the 5HT2AR second extracellular loop) identified plasma serotonin 2A receptor autoantibodies as a predictive biomarker of accelerated cognitive decline in a subset of middle-aged and older adult male TBI patients may have future utility in health monitoring post-TBI exposure.

Baseline plasma serotonin-2A receptor autoantibody positivity likely reflects long-lasting effects from IgG autoantibodies, which exerted both potent endothelial toxicity and neurotoxicity in cell culture experiments [5]. Much larger studies in more diverse populations are needed  to  confirm  whether  the  steep  trajectory  of decline  in  neurocognitive  performance  (observed  in  older male veterans harboring serotonin 2A receptor agonist  antibody) and having multiple co-morbidities may be experienced by other populations. Diabetes, hypertension and obesity may promote peripheral inflammation, which could drive (in part) autoantibody formation. We used published age- and education-adjusted TMT-B test scores from the Veterans Affairs Diabetes Trial, a study in a large non-TBI population of older adult advanced type 2 diabetes (mean age 60 year) [13] as comparison to the current TBI population having similar age and metabolic co-morbidities. Plasma serotonin 2A receptor autoantibody-positive TBI patients experienced approximately 3.4-fold greater decline in age- and education-scale TMT-B performance after only two years compared to the five-year decline in TMT-B performance reported in a non-TBI, obese, diabetic hypertensive population [13]. This suggests that prevalent medical co-morbidities, diabetes, obesity, hypertension, may not contribute much to the substantial decline experienced by TBI patients harboring serotonin 2A receptor autoantibodies.

Although all three neurocognitive tests measure different cognitive domains: TMT-B-executive function, DSST-processing speed, and SLUMS-short-term episodic and working memory, each test is sensitive to decreased cognitive functioning resulting from impaired brain functioning. Perhaps owing to larger variance in TMT-B test performance (compared to other two tests) a larger sample size may be required to have adequate power to detect a statistically significant difference in two-year rate of test performance between serotonin 2A receptor plasma autoantibody-positive vs.antibody-negative patients.

Vascular dementia (normally less common than Alzheimer’s dementia in the general population) may have been increased because of the high prevalence of vascular risk factors in our population [15]. Eight of thirty-five patients had incidental brain imaging studies which revealed evidence of small or large vessel disease. Among them, three patients had brain imaging findings (lacunar infarcts, large volume loss) and/or cardiovascular risk factors suggesting probable vascular- type dementia. All three patients had baseline SLUMs test score in the range of dementia, and baseline plasma was negative for the presence of 5-HT2AR autoantibodies. Aging and Alzheimer’s dementia (AD) are associated with increased blood brain barrier permeability [16,17] and ‘small vessel disease’ may coexist together with AD. Three of four patients in our study who demonstrated MRI ‘white matter hyper intensities’ which is an early marker of small vessel disease predictive of progressive cognitive decline [15] harbored elevated plasma serotonin 2A receptor autoantibodies in the circulation. Serotonin  2A receptor agonist autoantibodies display potent endothelial cell toxicity in vitro [5] suggesting they could have a role in increased microvascular permeability underlying small vessel disease in a subset of stroke/dementia patients [18].

The second extracellular loop of the serotonin 2A receptor is a conserved region [19] located near the receptor orthostatic binding pocket, which is thought to play a role in preventing constitutive GPCR receptor activation [19]. Plasma autoantibodies, which display increased binding in this GPCR regulatory region of the 5HT2AR caused neuroblastoma and endothelial cell death via long-lasting activation of Gq11/IP3R/Ca2+ signaling. Sequence alignment in the trace amine family of conserved GPCRs [19] indicates that the alpha1 adrenergic receptor family of GPCRs share considerable homology to the 5-HT2AR in a second extracellular loop sub region adjacent  to a highly conserved cysteine residue. Because alpha 1 adrenergic receptor activation typically is positively coupled to Gq11/IP3R/Ca2+ signaling we explored whether any of the TBI plasma IgG autoantibodies may be comprised of additional (alpha1adreneric) receptor-targeting specificity We used an acute neurite retraction assay [5] in which the phenotypic response was completely inhibitable by antagonists of Gq11/IP3R/Ca2+  pathway  signaling  molecules or Rho A/Rho kinase to screen the protein-A eluates from thirty of thirty-five TBI patients’ plasma. Specificity for either the 5-HT2AR or alpha 1 adrenergic receptor was determined by the ability of several hundreds’ Nano molar concentration of a highly selective antagonist, prazosin (alpha 1 AR) or M100907 (5-HT2AR) to substantially (70% or more) prevent IgG-evoked neurite retraction. The protein-A eluate from one TBI patient who suffered multiple TBI exposures and experienced progressive cognitive decline appeared to harbor only alpha1 AR-targeting IgG, lacking either 5-HT2AR-like bioactivity (in vitro) or binding to the 5-HT2AR peptide in the ELISA. Protein-A eluate(s) from four other patients (two of whom had also experienced repetitive TBI exposures, i.e. athletic neurotrauma harbored both alpha 1 AR- and 5-HT2AR-targeting IgG, and the titer of 5-HT2AR autoantibodies was significantly increased compared to that in plasma from single TBI patients [6]. Taken together, these data suggest that repetitive TBI and chronic neuroinflammation may promote ‘epitope spreading’ to include one or more closely related antigens belonging to the conserved, trace amine superfamily of GPCRs, which can positively couple to Gq11/IP3R/Ca2+ signaling. An enzyme-linked immunosorbent assay which specifically detects binding to the second extracellular loop sub region in the alpha1 adrenergic receptor homologous to the region in the 5-HT2AR (targeted by nearly all TBI autoantibodies) could provide a direct test for this possibility.

The present study has several limitations including its small size and relatively homogeneous patient population. The findings may only reflect the experience of middle-aged and older men patients who suffered a single or repetitive direct force, mild TBI exposures.

To our knowledge, this is the first report that plasma 5-HT2AR neurotoxic autoantibodies (determined in an epitope-specific ELISA) [7] appear to predict rapid substantial decline in neurocognitive performance in middle-aged and older adult men TBI sufferers. Traditional risk factors which present in midlife, e.g. hypertension [20] are thought to promote accelerated cognitive decline for several decades prior to observable clinical effects. A plasma biomarker that predicts rapid decline in neurocognitive function may enable earlier identification of a high-risk subset of TBI patients for closer health monitoring and avoidance of ongoing TBI exposures. Since G-protein, coupled receptors are highly druggable targets the availability of a predictive plasma biomarker could assist in the future evaluation of candidate drug therapies aimed at slowing neurodegeneration in TBI- sufferers.

Acknowledgements

This work is Supported by a grant from the New Jersey Commission on Brain Injury Research NJCBIRPIL007 to MZ.

References

  1. Zhang G, Stackman RW Jr (2015) The role of serotonin 5-HT2A receptors in memory and cognition. Front Pharmacol. 6: 225. [crossref]
  2. Lai MK, Tsang SW, Alder JT, et (2005) Loss of serotonin 5-HT2A receptors in the postmortem temporal cortex correlates with rate of cognitive decline in Alzheimer’s disease. Psychopharmacology. 179(3): 673-677. [crossref]
  3. Blin J, Baron JC, Dubois B, et (1993) Loss of brain 5-HT2 receptors in Alzheimer’s disease. In vivo assessment with positron emission tomography and [18F] setoperone. Brain. 116 (3): 497-510. [crossref]
  4. Elliott MS, Ballard CG, Kalaria RN, et al. (2009) Increased binding to 5-HT1A and 5-HT2A receptors is associated with large vessel infarction and relative preservation of cognition. Brain. 132(7): 1858-1865. [crossref]
  5. Zimering MB (2018) Circulating Neurotoxic 5-HT2A Receptor Agonist Autoantibodies in Adult Type 2 Diabetes with Parkinson’s J Endocrinol Diabetes. 5(2). [crossref]
  6. Zimering MB, Pulikeyil AT, Myers CE, et al. (2020) Serotonin 2A Receptor Autoantibodies Increase in Adult Traumatic Brain Injury In Association with Neurodegeneration. J Endocrinol Diabetes. 7(1): 1-8. [crossref]
  7. Zimering MB (2019) Autoantibodies in Type-2 Diabetes having Neurovascular Complications Bind to the Second Extracellular Loop of the 5-Hydroxytryptamine 2A Endocrinol Diabetes Metab J. 3(4): 118. [crossref]
  8. Tariq SH, Tumosa N, Chibnall JT, et al. (2006) Comparison of the Saint Louis University mental status examination and the Mini-Mental State Examination for detecting dementia and mild neurocognitive disorder-a pilot Am J Geriatr Psychiatry. 14(11): 900-910. [crossref]
  9. Wechsler D (2008) WAIS-III Administration and Scoring Manual. San Antonio, TX: Psychological Corporation. [crossref]
  10. Lezak MD, Howieson DB, Bigler ED, et (2012) Neuropsychological Assessment. 5th ed New York: Oxford University Press.
  11. Strauss E, Sherman EMS, Spreen O (2006) A Compendium of Neuropsychological Tests: Administration, Norms, and Commentary. [crossref]
  12. Tombaugh TN (2004) Trail making test A and B: normative data stratified by age and education. Arch Clin Neuropsychol. 19: 203-214. [crossref]
  13. Zimering MB, Knight J, Ge L, et al. (2016) VADT Predictors of Cognitive Decline in Older Adult Type 2 Diabetes from the Veterans Affairs Diabetes Trial. Front Endocrinol(Lausanne). 7: 123. [crossref]
  14. Zimering MB (2021) Severe COVID-19 Pneumonia  is  Associated  with  Increased Plasma Immunoglobulin G Agonist Autoantibodies Targeting the 5-Hydroxytryptamine 2A Endocrinol Diabetes Metab J. 5(1): 1-9. [crossref]
  15. Debette S, Seshadri S, Beiser A, et al. (2011) Midlife vascular risk factor exposure accelerates structural brain aging and cognitive decline. Neurology. 77(5): 461-468. [crossref]
  16. Farrall AJ, Wardlaw JM (2009) Blood-brain barrier: ageing and microvascular disease–systematic review and meta-analysis. Neurobiol Aging. 30(3): 337-352. [crossref]
  17. Black S, Gao F, Bilbao J (2009) Understanding white matter disease: imaging- pathological correlations in vascular cognitive impairment. Stroke. 40(3): S48-S52. [crossref]
  18. Zimering MB (2010) Recurrent macular edema and stroke syndrome in type 1 diabetes mellitus with potent endothelial cell inhibitory autoantibodies. Endocr Pract. 16(5): 842-850. [crossref]
  19. Michino M, Beuming T, Donthamsetti P, et al. (2015) What can crystal structures of aminergic receptors tell us about designing subtype-selective ligands?. Pharmacol Rev. 67(1): 198-213. [crossref]
  20. Swan GE, DeCarli C, Miller BL, et (1998) Association of midlife blood pressure to late-life cognitive decline and brain morphology. Neurology. 51: 986-993. [crossref]
fig 10

Anti-Inflammatory, Antinociceptive and Toxicological Properties of Uvaria comperei Stem Crude Extract and Fractions

DOI: 10.31038/JPPR.2022533

Abstract

Uvaria comperei is a plant of the Annonaceae family listed as one of the most diversified plant families in the tropical environment. The present study was carried out to investigate the anti-inflammatory activity of a methanolic extract and fractions of stems of Uvaria comperei. The crude extract was obtained by maceration of the powder in methanol and fractions by vacuum chromatography from the methanolic extract. To study the anti-inflammatory activity in vitro, red blood cell lysis inhibition assay and albumin denaturation inhibition were performed, while in vivo measurements of carrageenan-induced paw oedema and formalin-induced pain in albino mice were performed. Acute toxicity and cytotoxicity studies of the fraction F2 were performed    and some biochemical parameters were measured. The Uvaria comperei crude extract (UCCE) at 250 and 500 µg/mL completely inhibited albumin denaturation, while decreasing 75.5% heat blood cell lysis at 500 µg/mL. The fractions 128-136 (F3), 10-11 (F1), and 56-62 (F2) at 500 µg/mL displayed a significant anti-inflammatory activity with a percentage of inhibition of 60.5, 67.4, and 100%, respectively. Pre-treatment with fraction F2 produced a dose-dependent (p<0.05) inhibition of formalin-induced pain in both neurogenic and inflammatory phases. Similarly, the time-dependent increase in carrageenan-induced paw circumference was inhibited by pre-treatment with F2: 50% of inhibition at 25 mg/kg after 30 min (p<0.05), and 96.5% inhibition at 25 mg/kg after 6 h (p<0.05). In this research, the fraction F2 presented its best analgesic property at 50 mg/kg, while producing its highest anti-inflammatory property at 25 mg/kg. The oral lethal dose 50 (LD50) of F2 was determined to be greater than 2000 mg/kg. Overall, this work shows that the methanolic crude extract and fractions, mainly F2, of Uvaria comperei stem have noticeable anti-inflammatory properties, and could be a potential source of anti-inflammatory compounds.

Keywords

Uvaria comperei, HPLC, Antinociceptive, Anti-inflammatory, Toxicity

Introduction

SeveralspeciesbelongingtotheAnnonaceaefamilyarewidelyknown and used in folk medicine and commercialized as phytomedicines. Among them, plants of the genus Uvaria are  traditionally used for the treatment of dysentery, wounds, abdominal ache, and malaria [1]. However, very few ethnobotanical and pharmacological studies have been conducted on Uvaria comperei species despite its high bioactivity properties [2,3].Uvaria comperei is a liana with a blackish bark. The leaves are long-stalked and long, wide limbs rounded at the base. The yellowish, solitary flowers have a long pedicel, long and wide petals and obtuse at the top, small sepals, broadly ovate, wide, welded at  the base, the surface of which is covered with long, soft, crisscrossed, and frizzy hairs. The stamens are very numerous at about 1.5 mm long. Fruits with long pedicels; mericarps smooth, ellipsoid, yellow-green when fresh, and blackish brown when dry. The seeds, wide, are biseriate, in the shape of a flattened ellipsoid and with a brown testa, finely honey-combed [4]. The Uvaria comperei contains a wide variety of secondary metabolites, mainly phenolic compounds [2,3]. Phenolic compounds are a well-known group of secondary metabolites with various pharmacological activities [5]. According to Loomis and Battaile [6] phenols belong to either one of two biochemical  groups: (1) flavonoid compounds (including condensed tannins), and (2) the group of compounds where the 6-carbon ring has a 1 or 3 carbon  side chain and its derivatives, e.g. caffeic acid, gallic acid, hydrolysable tannins, and lignin. Flavonoids and phenolic acids are the important secondary metabolites and bioactive compounds in plants [7]. Flavonoids are an important coloring component of flowering plants, and are found in several plant-based foods [8]. In nutrients, flavonoids are generally responsible for color, taste, prevention of fat oxidation, and protection of vitamins and enzymes. Furthermore, flavonoids are important for human health due to their pharmacological activities as radical scavengers [9]. Several epidemiological studies also suggested protective effects against cardiovascular diseases, cancer, and other age-related diseases [9]. Some flavonoids have been reported to have a variety of biological activities, including antiallergic, antiviral, antiproliferative, anticarcinogenic, and anti-inflammatory activities [10]. Inflammation is a complex biological response in which vascular tissues respond to harmful stimuli such as irritants, pathogens, and damaged cells [11]. Inflammation is commonly divided into three phases: acute inflammation, immune system response, and finally chronic inflammation [12-14]. The inflammation response implicates macrophages and neutrophils that secrete a number of mediators (eicosanoids, oxidants, cytokines and lytic enzymes) responsible for the initiation, progression and persistence of the acute or chronic state of inflammation [15]. Following the release of these mediators, inflammatory processes cause tissue damage accompanied by pain. Researchers are still battling to develop more effective and less toxic agents to treat signs and symptoms of acute inflammation, as well as the consequences of chronic inflammatory diseases such as pain. The search for new drugs capable of disrupting the inflammatory process is an important issue in scientific research, mainly from natural substances. The purpose of this research was to study the antinociceptive and anti- inflammatory potential of extracts and fractions of Uvaria comperei stems.

Materials and Methods

Animals

Swiss mice (20-30 g) and Wistar rats (100-150 g), raised in the Animal house of the Animal Physiology laboratory, Faculty of Science, University of Yaoundé I (Cameroon), were used. They were fed with a standard laboratory diet and allowed access to tap water ad libitum. Animals were randomly housed in appropriate cages at room temperature and subjected to a natural day/night cycle. Animals were handled following the Guide for the Care and Use of Laboratory Animals, published by the US National Institutes of Health (NIH publication 85-23, revised 1996). The authorization for the use of laboratory animals in this study was obtained from the Cameroon National Ethics Committee (number FWA-IRB00001954).

Plant Collection

The Uvaria comperei plant was harvested in February 2013 in Kalla Mount in the central region of Cameroon and identified by the botanist Dr Nana. A voucher specimen of the plant (52882/HNC) has been deposited at the Cameroon National Herbarium in Yaoundé.

Extract Preparation

Fresh stems were chopped, air dried and ground into powder. Hundred grams of powder were introduced into a conical flask and soaked for three days in 500 mL of methanol at room temperature. The resulting mixture was filtered through a filter paper (Whatman No. 3) and then roto-evaporated until complete alcohol evaporation was obtained.

Fractionation of Methanolic Extract

The stem methanolic extract was fractionated by vacuum chromatography using silica gel 40 (0.2-0.5 mm) and eluted with solvents of increasing polarity: hexane (Hex), ethyl acetate (EtOAc) and methanol (MeOH), leading to several fractions. The elution was done successively with a gradient system of Hex-Hex/EtOAc-EtOAc- EtOAc/MeOH-MeOH (from 100% hexane to 100% methanol). Each elution (400 mL) was evaporated to dryness under reduced pressure and 202 fractions were obtained and grouped according to their thin- layer chromatographic profile using Merk 60 F254 silica gel 60 F254 (Merck, USA) to obtain 28 new fractions. UV light (λmax=254 nm, 366 nm) and 50% aqueous sulfuric acid were used to visualize TLC plates. The three fractions (F1, F2, F3) that had appreciable antioxidant activity [2] were successively tested to detect their antinociceptive and anti-inflammatory activities.

In vitro Assays

Inhibition of Albumin Denaturation

The method of Vidhu  et al. [16] and Sangita et al. [17] was   used for the denaturation protein assay. A solution of BSA (10 mg/ mL) was prepared in phosphate buffer at pH 7.4. Stock solutions of crude extract, fractions, and diclofenac (the reference  standard)  were prepared at 1 mg/mL. From these stock solutions, five different concentrations (31.25, 62.50, 125, 250 and 500 µg/mL) were obtained. A volume of 0.2 mL of BSA was transferred to Eppendorf tubes, then 2 mL of extract or standard at different concentrations was added, and then 2.8 mL of PBS were added for a total volume of 5 mL. Controls were prepared without extracts (instead of 2 mL of extract were added 2 mL of PBS). The solutions were incubated at 37°C for 30 min and heated at 70°C for 15 min. The absorbance (Abs) was determined at 660 nm. The percentage of inhibition of protein denaturation was determined on a percentage basis relative to the control, using the following formula.

page 2

Antihemolytic Activity

Red Blood Cell Suspension

The method of Azeen et al. [18] was used for red blood cell   lysis with some modifications. Rat blood was obtained by puncture, collected in heparinized tubes, and centrifuged at 3000 rpm for 15 min. Then plasma was removed and red blood cells (RBCs) were washed three successive times using saline solution.

Heat-induced Haemolysis

Stock solutions of crude extract, fractions and standards (diclofenac and ibuprofen) were prepared at 1 mg/mL. From these stock solutions, five different concentrations (31.25, 62.50, 125, 250 and 500 µg/mL) were obtained. In each test tube, 500 µL of NaCl were added consecutively with 500 µL of extract or each fraction, 500 µL of buffer solution, and finally 500 µL of RBC suspension. The test tubes were homogenized. The reaction mixture was incubated in a 56°C water bath for 30 min. After incubation, the tubes were cooled under running tap water, then centrifuged at 3000 rpm for 10 min and the absorbance of the supernatants was assessed at 560 nm. The controls were prepared without extract or fractions. The percentage of protection against heat-induced haemolysis was calculated using the following formula.

page 3(1)

Based on these data, only the fraction F2 that had the highest activity was selected for in vivo studies.

In vivo Assays

Formalin Assay

To assess the antinociceptive effect, the method described by Hunskaar and Hole [19] was used. A volume of 20 μL of 1% formalin solution was injected into the subplantar left hind paw  of  mice. Mice were observed and the amount of time (seconds) spent licking and biting the injected paw was measured as an indicator of pain. Responses were measured for 5 min after formalin injection (first phase, neurogenic phase), and 15-30 min after formalin injection (second phase, inflammatory phase). Treatments with saline (p.o.), fraction F2 (25, 50, and 100 mg/kg, p.o.), indomethacin (10 mg/ kg, p.o.) were administered 30 min before formalin injection (n = 6 for each group). The percentage of antinociceptive activity was determined using the following formula [20].

page 3(2)

PAA: percentage of antinociceptive activity, Tn: licking time of the control group, and Tt: licking time of each tested group.

Carrageenan-induced Hind Rat Paw Edema Assay

Anti-inflammatory activity was studied using the model of 1% carrageenan-induced paw edema induced by a 1% carrageenan solution, injected at a volume of 100 μL/animal into the subplantar region of the right hind paw of the rats [21]. The rats were divided into six groups, each of six animals. Rats were pretreated with fraction F2 (25, 50, and 100 mg/kg, p.o.), saline (p.o.) or indomethacin (10 mg/kg, p.o.) 30 min before carrageenan injection. The volume of the rat pedal was measured at 0.5, 1, 2, 3, 4, 5, and 6 h after carrageenan injection. The inhibition of the edema paw was calculated using the formula:

VB-VA/VA, where VA is the volume of the right hind paw before carrageenan injection, and VB is the volume of the right hind paw after carrageenan injection.

Biochemical Parameter Analysis

After the carrageenan assay, the animals were sacrificed and blood was collected in heparinized tubes and centrifuged at 3000 rpm for 30 min to obtain serum. Alanine aminotransferase (ALT), aspartate aminotransferase (AST), γ-glutamyl tra n sp ep tid as e (γ GT) and catalase (CAT), as well as reduced glutathione (GSH) and reactive protein (CRP) were determined using commercial assay kits (Randox, UK) according to the manufacturer’s protocol.

Cytotoxicity Assay

Cell Culture

African green monkey kidney cells (Vero) (ATCC CRL 1586) and macrophages (RAW 264.7) (ATCC TIB-71) were cultured in DMEM medium containing 10% fetal bovine serum (FBS) and 1% penicillin- streptomycin. Complete DMEM medium (500 µL) was prepared with 50 µL of FBS, 5 µL of antibiotic, and 445 µL of simple DMEM medium.

Resazurin Reduction Assay

The cytotoxicity study was performed by a resazurin reduction assay on Vero and RAW cell lines according to the protocol of kuete et al. [22] and O’Brien et al. [23]. This assay is based on the reduction of the indicator dye, resazurin, to highly fluorescent resorufin by viable cells. Non-viable cells rapidly lose metabolic capacity to reduce resazurin and thus produce no fluorescent signal. Briefly, adherent cells were removed by trypsin treatment, incubated at 37°C for 5 min. Then, trypsin was deactivated by adding complete DMEM and the solution was centrifuged. An aliquot of 10,000 cells was placed in each well of a 96-well cell culture plate (100 μL). The microplates were incubated at 37°C overnight. After incubation, the medium was removed from each well and 90 µL of fresh, complete DMEM medium and 10 µL of fraction solution were  added.  The  plates  were  then  incubated at 37°C for 44 h. Fluorescence was measured on an Infinite M2000 Pro™ plate reader (Tecan, Germany) using an excitation wavelength of 530 nm and an emission wavelength of 590 nm. Each assay was performed at least three times, with six replicates each. Viability was evaluated on a comparison with untreated cells. IC50 values represent the concentration required to inhibit 50% of cell proliferation.

Acute Toxicity Study

The estimation of the oral median lethal dose (LD50) of the fraction was determined in female mice using the OECD Guideline 425 [24]. A limit toxicity test of a single dose of 2000 mg/kg body weight was used. Four hours before the toxicity tests, the animals were deprived of food and water. After weighing the mice, three groups of three mice were constituted as follows: Group 1 control lot received only the dissolution solvent, Group 2 mice received the fraction F2 from Uvaria comperei extract at 2000 mg/kg, and Group 3 mice received only food and water. After administration of a unique dose of F2, mice were monitored and individually observed every 30 minutes, during the day, and then daily for 14 days.

High-Performance Liquid Chromatography with Diode Array Detection Analysis

High performance liquid chromatography (HPLC) analysis was performed using a Waters Corporation, USA, HPLC system consisting of a Waters 1525 binary HPLC pump and a Waters 2998 photodiode array detector. Separation was carried out on an XTerra RP 18 column (4.6 mmx 15 mmx 3.5 μm, Waters, USA). Gradient elution was performed at 25°C with solution A (water and 1% acetic acid) and solution B (methanol and 5% acetic acid) in the following gradient from 0% to 100% solution B in 50 min. The flow rate was 1 mL/min and the injection volume was 20 μL. The peaks were detected at the wavelengths of 240, 340 and 380 nm. Before injection, each sample (1 mg/mL) was filtered through a 0.45 μm membrane filter. The identification of compounds was performed on the basis of retention time, co-injection, and spectral matching with standard compounds. For this purpose, standard stock solutions of caffeic acid, catechin, chlorogenic acid, gallic acid, herniarin, imperatorin and quercetin were prepared in methanol at 1 mg/mL.

Statistical Analysis

Results were expressed as mean ± SEM and analyzed with SPSS 22.0 software using one-way analysis of variance (ANOVA) followed by Fisher´s LSD test. Values of p<0.05 were considered statistically significant.

Results

In Vitro Assays

Inhibition of Albumin Denaturation

The methanolic extract of Uvaria comperei and fractions showed a strong inhibitory effect on the heat-induced denaturation of albumin (Table 1). The maximum effect was presented by the crude extract (UCCE) and the F2 fraction employed at 500 µg/mL, obtaining the maximal inhibition, whereas at 500 µg/mL diclofenac (the standard anti- inflammatory agent) showed an inhibition of 46%. The crude extract showed the highest inhibition (IC50 = 66.05 ± 0.30 µg/mL, Table 1).

Table 1: Effects of Uvaria comperei stem crude extract and fractions on albumin denaturation

tab 1

a,b,c,dDifferent letters in the same row indicate a significant difference (p<0.05). UCCE: crude extract of Uvaria comperei stems; F1, F2 and F3: fractions from UCCE.

Heat-induced Haemolysis

The protective effect of the extract and fractions against heat- induced haemolysis was studied showing a concentration-dependent inhibition (Table 2). In fact, the haemolysis ratio gradually decreased with increasing amount of the substances. Protection was slightly manifested using 31.25 µg/mL crude extract, inhibition of 10.5%, while maximum protection of 95.4% was observed using 500 µg/mL F3 fraction, followed by F2 fraction (79.8%). F3 showed the highest protection for red blood cells, with an IC50 < 31.25 µg/mL. This high activity of F3 was similar to that of the reference compound ibuprofen (IC50 < 31.25 µg/mL).

Table 2: Effect of Uvaria comperei stem crude extract and fractions on haemolytic activity

tab 2

a,b,cDifferent letters in the same row indicate a significant difference (p<0.05); UCCE: crude extract of Uvaria comperei stems; F1, F2 and F3: fractions of UCCE.

In vivo Anti-inflammatory Assays

Inhibition of Formalin Assay

Treatment with fraction F2 produced significant antinociceptive activity compared to controls in both the early and late phases (Table 3). F2 fraction tested at 25, 50 and 100 mg/kg (p.o.) decreased the paw licking time to 54.4, 60.2 and 14.6%, respectively, in the neurogenic phase (first phase), as well as to 70.2, 68.7 and 38.8%, respectively, in the inflammatory phase (second phase). Indomethacin (a reference drug) exhibited a higher inhibition in the second phase.

Indomethacin was used at 10 mg/kg; a,b,cDifferent letters in the same row indicate a significant difference (p<0.05).

Table 3: Effect of fraction F2 on formalin-induced paw licking

tab 3

Indomethacin was used at 10 mg/kg; a,b,cDifferent letters in the same row indicate a significant difference (p<0.05)

Inhibition of Carrageenan-induced Hind Paw Oedema

Oral administration of the F2 fraction (25, 50, and 100 mg/kg, p.o.) induced the highest anti-inflammatory activity by reducing the volume of paw oedema induced by carrageenan (Table 4). In detail, 25 mg/kg F2 caused 50% inhibition after 30 min of inflammatory stimulus, and 96% after 6 h, while with 50 mg/kg the inhibition was of 87% after 6 h. Furthermore, a 93% inhibition was observed after  3 h with F2 50 mg/kg. F2 showed high anti-inflammatory activity compared to indomethacin used as a standard drug. No significant differences in the inhibition were observed between 25 and 50 mg/ kg doses.

Table 4: Effect of the fraction F2 on carrageenan-induced hind paw edema in rats

tab 4

a,b,cDifferent letters in the same column indicate a significant difference (p≤0.05)

Serum Biochemical Analysis

Several biochemical parameters (Table 5) and indicators of oxidative stress (Table 6) were evaluated, as well as C reactive protein (CRP). The F2 fraction showed a significant protective effect on ALT, AST, γ GT, CAT, and reduced glutathione (GSH) levels. Indeed, the administration of the F2 fraction in the test group had significantly decreased the enzymatic activity of these enzymes compared to the control group (p<0.05), the values were 44.6, 196.8 and 3.5 IU/L for ALT, AST and γ-GT, respectively.

Regarding oxidative stress parameters, GSH and catalase levels were significantly higher in the test group compared to the control group, showing the ability of F2 to increase antioxidant defences (Table 6).

Table 5: Effect of F2 fraction administered at 25 mg/kg on serum biochemical parameters

tab 5

ALT: Alanine Aminotransferase; AST: Aspartate Aminotransferase; γ-GT: γ-Glutamyl Transpeptidase. Normal group: rats which did not receive any administration; Control group: rats which received the solvent of dissolution of F2. a,b,cDifferent letters in the same column indicate a significant difference (p<0.05).

Cytotoxicity

The F2 fraction showed concentration-dependent cytotoxicity activity tested in two cell lines (Table 7). The IC values of F2 were 27.73 and 82.86 µg/mL, respectively, in Raw and50Vero cells. The F2 fraction showed lower cytotoxicity in Vero and Raw cells compared to the standard cytotoxic agent podophyllotoxin.

Table 7: Cytotoxicity of the F2 fraction detected in two cell lines

tab 7

a,b,cDifferent letters in the same column indicate a significant difference (p<0.05)

Acute Toxicity

The F2 fraction did not induce death of any treated mice, therefore, the lethal dose (LD50) of F2 was found to be greater than 2000 mg/kg body weight.

HPLC Profile

Several flavonoids were detected in F2 fraction with HPLC-DAD analysis at 280, 340, and 380 nm and compared with the chromatograms of standard flavonoids. Figures 1-3 show the HPLC chromatograms of standard phenols (caffeic acid, catechin, chlorogenic acid, epicatechin, gallic acid, herniarin, imperatorin and quercetin) at 280 nm, 340 nm and 380 nm, respectively. Figures 4-6 show the HPLC chromatograms of F2 fraction at 280 nm, 340 nm and 380 nm, respectively. The chromatograms of the standards combined with F2 fraction have been presented in Figures 7-9 while Figure 10 presents the chromatogram of eight standard flavonoids identified at 280 nm and Table 8 shows the different phenols identified in fraction F2.

fig 1

Figure 1: HPLC chromatogram of several standard phenols detected at 280 nm

fig 2

Figure 2: HPLC chromatogram of several standard phenols detected at 340 nm

fig 3

Figure 3: HPLC chromatogram of several standard phenols detected at 380 nm

fig 4

Figure 4: HPLC chromatogram of F2 fraction of Uvaria comperei stem extract at 280 nm

fig 5

Figure 5: HPLC chromatogram of F2 fraction of Uvaria comperei stem extract at 340 nm

fig 6

Figure 6: HPLC chromatogram of F2 fraction of Uvaria comperei stem extract at 380 nm

fig 7

Figure 7: HPLC chromatogram of F2 fraction combined with the standards at 280 nm

fig 8

Figure 8: HPLC chromatogram of F2 fraction combined with the standards at 340 nm

fig 9

Figure 9: HPLC chromatogram of F2 fraction combined with the standards at 380 nm

fig 10

Figure 10: HPLC chromatogram of standards at 280 nm. Peaks: (1) Gallic acid, (2) Epicatechin, (3) Chlorogenic acid, (4) Caffeic acid, (5) Herniarin, (6) Quercetin (7) Imperatorin, (8 and 9) Catechins.

Table 8 shows the flavonoids identified in F2 fraction. The chromatogram analyses showed that F2 fraction contains numerous phenols; moreover, chlorogenic acid and catechins were identified in the present phytochemical analysis.

Table 8: Compounds identified by HPLC in F2 fraction of Uvaria comperei stem extract

tab 8

1: Gallic Acid, 2: Epicatechin, 3: Chlorogenic Acid, 4: Caffeic Acid, 5: Heniarin, 6: Quercetin 7: Imperatorin, 8: Catechin

Discussion

A previous analysis of the crude stem methanol extract of stems (UCCE) and the F2 fraction of Uvaria comperei demonstrated its high antioxidant activity and the characteristic presence of phenols, flavonoids, tannins and anthraquinones [2,3]. The high number of polyphenols in these extracts can explain their scavenging and antioxidant activities. Knowing  that  radical  species  are  involved in the inflammation process as inductors, previous results suggest the potential anti-inflammatory activity of the UCCE and F2 fraction. Effectively, for the first time, the present research shows the antinociceptive and anti-inflammatory properties of the crude methanol extract of the stem and F2 fraction of Uvaria comperei in several in vitro and in vivo models. In detail, albumin denaturation, heat hemolysis, formalin-induced paw licking, and carrageenan-induced hind paw oedema tests were used to evaluate antinociceptive and anti-inflammatory activities of the UCCE and F2 fraction. The crude extract and the F2 fraction at 500 mg/mL completely inhibited heat- induced albumin denaturation; Furthermore, UCCE showed greater activity than the fractions. It is well known that protein denaturation is a process by which tertiary and secondary structures change, causing loss of protein biological function of proteins. Moreover, one of the main features of inflammation is protein denaturation [25].    In fact, many disorders such as serum disease, rheumatoid arthritis, glomerulonephritis, and systemic lupus erythematosus are the result from hypersensitive reaction, which, in turn, is related to the antigens produced during protein denaturation [26]. Data from the literature suggest that the anti-denaturation property of BSA is due to the presence of binding sites in the aromatic tyrosine rich function and aliphatic regions of the threonine and lysine residues of BSA [27]. According to Verma [28], inhibition of the protein denaturation process  by  plant-derived  extracts  can  be  due  to  the  presence   of flavonoids. Several studies have shown that interaction with polyphenolic compounds improved protein thermal stability [5,29]. The Uvaria comperei products effectively inhibited heat-induced haemolysis with a 75% inhibition by using 500 µg/mL UCCE extract, while the 500 µg/mL F1, F2 and F3 fractions exhibited a inhibition of 66,80 and 95%, respectively. These results suggest that these may inhibit the release of the neutrophil lysosomal content of neutrophils at the inflammation sites. Indeed, the erythrocyte membrane is analogous to the lysosomal membrane, and its stabilization implies that the extract could stabilize the lysosomal membranes, which is important in limiting the inflammatory response by preventing the release of activated neutrophil lysosomal components causing further tissue inflammation and damage. Nonsteroidal drugs act by inhibiting these lysosomal enzymes or stabilizing the lysosomal membrane [30]. The membrane stabilizing effect of UCCE and F2 could be due to the quality and quantity of phenolic compounds, as UCCE and fraction F2 have a high tenor of polyphenols [2,3]. Consistent with this idea, Bouhlali et al. [29] showed high correlations between the stabilizing effect of the membrane and phenol contents. The authors suggested that flavonoids may interact at the water-lipid interface with the polar head of phospholipids increasing membrane rigidity, reducing fluidity, and increasing the stability of the mechanical lipid bilayer [31].

The antinociceptive effects of the F2 fraction showed a dose- dependent reduction in pain, which was greater compared to the indomethacin-induced effect. The behavioral response to formalin follows a biphasic pattern composed of an initial acute phase (first phase) and then of a longer period (second phase), while the period between phases is called the quiescent interval. Phase I consists of neurogenic nociception by  direct  stimulation  of  nociceptors  via  C fibers to the dorsal horn of the spinal cord after substance P is secreted and acts as a neurotransmitter. The second phase consists of inflammatory-induced pain due to the release of serotonin, histamine, bradykinin, and prostaglandins from formalin-damaged tissue [32]. The pain response in both phases is processed at the spinal level. The spinal cord contains mechanisms that inhibit the activity of neurons that receive and transmit nociceptive information. The primary afferent fibers of the spinal cord utilize excitatory amino acids (EAs) such as glutamate and aspartate as their neurotransmitters. There is evidence that selective EA receptor antagonists produce antinociception [33]. Hence, the antinociceptive activity of the F2 fraction may be due to the capacity to act on the EA receptors or to inhibit phospholipase  or cyclooxygenase that participate in the synthesis of prostaglandins. The first phase is reported to be inhibited by opioid analgesics, and the second phase is inhibited by both nonsteroidal anti-inflammatory drugs (NSAIDs) and opioid analgesics. The antinociceptive activity of the F2 fraction could be due to the presence of flavonoids and phenols detected by HPLC analysis and also shown in previous data [2]. However, the cellular mechanism involved in the antinociception of the F2 fraction needs further research, as it was not investigated here. The F2 fraction had the highest anti-inflammatory activity by reducing the carrageenan-induced paw oedema. It was showed 50% of inhibition just 30 min after carrageenan-induced reaction, and 96% after 6 h using 25 mg/kg of F2. Its activity was higher than that of indomethacin, used as standard drug. Previous studies have shown that carrageenan-induced paw oedema is usually a biphasic process. The early stage (0-1 h) is characterised by the secretion of histamine, serotonin, bradykinin, and overproduction of prostaglandins in the surrounding damaged tissue. The later stage (1-6 h) is the target of the most clinically effective anti-inflammatory drugs due to an overproduction of pro-inflammatory mediators such as bradykinin, leukotrienes, prostaglandins, platelet activating factor, nitric oxide, and proteolytic enzymes by neutrophils in the inflamed tissues [29]. The present study revealed that the F2 fraction decreased the paw oedema in both phases, differently to indomethacin. The low activity of indomethacin in the early stage is as expected because non-steroidal anti-inflammatory drugs such as aspirin or indomethacin are unable to inhibit the early stage of swelling [34]. The inhibition of the paw oedema during the two phases of inflammation suggests that F2 fraction could inhibit various chemical mediators of inflammation. Therefore, it can be speculated that F2 fraction contains phytoconstituents that might be acting through the inhibition of various mediators implicated in the inflammatory damage. Based on the well-known involvement   of free radicals in inflammation, it seems that at least a part of the anti-inflammatory effects of F2 fraction may also be attributed to   its antioxidant activity [3]. Among the constituents, phenols and flavonoids as chlorogenic acid and catechin were identified in F2 fraction. According to Kimura et al. [35], chlorogenic and caffeic acids also inhibited the histamine and leukotriene production. Other authors reported that luteolin and quercetin inhibited the release of histamine, prostaglandin and leukotrienes [36], while ferulic and caffeic acids inhibited the enzymes COX-1 and COX-2 [37]. Gallic acid inhibited the production of histamine and proinflammatory cytokines such as TNF-α and IL-6 from human activated mast cells [38]. Biochemical parameters and oxidative stress markers were also evaluated. Administration of fraction F2 in the test group significantly decreased ALT, AST and γ-GT levels compared to the control group. Furthermore, GSH and catalase levels were significantly decreased in the control group compared to the normal group, while the treatment with the F2 fraction (tested group) brings the levels close to the normal group. These observations converge with those of [39], who observed that aqueous and ethanolic leaf and root extracts of Uvaria chamae were not significant in rats at the level of uremia and creatinemia, but a sharp increase of AST and ALT levels was observed compared to the control. The results suggest that the fraction F2 could have hepatoprotective properties. The decrease in GSH and catalase activity in the control group compared to the normal and test groups suggest that the fraction F2 may have antioxidant activity. This property could be due to the bioactive substances in fraction F2, such as flavonoids, which are the main antioxidant metabolites [5].

The oral median lethal dose (LD50) of fraction F2 in mice was found to be greater than 2000 mg/kg body weight. This meant that the extract was practically non-toxic according to the acute toxicity classification standard, thereby validating  the  ethnomedicinal  use of the plant. Reduction in body weight and relative organ weight is generally considered a toxic effect of the extract on the animal, resulting in reduced food and water intake. There was no visible difference between mice in the tested group (G2) and mice in the normal group (G3). The estimated value of LD50 was in line with Legba et al. [39] findings, who reported that ethanol and aqueous extracts of the leaves and roots of Uvaria chamae were not toxic at 2000 mg/ kg in rats. No mortality and no renal histological perturbations were recorded in the treated rats. The fraction F2 showed concentration- dependent cytotoxicity activity against the tested cells. The IC values shown by F2 were 27.73 and 82.86 µg/mL, in Raw and Ver50o cells, respectively. According to the American National Cancer Institute (NCI), the criteria of cytotoxicity for crude extracts were IC50<30 μg/ mL after an exposure time of 72 h in a preliminary assay [40]. Fraction F2 met this criterion with an IC50 value less than 30 μg/mL on raw cells, but was slightly cytotoxic in Vero cells.

Conclusion

This research revealed for the first time that the crude extract  and the F2 fraction of Uvaria comperei possess and interesting anti- inflammatory activity. Furthermore, a dose-dependent antinociceptive effect of the F2 fraction has also been observed. In vivo hepatoprotective properties could also be suggested. Furthermore, the F2 fraction was not toxic up to 2000 mg/kg. The results support the traditional use of Uvaria comperei, and give credence to the ethnopharmacological approach for the selection of specific plant species for the discovery of new anti-inflammatory agents from natural sources.

Conflict of Interest

We declare that we have no conflict of interest.

Acknowledgment

The authors thank the Coimbra Group Program and the Department of Pharmaceutical and Pharmacological Sciences, University of Padua, Italy, for their financial and technical support. These funders had no involvement in study design, data collection, analysis and interpretation, writing, and the decision to submit the paper for publication.

Authors Contribution

MKS: Conceptualization; Funding acquisition; Investigation; Methodology; Writing – original draft. GTS: Investigation; Methodology, Writing – review and editing. MKayo: Investigation; Formal analysis; Data curation. ZC: Investigation; Formal analysis. MKouamo: Formal analysis; Writing – review and editing. DD: Investigation. PDJ: Writing – review and editing; Validation. MLS: Writing – review and editing; Validation. FBF: Writing – review and editing; Supervision. GF: Resources; Writing – review and editing; Validation; Supervision.

References

  1. Gina F, Renata B, Souza L, De-Freitas AH, et al. (2014) Plants of the annonaceae traditionally used as A review edição especial 36: 315-336.
  2. Simo M, Donati M, Siwe G, Majoumouo S, et al. (2020) Antioxidant potential of fractions from the stem methanol extract of Uvaria comperei (Annonaceae). Int J Pharmacogn 7: 76-82.
  3. Simo KM, Nguepi NM, Sameza M, Toghueo R, et (2017) Cameroonian medicinal plants belonging to Annonaceae family: radical scavenging and antifungal activities. Nat Prod Res 1478-6427.
  4. Le Thomas A (1969) Mise au point sur deux Annona africains, Muséum National d’histoire Laboratoire de phanérogamie, Paris, Adansonia 9: 95-103.
  5. Ghasemzadeh A, Ghasemzadeh N (2011) Flavonoids and phenolic acids: Role and biochemical activity in plants and J Med Plant Res 5: 6697-6703.
  6. Loomis WD, Battaile J (1966) Plant Phenolic compounds and the isolation of plant enzymes. Phytochemistry 51: 423-38.
  7. Kim D, Jeond S, Lee C (2003) Antioxidant capacity of phenolic phytochemicals from various cultivars of Food Chem 81: 321-326.
  8. Peterson J, Dwyer J (1998) Flavonoids: Dietary occurrence and biochemical Nutr Res 18: 1995-2018.
  9. Cook NC, Samman S (1996) Review: Flavonoids chemistry, metabolism, cardioprotective effects, and dietary J Nutr Biochem 7: 66-76.
  10. Ren W, Qian Z, Wang H, Zhu L, Zhang L (2003) Flavonoids: Promising anticancer agents. Medicinal Res Rev 23: 519-534.
  11. Phanse MA, Patil MJ, Chaudhari KAP, Patel B (2012) In-vivo and in-vitro screening of medicinal plants for their anti-inflammatory activity: an overview. J Appl Pharm Sci 2: 19-33.
  12. Alvarez PGA, Barbosa NL, Patipo VM, Petricevich VL (2012) Anti-inflammatory and antinociceptive activities of the ethanolic extract of Bougainvillea xbuttiana. J Ethnopharmacol 144: 712-719. [crossref]
  13. Mequanint W, Makonnen E, Urga K (2011) In vivo anti-inflammatory activities of leaf extracts of Ocimum lamiifolium in mice J Ethnopharmacol 134: 32-36. [crossref]
  14. Boominathan R, Parimaladevi B, Mandal SC, Ghoshal SK (2004) Anti-inflammatory evaluation of Ionidium suffruticosam Ging in rats. J Ethnopharmacol 91: 367-370. [crossref]
  15. Wang D, Wang LJ, Zhu FX, Zhu JY, et al. (2008) In vitro and in vivo studies on the antioxidant activities of the aqueous extracts of Douchi (a traditional Chinese slat- fermented soybean food). Food Chem 107: 1421-1428.
  16. Vidhu A, Shyam B, and Yashwant (2013) In vitro anti-inflammatory activity of Raupya (Silver) J Chem Pharm Res 5: 194-197.
  17. Sangita C, Priyanka C, Protapaditya D, Sanjib B (2012) Evaluation of in vitro anti- inflammatory activity of coffee against the denaturation of Asian Pac J Trop Biomed.
  18. Azeen A, Dilip C, Prasanth S, Shahima H, et (2010) Anti-inflammatory activity of the glandular extracts of Thunnus alalunga. Asian Pac J Trop Med 794-796p.
  19. Hunskaar H and Hole K (1987) The formalin test in mice dissociation between inflammatory and non-infammatory pain. Pain 30: 103-114.
  20. Peanna AT, Moretti MD, Vincenza M, Desole G, Pippia P (1997) Anti-inflammatory activities of aqueous extracts and steroidal sapogenins of Agave americana. Planta Med 63: 199-202.
  21. Lanher M, Fleurentin J, Defnyan P, Mortier F, Pelt J (1991) Analgesic and anti- inflammatory properties of Euphorbia hirta. Planta Med 57: 225-231. [crossref]
  22. Kuete V, Tchinda CF, Mambe FT, Beng VP, Thomas E (2016) Cytotoxicity of methanol extracts of 10 Cameroonian medicinal plants towards multi-factorial drug-resistant cancer cell lines. Complement Altern Med 16.
  23. O’Brien J, Wilson I, Orton T, Pognan F (2000) Investigation of the Alamar Blue (resazurin) fluorescent dye for the assessment of mammalian cell Eur J Biochem 267:5421–6. [crossref]
  24. OECD guidelines for the testing of chemicals: Acute oral toxicity – up-and-down- procedure (udp). (2008) 425: 1-27.
  25. Bouhlali EDT, El Hilaly J, Ennassir J, Benlyas M, et al. (2018) Anti-inflammatory properties and phenolic profile of six Moroccan date fruit (Phoenix dactylifera L.) varieties. J King Saud Univ Sci 30: 519-526.
  26. Elisha IL, Dzoyem JP, Mc Gaw LJ, Botha FS, Eloff JN (2016) The anti-arthritic, anti-inflammatory, antioxidant activity and relationships with total phenolics and total flavonoids of nine South African plants used traditionally to treat arthritis. Complement Altern Med16.
  27. Williams LAD, Rosner H, Conard J, Moller W, et al. (2002) Selected secondary metabolites from Phytolaccaceae and their biological/pharmaceutical significance, Research Sign Recent Res Devel In Phytoche 6: 13-68.
  28. Verma MA, Kumar PA, Kavitha D, Anurag KB (2011) Anti-Denaturation and Antioxidant Activities of Annona cherimola In Int J Pharma Bio Sci 2: 1-6.
  29. Bouhlali EDT, Abdelbasset H, Bouchra B, Tarik K, et al. (2020) Phenolic profile and anti-inflammatory activity of four Moroccan date (Phoenix dactylifera L.) seed varieties. Heliyon 6.
  30. Rajendran V, Lakshmi KS (2008) In  vitro and in vivo anti-inflammatory activity   of leaves of Symplocos cochinchinensis (Lour) Moore ssp Laurina. Bangladesh J Pharmacol 3: 121-124.
  31. Tarahovsky YS, Kim YA, Yagolnik EA, Muzafarov EN (2014) Flavonoid–membrane interactions: involvement of flavonoid–metal complexes in raft signaling. Biochim Biophys Acta Biomembr 1838: 1235-1246.
  32. Mohammadifard F, Alimohammadi S (2018) Chemical composition and role of opioidergic system in antinociceptive effect of Ziziphora clinopodioides essential oil Basic. Clin. Neurosci J 9.
  33. Abdollahi M, Sarrafzadeh J, Nikfar S, Roshanzamir F (2003) Mechanism of aspartame-induced antinociception in indian J Pharmacol 35: 37-41.
  34. Salvemini D, Wang ZQ, Wyatt PS, Bourdon DM, et al. (1996) Nitric oxide: a key mediator in the early and late phase of carrageenan-induced rat paw inflammation. Br J Pharmacol 118: 829-838.
  35. Kimura Y, Okuda H, Okuda T, Hatano T, et al. (1985) Studies on the activities of tannins and related compounds from medicinal plants and drugs. Inhibitory effects of caffeoylquinic acids on histamine release from rat peritoneal mast cells. Chem Pharm Bull 33: 690-696. [crossref]
  36. Kimata M, Shichijo M, Miura T, Serizawa I, et (2000) Effects of luteolin, quercetin and baicalein on immunoglobulin E-mediated mediator release from human cultured mast cells. Clin Exp Allergy 30: 501-508. [crossref]
  37. Jayaprakasam B, Vanisree M, Zhang Y, Dewitt DL, Nair (2006) Impact of alkyl esters of caffeic and ferulic acids on tumor cell proliferation, cyclooxygenase enzyme, and lipid peroxidation. J Agric Food Chem 54: 5375-5381.
  38. Kim SH, Jun CD, Suk K, Choi BJ, et (2006) Gallic acid inhibits histamine release and pro-inflammatory cytokine production in mast cells. Toxicol Sci 91:123-131. [crossref]
  39. Legba B, Dougnon V, Deguenon E, Agbankpe J, et al. (2019) Toxicological Characterization of Six Plants of the Beninese Pharmacopoeia Used in the Treatment of Salmonellosis. J Toxicol.
  40. Suffness M, Pezzuto JM (1990) Assays related to cancer drug discovery. In: Hostettmann K (ed) Methods in Plant Biochemistry: Assays for Academic Press London 6: 71-133.
scheme 1

Synthesis of Novel Multiple-Chlorine Diarylamine Derivatives and their Antiproliferative Activity against Human Cancer Cell Lines

DOI: 10.31038/JPPR.2022532

Introduction

Cancer is one of the most major public health concerns with 1,658,370 new cases and 583,430 cancer-related deaths in 2015 in the United States [1]. Although the effort to the development in anticancer agents has made substantial progress on improving the survival and life quality in several cancer patient populations, side effects and cancer recurrence are the commonly rapid developed clinical problem in most of existing treatments [2-4]. Moreover, drug resistance is another frequently occurring issue, causing the slowing down of curability [5]. Thus, there is an urgent need to develop small molecules with novelty in both chemical structures and targeted proteins [6]. Recent studies have demonstrated that isophthalonitrile derivatives have been widely developed as anti-cancer [7-9], anti- HIV-1 [8], anti-inflammatory [10] and fungicidal agents [11]. We noticed that halogens, particular chlorine atom, are very interesting bioactive moiety for developing new chemical entity in treating various diseases [12-14]. These studies confirmed that chlorine atom displays a dramatic effect on enhancing the cytotoxic effects. Consistent with these observations, we showed that diphenylamine derivatives display a profound bioactivity with the most favorable structures of multiple-chlorine atoms in phenyl ring, indicating that chlorine atom exerts a significant effect on enhancement of the bioactivities of diphenylamine compounds [15]. Furthermore, the increased anti- cancer activity has been observed in structures with multiple-chlorine atoms in diarylamine derivatives with novel strobilurin-pyrimidine structures in another previous study as well [16]. However, the role of multiple chlorines of diarylamines on anticancer activities has not been specifically studied. In present study, we hypothesized that diarylamines substituted with multiple halogens, particularly chlorine atoms would have more potent anticancer activities. We reported the design, synthesis and evaluation of these title compounds with different substituent for comparison. One of the highest anticancer compound 23 was extensively studies to investigate its anticancer spectrum, the underlying molecular mechanism was explored and proposed. Furthermore, plasma protein binding, permeability and microsomal intrinsic clearance of compound 23 were determined to predict its properties of absorption, distribution, metabolism and excretion.

Results and Discussion

Chemistry

A series of multiple-halo isophthalonitriles containing substituted phenylamine were synthesized via the straightforward reaction of chlorothalonil and different substituted phenylamines in the presence of K2CO3 and DMF. These compounds have a diversity of various substituents which allow us to probe the effect of different substituents on anti-cancer activities. The synthetic route to these compounds is illustrated in Scheme 1. The information about their physical properties and chemical structure characterizations of total 29 compounds are listed in Experimental Section.

scheme 1

Scheme 1: Synthesis of titled compounds

Anti-proliferative Activity In Vitro and Structure-Activity Relationship

The vitro anticancer activities were assessed against lung cancer cell line A549 and colon cancer cell line HT29. The IC50 data (µM) (the concentration to achieve 50% proliferative inhibition) of the assessed compounds for these two cell lines are listed in Table 1.

Table 1: IC50 (μM) of compounds

tab 1

As presented in Table 1, these novel synthesized compounds showed various levels of anti-proliferative activities, indicating that substituents in phenyl ring exert important effect on anti-cancer activities. Generally, alkyl groups including methyl and isopropyl decreased the antiproliferative activities of title compounds which we can find the lowest antiproliferative activities (IC50 larger than 100 µM against both cancer cell lines) in compounds 4, 7, 16 and 24, except that compounds 4 and 24 have a moderate antiproliferative activity against HT29 with 21.27 and 37.15 µM IC50 respectively and no data on compound 24 against A549 yet. Nitro group is any interesting and important pharmacore group. Both clinical and preclinical results have demonstrated that compounds with nitro group hold great potential on enhancing anticancer properties. All prepared nitro compounds 3, 6 and 10 have moderate anticancer activities against both A549 and HT29 with 18.40, 18.98; 37.50, 13.80; and 33.56, 14.47 µM IC50 respectively, indicating that the position of nitro group at phenyl group (2-,3-,4- position of 3, 6, 10 respectively) does not cause any significant alteration of anticancer activities of these nitro compounds. Cyanide group does not have any positive sign on enhancing the anticancer activities as we see >100, 27.64; 6.7, 15.65 µM IC50 of compounds 2 and 11 against A549 and HT29 respectively although compound 11 with cyanide group located at 4 position in phenyl ring in has better anticancer activity than compound 2 with cyanide group located at 2 position in phenyl ring. Usually, compound with fluorine atom exhibits better bioactivities if the position is optimized [17]. In the present study, we prepared total six fluorine-containing compounds. Unexpectedly, all anticancer activities of them are not in the top levels. Compounds 22, 15 and 29 with fluorine alone as 2, 4-F2, 2, 6-F2, and 2, 3, 4-F3 respectively exhibited moderate activities as 37.66, 17.11; >100, 87.90; 16.89, 2.30 µM IC50 against A549 and HT29. Compounds 8 with trifluoromethyl group at 3-position of phenyl ring has a comparable but moderate anticancer activity with compound 13 with trifluoromethyl group at 4-position with 19.04, 6.64; 8.82, 26.55 µM IC50 against A549 and HT29 respectively. Furthermore, compound 12 with trifluoromethoxy group at 4-position of phenyl ring has a moderate anticancer activity as well with 25.23 and 14.28 μM IC50 against A549 and HT29 respectively.

The effect of chlorine atom on anticancer activities is our main focus on the present study. When compounds containing one chlorine atom at different positions of phenyl ring show moderate anticancer activities, compound 1 with 2-position chlorine has better activities than compounds 5 and 9 with 3-position and 4-position chlorine. Their IC50 are 15.25, 2.15; 100, 60.69; 100, 66.60 µM against A549 and HT29 respectively. Addition of one more chlorine to obtain  di-chlorine compounds in phenyl ring slightly enhanced anticancer activities as we see in compounds 17, 18, 19, 20, 21, compared with compounds 1, 5, 9. The former IC50 are 47.61, 16.78; 37.4, 4.14; 2.73, 1.69; 13.39, 3.45; 9.39, 3.14 µM against A549 and HT29 respectively. Again, compounds with 2-position chlorine including compounds 18, 19, 20 have better activities than compounds with other position chlorine in phenyl ring. For compounds 23, 26, 27, 28 with three chlorines in phenyl ring, we see that compound 23 is the best one although others have moderate anticancer activities. Their IC50 are 0.58, 0.55; 18.03, 10.18; 20.44, 11.45 and 20.92, 4.07 µM against A549 and HT29 respectively. In contrast, comparing the trend of anticancer activities with three different halogens such as chlorine, bromine and fluorine would be very interesting to find the most important ones. Apparently, among compounds 23, 25 and 29, compounds 23 and 25 with either chlorine or bromine are the most active in all of prepared compounds in present study whereas compound 29 has moderate activity. Although there is no significant difference between compounds 23 and 25, compound 23 (chlorine atom) has better atom economy than compound 25 (bromine atom). Thus, compound 23 has the better potential to warrant further investigation.

Anti-proliferative Activity In Vitro of Compound 23 with Broad Spectrum

To further explore the anticancer activities of the most potent one, compound 23 in vitro, we screened its anticancer spectrum with total 19 cancer cell lines. As shown in Table 2, IC50 range is between 1.616 and ﹤0.01 µM with the most resistant one U251 and the most sensitive one CCRF-CEM. Except CCRF-CEM, HL-60, another non- solid tumor cell line showed the second most sensitivity to compound 23, indicating that compound 23 has strong activity to kill non-solid tumor cells. In contrast, brain tumor cells U251, cervical cancer cells HeLa and NIH-H1650 non small cancer lung cancer cells are in the most resistant cell lines with 1.616, 1.509 and 1.366 µM IC50 respectively.

Table 2: IC50 (μM) of compound 23 on 19 cancer cell lines

tab 2

Exploration of Potential Molecular Mechanisms

To clarify the potential molecular mechanisms, we detected the expression of several critical proteins in three representative cells, T24, H520 and A549. As shown in Figures 1 and 2, compound 23 dramatically increases the expression of p-Akt, p-Erk and p21 in T24 cancer cells in both dose and time dependent patterns. In contrast, compound 23 profoundly decreases the expression of p-Akt but moderately increases the expression of p-Erk in H520 cells. Moreover, in A549 cells, compound 23 decreases the expression of both p-Erk and p-21, shown in Figures 3 and 4. However, compound 23 decreases the expression of p-Akt in low concentration but expression of p-Akt is increased in high concentration in Figure 5. Taken together, all evidence collected indicates that compound 23-induced alteration of p-Akt and p-Erk is in cell specific fashion. However, compound 23 broadly induced the decrease of p-Stat3 expression in all three cancer lines showed in Figures 1-5. These important results imply that decreasing p-Stat3 may be the major mechanism of compound 23 in inhibiting cancer cell growth although further detailed studies are needed to warrant this conclusion.

fig 1

Figure 1: T24

fig 2

Figure 2: T24

fig 3

Figure 3: H520

fig 4

Figure 4: H520

fig 5

Figure 5: A549

Microsomal Intrinsic Clearance

As shown in Table 3, the results of microsomal intrinsic clearance of compound 23 indicate that compound 23 has 33.1 and 28.7 uL min-1mg-1 under NADPH dependent and NADPH free conditions, indicating that NADPH has not an important effect to compound 23 on microsomal metabolism. Verapamil and warfarin were used as high-metabolized and low-metabolized controls respectively. Thus, CYP enzymes may have no important effect on microsomal intrinsic clearance.

Table 3: Microsomal Intrinsic Clearance

tab 3

Caco-2 Permeability

As shown in Table 4, compound 23 has relative low permeability with mean A → B Papp is higher than mean B → A Papp. Thus, this data implies that oral administration route is not proper way to clinically treat the patients. In this assay, we used ranitidine, warfarin and talinolol are controls.

Table 4: Caco-2 permeability

tab 4

Plasma Protein Binding

As shown in Table 5, compound 23 has 100% plasma protein binding ratio. Therefore, both oral and intravenous infusion administration routes may not be an efficient way to treat patients. In this assay, propranolol and warfarin were used as binding controls.

In summary, we prepared a series of novel compounds and tested their anticancer activities. The most potent compound 23 was found. Furthermore, novel mechanism of inhibiting Stat3 phosphorylation of compound 23 was explored. Also, brief ADME properties of compound 23 was determined and low potential to conventional drug administration routes was recommended.

Table 5: Plasma protein binding

tab 5

Experimental Section

General Procedure for the Synthesis of Titled Compounds

Reagents were used without further purification unless otherwise specified. Solvents were dried and redistilled prior to use in the usual way. Analytical TLC was performed using silica gel HF254. To a solution of chlorothalonil (1 mmol) in dry DMF (20 ml), substituted aniline (1 mmol) and anhydrous sodium carbonate (1.5 mmol) were added at room temperature and the reaction mixture was stirred for 2 h at 60°C. The mixture was quenched by addition of ice water (100 ml). Then, the reaction mixture was filtered to afford the polyhalo isophthalonitriles compounds.

Physical and Spectral Information of Titled Compounds

2,4,5-Trichloro-6-((2-Chlorophenyl)Amino)Isophthalonitrile (1)

Yellow solid; Yield 69.6 %; mp: 208-210°C; 1H-NMR (300 M Hz, CDCl3): δ 7.03(s, 1H, NH), 7.27-7.38 (m, 3H, Ph-3,5,6-3H), 7.49-7.55 (m, 1H, Ph-4-H).

2,4,5-Trichloro-6-((2-Cyanophenyl)Amino)Isophthalonitrile  (2)

Brown solid; Yield 67.5%; mp: 258-260°C. 1H-NMR (300 M Hz, CDCl3): δ 7.12 (s, 1H, NH), 7.24 (d, 1H, Ph-6-H, J=7.5 Hz), 7.47 (t,1H, Ph-4-H, J=7.2 Hz), 7.68 (t, 1H, Ph-5-H, J=7.5 Hz), 7.78 (d, 1H, Ph-3-H, J=7.8 Hz).

2,4,5-Trichloro-6-(o-Tolylamino)Isophthalonitrile (3)

Brown solid; Yield 74.1%; mp: 258-260°C.1H-NMR (300 M Hz, CDCl3): δ 9.48 (s, 1H, NH), 7.44 (d, 1H, Ph-6-H, J=7.5 Hz), 7.68 (t,1H, Ph-4-H, J=7.2 Hz), 7.60(t, 1H, Ph-5-H, J=7.5 Hz), 8.2 (d, 1H, Ph-3-H, J=7.8 Hz). HRMS (ESI): calcd for C14H5C13N4O2Na [M + Na]+ ; 390.5700; found 389.9411.

2,4,5-Trichloro-6-(o-Tolylamino)Isophthalonitrile (4)

Gray red solid; Yield 73.2%; mp: 212-214°C; 1H-NMR (300 M Hz, CDCl3): δ (s, 3H, CH3), 7.00 (s, 1H, NH), 7.15 (d, H, Ph-6-H, J=7.5 Hz), 7.28-7.34 (m, 3H, Ph-3,4,5-3H). HRMS (ESI): calcd for C15H8Cl3N3Na [M + Na]+; 359.6000; found 359.9659.

2,4,5-Trichloro-6-((3-Chlorophenyl)Amino)Isophthalonitrile (5)

Brown solid; Yield 68.4%; mp: 228-230°C. 1H-NMR (300 M Hz, CDCl3): δ 7.04 (br, 1H, NH), 7.09 (d, J=7.5 Hz, 1H, Ph-6-1H), 7.20 (s, 1H, Ph-2-1H), 7.33-7.39 (m, 2H, Ph-4,5-2H). HRMS (ESI): calcd for C14H5Cl4N3Na [M + Na]+ ; 380.0150; found 380.9136.

2,4,5-Trichloro-6-((3-Nitrophenyl)Amino)Isophthalonitrile (6)

Gray solid; Yield 69.6%; mp: 250-252°C. 1H-NMR (300 M Hz, DMSO): 7.54-7.64 (m, 2H, Ph-5,6-2H), 7.94-8.00 (m, 2H, Ph-2,4- 2H),9.86 (br, 1H, NH). HRMS (ESI): calcd for C14H5C13N4O2Na [M + Na]+; 390.5700; found 389.9411.

2,4,5-Trichloro-6-(m-Tolylamino)Isophthalonitrile(7)

Brown solid; Yield 69.6%; mp: 248-25°C. 1H-NMR (300 M Hz, CDCl ): 2.40(s,3H, Ph-3-CH ), 7.02 (br, 1H, NH),7.12-7.36 (m, 4H, Ph-2,3,4,6-4H). HRMS (ESI): calcd for C15H8Cl3N3Na [M + Na]+ ; 359.6000; found 359.9659.

2,4,5-Trichloro-6-((3-(Trifluoromethyl)Phenyl)Amino) Isophthalonitrile (8)

Yellow solid; Yield 69.6%; mp: 236-238°C. 1H-NMR (300 M Hz, CDCl3): 7.12 (s, 1H, NH), 7.28-7.40 (m, 1H, Ph-6-H), 7.41-7.52 (m, 2H, Ph-2,4-2H), 7.54-7.62 (m, 1H, Ph-5-H).

2,4,5-Trichloro-6-((4-Chlorophenyl)Amino)Isophthalonitrile (9)

Yellow Yield 74.2%; mp: 259-261°C; 1H-NMR (300 M Hz, CDCl3): 7.00 (s, 1H, NH), 7.17 (d, 2H, Ph-2,6-2H, J=8.4 Hz), 7.42 (d, 2H, Ph-3,5-2H, J=8.7 Hz).

2,4,5-Trichloro-6-((4-Nitrophenyl)Amino)Isophthalonitrile (10)

Yellow Yield 69.3%; mp: 256-258°C; 1H-NMR (300 M Hz, CDCl3): 7.00 (s, 1H, NH), 7.17 (d, 2H, Ph-2,6-2H, J=8.3 Hz), 7.42 (d, 2H, Ph-3,5-2H, J=9.5 Hz).

2,4,5-Trichloro-6-((4-Cyanophenyl)Amino)Isophthalonitrile (11)

Yellow Yield 69.6%; mp: 259-261°C; 1H-NMR (300 M Hz, CDCl3): 7.00 (s, 1H, NH), 7.17 (d, 2H, Ph-2,6-2H, J=8.7 Hz), 7.42 (d, 2H, Ph-3,5-2H, J=9.0 Hz).

2,4,5-Trichloro-6-((3-(Trifluoromethoxy)Phenyl)Amino) Isophthalonitrile (12)

Gray Yield 75.3.%; mp: 204-206°C; 1H-NMR (300 M Hz, CDCl3): 7.09 (s, 1H, NH), 7.22-7.32 (m, 4H, Ph-2,3,5,6-4H).

2,4,5-Trichloro-6-((4-(Trifluoromethyl)Phenyl)Amino) Isophthalonitrile (13)

Yellow Yield 74.2.%; mp: 186-187°C; 1H-NMR (300 M Hz, CDCl3): 6.06 (br, 1H, NH), 6.51(d, J=5.7 Hz,2H, Ph-2,6-2H), 7.52(d, J=5.7 Hz,2H, Ph-3,5-2H).

4-((2,3,5-Trichloro-4,6-Dicyanophenyl)Amino)Phenyl Acetate (14)

Gray Yield 74.2.%; mp: 246-248°C; 1H-NMR (300 M Hz, CDCl3): 2.29 (s, 3H, COOCH3), 7.08 (s, 1H, NH), 7.17 (d, 2H, Ph-3,5-2H, J=8.7 Hz), 8.10 (d, 2H, Ph-2,6-2H, J=8.7 Hz).

2,4,5-Trichloro-6-((2,6-Difluorophenyl)Amino)Isophthalonitrile (15)

Gray Yield 74.2.%; mp: 218-220°C; 1H-NMR (300 M Hz, CDCl3): 7.03 (s, 1H, NH), 7.13 (dd, 1H, Ph-6-H, 3J=8.1 Hz, 4J=0.9 Hz), 7.28 (t, 1H, Ph-5-H, J=8.1 Hz), 7.47 (dd, 1H, Ph-4-H, 3J=8.1 Hz, 4J=0.9 Hz). HRMS (ESI): calcd for C14H4CI3F2N3Na [M + Na]+ ; 381.5538; found 381.9346.

(2,4,5-Trichloro-6-((2,6-Diisopropylphenyl)Amino) Isophthalonitrile (16)

Gray Yield 69.3%; mp: 216-218°C; 1H-NMR (300 M Hz, CDCl3): δ 7.12 (d, J=8.1 Hz, 2H), 6.98 (dd, J=8.3, 6.9 Hz, 1H), 5.87 (d, J=2H), 3.02 (p, J=6.8 Hz, 2H), 1.29 (d, J=6.9 Hz, 12H).

2,4,5-Trichloro-6-((3,5-Dichlorophenyl)Amino)Isophthalonitrile (17)

White solid; Yield 56.7%; mp: 238-242°C; 1H-NMR (300 M Hz, CDCl3): 6.95 (s, 1H, NH), 7.05 (d, 2H, Ph-2,6-2H, J=1.8 Hz), 7.32 (d, 1H, Ph-4-H, J=1.5 Hz). HRMS (ESI): calcd for C14H4C15N3Na [M + Na]+; 414.4570; found 413.8757.

2,4,5-Trichloro-6-((2,4-Dichlorophenyl)Amino)Isophthalonitrile (18)

Brown Black solid; Yield 59.6%; mp: 209-212°C; 1H-NMR (300 M Hz, CDCl3): 6.95 (s, 1H, NH), 7.20 (d, 1H, Ph-6-H, J=8.1 Hz), 7.36 (dd, 1H, Ph-5-H, 3J=8.7 Hz, 4J=2.7 Hz), 7.54 (d, 1H, Ph-3-H, J=2.4 Hz). HRMS (ESI): calcd for C14H4C15N3Na [M + Na]+; 414.4570; found 413.8757.

2,4,5-Trichloro-6-((2,3-Dichlorophenyl)Amino)Isophthalonitrile (19)

Gray White solid; Yield 58.6%; mp: 218-220°C; 1H-NMR (300 M Hz, CDCl3): 7.03 (s, 1H, NH), 7.13 (dd, 1H, Ph-6-H, 3J=8.1 Hz, 4J=0.9 Hz), 7.28 (t, 1H, Ph-5-H, J=8.1 Hz), 7.47 (dd, 1H, Ph-4-H, 3J=8.1 Hz, 4J=0.9 Hz). HRMS (ESI): calcd for C14H4C15N3Na [M + Na]+; 414.4570; found 413.8757.

2,4,5-Trichloro-6-((3,4-Dichlorophenyl)Amino)Isophthalonitrile (20)

Gray white solid; Yield 57.6%; mp: 220-222°C; 1H-NMR (300 M Hz, CDCl3): δ 7.45 (d, J=8.6 Hz, 1H), 7.32 – 7.25 (m, 2H), 7.21 (d, J=2.4 Hz, 1H), 6.96 (s, 1H).

2,4,5-Trichloro-6-((3,4-Dichlorophenyl)Amino)Isophthalonitrile (21)

Brown solid; Yield 58.9%; mp: 230-232°C; 1H-NMR (300 M Hz, DMSO): 7.13 (dd, J=8.4 Hz,J=2.1 Hz,1H,Ph-4-1H), 7.39(d, J=2.1 Hz,1H,Ph-6-1H), 7.51(d, J=8.4 Hz,1H,Ph-3-1H),9.62(br, 1H, NH).

2,4,5-Trichloro-6-((2,4-Difluorophenyl)Amino)Isophthalonitrile (22)

Gray solid; Yield 67.5%; mp: 206-208°C; 1H-NMR (300 M Hz, CDCl3): 6.88 (s, 1H, NH), 6.99 (t, 2H, Ph-5,6-2H, J=8.1 Hz), 7.32 (d, 1H, Ph-3-H, J=2.4 Hz).

2,4,5-Trichloro-6-((2,4,6-Trichlorophenyl)Amino) Isophthalonitrile (23)

Brown solid; Yield 67.5%; mp: 241-243°C; 1H-NMR (300 M Hz, CDCl3): 6.86 (S, 1H, NH),7.48(s, 2H,Ph-3,5-2H).

2,4,5-Trichloro-6-(Mesitylamino)Isophthalonitrile (24)

Brown solid; Yield 67.5%; mp: 199-201°C; 1H-NMR (300 M Hz, CDCl3): 2.17(s,6H,Ph-2,6-2CH3),2.34(s,3H,Ph-4-CH3) 6.81(br, 1H, NH),6.97(s, 2H,Ph-3,5-2H). HRMS (ESI): calcd for C17H11CI3N3 [M-H]+ ; 387.6540; found 386.0040.

2,4,5-Trichloro-6-((2,4,6-Tribromophenyl)Amino) Isophthalonitrile (25)

Brown solid; Yield 67.5%; mp: 251-253°C 1H-NMR (300 M Hz, CDCl3) δ 7.82 (s, 2H), 6.93 (s, 1H).

2,4,5-Trichloro-6-((3,4,5-Trichlorophenyl)Amino) Isophthalonitrile(26)

Yellow solid; Yield 59.3%; mp: 264-266°C; 1H-NMR (300 M Hz, DMSO): 7.53 (s, 2H,Ph-2,6-2H),8.98(br, 1H, NH).

2,4,5-Trichloro-6-((2,3,4-Trichlorophenyl)Amino) Isophthalonitrile(27)

Gray solid; Yield 59.3%; mp: 198-200°C; 1H-NMR (300 M Hz, CDCl3): 6.98(br, 1H, NH), 7.08(d, J=9.0 Hz, 1H, Ph-6-1H), 7.46 (d, J=9.0 Hz, 1H, Ph-5-1H).

2,4,5-Trichloro-6-((2,4,5-Trichlorophenyl)Amino) Isophthalonitrile (28)

Yellow solid; Yield 78.5%; mp: 253-255°C; 1H-NMR (300 M Hz, CDCl3): 6.88 (br, 1H, NH), 7.33 (s,1H,Ph-6-1H),7.96 (s,1H,Ph-5-1H).

2,4,5-Trichloro-6-((2,3,4-Trifluorophenyl)Amino) Isophthalonitrile (29)

Gray solid; Yield 69.6%; mp: 182-184°C; 1H-NMR (300 M Hz, CDCl3): 6.87 (s, 1H, NH), 7.05-7.09 (m, 2H, Ph-5,6-2H).

Cell Lines and Culture Conditions

All human cancer cell lines were purchased from Cell Resource Center, Institute of Life Sciences, Chinese Academy of Sciences (Shanghai, China) and cultured in either DMEM (Hyclone, Logan, UT, USA) or RPMI-1640 (Hyclone, Logan, UT, USA) supplemented with 10% of FBS (Hyclone, Logan, UT, USA) and 1% of penicillin- streptomycin at 37°C, in humidified air containing 5% of CO2.

Cell Viability Assay

Cell viability was assessed using a tetrazolium based assay using microplate reader (Biotek, SYNERGY HTX, Vermont, USA). IC50 values were determined through the dose-response curves. Cells were seeded at 6×10³ per well in 96-well culture plates and incubated in medium containing 10% FBS. Different seeding densities were optimized at the beginning of the experiments. After 24h, cells were treated with different concentrations of titled compounds with various concentrations for 48 hours in incubator. 50μl of MTT tetrazolium salt (Sigma) dissolved in Hank’s balanced solution at a concentration of 2 mg/ml was added to each well with indicated treatment and incubated in CO2 incubator for 5 h. Finally, the medium was aspirated from each well and 150μl of DMSO (Sigma) was added to dissolve formazan crystals and the absorbance of each well was obtained using a Dynatech MR5000 plate reader at a test wavelength of 490 nm with a reference wavelength of 630 nm.

Protein Characterization

Western blot assessment was performed using regular procedure. Primary antibody was added in BSA and allowed to incubate overnight at 4°C, washed with TBS/0.05% Tween-20 for 5 times (10min per time) before the secondary antibody was added and then incubated for an additional hour at room temperature. The membrane was again washed 3 times before adding Pierce Super Signal chemiluminescent substrate (Rockford, IL, USA) and then immediately imaged on Chemi Doc (Bio-Rad, Hercules, CA, USA). The films were scanned using EPSON PERFECTION V500 PHOTO and quantified by Image J (NIH, Bethesda, MD, USA).

Analytical Method Development for compound 23

The signal was optimized for each compound by ESI positive or negative ionization mode. An MS2 scan or a SIM scan was used to optimize the fragmenter voltage and a product ion analysis was used to identify the best fragment for analysis, and the collision energy was optimized using a product ion or MRM scan. An ionization ranking was assigned indicating the compound’s ease of ionization.

Analytical Method Development for ADME

Samples were analyzed by LC/MS/MS using an Agilent 6410 mass spectrometer coupled with an Agilent 1200 HPLC and a CTC PAL chilled autosampler, all controlled by MassHunter software (Agilent). After separation on a C18 reverse phase HPLC column (Agilent, Waters, or equivalent) using an acetonitrile-water gradient system, peaks were analyzed by mass spectrometry (MS) using ESI ionization in MRM mode.

Microsomal  Stability Assay

The test agent is incubated in duplicate with microsomes at 37°C. The reaction contains microsomal protein in 100 mM potassium phosphate, 2 mM NADPH, 3 mM MgCl2, at pH 7.4. A control reaction is performed for each test agent omitting NADPH (to detect NADPH- free degradation). At indicated times, an aliquot is removed from each experimental and control reaction and mixed with an equal volume of ice-cold Stop Solution (methanol, containing haloperidol, diclofenac, or other internal standard). Stopped reactions are incubated at least ten minutes at -20°C, and an additional volume of water is added. The samples are centrifuged to remove precipitated protein, and the supernatants are analyzed by LC/MS/MS to quantitate the remaining parent. Data are converted to % remaining by dividing by the time zero concentration value. Data are fit to a first-order decay model to determine half-life. Intrinsic clearance is calculated from the half-life and the protein concentrations:

CLint=ln(2) /(T1/2 [microsomal protein])

Verapamil (high metabolized) and warfarin (low metabolized) were used as reference controls.

Caco-2 cells grown in tissue culture flasks are trypsinized, suspended in medium, and the suspensions were applied to wells of a Millipore 96 well Caco-2 plate. The cells are allowed to grow and differentiate for three weeks, feeding at 2-day intervals. For Apical to Basolateral (A → B) permeability, the test agent is added to the apical (A) side and amount of permeation is determined on the basolateral (B) side; for Basolateral to Apical (B → A) permeability, the test agent is added to the B side and the amount of permeation is determine on the A The A-side buffer contains 100 μM Lucifer yellow dye, in Transport Buffer (1.98 g/L glucose in 10 mM HEPES, 1x Hank’s Balanced Salt Solution) pH 6.5, and the B-side buffer is Transport Buffer, pH 7.4. Caco-2 cells are incubated with these buffers for 2 hr, and the receiver side buffer is removed for analysis by LC/MS/MS. To verify the Caco-2 cell monolayers are properly formed, aliquots of the cell buffers are analyzed by fluorescence to determine the transport of the impermeable dye Lucifer Yellow. Any deviations from control values are reported.

Data are expressed as permeability (Papp): AC dt dQ Papp 0 = where dQ/dt is the rate of permeation, C0 is the initial concentration of test agent, and A is the area of the monolayer.

In bidirectional permeability studies, the Efflux Ratio (RE) is also calculated: ( ) ( R e BA P A B P app app →→ =

An RE > 2 indicates a potential substrate for P-gp or other active transporters.

Plasma Protein Binding

Test agent is added to plasma. This mixture is dialyzed in a RED Device (Pierce) per the manufacturers’ instructions against PBS and incubated on an orbital shaker. After the end of the incubation, aliquots from both plasma and PBS sides are collected, an equal amount of PBS is added to the plasma sample, and an equal volume of plasma is added to the PBS sample. Methanol (three volumes) containing internal standard is added to precipitate the proteins and release the test agents. After centrifugation, the supernatant is transferred to a new plate and analyzed by LC/MS/MS.

References

  1. Cancer Facts & Figures (2015) American Cancer
  2. Domingo-Musibay E, Galanis E (2015) What next for newly diagnosed glioblastoma? Future Oncol 11: 3273-3283. [crossref]
  3. Oberstein PE, Olive KP (2013) Pancreatic cancer: why is it so hard to treat? Ther Ad Gastroenterol 6: 321-337. [crossref]
  4. Lemjabbar-Alaoui H, Hassan OUI, Yang YW, Buchanan P (2015) Lung cancer: Biology and treatment Biochim Biophys Acta 1856: 189-210. [crossref]
  5. Holohan C, Van Schaeybroeck S, Longley DB, Johnston PG (2013) Cancer drug resistance: an evolving Nat Rev Cancer 13: 714-726. [crossref]
  6. O’Connor R (2009) A review of mechanisms of circumvention and modulation of chemotherapeutic drug Curr Cancer Drug Targets 9: 273-280. [crossref]
  7. Yan SJ, Huang, ; Zeng, X. H.; Huang, R.; Lin, J. (2010) Solvent-free, microwave assisted synthesis of polyhalo heterocyclic ketene aminals as novel anti-cancer agents. Bioorg Med Chem Lett 20: 48-51. [crossref]
  8. Huang C, Yan SJ, Zeng XH, Dai XY, Zhang Y, et (2011) Biological evaluation of polyhalo 1,3-diazaheterocycle fused isoquinolin-1(2H)-imine derivatives. Eur J Med Chem 46: 1172-1180. [crossref]
  9. Yan SJ, Zhen H, Huang C, Yan YY, Lin J, et (2010) Synthesis of highly functionalized 2,4-diaminoquinazolines as anticancer and anti-HIV agents. Bioorg Med Chem Lett 2: 4432-4435. [crossref]
  10. Heilman WP, Battershell RD, Pyne WJ, Goble PH, Magee TA, et (1978) Synthesis and antiinflammatory evaluation of substituted isophthalonitriles, trimesonitriles, benzonitriles, and terephthalonitriles. J Med Chem 21: 906-913. [crossref]
  11. Guan AY, Liu CL, Huang G, Li HC, Hao SL, et (2013) Design, synthesis, and structure-activity relationship of novel aniline derivatives of chlorothalonil. J Agric Food Chem 61: 11929-11936. [crossref]
  12. Kadayat TM, Song C, Kwon Y, Lee, S. (2015) Modified 2,4-diaryl-5H-indeno[1,2-b] pyridines with hydroxyl and chlorine moiety: synthesis, anticancer activity, and structure-activity relationship study. Bioorg Chem 62: 30-40. [crossref]
  13. Kadayat TM, Park S, Jun KY, Magar TB, Bist G, et (2016) Effect of chlorine substituent on cytotoxic activities: design and synthesis of systematically modified 2,4-diphenyl-5H-indeno[1,2-b]pyridines. Bioorg Med Chem Lett 7: 1726-1731. [crossref]
  14. Beck DE, Lv W, Abdelmalak M, Plescia CB, Agama K, Marchand C, Pommier Y, Cushman M (2016) Synthesis and biological evaluation of new fluorinated and chlorinated indenoisoquinoline topoisomerase I poisons. Bioorg Med Chem 7: 1469-1479.
  15. Li HC, Guan AY, Huang G, Liu CL, Li ZN, et (2016) Design, synthesis and structure-activity relationship of novel diphenylamine derivatives. Bioorg Med Chem 3: 453-461. [crossref]
  16. Chai BS, Wang SY, Yu WQ, Li HC, Song CJ, et (2013) Synthesis of novel strobilurin- pyrimidine derivatives and their antiproliferative activity against human cancer cell lines. Bioorg Med Chem Lett 23: 3505-3510. [crossref]
  17. Wang J, Sánchez-Roselló M, Aceña JL, del Pozo C, Sorochinsky AE, et (2014) Fluorine in pharmaceutical industry: fluorine-containing drugs introduced to the market in the last decade (2001-2011). Chem Rev 4: 2432-2506. [crossref]

A Clinical Study on Hypothyroidism and Early Pregnancy Loss

DOI: 10.31038/PSC.2022214

Abstract

Thyroid disorders are recognized associated factors for adverse pregnancy outcomes spontaneous miscarriages being an important entity. This study was conducted on 200 women who had early pregnancy losses and their thyroid profile was evaluated. Prevalence of overt and sub clinical hypothyroidism was calculated along with euthyroid women. The results obtained were statistically analysed. In conclusion, it was established that hypothyroidism, both overt and sub clinical, when untreated can lead to early pregnancy losses, therefore all antenatal women should be universally screened for thyroid dysfunction in their very first antenatal visit and treatment should be initiated at the earliest.

Keywords

Early pregnancy loss, Hypothyroidism, Overt hypothyroidism, Spontaneous miscarriage, Subclinical hypothyroidism, Thyroid dysfunction

Introduction

Thyroid dysfunction during pregnancy has been known to be associated with adverse pregnancy outcomes especially spontaneously miscarriages, being the most common early pregnancy complication. Though various causes of early pregnancy losses include genetic, anatomical factors, endocrine dysfunction, autoimmune disorders, thrombophillias, life style and environmental factors, maternal general diseases and infections, a large chunk of such cases are unexplained and also known as idiopathic early pregnancy losses. Thyroid dysfunction constitutes the most common endocrine disorder encountered in pregnancy sometimes recognized for the first time during antenatal check-ups. Pregnancy is characterized by profound physiological modifications in thyroid function regulation as a result of various factors e.g. increased Thyroid Binding Globulin (TBG) due to elevated Estrogen and human chorionic gonadotropin (HCG) levels, increased renal iodine losses due to increased Glomerular filtration rate (GFR), peripheral metabolism of maternal thyroid hormones modifications and physiological changes in the iodine transfer to the placenta [1-4].

It has been observed that antenatal women with thyroid dysfunction – both overt and subclinical types – are at higher risk for developing pregnancy-associated complications e.g. threatened miscarriage, pre-eclampsia, pre-term labour and pre term birth, abruption placentae and post-partum haemorrhage. Fetal complications are also associated with thyroid dysfunction in pregnancy e.g. spontaneous abortions in first trimester, pre term births, Intrauterine Growth Restriction (IUGR), low birth weight (LBW) babies, low APGAR scores, stillbirths and neonatal deaths, higher incidence of NICU admission because of neonatal hyper-bilirubinemia, neonatal hypothyroidism, and increased perinatal mortality rate [5]. Euthyroid status is defined as having normal TSH levels (0.1-2.5 mIU/L) in 1st trimester. Subclinical Hypothyroidism (SCH) is defined as TSH increase (>3.0 mIU/L) in the presence of normal Free T4 (0.8-2.0 ng/dL). Overt hypothyroidism (OH) has increased TSH (>3.0 mIU/L) and low Free T4 (<0.8 ng/dL). Subclinical hyperthyroidism is defined as low serum TSH (<0.2 mIU/L) and normal Free T4 (0.8-2.0 ng/dL). Overt hyperthyroidism has high free T4 (>2.0 ng/dL) and low TSH (<0.2 mIU/L). This study was conducted with the aim of determining the prevalence of hypothyroidism in patients presenting with early pregnancy loss.

Materials and Methods

  • Study type: Hospital based, cross-sectional study.
  • Study duration: 18 months.
  • Study population: Pregnant women presenting with Early pregnancy losses (EPL) (missed/incomplete/ complete miscarriages).
  • Sample size: 200.

This study was conducted in the department of Obstetrics and Gynaecology of a tertiary care medical college in rural Haryana, in North India.

All pregnant women presenting with EPL (missed/ incomplete/ complete miscarriages) were enrolled in this study after obtaining proper written informed consent. All these patients recruited had detailed history taken, followed by thorough clinical examination consisting of general physical, systematic and obstetric examinations and all the findings were entered in a pre-structured performa. History including socio-demographic parameters, age, parity, socio-economic status, menstrual history, obstetric history, medical or surgical history, date of her last menstrual period (LMP) were noted.

BMI was calculated based on pre-pregnancy body weight and height (BMI=wt in kg/height in sq.m).

Exclusion Criteria

  • Multiple gestation
  • Known Thyroid dysfunction
  • Known cases of DM/ Renal/ liver disease/ hypertension
  • Known cases of recurrent pregnancy losses ( RPL)

Blood samples were collected for Thyroid Function Test (TFT) Serum TSH and free T3 and T4. Thyroid status of the patient was established using the standard cut-off laboratory levels (Table 1).

Table 1: Interpretation of Thyroid Function Tests (TFT)

Status

TSH level (µIU/L)

Free T4 level (ng/L)

Euthyroid

0.1-2.5

Overt Hypothyroidism (OH)

> 3.0

<0.8 (decreased)

Subclinical Hypothyroidism (SCH)

>3.0

0.8-2.0 (normal)

Subclinical hyperthyroidism

<0.2 (decreased)

0.8-2.0 (normal)

Overt hyperthyroidism

<0.2(decreased)

>2.0 (raised)

Results and Observations

Total 200 patients with EPL were recruited in the study.

The results observed were as follows (Table 2-5):

Table 2: Age distribution of patients

Age (years)

Number (n)

Percentage (%)

19-24

115 57.50
25-29 51

25.50

30-34

26 13.00
≥35 8

4.00

Total

200

100.00

Table 3: Parity-wise distribution of patients

Parity

Number (n) Percentage (%)
≤1 99

49.50

2

49 24.50
3 28

14.00

≥4

24 12.00
Total 200

100.00

Most patients were primipara, were young (19-24 years of age),with low BMI

Table 4: Mean BMI of the patients

Thyroid status

BMI (kg/m2)

Euthyroid

22.1 ± 2.2

Hypothyroid

22.8 ± 3.6

Table 5: Comparison of age and BMI

Parameter

Mean age (years)

BMI (kg/m2)

Euthyroid women

22 ± 3.6

22.1 ± 2.2

Hypothyroid women

25 ± 2.3

22.8 ± 3.6

Discussion

This study was conducted on 200 antenatal women presenting with early pregnancy losses, showing that hypothyroidism is a significant contributor to miscarriages especially in the first trimester. In our study, 48 patients (24.0%) had hypothyroidism with 36 overt hypothyroidism (75.0%) and 12 with subclinical hypothyroidism (25.0%0). Our results are comparable with those from various studies from different geographical areas of the globe. In their study, Abalovich et al. reported that untreated hypothyroidism both SCH and OH at the time of conception, was associated with significantly higher rates of spontaneous miscarriages as compared to euthyroid women [6]. Ashoar et al. in their study reported statistically significant association between low serum thyroxine (FT4) in mothers in first trimester and early fetal loss in subclinical hypothyroid pregnant women [7]. Rao et al. from south India, determined the frequency of hypothyroidism in women with EPL in India, which they stated as 4.12%. Leduk et al. in their retrospective cohort study, concluded that patients with recurrent pregnancy losses in 1st trimester, 19.4% subclinical hypothyroidism SCH and 5.4% had overt hypothyroidism (OH). Salek et al. reported increased prevalence of hypothyroidism for twin gestation than singleton pregnancy at 6.42% and 5.32% respectively. Zhang et al. studied the relationship between SCH and risk of spontaneous miscarriage before 20 weeks of gestation and reported significantly increased chances. They also observed that SCH patients with thyroid autoimmunity had higher prevalence of spontaneous miscarriage as compared to euthyroid women [8-11].

Conclusion

From the present study, we reinforce the fact that hypothyroidism – both overt and subclinical – if untreated – leads to early pregnancy losses. It also causes recurrent pregnancy losses. Therefore all pregnant women should be universally screened for thyroid dysfunction so that replacement therapy can be initiated at the earliest so as to ensure the best maternal and fetal outcomes.

Conflict of Interest

Nil

Funding

None

Abbreviations

EPL: Early Pregnancy Loss; GFR: Glomerular Filtration Rate; IUGR: Intrauterine Growth Restriction; LBW: Low Birth Weight; NICU: Neonatal Intense Care Unit; OH: Overt Hypothyroidism; RPL: Recurrent Pregnancy Loss; SCH: Subclinical Hypothyroidism; TFT: Thyroid Function Test.

References

  1. Verma P, Roy D, et al. (2020) Hypothyroidism & early pregnancy losses: an overview. Int J Repod Contracept Obstet Gynecol 9: 5065-5067.
  2. Back KH, et al. (2007) Recurrent pregnancy Losses: The key potential mechanisms. Trends Mol Med 13: 310-317. [crossref]
  3. Abalovich M, et al. (2007) Management of thyroid dysfunction during pregnancy & post partum: An endocrine society clinical practice guideline Clin Endocrinol Meta 92: 1-47. [crossref]
  4. So L.B, et al. (2006) Thyroid disorders during pregnancy. Endocrinal Metab Clin North Am 35: 117-136. [crossref]
  5. Negro R, et al. (2006) L-thyroxine treatment in euthyroid pregnant women with autoimmune thyroid disease: Effects on obstetrical complications. Clin Endocrinol Meta 91: 2587-2591. [crossref]
  6. Abalovich M. (2002) Overt and SubClinical Hypothyroidism complicating pregnancy. Thyroid 12: 63-66. [crossref]
  7. Ashoor G, et al. (2010) Maternal Thyroid function at 11-13 weeks of gestation and subsequent fetal death. Thyroid 20: 989-993. [crossref]
  8. Leduk RG, Lewis M, et al. (2020) Prevalence of thyroid autoimmunity and effect of l-thyroxine treatment in patients with recurrent pregnancy losses. Reprod Bio med Online 40: 582-592. [crossref]
  9. Rao V.R, Lakshmi A.P. et al. (2018) Prevalence of hypothyroidism in recurrent pregnancy losses in 1st Ind J Med Sci 62: 357-361. [crossref]
  10. Salek T, Shaifalaha I, et al. (2019) The prevalence of maternal hypothyroidism in 1st trimester screening (11-14 weeks of gestation). Biomed Pap Med Fac Univ Palaky Czech Republic 63: 265-268. [crossref]
  11. Zhang Y, Wang H, et al. (2017) Patients with subclinical hypothyroidism before 20 weeks of pregnancy and miscarriages – A systematic review of meta-analysis. PLOS One 12: e0175708.

Diffusion Models of Continuum Physics

DOI: 10.31038/NAMS.2022521

Abstract

The paper begins with a review of known diffusion models of the literature, in terms of the mass fraction and the chemical potential. Next the  thermodynamic consistency of the pertinent schemes is investigated and it follows that the recourse to the chemical potential is justified in two different ways. The alternative recourse to the balance equations, through a linearization procedure, is suggested as a check of consistency. Finally it is pointed out that, thanks to the correspondence probability-concentration, the classical models of diffusion can be extended to the quantum context.

Keywords

Diffusion models, Thermodynamic consistency, Concentration, Chemical potential

Introduction

The purpose of this paper is to review standard models of diffusion and to clarify the physical bases leading to the different differential equations. To understand the basic starting point and to establish the required notation we start with addressing attention to a mixture of n fluid constituents.

In essence, let ρα , vα be the mass density and the velocity of the α th constituent,

α = 1, …, n. We let

in 1

be the mass density of the mixture and the mass fraction (or concentration) of the α th constituent; the sum on α is understood from 1 to n. As we prove in a moment ωα is subject to the differential equation

in 2

where hα is the mass flux,  ∇ is the gradient operator and then ∇ is the divergence, and the superposed dot denotes the (total) time derivative.

Within the theory of mixtures hα is clearly defined and shown to satisfy a differential equation [1,2]. As we emphasize in this paper, hα is regarded as an unknown vector to be determined through mathematical assumptions associated with physical properties of the mixture. The original Fick’s model is based on the assumption

in 3

where Dα is the diffusivity. Next other models and their generalizations have been developed in terms of the chemical potential.

In this paper we first review known diffusion models in terms of the mass fraction ωα and the chemical potential µα. Next we investigate the thermodynamic consistency of the pertinent schemes and find that the recourse to the chemical potential is justified in two different ways. Next we examine the alternative recourse to the balance equations through a linearization procedure. Further, we point out that the ideas about the correspondence probability-concentration is applied to modelling diffusion in the quantum context.

Balance Equations for Fluid Mixtures

Consider a mixture of n fluid constituents (see, e.g., [1]). The suffices α, β = 1, 2, …, n label the quantities related to the α th, β th constituent. Hence ρα is the mass density and vα the velocity of the α th constituent. The continuity equation of the α th constituent comprises the mass supply τα, per unit volume and unit time, so that

ba 1

The conservation of mass of the whole mixture implies

ba 2

Hereafter ba 3 is  a  shorthand for ba 4 The mass supply τα is nonzero in chemical reactions and phase transformations or generally whenever a constituent may gain or lose mass in favor of the other constituents.

The mass density ρ and the (barycentric) velocity v of the mixture are defined by

ba 5

The ratio

ba 6

is the mass fraction (or concentration) of the α th constituent and uα = vα − v

is the diffusion velocity. The definition of v implies that

ba 7

The sum of (1) with the constraint (2) results in

ρ + ∇ · (ρv) = 0,                                              (3)

which is the continuity equation for the whole mixture.

We now investigate the evolution equation for ωα. Replace ρα with ρωα and vα with

v + uα in (1). In view of (3) we find

ρ(tωα + v · ∇ωα) + ∇ · (ραuα) = τα.

Observe that tωα   + v.  ∇ωα  is the derivative with respect to the barycentric observer. As with any function it is denoted by a superposed dot. The vector

hα:= ρα uα

is the α th diffusion flux representing the flux of the α th constituent relative to the barycentric observer. Hence we can write

ba 8

The mass fraction ωα, in the barycentric reference, evolves according to (4). This equation is operative once τα and hα are given in terms of ba 9 , possibly parameterized by temperature and pressure.

The equation of motion of the α th constituent can be written in the form

(ραvα) + ∇· (ραvα ⊗ vα) − ∇ · Tα ραbα = mα,

where Tα is the Cauchy stress tensor, bα is the body force, and mα is the growth of the linear momentum, that is the force on the α th constituent due to other constituents of the mixture. The growths {mα} are subject to the constraint

ba 10

Modelling of Diffusion Fluxes and Diffusion Equations

The physical modelling of diffusion is most often restricted to non-reacting mixtures, τα = 0, and is based on the view that diffusion is governed by (4) with appropriate models for hα.

The simplest and best known model of diffusion traces back to Fick [3] and is based on an assumption on hα that is motivated by the analogy with the Fourier model of heat conduction. First the total derivative ba 9 is replaced with the partial derivative ωα; this means that diffusion is examined in the barycentric frame. Moreover, Fick’s law assumes the diffusion flux hα is antiparallel to ωα, i.e. hα = κα ωα, where κα > 0 may depend on the constituent. Hence divide eq. (4) by ρ to obtain

mo 1

where ζα = τα . If κα is constant then the evolution equation for ωα takes the form

mo 2

the quantity Dα = κα is called diffusivity.

Diffusion in solids is often modelled by letting ([4], ch. 17) hα = −Dα ∇ Nα,

where Nα is the concentration in the form

mo 3

mo 4 being the number of atoms per unit volume.

Other diffusion equations are based on the following two main assumptions. Let ψα be the α th Helmholtz free energy and define

mo 5

The assumption is hα = −κα ∇ µα.

For definiteness we consider ψα in the form [5]

mo 6

If λα is constant then it follows

mo 7

and eq. (4) takes the form

mo 8

Equation (8) is usually referred to as the Cahn-Hilliard equation [6,7]. It is a fourth-order partial differential equation. If the dependence on ∇ ωα is ignored then the Cahn-Hilliard equation reduces to the second-order parabolic equation (6).

Alternatively it is assumed that the evolution of ωα is in fact a relaxation toward equilibrium governed by [8]

mo 9

Hence, letting ψα be given again by the Landau-Ginzburg function (7) we obtain

mo 10

Equation (9) is a second-order partial differential equation  when ψα depends on ∇ωα ; it is referred to as the Ginzburg-Landau equation or the Allen-Cahn equation. While eq. (6) is based on Fick’s law hα = −κα ∇ ωα , eqs (8) and (9) are based on the assumptions

mo 11

The function   mo 12 is often regarded as the chemical potential. As   we see in a moment mo 12differs from the standard (correct) expression of the chemical potential. Moreover even simple thermodynamic considerations would justify the use of the chemical potential.

Thermodynamic Test of (10)

The balances of energy and entropy are stated by considering the mixture as a whole body. The balance of energy is taken in the form

th 1

where ε is the internal energy density, per unit mass, D is the stretching tensor, q is the heat flux vector, and r is the external heat supply. Let θ > 0 be the absolute temperature. The second law of thermodynamics is stated as follows: the entropy density η and the entropy flux j satisfy the inequality

th 2

For every admissible process that is every set of constitutive functions compatible with the balance equtaions.

For formal conveneince let

th 3

k being the extra-entropy flux to be determined. Substituting ρr-∇.q from eq. (11)

th 4

Let ψ = ε-θη be the Helmholtz free energy of the mixture. The second law inequality can be written as

th 5

To determine thermodynamic consequences of the second law we now consider

th 6

as the set of independent variables. Moreover we specialize T in the form

th 7

with T = O(D) as D→0. Compute ψ˙ and substitute in the Clausius- Duhem inequality (12). The arbitrariness and linearity of ω¨α , ρ¨, , θ¨ reduces the possible dependencies of ψ

th 11

and the analogue for ∇ θ and ∇ ωα. Now, divide (13) by θ and consider the identities

th 12

Moreover we have

th 13

Hence upon some rearrangements we can write inequality (13)  in the form

th 14

Since L = D+W, with W ∈ skw the spin tensor, then the arbitrariness of W implies that

th 15

Now,   D = th 16 D0 being the deviator of D. This in turn implies that T embodies an isotropic part to contribute to the pressure. For simplicity we let p be free of tr T∇ . Consequently, since ρ˙ = −ρ∇ · v it follows that the inequality takes the form

th 17

the dots denoting the other terms of the inequality. Hence we let p = ρ2δpψ.

Consequently we are left with the inequality

th 18

Thermodynamic Restriction on t 1

Sufficient conditions for inequality (14) are

t 2

It is suggestive that this thermodynamic condition has the form of (10)2. Yet we have to check whether t 4  Now, from the theory of mixtures we have

t 3

to within kinetic terms. If we let each ψα depend on the corresponding mass density

t 5

Hence  we  conclude  that,  to  within t 7 the standard chemical potential is

t 6

Thermodynamic Restriction on hα

Back to inequality (14) we let again η = −δθ ψ. Next we observe that tt 1 is given by (1). Substitution of tt 2 from (1) results in

tt 3

This inequality holds if each term has the required sign; in particular

tt 4

Hence, owing to the neglect of kinetic terms in ψ, by the second law inequality it follows that the diffusion flux hα is determined by the gradient of µα , and not merely of µα. This is a direct thermodynamic requirement without any need of a-priori rescaling [9].

Inequality (17)2 governs the evolution of a possible reaction. For a binary mixture the inequality reduces to

tt 5

the reaction proceeds toward the constituent with higher values of the chemical potential.

Diffusion of Electrically Charged Constituents

Equation (4) is a basic reference in the modelling of diffusion.

Indeed, for non-reacting mixtures the basic equation is written in the form

tωα = − · hα , (19)

the occurrence of ρ, though non-constant,  being  ignored;  in  the literature the notation is frequently ci and Ji for ωα and hα. For definiteness, look at the motion of a charged constituent in a fluid medium.

The diffusion flux is viewed as the sum of three terms [10]: a diffusion term Dα ∇ ωα as in Fick’s law, an advective term ωαv viewed as the transport of the constituent via the motion of the fluid, the diffusivity times the electric force (electromigration). The advective term may be ignored by selecting a frame at rest with the fluid.

An extensive approach in the literature is based on eq. (18) and on hα = −Dα ∇ ωα

in the simplest model. Borrowing from the properties of the ideal gas we take the chemical potential µα in the form

d 1

to within inessential additive terms independent of ωα. Hence we observe that, at constant temperature,

d 2

Now the chemical potential is an energy per unit mass. Assume the αth constituent consists of ions with electric charge zαe, where e is (the absolute value of) the electron charge. The force per unit mass is

d 3

φ being the potential and mα the ion mass. Moreover

d 4

where F is the Faraday constant, i.e. the charge of a mole, and Mα is the molar mass. Hence we write the whole chemical potential, or electrostatic-chemical potential, in the form

d 5

This is a form of the Nernst-Planck equation [11].

Kirkendall Effect

The Kirkendall effect involves a property of diffusion associated with different diffusivities of the constituents. The property was found experimentally by Smiglskas and Kirkendall. In essence, molibdenum markers are located at the boundary between the inner CuZn block and the outer copper covering. Upon heating, the markers are observed to move inward. To explain the experiment, we observe that within the block Cu and Zn atoms have the same density N; since  the atomic weights are almost the same (Cu 63.5, Zn 65.4) the equal density N means equal concentration ω. The Zn atoms have a higher diffusivity coefficient and hence the outward flux of Zn is not exactly compensated by the inward flux of Cu atoms. Thus the mass of matter in the block decreases and this results in the movement of the copper- brass interface(markers) toward the inner block.

We now ask for the velocity of the markers. We have

ρZnuZn = hZn = −DZnω, ρCuuCu= hCu = −DCu ω;

really we should account also for a inward flux of vacancies (from the material with the higher diffusion coefficient). In one dimension we obtain the velocity v of the markers as follows,

k 1

Dynamic Diffusion Equation

Models of diffusion are usually based on the balance equation (4) for the mass fraction ωα and a constitutive equation for the mass flux hα. Hence the resulting differential equation for ωα is strongly affected by the constitutive assumption. It seems of interest to look  at the evolution problem via the balance equations for the unknown densities ρα.

Restrict attention to mixtures of inviscid fluids and hence Tα = pα1. Consider the balance of mass and linear momentum in the local form,

21 22

Partial time differentiation of the first equation, divergence of the second one, and substitution of · t(ραvα) yield

2ρα =  · [ · (ραvα ⊗ vα)] −  · ( · Tα) −  · (ραbα) − · mα + tτα.

If the constituent is regarded as an inviscid fluid, Tα = −pα1, it follows

21 22 down

If, further, the temperature is assumed to be uniform, ∇ θα = 0, then

23

Equation (23) is the αth equation of a system where ∇. mα and tτα account for possible coupling terms. Since ρα = ρωα, if ρ is assumed to be constant then we have

dy 1

If the αth constituent is electrically charged then

dy 2

where e is (the absolute value of) the electronic charge, zαe is the ionic charge, and mα

is the ionic mass. In terms of molar quantities we have

dy 3

where Mα is the molar mass and F is the Faraday constant, i.e. the charge of a mole. Hence, if E is uniform then we can write the equation for ωα in the form

dy 4

Quantum Diffusion Models

If a quantum particle moves in space under a force with potential U then the wavefunction

ψ evolves in time according to the Schr¨odinger equation

q 1

where m is the mass of the particle. Since ψ is complex valued then we can write

q 2

where ρ and S are functions of the position x and time t. The relation

q 3

ascribes to ρ(x, t) the probability density, per unit volume, of finding the particle at the point x at time t. Computing tψ, ψ and substituting in (24) we obtain

q 4

Equating the imaginary parts and observing that ∇ρ · ∇S + ρS = ∇·(ρ∇ S) we have

q 5

This equation has an immediate physical interpretation. If we let ρ be the analogue of the classical mass density then if we let

q 6

we can write (25) in the form

q 7

which is formally the continuity equation in continuum mechanics. This result indicates a close analogy between quantum and classical schemes which are extended to diffusion.

We now look for the possible meaning of the relation coming from equating the real parts. Upon some rearrangements we find

q 8

The quantity Q has the role of a potential, like U , and is often referred to as Bohm quantum potential [12]. Furthermore apply the gradient to (26) and assume S has continuous second-order derivatives to have

q 9

Equation (27) is formally the equation of motion with the Lagrangian (total) time derivative in the left-hand side, as it has to be. Consequently Q may also be viewed as a pressure term.

Diffusion is modelled by having in mind the parabolic character of the classical diffusion equation. Let P be the probability density of Brownian particles with mass m. Form the equation of motion we ascribe to P the equation

q 10

p being the opposite of the pressure. Then we let p = kBθP , where kB is the Boltzmann constant. In the high friction limit [13] it follows the parabolic equation

q 11

When quantum diffusion is described within a continuum mechanics approach the governing equation is taken in a Fick-like form. As an example [14], in the quantum diffusion of H atoms in solid molecular hydrogen films, the H atom concentration, n, is described by a differential equation in the form

q 12

Conclusions

Well-known diffusion equations are considered for the concentration (mass fraction) ωα = ρα. In addition to the classical parabolic equation (6) we have reviewed the Cahn-Hilliard equation (8) and the Ginzburg-Landau equation (9). The rather general approach to the modelling of diffusion processes is based on the view that the diffusion flux, here hα, has to be determined by a constitutive equation and that a safe rule is to let hα be proportional to the gradient of the chemical potential µα. As a remarkable example we have shown how the approach via chemical potentials, for charged constituents, leads to the Nernst-Planck equation. Diffusion in the quantum domain is still based on the classical Fick’s law.

While hα in terms of ωα is inherited from the historical Fick’s model, the recourse to the chemical potential is found to be thermodynamically consistent in two cases, just those leading to the Cahn-Hilliard and Ginzburg-Landau equations. In the present thermodynamic analysis the αth chemical potential is derived from the Helmholtz free energy

conclusion

instead of from ψα(ωα).

The developments of this paper show that the constitutive equations for the mass flux hα are in fact approximations; the involved equation for hα [1] justifies the recourse to approximations. However, the investigation of approximated  diffusion  equations  indicates  that a privileged role should be ascribed to the dynamic differential equations, based on the (exact) balance equations (21), (22). The difference in having recourse to the dynamic equations is exemplified with the analogue of Nernst-Planck equation.

Acknowledgments

This research has been developed under the auspices of INDAMCNR.

References

  1. Müller I (1975). Thermodynamics of mixtures of J. M´ecan. 14: 267-303.
  2. Morro A (2014). Balance and constitutive equations for diffusion in mixtures of fluids, Meccanica 49: 2109-2123.
  3. Fick A (1855). Ueber Ann. Phys. 170: 59-86.
  4. Kittel C (1976). Introduction to Solid State Wiley.
  5. Landau LD, Khalatnikov IM (1965). On the theory of Oxford.
  6. Cahn JW (1961). Spinodal Acta Metall. 9: 795-801.
  7. Cahn JW, Hilliard JE (1971). Spinodal decomposition: a Acta Metall. 19: 151- 161.
  8. Gurtin ME (1996). Generalized Ginzburg-Landau an Cahn-Hilliard equations based on a microforce Physica D. 92: 178-192.
  9. Brokate M, Sprekels J (1996). Hysteresis and Phase Springer.
  10. Kirby BJ (2010). Micro- and Nabnoscale Fluid Mechanics: Transport in Microfluidic Devices, Cambridge University Press.
  11. Bockris JO’M, Reddy AKN (1970) Modern Plenum Press.
  12. Bohm D (1952). A suggested interpretation of the quantum theory in terms of “hidden” I. Phys. Rev. 85: 166-179 (1952).
  13. Tsekov R (2009). Thermo-quantum Int. J. Theor. Phys. 48: 630-636.
  14. Sheludiakov S, Lee DM, Khmelenko VV, J¨arvinen J, Ahokas J et al. (2021) Purely spatial quantum diffusion of H atoms in solid H2 at temperatures below 1 K, Phys. Rev. Lett. 126: 195301.
fig 5

Magnitude and Patterns of Female Genital Mutilation/ Cutting in Somaliland: The Case of Edna Adan University Hospital: A 17 Years’ Record Review

DOI: 10.31038/IGOJ.2022514

Abstract

Introduction: Female genital mutilation/cutting (FGM/C) involves partial or total removal of external female genitalia. The practice has no health benefits for girls and women. Somaliland is among the countries with the highest prevalence of FGM-C in the world.

Objective: To measure the magnitude and describe the trends of Female Genital Mutilation/Cutting among women attending Antenatal Care (ANC) and Delivery service at Edna Adan University Hospital, Hargeisa, Somaliland.

Methods: Edna Adan University Hospital, Hargeisa, Somaliland continuously records FGM/C status of pregnant mothers coming for ANC and delivery services since 2002. 13,320 antenatal and delivery cases were reviewed using a pre-determined checklist. Data were analyzed using IBM SPSS version 20, descriptive statistical analysis was performed. P-values less than 0.05 were considered statistically significant.

Results: Among the 13,320 reviewed charts, the overall prevalence of FGM/C was 96%. The reason for the majority (31.8%) of the FGM/C cases was traditional beliefs. Moreover, the majority (60.1%) of the FGM/C was performed by the traditional birth attendants (TBA). The median age that FGM/C is performed is 8 (IQR=3). The majority of girls are aged 7-10 when the procedure is performed. From 2002-2007, it was more common for an old woman to perform FGM; from 2007-2018, a traditional birth attendant conducted the procedure. Type III FGM/C (infibulation) appears to be the most commonly practiced type of FGM/C across the board.

Conclusion: The magnitude of FGM/C is high in Somaliland and is still practiced especially among women who are illiterate. The procedure is performed by traditional birth attendants for traditional reasons. Instigating interventions that would provide risk and benefit based health education to communities and promote girl-child education beyond the primary level could help end the practice.

Keywords

Edna Adan University Hospital, Female Genital Mutilation/Cutting, Somaliland, Traditional Birth Attendant

Introduction

Female genital mutilation (FGM) is defined by the World Health Organization (WHO) as all procedures that involve partial or total removal of the external female genitalia and/or injury to the female genital organs, whether for cultural or any other non-therapeutic reasons [1]. Globally, an estimated 200 million girls and women have undergone the cut, and approximately 70 million girls aged 0-14 years are at risk of being cut [2]. In a 2016 study, 25 communities living in the MaroodiJeex and Togdheer regions of Somaliland reported that the overall prevalence of FGM/C was 99%, with 80% having undergone infibulation [3].

The nomenclature for the practice varies across countries, ideological perspectives and research frames. According to the World Health Organization (WHO), female genital mutilation is classified into four major types:

Type 1: Excision of the prepuce with or without excision of the clitoris (Figure 1).

fig 1

Figure 1: Type I of WHO classification of female genital mutilation/cutting

Type 2: Excision of the clitoris with partial or total excision of the labia minora (Figure 2).

fig 2

Figure 2: Type II of WHO classification of female genital mutilation/cutting

Type 3: Excision of part or all of the external genitalia and stitching together of the exposed walls of the labia majora, leaving only a small hole (typically less than 5cm) to permit the passage of urine and vaginal secretions. This hole may need extending at the time of the menarche and often before first intercourse (Figure 3).

fig 3

Figure 3: Type III of WHO classification of female genital mutilation/cutting

Type 4: This includes all other harmful procedures to the female genitalia for non-medical purposes (e.g. pricking, piercing, incising, scraping and cauterizing the genital area) [4].

Though FGM is practiced in more than 28 countries in Africa and a few scattered communities worldwide, its burden appears to be felt most heavily seen in Nigeria, Egypt, Mali, Eritrea, Sudan, Central African Republic (C.A.R.), and the northern part of Ghana where it has been an old traditional and cultural practice of various ethnic groups. The highest prevalence rates are found in Somalia, Somaliland, Djibouti and the Somali Region of Ethiopia where FGM is virtually universal [5].

Female genital mutilation/cutting (FGM/C) inflicts life-long injuries on women and their female children. It constitutes a violation of women’s fundamental human rights and threatens their bodily integrity. Historically performed by elderly women, or traditional birth attendants, FGM/C is a physically invasive procedure often associated with multiple adverse impacts [6]. FGM/C in Somalia and Somaliland is frequently performed on girls aged 5-9. This represents a shift in practice. Traditionally, FGM/C was performed in adolescence as an initiation into womanhood, but that is not true in Somali practices since FGM is performed in early ages [7]. Moreover, girls are one-third less likely to be cut than 30 years ago. According to the UNFPA-UNICEF joint program report on FGM/C,22 of the 30 of the countries involved where FGM is practiced and who are considered “least-developed” [8]. The health impacts associated with FGM/C that require interventions have been broadly categorized into the following categories: immediate, genito-urinary, gynecological, obstetric, sexual, and psycho-social consequences [9].

The reason why FGM is performed varies from one region to another as well as over time, and includes a mix of sociocultural factors within families and communities. In places where FGM is a social convention, strong motivations to perpetuate the practice of FGM include: the pressure to conform to what others have traditionally been doing, the need to be accepted socially, and the fear of being rejected by the community. Furthermore, FGM is often considered a necessary part of raising a girl, and a perceived requirement to prepare her for adulthood and marriage. In addition, FGM is often motivated by beliefs about what is considered acceptable sexual behavior. It aims to ensure premarital virginity and marital fidelity, by proving that her vulva has not been opened previously by any other man. Moreover, FGM is associated with cultural ideals of femininity and modesty, which include the notion that girls are clean and beautiful after removal of body parts that are considered unclean, unfeminine, or male [10].

In Somaliland, despite the continuous pledge to end female genital mutilation/cutting, this centuries-old practice still continues for non-medical reasons. Furthermore, the problem is not well-documented and reported. The majority of the studies about the prevalence and trends of FGM/C are based on reports from women attending health institutions. Moreover, community-based studies are expensive in nature. Information acquired from the woman’s own account has limitations since the woman might not easily understand the anatomy of her female genitalia nor be able to accurately classify the type of FGM/C that was performed on her. In order to overcome the limitations of such studies, reviewing hospital records and describing the magnitude and pattern of FGM/C must be appropriately verified by midwives and physicians. Moreover, understanding these phenomena could guide efforts to curb this harmful practice and reduce the morbidity and mortality of mothers and children. Furthermore, the investigators have developed the following research questions:

What is the overall prevalence of FGM/C in Somaliland?

What is the most prevalent type of FGM/C in Somaliland?

What does the trend of FGM/C look like since 2002?

What is the average age of practicing the FGM/C?

Is there association between FGM/C and educational status of the mother?

Method and Materials

Description of the Study Area and Study Setting

General Setting

According to the Somaliland Health and Demographic Survey 2020 (SLHDS, 2020) report, over 48 percent of Somaliland’s population is under the age of 15 years old, and 48 percent of the population is within the working age group (15-64 years old). The population of Somaliland has an average household size of six. Early marriage is common, particularly for women, as 23 percent aged 20 -24 interviewed were married by the time they turned 18 years old. FGM/Chas been practiced in Somaliland for several decades with insignificant declination. Furthermore, more than 70 percent of women indicated that the forms of domestic violence they are subject to by their husbands are physical assault, denial of education, forced marriage, rape, and sexual harassment. SLHDS noted that an overwhelming 67 percent of births were delivered at home. The death rate among reproductive age women is highest with 9.4 deaths per 1,000 populations, among women aged 30-34. This is also the age group in which childbearing hits its peak. Somaliland’s Maternal Mortality Rate (MMR) is 396 per 100,000 live births. Female Genital Mutilation/Cutting (FGM/C) is prevalent among 98% of women in their reproductive age [11].

Study Site

Edna Adan Ismail, a UK/US trained Somaliland certified nurse midwife, has been seeing patients with cases of FGM/C for the duration of her 50 years of midwifery experience, and has been engaged in a life-long struggle to put an end to this practice. With the establishment of her maternity hospital which is now a major teaching and referral general hospital, as well as with the still much-needed national services to combat FGM/C practices, it has become essential for the hospital to lead a campaign to tackle this tradition against women’s rights. The hospital is fast becoming a repository of all information relating to FGM/C in Somaliland and the region. The hospital has been registering mothers coming to the hospital for antenatal care (ANC) and delivery service since 2002. Though these were used as audit reports, these huge data sets have not been adequately analyzed. This research team has been established to conduct a detailed analysis and point out the important findings that would answer the above listed research questions and contribute for planning and interventions to end FGM/C by all stakeholders.

Study Design and Population

We conducted a 17 years’ retrospective hospital-based medical-record review in February 2022. After securing ethical clearance from the Edna Adan University Hospital Ethical Review Committee (ERC), we reviewed all 13,320 records of women who visited the antenatal clinic and who gave birth at Edna Adan University Hospital between the years 2002-2018. The female genital mutilation or cutting (FGM/C) data has been continuously recorded by the hospital starting from 2002 to 2018.

Data Extraction and Analysis

The data was extracted from the ANC and delivery charts using a predetermined English version data extraction checklist by 18 senior public health students and another two supervisors who were trained for three days on how to extract information from the ANC and delivery charts. Extracted data was cross-checked by the research assistants and all necessary modifications were made. Moreover, data entry, editing, coding and recoding, descriptive statistics, numerical summary measures, and analytic statistical tests such as Chi-square test and correlation tests were done using SPSS version 20 statistical software by the principal investigator and the research team. p-value and 95% confidence interval was used to determine if there was association among the variables or not. p-value less than 0.05 was considered a statistically significant association. In this study, classification of FGM/C was in accordance to the World Health Organization (WHO). After extraction of the required information, the charts were kept confidential and sent back to the hospital repository.

Variables

The following variables were extracted from the records: sociodemographic characteristics such as age, residence, educational status, and the year the data was collected; and FGM/C related variables such as FGM/C status, FGM/C type, reason for FGM/C, agent who performed the practice and place it was performed, age FGM/C was performed, as well as if FGM/C of daughter was performed and the reason for FGM/C.

Ethical Approval

Ethical clearance was solicited from the office of research and ethical committee of the Edna Adan University Hospital (ERC: EAUH/5973/22, dated 23 February, 2022) and confirmation of permission to access the data from the archives was secured from the hospital Director. The patient charts were properly handled ensuring the respect for the confidential nature of the survey during the data extraction and returning the charts to the repository of the hospital for storage.

Results

We reviewed and explored total of 13,320 ANC charts about the educational level of the clients, the reasons for performing FGM/C and the agent responsible for performing the procedure – we found that the overall prevalence of FGM/C in the patient population was 96%. The majority (60.2%) of the FGM/C were illiterate. And, the reason for the majority (31.8%) of the FGM/C cases was for traditional belief. Moreover, the majority (60.1%) of the FGM/C was performed by the traditional birth attendants (Table 1).

Table 1: Distribution of educational level, reasons for FGM/C and agent who performed the procedure, Hargeisa, Somaliland

table 1

NA* refers to Not Available

We have also run an analysis to look at the trend of the FGM/C and it depicts that there is a slight increase from 2002-2007 to 2008-2013, whereby the number of FGM/C procedures performed goes from 4591 (36%) to 5483 (43%). However, there is a steady decline of cases from 2008-2013 to 2014-2018 in which the cases reported was 2659 (21%) (Figure 4).

fig 4

Figure 4: A 17 years’ trends of Female Genital Mutilation in Hargeisa, Somaliland

The following figure shows that the median age that FGM is performed is 8 (IQR= 3) years old. The majority of girls are aged 6-10 when FGM is performed. Moreover, FGM/C declines sharply after the age of 12 and almost insignificant before the age of 4 (Figure 5).

fig 5

Figure 5: Distribution of the age FGM/C is Performed, Hargeisa, Somaliland

Even though there are fluctuations across the 17 years, it is observed that from 2002-2007 had the highest record rates of type III FGM/C 4451 (36%), as well as in 2008-2013 were the number of cases was 4315 (35%) though number of cases were declining 2014-2018, 1926 (16%). Type III FGM/C (infibulation) appears to be the most commonly practiced type of FGM/C across the board (Figure 6).

fig 6

Figure 6: Distribution of FGM type per year, Hargeisa, Somaliland

The following figure denotes that from 2002-2018, an old woman or traditional birth attendant were most commonly those that performed FGM/C. From 2002-2007, it was more common for an old woman to perform FGM, whereas from 2007-2018, a traditional birth attendant did the procedure (Figure 7).

fig 7

Figure 7: Distribution of the year and the agent who performed the FGM/C. Hargeisa, Somaliland

We used Chi-squared test statistic to assess whether education level and FGM/C status are associated, and we found that there is a statistically significant association (p-value=0.001). Moreover, we observed a sharp decrease in likelihood to perform the FGM/C procedure as education level rises. In addition, those that perform FGM/C on their daughters are most commonly illiterate (Figure 8).

fig 8

Figure 8: The pattern of FGM/C cases versus Educational Level, Hargeisa, Somaliland

Type III FGM is found in almost 87 percent of the population we studied from 2002-2018, making it the most common type of FGM performed among those studied (Figure 9).

fig 9

Figure 9: Distribution of the Type of FGM/C, Hargeisa, Somaliland

Discussion

Somaliland continues to house a high prevalence of the phenomena known as female genital mutilation and cutting, compared to other countries in the horn of Africa and in Eastern Africa. This could be attributed to the fact that Edna Adan University Hospital is the only hospital in Eastern Africa that we know of that collects such data. As previously stated, the problem is not well-documented and reported; due to this, our research team set out to encapsulate the data of 13,320 women polled at the Edna Adan University Hospital in Hargeisa, Somaliland to fully grasp the magnitude and trends of FGM/C, based upon women’s reports taken during their antenatal appointments at our health institution. Their information was kept confidential throughout the entirety of the process and the patient files were returned to the repository in which they were stored upon completion of the analysis of the data presented.

The investigators developed the following research questions in order to fully understand the data gathered from 2002-2018: What is the overall prevalence of FGM/C in Somaliland? What is the most prevalent type of FGM/C in Somaliland? What has the trend of FGM/C looked like since 2002? What is the average age of those who had undergone FGM/C? Is there an association between FGM/C and educational status?

The current study reveals that the overall prevalence of FGM/C is 96% among the patients who attend Edna Adan University Hospital that may not give a true picture of the situation in Somaliland. However, this result goes beyond previous studies conducted in Tanzania, Nigeria, Yemen, Burkina Faso, Gambia, and Mauritania, where the prevalence of FGM/C was (45.2%, 45.9%, 48%, 68.1%, 75.6%, and 77%), respectively [12-17].

Moreover, the major findings associated with the research questions presented are as follows: it appears that there is a slight increase in the trend of FGM from 2002-2007 to 2008-2013, where the number of FGM/C procedures performed goes from 4591 (36%) documented cases to 5483 (43%) documented cases. There was a steady decline in cases from 2014-2018 which the case reported was 2659 (21%). Besides, our study is against when compared to a meta-analysis conducted in Ethiopia where the prevalence of FGM/C was higher from 2013-2017 (78.39%, 95% CI: 48.2, 108.5) [18].

A similar study conducted in Egypt to assess the prevalence of FGM among girls showed that the average age at which girls underwent FGM was 10.1 years, which is higher when compare to our findings that it is 8 years old [19]. Moreover, in our study, the majority of girls are aged 6-10 when FGM is performed.

Furthermore, it appears that in 2002-2007, record rates of type IIIFGM occurred, as well as in 2008-2013. Type III FGM seems to be the most common type of FGM performed across the span of the data in its entirety. Between 2002 and 2018, type III FGM was observed in 87 percent of the population studied. As a result, it is the most common type of FGM among those studied. This result ties well with a previous study conducted in Sudan, wherein type III FGM was the most common practice, while 66 percent of those who had undergone FGM had type III FGM [20].

Nevertheless, when it comes to agents who performed FGM, a study carried out in Burkina Faso explored that traditional practitioners performed the vast majority (82.4%) of FGM [15]. However, it is also a point of interest to note that the data suggests that an old woman or traditional birth attendant were most commonly those who performed FGM. From 2002-2007, it was more common for an old woman to perform FGM, whereas from 2008-2018, a traditional birth attendant performed the procedure.

Another study conducted in the United Arab Emirates to assess the association between educational status and FGM/C found that there is a statistically significant association between FGM status and educational level (p-value 0.001). Moreover, there was an inverse association between FGM status and literacy level: with increasing educational levels, there was a decrease in the proportion of women with FGM/C [21]. This result ties well with our data, which indicates that there is a sharp decrease in the likelihood of performing the FGM procedure as education level rises. Those that perform FGM on their daughters are most commonly illiterate. As the family’s education level rises, they are less likely to perform FGM on their daughter, suggesting there is a strong association between the education level of the family (the mother specifically) and the likelihood that she will organize the FGM/C procedure to be committed for her daughter (s) (p-value 0.001). We consider this to be the most important finding because if wide-spread education about the harms and tribulations of FGM/C and its long-term and short-term effects on those it is performed upon could target far-reaching communities as well as those in big cities, there may be a notable shift in the number of FGM/C cases seen in Hargeisa, Somaliland and other surrounding areas.

Alternatively, it is possible that the decrease in FGM/C cases is not solely attributable to the rise in education levels of the family. It could be possible that campaigns against the practice of FGM/C are also influencing attitudes towards FGM/C which are shifting ever so slightly with the younger population as they enter their reproductive years. Further studies to explore this variable would have to be conducted in order to be confirmed.

In regards to the type of FGM/C that is most commonly performed, it is possible that the data is not entirely accurate and can only be confirmed if a healthcare provider (nurse, midwife, or doctor) does a thorough exam of the patient’s genitals in order to confirm if it is indeed type I, II, or III FGM/C that was performed. It is highly likely that the women do not fully grasp the difference between the types of FGM or can accurately report the type that was done to them. During ANC, it is the nurse or midwife who physically examines the patient and who verifies the type of FGM/C seen in the patient.

There were limits to the study as well – the data for 2005, 2006 and 2019 appears to be incomplete and, due to very scarce data in 2019, it was omitted from the report. The data for 2020-2022 has not been documented during antenatal appointments, so our data is only up to date insofar as 2019.

Another limit is the amount of data made available to the research team-in order to fully encapsulate the prevalence of FGM/C in this area of Africa, other hospitals in Somaliland, as well as in neighboring countries, would have to be included in the study as a means of comparison. That extent of data was not made available to this research team, and further research would need to be done in order to accurately capture the desired results.

Conclusion

In this study, we documented and reported women’s sociodemographic characteristics such as age, residence, educational status, and the year the data was collected; and FGM/C related variables such as FGM/C status, FGM/C type, reason for FGM/C, agent who performed the practice and place it was performed, age at which FGM/C was performed, as well as if FGM/C of a daughter was performed and the reason for FGM/C. We chose these variables in the hope that trends in the data would appear. Most notably, there is an association between the education level of the mother and the likelihood that she will perform FGM/C on her daughter. There also appears to be a great likelihood that type III FGM/C will be performed on girls, the median age that FGM is performed is 8 years old, most commonly between the ages of 6 and 10, and that the procedure will be done either by a traditional birth attendant or an old woman in the community.

Overall, it appears that FGM/C is not decreasing in prevalence as the years go by. Further research into the prevalence for the years 2019-2022 should be conducted in order to accurately capture the number of FGM/C cases seen at Edna Adan University Hospital until now. Further data should have to be collected from the surrounding hospitals in order to conduct a comparative analysis.

Acknowledgement

We are pleased and thankful to Edna Adan University Hospital. We also acknowledge our data collectors for their tireless effort.

References

  1. Organization WH (1998) Female genital mutilation: an overview: World Health Organization.
  2. Shell-Duncan B, Naik R, Feldman-Jacobs C (2016) A state-of-the-art synthesis on female genital mutilation/cutting: What do we know now?
  3. Newell-Jones K (2016) Empowering communities to collectively abandon FGM/C in Somaliland. Action Aid. 2016.
  4. https://www.who.int/news-room/fact-sheets/detail/female-genital-mutilation [Internet].
  5. Okeke TC, Anyaehie U, Ezenyeaku C (2012) An overview of female genital mutilation in Nigeria. Annals of Medical and Health Sciences Research 2: 70-73. [crossref]
  6. Berg RC, Underland V (2014) Gynecological consequences of female genital mutilation/cutting (FGM/C): Nasjonalt kunnskapssenter for helsetjenesten. [crossref]
  7. UNFPA-UNICEF Joint Programme on Female Genital Mutilation, August 2018.
  8. Activities UNFfP (2015) Demographic perspectives on female genital mutilation: UNFPA.
  9. Berg RC, Underland V, Odgaard-Jensen J, Fretheim A, Vist GE (2014) Effects of female genital cutting on physical health outcomes: a systematic review and meta-analysis. BMJ Open 4: e006316. [crossref]
  10. World Health Organization (WHO) fact sheets, Female Genital Mutilation (FGM), 21 January 2022 [Internet].
  11. The Somaliland Health and Demographic Survey 2020 (SLSDH 2020).
  12. Klouman E, Manongi R, Klepp KI (2005) Self‐reported and observed female genital cutting in rural Tanzania: Associated demographic factors, HIV and sexually transmitted infections. Tropical Medicine & International Health 10: 105-115. [croosref]
  13. Snow RC, Slanger TE, Okonofua FE, Oronsaye F, Wacker J (2002) Female genital cutting in southern urban and peri‐urban Nigeria: self‐reported validity, social determinants and secular decline. Tropical Medicine & International Health 7: 91-100. [crossref]
  14. Alosaimi AN, Essén B, Riitta L, Nwaru BI, Mouniri H (2019) Factors associated with female genital cutting in Yemen and its policy implications. Midwifery 74: 99-106. [crossref]
  15. Inungu J, Tou Y (2013) Factors associated with female genital mutilation in Burkina Faso. Journal of Public Health and Epidemiology 5: 20-28.
  16. Kaplan A, Forbes M, Bonhoure I, Utzet M, Martín M, et al. (2013) Female genital mutilation/cutting in The Gambia: long-term health consequences and complications during delivery and for the newborn. International Journal of Women’s Health 5: 323. [crossref]
  17. Ouldzeidoune N, Keating J, Bertrand J, Rice J (2013) A description of female genital mutilation and force-feeding practices in Mauritania: implications for the protection of child rights and health. PLoS One 8: e60594. [crossref]
  18. Fite RO, Hanfore LK, Lake EA, Obsa MS (2020) Prevalence of female genital mutilation among women in Ethiopia: A systematic review and meta-analysis. Heliyon 6: e04403. [crossref]
  19. Tag-Eldin MA, Gadallah MA, Al-Tayeb MN, Abdel-Aty M, Mansour E, et al. (2008) Prevalence of female genital cutting among Egyptian girls. Bulletin of the World Health Organization 86: 269-274. [crossref]
  20. Satti A, Elmusharaf S, Bedri H, Idris T, Hashim MSK, et al. (2006) Prevalence and determinants of the practice of genital mutilation of girls in Khartoum, Sudan. Annals of Tropical Pediatrics 26: 303-310. [crossref]
  21. Al Awar S, Al-Jefout M, Osman N, Balayah Z, Al Kindi N, et al. (2020) Prevalence, knowledge, attitude and practices of female genital mutilation and cutting (FGM/C) among United Arab Emirates population. BMC Women’s Health 20: 1-12.