Archives

fig 1

Effects of African Walnut (Tetracarpidium conophorum) Leaf Powder on Growth Performance and Histopathology of African Catfish (Clarias gariepiuns)

DOI: 10.31038/AFS.2022442

Abstract

The growing concerns of consumers on the use of antibiotics a growth promoter in fish feed have fueled the interest in alternative products. An eight week study was carried out to evaluate the effects of African walnut (Tetracarpidium conophorum) leaf powder on the growth performance and histopathology of African catfish (Clarias gariepinus). Three hundred and twenty (320) juvenile catfish were individually weighed and randomly distributed into four dietary treatments; each treatment had four replicates each with a total of twenty per replicate on the basis of their weight. Four experiment diets were formulated with the inclusion of African walnut (Tetracarpidium conophorum) leaf powder (TCLP). The diets were made as followings: (T1) basal diets, (T2) T1+10 g TCLPKg/diet; (T3) T1+20 g TCLE (T4) T1+30 Gtclp. Data were collected on growth performance and subjected to one way of analysis of variance in a Completely Randomized Design. Histopathological examinations were carried out on the liver of the catfish. The result of the growth performance showed that the highest mean value weight gain was observed in T3 (3.47 g), followed by T4 (2.83 g) T2 (2.25 g) and lowest weight gain was in T1 (1.83 g). Feed intake was significantly (p>0.05) reduced catfish fed with T1 and T2 with the value (5.17 g) and (5.57 g) respectively. Feed intake of T3 catfish however were higher, although they achieved the best feed conversion ratio (1.74) as compared to (2.88) and (2.74) observed for T1 and T2 respectively. Result of the histopathology showed that there was presence of diffuse vacuolar degeneration of hepatocyts in fish fed varying levels of African walnut (Tetracarpidium conophorum) leaf powder. It can be concluded that dietary supplementation of African walnut (Tetracarpidium conophorum) leaf powder improved the growth performance of African catfish (C. gariepiunus).

Keywords

Catfish, African walnut, Juvnile, Feedintake and histopathology

Introduction

Aquaculture has grown by 6.9% per annum since 1970 [1] and now provides half of global fish supply [2]. As global demand continues to grow, there are opportunities for aquaculture to expand sustainably [3]. In Nigeria, it remains the only option that may ensure the maintenance of the current levels of per capita supply of fish of especially with the declining situation of capture fisheries [4].

The African catfish (Clarias gariepinus) is the major species of catfish cultured in Nigeria due to its high growth rate, good flesh quality, tolerance to poor water, ability to withstand high stocking densities and good taste [5].

Aquaculture as an emerging industrial sector requires continued research with scientific, technical developments and innovations [6,7] in different aspects of production including the search for natural alternative growth promoters to be used as feed production including the search for natural alternative growth promoters to be used as feed supplements. To develop alternative practices for growth promotion and disease management in aquaculture, attention has been focused in identifying novel drugs, especially from plant sources. These drugs may be delivered to the cultivable organisms through feed supplementation [8]. Several herbs have been confirmed as growth promoters in aquatic animals [9].

African walnut (Tetracarpidium conophorum), like many plants in Africa and other parts of the world has been proven to have nutritive, medicinal, agricultural and industrial values over the years. Phytochemical analysis of Africa walnut indicates that it contains bioactive compounds such as oxalates, phytates, tannins, saponins and alkaloids which partly show the use of the seeds, leaves and roots in herbal medicine [10]. The presence of tannin supports its anti- inflammatory property [11]. As a rich source of alkaloids, coupled with the presence of the essential vitamins and minerals, T. conophorum can be seen as a potential source of useful food and drugs. Its seed is rich in fat, nearly eighty per-cent of unpolysaturated fat with proven cholesterol lowering walnut extracts properties. [12] reported that walnut extracts t which is rich in dietary omega -3-fatty acids play a role in the prevention of some disorders including depression as well as dementia. Studies have shown that T. conophorum possess some properties that are required for wound healing like antibacterial and antioxidant activities [13] and immune stimulating activities [14]. Extracts of T. conophorum leaves have been shown to possess good antibacterial activities especially against Gramm positive organisms.

Based on the aforementioned bioactive compounds and properties of (T. conophorum) plant, there is need to know whether (T. conophorum) leaf could be used as feed additives for catfish for producing safe and cost effective fish.

Materials and Methods

The experiment was carried out at the fisheries unit, federal college of agriculture moor plantation, Ibadan, Nigeria. It is located on longitude 03/051E, Latitude 07/023N and altitude 650” lies in the humid zone of the rain forest belt 07/0 3.25 of south western Nigeria with mean annual rainfall of 122 mm and mean temperature of 20°C.

Sourcing and Processing of Test Ingredients

Tetracarpidum conophorum leaves were obtained from a farm in Ondo, Akure. They were washed with clean water and allowed to air dry under shade until they were crispy to touch, while retaining the greenish coloration. The leaves were then milled using a hammer mill into powder and stored in the dark in airtight plastic bags at ambient temperature. The proximate analysis of the test ingredient was analyzed in the laboratory according to [15].

Management of the Experiment

Three hundred and twenty (320) juvenile African catfish were purchased at a reputable farm, they were randomly assigned to four treatments of 80 juveniles per treatment with four replicates of twenty juvenile catfish each and were fed with commercial feed for two weeks for acclimatization before the commencement of the experiment. During the experiment fish were fed with 2 mm of formulated fed with inclusion of African walnut (Tetracarpidium conophorum) leaf powder at 4% of their body weight. Plastics were used for rearing the experimental fish. Water in the plastic was changed biweekly to avoid the building up of nitrates and nitrites as influence leaching was not possible due to the use of plastic materials, and also to prevent predators from entering the plastic tanks.

Experimental Diet

Four experimental diets were formulated with the inclusion of Tetracarpidium conophorum leaf Powder (TCLP) (Table 1).

The diets were made as followings:

T1: Control/basal diet

T2: Basal diet + 10 g TCLP Kg/diet

T3: Basal diet + 20 g TCLP Kg/diet

T4: Basal diet + 30 Kg TCLE Kg/diet.

Table 1: Gross composition (g/100 g dry matter) of the experiment diet

Ingredients

Quantity (kg)

Maize

20

SBM

30

F/M

25

GNC

20

DCP

2

Starch

2

Salt

1

Total

100

Calculated Analysis
Metabolizable energy (kcal/kg)

2,750

Crude protein (%)

39.79

Moisture content (%)

9.88

Ether extract (%)

2.81

Ash content (%)

8.96

Dry matter (%)

90.13

NFE (%)

36.38

Key: FM: Fish Meal; SBM: Soya Beans Meal; GNC: Groundnut Cake; NFE: Nitrogen Free Extract

Data Collection

Growth Performance Evaluation

Records of live weight, fed intake, weight gain and mortality and feed conversion ratio (FCR) were determined.

Weight Gain

The fish were weighed at the commencement of the experiment and subsequently on weekly basis

Feed Conversion Ratio (FCR)

The FCR of each of the group of fish was determine by calculating the ratio of feed intake to weight gain and thus calculated as:

Feed conversion ratio (FCR) = Total feed intake (g)/Total body weight gain (g)

Histopathology

The histopathology examinations were carried out on the liver of the fish at the department of veterinary pathology, university of Ibadan Nigeria. The organs were carefully removed from the body of the fish so as to avoid damage and were preserved in 10% formalin solution. The fixed tissues were processed routinely for histological analysis as described by [16]. The necrotized areas were then photographed and read accordingly to determine the histopathological effects of Tetracarpidum conophorum leaves.

Statistical Analysis

Data obtained were subjected to analysis of variance (ANOVA) using generalize model of SAS Moonscape programmed version significant differences among mean for treatment were portioned by Duncan multiple range test at 5% level of probability (Tables 2-3).

Table 2: Proximate composition of African walnut (Tetracapidum conophorum) leaf

Proximate composition

Values (%)

Moisture content

26.46

Ash content

9.66

Crude protein

15.71

Crude fibre

13.63

Dry matter

73.8

Total carbohydrate

29.58

Table 3: Phytochemical Analysis of (Tetracarpidum conophorum) leaf

Content

Leaf

Tannin

0.56

Saponin

1.03

Flavonoid

0

Soluble carbohydrate

1.07

Reducing sugar

1.74

Result and Discussion

Table 4 showed effects of Tetracarpidum conophorum leaves on growth performance of experimental fish. There were no significant different in final weight, weight gain and feed intake but there was significant different in initial weight and survival rates. The highest mean value weight gain was observed in T3 (3.47 g), followed by T4 (2.83 g), T2 (2.25 g) and lowest weight gain was in T1 (1.83 g). Feed intake was significant (p<0.05) decreased catfish on T1 and T2 respectively (5.17 and 5.57 g) compared to T3 (6.04 g). T3 however achieved the best feed conversion (FCR) (1.74 g) followed by T4 (2.30 g) and T2 (2.88 g).

In the final weight gain, T3 and T4 had the highest weight gain of 9.72 g followed by (8.97 g) and T2 and T1 WITH (8.42 g) and (8.00 g) respectively. There was significant difference (p<0.005) in the survival rate where T3 (77.00) had the highest followed by T4 (74.00%), T2 (68.00%) and T1 (63.00%) respectively.

Table 4: Effects of Tetracarpidum conoohorum leaf on performance on experimental catfish

Parameters

T1

T2 T3 T4

SEM=+-

IW(g)

6.15

6.15 6.15 5.15

0

FW(g)

8.00b

8.42b 9.72b 8.97b

0.22

WG(g)

1.85b

2.27b 3.57b 2.83b

0.22

FI(g)

5.17b

5.57b 6.04b 5.20b

0.1

FCR

2.88

2.74 1.74 2.3

0.2

Sur rate

63

68 77 74

2.44

ab Means on the same row having different superscript were significantly different (p<0.05)
T1: Control 0g Tetracarpidium conophorum
T2: 10 g T. conophorum
T3: 20 g T. conophorum
T4: 30 g T. conophorum
IW: Initial Weight
FW: Final Weight
WG: Weight Gain
FI: Feed Intake
FCR: Feed Conversion Ratio
SUR Rate: survival Rate

Liver Histopathology of the Experimental Catfish

Plate 1: reveals that there was a mild portal congestion in the liver, with mild periportal vacuolar degeneration of hepatocytes. Plates 2 shows that there was a moderate to severe vacuolation of the hepatocytes, but the nuclei were still centralized. Plates 4 reveals moderate diffuse vacuolation of hepatocytes, with mild portal congestion. Plates 3 shows there was a very severe diffuse vacuolation of hepatocytes, most nuclei were marginated (Figures 1-4).

fig 1

Figure 1: Plates 1: Histological section of liver of fish fed with control (H&E 40X)

fig 2

Figure 2: PLATES 2: Histological section of liver of fish fed 10 g/kg of Tetracarpidum conophorum leaf powder (H&E 40X)

fig 3

Figure 3: PLATE 3: Histological section of liver of fish fed 20 g/kg of Tetracarpidum conophorum (H&EX40)

fig 4

Figure 4: PLATE 4: Histological section of liver of fish fed 30 g/kg of Tetracarpidum conophorum leaf powder (H&E 40X)

Discussion

The higher values obtained in the treatments fed T. conophorum leaf powder (TCLP) could be due to the presence of growth stimulants or constituents in walnut leave (alkaloids and tannins). These properties could contribute to improving the digestion and nutrient absorption with a subsequent increase in the fish – weight. Walnut leaf can be used as a growth promoter and it is known to have the ability to improve the absorptive capacity of the intestine via structural alteration [17]. This results agrees with those obtained by [18] who obtained highest growth performance in Oreochromis niloticus with 30 g garlic/kg diet, [19] also obtained the highest growth performance in O. niloticus with 2.5% garlic/kg diet.

The increased feed intake observed in this experiment in fish fed 20 g/kg of TCLP could be attributed to change in feed taste and stimulated appetite [20]. This result is in agreement with [21] who reported increased feed intake in the supplemented groups which were treated by 2% aloe vera gel dissolved in water. FCR was best with 20 g/kg TCLP inclusion and the result revealed that diet was better utilized by the C. gariepinus juveniles. This result is in agreement with those obtained by [18] who recorded increase in FCR and FER on O. niloticus with 30 g garlic/kg diet compared to the control which had the least value and [22] who found that the dietary of Biogen (R) increased feed intake, FCR, PER and body composition (crude protein, ether extract, ash and moisture) in fish. The increased feed intake observed in the experiment in diet supplemented groups could be attributed to change in feed taste and stimulated appetite [20]. This result is in agreement with [21] who reported increased feed intake in the supplemented groups which were treated by 2% aloe vera gel dissolved in water.

The presence of diffuse vacuolar degeneration of hepatocytes in fish fed varying levels of Tetracarpidum conophorum leaves and may be as a result of excessive work required by the fish’s liver to get rid of the plant toxicant from its body during the process of detoxification. This is corroborated by the work of [23] who revealed similar effect on the fish liver.

The present study showed that supplementation of T. conophorum leaf powder improved the growth performance of African catfish (C. gariepiuns), due to the growth promoting and immune – stimulation properties.

References

  1. FAO (2009) State of food insecurity in the world, 10th progress report on world hunger since 1996. Text by Rakocy JE. In: FAO Fisheries and Aquaculture Department.
  2. Naylor RL, Hardy RW, Bureau DP (2009) Feeding aquaculture in an era of finite resources. Proceeding of the National Academy of Sciences 106: 15103-15110. [crossref]
  3. FAO (2009) The state of World Fisheries and Aquaculture 2008. FAO, Rome, Italy 176.
  4. Ojutiku RO (2008) Comparative survival and growth rate of Clarias gariepinus and Hetreo clarias hatchling fed live and frozen Daphnia. Pakistan Journal of Nutrition 7: 527-529.
  5. Fang YX, Guo XZ, Wang JK, Liv ZY (2007) Effects of different animal manure on fish farming in the Asian fisheries forum (J.I maiden Ed). Philippines. Asian Fisheries Society, Manila 117-120.
  6. Alicia ET, Magarinos B, Romalde JL (2005) A review of the main bacterial fish disease mariculture system. Aquaculture 246: 37-61.
  7. Galib S.M, Naser SMA, Mohin ABM, Chaki N, Fahad MFA (2013). Fish diversity of the river choto jamuna Bangladesh present status and conservation needs. International Journal of Biodiversity and Conservation 5: 389-395.
  8. Denev SA (2008) Ecological alternative of antibiotic growth promoters in the animal’s husbandry and aquatuculture. Bsc Thesis, Department of Biochemistry microbiology.
  9. Rao YV, Das J, Pradhana BK, Chakrabarthi R (2006) Effects of Achyranthes aspera on the immunity and survival of labeo rohita infected with Aeromonas hydrophila. Shell Immunology 20:263-273. [crossref]
  10. Ayoola PB, Onawumi OO, Faboya OP (2011) Chemical evaluation and nutritive values of Tetracarpidum conophorum ( Black walnut). Int J of Herbal Medicine 1: 122-126.
  11. Ojobor CC, Anosike CA, Ani CC (2015) Studies on the phytochemical and nutritional properties of Tetracarpidium conophorum (Black walnut) seeds. J Global Biosci 4: 1366-1372.
  12. Chauhan B, Akin W, Uche FI (2004) The effects of aqueous extracts of Tetracarpidum conophrum seeds on the hormonal parameters of male guinea pigs. Asian pacific Journal of Tropical Medicine 3: 21.
  13. Amaeze UO, Ayoola GA, Sodiya MO, Adepoju-Bello AA, Adegoke AO, et al. (2011) Evaluation of anti-oxidant activity of Tetracrapidium conophorum (Mull. Arg) Hutch and Dalziel leaves. Oxidative Med cell long 2011: 976701. [crossref]
  14. Animashun T, Togun RA, Hughes CR (1994) Characterization of isolectins in conophorum seeds (Nigerian walnut). Glycoconjugation J 11: 299-303.
  15. AOAC (1990) Association of official Analytical Chemists, official methods of Analysis. 15th edition, Washington, D.C. Tetracarpidum.
  16. Samuelson A (2007) Textbook of Veterinary histology. Elsevier Health Sciences Publishing Company London, United Kingdom. 560.
  17. Oladiji AT, Abodunrin TP, Yakubu MT (2010) Some physiochemical characteristics of the oil from Tetracarpidum conophorum (Mull. Arg). Nigeria Journal of biochemistry and molecular biology 22: 93-98.
  18. Shalaby AM, Parveen MSH, Sorwar SG, Yousuf AR (2006)
  19. Diab AS, El-nagar GO, Abd-El-hady YM (2002) Evaluation of Nigella sativa (black seeds; baraks). Allium sativm (garlic) and Biogen as feed additives on growth performance and immostimulants of O.niloticus fingerlings. Suez Cana Vet. Med. J 745-751.
  20. Windisch W, Schedle K, plitzner C, Kroismayr A (2008) Use of phytogenic products as feed additives for swine and poultry. Journal of Animal sciences 86: 140-148. [crossref]
  21. Darabighane B, Abolfazl Z, Ahmad ZS, Akhtar (2008) Using aqueous extract of aloe vera gel as anticoccidial and immunostimulant agent in broiler production. Sarhad Journal of Agriculture 24: 665-669.
  22. Khattab YA, Shalaby AME, Sharaf SM, EL-Marakby HI, Rizkalla EH (2004) The physiological changes and growth performance of the Nile tilapia Oreochromis niloticus after feeding with Biogen as growth promoter. Egyptian Journal of Aquatic Biology and Fish 8: 145-158.
  23. Bamidele NA, Obasa S, Ikeiwenwe N, Abdulraheem I, A deoye AA, et al. (2015) Effects of dried moringa (moringa oleifera) seed meal based diets on growth, haematological, biochemical parameter and histopathology of African catfish, Clarias gariepinus International Journal of Fisheries and Aquatic studies 2: 27-34.

Successful Aging and Its Effective Factors

DOI: 10.31038/ASMHS.2022644

Abstract

Background: Due to the increase in the quality of life of people and access to health care in most communities, the elderly population has increased significantly and becomes a major challenge if not properly planned.

Objective: The purpose of this study is to investigate successful aging and the factors affecting it as a basic solution to reduce the challenges of aging.

Results: The findings of the studies indicate that there are obstacles in the way of achieving successful aging that should be addressed with proper planning by the community and the elderly.

Conclusion: Successful aging has multiple dimensions that it is not possible for most older people to access all of its dimensions. And it may vary from person to person. It is better to plan for achieving a successful old age based on the condition of the elderly, because many older people have chronic illnesses and disabilities. And some of them have a negative attitude towards old age.

Keywords

Aging, Active aging, Elderly, Successful aging

Introduction

The growth of the elderly population has increased in most communities. And it is estimated that by 2050 the world’s elderly population will reach 2 billion. As the aging population grows, chronic diseases such as diabetes, high blood pressure and cognitive impairment may increase. One of the solutions for countries to solve this problem is to strengthen successful aging. In this article, a review of successful aging and the factors affecting it has been done [1].

Successful Aging

Defining successful aging is not an easy task. The first definition of successful aging was provided by Ro and Kahn. And this definition includes relief from disease – high physical and cognitive function and no cognitive and neurological disorders – active interaction and life expectancy. These are just some of the definitions above.  Successful seniors are people who look older but have the ability to take care of themselves like ordinary seniors [2]. But the problem with this definition is that not all seniors meet all three of these criteria and may be affected by illness and other problems. What is important is that the elderly return to the community after a period of recovery and have the ability to take care of themselves. The best definition that can be given to successful aging is “a combination of active and healthy aging in order to achieve a sense of satisfaction in all aspects of life from the perspective of the elderly.” However, all definitions may vary from one elderly person to another.

Stressors and Its Effect on Successful Aging

Sometimes you may see elderly people who are physically, mentally and socially involved without any prior planning and effort. Researchers call such people lucky old people. It seems that despite the elderly man’s efforts, there are variables in his life that lead him to a successful old age. Such as components (income/job/family existence/correct lifestyle/lack of family history of disease, etc.) [3]. But most seniors do not have such conditions and need to know in advance how to cope with stress.

Stressors Include

Chronic illness/Death of loved ones/Social injuries/Incompatibility/Disability/Lack of medical support. To maintain the quality of life of the elderly in stressful processes, this adaptation needs to be done in principle. An elderly person needs internal resources (attitudes-beliefs and individual skills) and external resources (social-therapeutic and economic support) to adapt to stressors [4].

Factors Affecting the Process of Successful Aging and Aging

Aging is a natural phenomenon. After a while, the body’s stem cells fail and the aging process begins. But some issues affect the aging process and make it faster or slower. These include economic and social status, as well as lifestyle. Aging happens to everyone, and it is a natural phenomenon, but what is important is to avoid bad aging [5]. They will be briefly reviewed below

A. Social Factors Affecting the Aging Process

Numerous studies have determined the role of variables of social support, financial strength and literacy level in achieving successful aging. Elderly people who have the support of family, friends and the community have a sufficient level of education and adequate health resources to reach successful aging more easily.

A

B. Environmental Factors Affecting the Aging Process

Longevity and quality of life are also largely determined by what a person does to maintain their physical and mental health. Examples of this may include the above. In fact, successful aging is the result of actions that people take at a young age. Some environmental factors can be adjusted and eliminated and some of them are not preventable [6]. The goal is to reduce environmental risk factors as much as possible so that they have fewer side effects. Elderly people who are obese, smoke, do not have access to health care, do not have a positive outlook on life, and are more likely to have difficulty achieving successful aging.

B

Lifelong Intervention Strategies

As people reach old age, many of them experience feelings of worthlessness, diminished social well-being, loneliness, depression, fear of death, and the end of life. As a result, they make fewer efforts to maintain physical and mental health. A number of solutions have been suggested that can be helpful.

Participate in Volunteer Work

Make sure the elderly person engages in challenging activities throughout the day, rather than watching TV or watching movies. This may include traveling to interesting places, visiting various malls, presenting challenging games or puzzles, volunteering, and providing opportunities to participate in the community.

Give them responsibility for caring for pets such as dogs, cats or birds. In addition, let them take care of the plants if possible. This strategy is often used in nursing homes to reduce depression in the elderly and actually improve their health, and it is really effective [7].

If the caregiver of an elderly person is unable to attend these steps, arrange for a nurse or therapist to be present. The work given to the elderly must be able to be done, otherwise it will not have a good result.

Educating the Elderly for Successful Aging

Teach the basics of social media. Facebook and Instagram are great ways for seniors to connect with family and stay up-to-date on communities and the world.

Provide opportunities for the elderly to interact, educate children such as grandchildren or children in a day care center. This is a very effective strategy to help older people who feel they have a meaningful existence. And it has a great effect on improving and maintaining their health [8].

Presence of the elderly in school alongside other young people in order to use the two-way experience and reduce the intergenerational gap. Building aging schools and gathering the elderly in one place can greatly meet their social needs.

The Effect of Healthy Nutrition and Exercise on Successful Aging

Design or organize an exercise program and provide a way to encourage older people to follow it. Know your nutritional needs, especially your need for vitamins and minerals, including iron. Get some books on the subject or get help from the internet.

Make sure the person takes care of themselves and eats properly. Eating special meals, serving delicious food, eating out or having dinner can be fun and exciting for anyone regardless of age. Many older people neglect their nutrition. Improper nutrition can cause a variety of mental and physical problems in the elderly. Some seniors suffer from malnutrition due to oral problems and caregivers should consider these.

Helping to Improve Their Feelings and Relationships and Successful Aging

Make sure that an elderly person has the opportunity to look beautiful and have beautiful clothes. Make sure the person goes out in public and tries to eat or attend a public event and feel good about their appearance [6].

Also, involve your elderly loved ones in important family discussions. Give them the opportunity to share their ideas and experiences with you as you make financial, life, education and job decisions.

The Movement of the Elderly towards Active Aging

According to the definition of active aging, which is the process of turning opportunities into health, participation and security in order to increase the quality of life of the elderly, community leaders should provide facilitation programs to achieve this. One of these solutions is the Age-friendly city, which is very effective in achieving active aging and subsequent successful aging [5].

The Movement of the Elderly towards Healthy Aging

WHO defines healthy ageing as “the process of developing and maintaining the functional ability that enables wellbeing in older age.” Functional ability is about having the capabilities that enable all people to be and do what they have reason to value [9] This includes a person’s ability to:

  1. Meet their basic needs;
  2. Learn, grow and make decisions;
  3. Be mobile;
  4. Build and maintain relationships
  5. Contribute to society.

Another way to achieve successful aging is to move towards healthy aging. These concepts have multiple dimensions and need to be planned based on the abilities of the elderly. Because general planning, regardless of the circumstances of the elderly, leads to failure [10].

Conclusion

Successful aging has multiple dimensions that it is not possible for most older people to access all of its dimensions. And it may vary from person to person. It is better to plan for achieving a successful old age based on the condition of the elderly, because many older people have chronic illnesses and disabilities. And some of them have a negative attitude towards old age.

References

  1. United Nations. World Population Prospects 2019: Highlights: Report. United Nations, Department of Economic and Social Affairs, Population Division; New York, NY, USA: 2019.
  2. Jeong YJ, Chong YS, Yu NY, Kim BA, Shin HJ (2015) A meta-analysis of moderating effects and sub dimensions of successful aging. J Korean Gerontol Nurs 35: 627-642.
  3. Rowe JW, Kahn RL (1997) Successful aging. The Gerontologist 37: 433-440.
  4. Araujo L, Ribeiro O, Teixeira L, Paul C (2015) Successful aging at 100 years: The relevance of subjectivity and psychological resources. Psychogeriatr 24: 1-10.
  5. Young Y, Frick KD, Phelan EA (2009) Can successful aging and chronic illness coexist in the same individual? A multidimensional concept of successful aging. Am. Med. Dir. Assoc 10: 87-92. [crossref]
  6. Cai J Coyte PC, Zhao H (2017) Determinants of and socio-economic disparities in self-rated health in China. Int J Equity Health 16: 1-27. [crossref]
  7. Baker J, Meisner B, Logan A, Kungl A, Weir P (2009) Physical activity and successful aging in Canadian older adults. J Aging Phys Act 17: 223-235. [crossref]
  8. Amirzadeh Iranagh J, Motalebi S, Mohammadi F (2017) A theoretically based behavioral nutrition intervention for elderly women: A cluster randomized controlled trial. Int J Gerontol.
  9. Eaton NR, South SC, Gruenewald TL, Seeman TE, Roberts BW (2012) Genes, environments, personality, and successful aging: toward a comprehensive developmental model in later life. J Gerontol A Biol Sci Med Sci 67: 480-488. [crossref]
  10. Park JH, Park PY (2018) a systematic review on factors influencing the healthy aging: A Korean perspective. J Aging Res Clin Pract 7: 3-8.
fig 1

Effects of Tai Chi Practice on Brain as Assessed with Neuroimaging Techniques – A Scoping Review

DOI: 10.31038/ASMHS.2022651

Abstract

Introduction: Tai Chi (TC) has been often prescribed by geriatric clinicians to patients with a variety of neurological disorders. In the last 10 years, there has been an increase in the number of studies examining the effects of TC on brain morphology as assessed by neuroimaging including near infrared spectroscopy (NIRS) and structure and functional magnetic resonating imaging (sMRI & fMRI). Thus, the purpose of this scoping review is to evaluate how TC practice may affect the brain morphologically as assessed by neuroimaging techniques.

Methods: A comprehensive literature search was conducted using a variety of key words with different search engines to search from the last 10 years until May 2022. Studies were included if they investigated topographic brain responses after TC practice. A total of 24 original studies met the criteria and were included for the review process.

Results: The results showed increased oxygenation and volume of cortical grey matter, improved neural activity, and altered neural connectivity and homogeneity within and/or between different neural regions. These regions include the frontal, parietal, temporal, occipital lobes, cerebellum, basal ganglia, and/or limbic system. Such neural findings after TC practice are often associated with neurobehavioral improvements in cognition, memory, emotion, and functional integration and/or specialization.

Conclusions: TC is a promising exercise that is able to improve morphological capability and neurofunctional activity in the brain in both healthy people and patients with different medical diagnoses.

Keywords

TC exercise, Brain, Neuroimaging, Rehabilitation

Introduction

Clinically, mind-body exercises are frequently recommended by clinicians and mental health counselors among which Tai Chi (TC) is one of the most commonly used one [1]. As an ancient Chinese Martial art, TC integrates breathing, meditation, and body movement to achieve a great sense of inner peace and well-being in a calm, relaxed, and meditative way. During TC practice, the practitioner shifts their body weight or makes steps from one leg to the other through its coordinated and controlled slow, gentle, and graceful movements that emphasize smooth rotation of the trunk and arms as well as coordination between breathing and body part movements [2-4]. Its intensity is moderate and approximately equivalent to a walking speed of 6 kilometers or 3.7 miles per hour [5], but the intensity can vary depending on the training style, performance posture, and exercise parameters [6].

Currently, TC is recognized as an effective intervention for improving health, increasing physical performance and social participation, preventing falls, and enhancing posture for both the general population and for patients with neurological dysfunctions [1,2,5]. For example, TC has played a significant role in the recovery of patients who suffered from stroke, Parkinson disease, traumatic brain injury, and multiple sclerosis [6,7]. Because of its beneficial effects on health promotion and improvement of human dysfunctions including neurological disorders, TC has been considered as one of the most promising exercise programs that people with neurological diagnoses can practice to improve their physical and mental conditions [1,6]. Extensive research studies have demonstrated the beneficial effects of TC programs on different aspects, including flexibility, range of motion, muscle tone, strength, posture, balance, walking, psychological well-being, stress reduction, and quality of life [1,6].

In the last decade, an increasing number of studies have been conducted to investigate whether and how the human brain might respond to TC practice, assessed by using a variety of neuroimaging techniques which include the following. Functional near-infrared spectroscopy (FNIRS) is a cost-effective, wearable neuro-imaging technology that can safely assess the real-time brain activity during physical performance by monitor the hemodynamic response in the brain cortex using near-infrared light sources and detectors placed over the scalp of an individual [8]. Structural magnetic resonance imaging (sMRI) is a non-invasive imaging technique that can examine the morphological characterization of the brain in normal or pathological conditions [9]. Functional Magnetic Resonance Imaging (fMRI) is an imaging technique often used to assess two or more different states in an experimental functional condition in comparison to a control condition [10]. Magnetic resonance spectroscopy (MRS) is a companion MRI technique that is often used to non-invasively measure and evaluate the concentrations of different chemical components of the scanned tissue, and consequently provides metabolic and biochemical information within the tissues [11]. Also in fMRI, the voxel-mirrored homotopic connectivity (VMHC) is a method of resting state fMRI that is designed to directly compare the interhemispheric resting-state functional connectivity of two brain hemispheres and can be used to enquire and analyze functional homotopic (geometrically corresponding) connectivity and functional integration (­VMHC) or specialization (¯VMHC) in each hemisphere or between two hemispheres [12]. Regional homogeneity (ReHo) and fractional amplitude of low-frequency fluctuations (fALFF), two different resting state fMRI parameter maps, have been introduced as well to study the brain. fMRI (ReHo) can be used to assess functional homogeneity between neural regions; increased homogeneity indicates improved functional integration, while decreased homogeneity indicates increased functional specialization between neural structures [10,12]. Further, fMRI (fALFF) can be used to assess local spontaneous neural activity of the brain [10,12]. Therefore, the purpose of this literature article was to review and examine if TC exercise might affect the brain as assessed through these neuroimaging techniques, and consequently to help healthcare professionals understand the possible implication of TC’s effect on morphology and neural activity of the human brain.

fig 1

Figure 1: Flow chart of articles searched for analyses

Methods

Search Strategy

TC-related literature that investigated TC’s effects on morphological responses of the brain was searched. The following sources were included in the literature search process: Pubmed, Scopus, Medline (US National Library of Medicine), the Physiotherapy Evidence Database (PEDro), the Cochrane Controlled Trials Register (Cochrane Library), Cumulative Index of Nursing and Allied Health Literature (CINAHL), and the oversea English version of China National Knowledge Infrastructure (CNKI), up to May 2022. The search strategy used the following keywords and variations: Tai Ji, TC, TCh, TC Quan, Tai Ji Quan, Tai Ji Chuan, Chinese martial arts, Chinese fitness exercise, neuroimaging, functional near-infrared spectroscopy (FNIRS), magnetic resonance spectroscopy (MRS), magnetic resonance imaging (MRI), voxel-mirrored homotopic connectivity (VMHC), fMRI Regional homogeneity (ReHo), and fractional amplitude of low-frequency fluctuations (fALFF). Published reviews and all relevant studies and their reference lists were also reviewed manually in search for other pertinent publications.

Study Selection

Studies identified in the search were screened for inclusion. Articles that met the following criteria were selected: (1) studies investigating the effects of TC on brain response; (2) studies assessing the responses with FNIRS, sMRI, fMRI, MRS, and/or VHMC as the primary results; (3) participants were adults (age ≥18 years or older); (4) randomized control trials, single-group pre- and post- comparison, and cross-sectional studies comparing TC practitioners and non-practitioners; and (5) studies published in peer‐reviewed English or Chinese journals from last 10 years until May 2022.

Data Extraction

Initially, all identified articles were assessed independently by two reviewers by scanning the titles and abstracts to determine whether it met the predetermined eligibility criteria. When there was uncertainty or disagreement between the two reviewers, the lead author was involved in the discussion until a consensus decision was reached. Data extracted from each of these studies included study design, participant characteristics, exercise program characteristics, neuroimaging techniques, and morphological changes identified by these techniques.

Quality Assessment

The quality of all studies in this scoping review were assessed based on the type of study. Physiotherapy Evidence Database (PEDro) scale was used for randomized controlled trials [13]. Newcastle–Ottawa Scale (NOS) was conducted for cohort or cross-sectional studies [14].

Data Analysis

Study designs, participants’ characteristics, TC interventional parameters, neuroimaging, neurobehavior, and other functional assessments were all shown in Table 1. As the purpose of this review was to discuss TC’s effects on brain morphology changes in humans, neuroimaging data and their associations with neuroimaging changes in these included studies were extracted, summarized, and synthesized in Tables 2-4.

Table 1: Tai Chi Studies Assessed with Neuroimaging Techniques

Authors

Research

Design

Subjects Interventional Parameters Assessment instruments

Quality Assessment

           
Shen, Watkins, Kahathuduwa, et al (2022)[15] Single group Pre-and post- comparison 12 postmenopausal females with osteoarthritis, 40-50 yrs old Yang style 24 forms, 60 mins, 3/wk for 8 wks rs-fMRI, Pain Visual analog scale, WOMAC, plasma metabolites 6/10


Cui, Tao, Yin et al (2021)[16]


RCT 36 young healthy adults (18-25 y.o): 12 in each of 3 groups:  TC, brisk walking, and usual care (as control TC: Bafa Wubu,, 50-60 mins, 3/wk for 8 wks


rs-fMRI, Pain Visual analog scale, WOMAC, plasma metabolites


8/11


Kong, Huang, Liu et al, (2021)[17]


RCT IG – 24 with fibromyalgia

CG – 24 health subjects

All subjects> 21 years old


TC; Yang style, 10 forms

60 mins each, 2/wk for 12 wks


fMRI

More-odd shifting task for cognitive flexibility


6/11


Shen, Yin, Cui, et al, (2021)[18]


RCT IG – n=12, TC (Yang style, 24 forms)

CG – n=12, brisk walking

Young health adults (<25 y.o)


50-60 mins, 3/wk for 8 wks


fMRI and modified Flanker Test


7/11


Xu, Zimmerman, Lazae et al (2020) [19] Single group Pre-and post- comparison 16 adult patients with major depression 60 min each, 2/wk for 10 wks fMRI

Beck Depression Inventory

SF-36

5/10


Adcock, Fankhauser et al (2020) [20] RCT IG – n =15 (77±6.4 y.o.)

·                     CG – n=16 (70.9±5.0 y.o.)

·                     All healthy elderly individuals

IG – TC + dancing +step-based cognitive games at home; 3/wk, 30-40 min each for 16 wks

·                     CG – normal daily living

sMRI

Victoria Stroop test for cognition

·                     Trail Making test for psychomotor speed and executive function;

·                     Wechsler Memory Scale for memory

7/11**
Yue, Zou, Mei et al (2020) [21]


Yue, Yu, Zhang et al (2020) [22]

Cross-sectional 42 healthy elderly females

·                     IG – TC, n=20 (62.9±2.38 y.o.)

·                     CG – walking. n=22, (63.27±3.58 y.o.)

·                     90 min/each, 5/week, over 6 yrs


NA fMRI (VHMC) 7/10*
Chen et al (2020) [23] Cross-sectional TC – 22 (aged: 52.4 ±6.8; TC experience 14.6±8.6 y.o.;

Control – 18 (aged: 54.8 ±6.8)


All healthy adults

NA fMRI


Attention network test (ANT)


8/10*
Yang, Chen, Shao et al  (2020) [24] RCT 13 TC vs 13 Control


All healthy elderly individuals

TC: 45 min/each, 3/wk, for 8 wks

Yang style, 24-form

Control: routine and general daily activity

fNIRS


Flanker task test

8/11**
Cui, Yin, Lyu et al (2019) [25] RCT with 3 groups


36 young healthy college students (18-25 y.o.):

TC: 12

Brisk walking: 12

Control: 12


IG1  – TC: 8 hand movement techniques and 5 TC foot-works based on Yang-style TC.

IG2 – brisk walking

Both TC and brisk walking groups: 60 min/each, 3/wk for 8 wks

CG –  routine daily activities

sMRI and fMRI 9/11**
Tsang et al (2019) [26] Cross-sectional 8 practitioners (over 7 years of experience) and 8 non-practitioners

All: 60-75 y.o.

NA fNIRS 6/10*
Liu, Chen, Chen et al, (2019) [27]


Liu, Chen, Tu et al (2019) [28]

RCT IG1 – TC – n = 28

IG2 – BDJ – n = 29

IG3 – Stationary bike – n=27

CG – Health ed – n = 24

All (n = 108) 40-70 y.o.

60 min each, 5/wk for 12 wks sMRI and fMRI

Knee injury and osteoarthritis outcome score (KOOS)

7/11**
Xie, et al (2019) [29] Cross-sectional 32 ordinary vs 25 long-term (>5 years) Chen-style TC practitioners (all 60-70 y.o.) NA fNIRS 7/10*
Liu, Li, Liu, Sun et al (2020) [30]


Liu Li, Liu, Guo et al (2019) [31]

Cross-sectional 52 community-dwelling older adults (60-70 y.o.)

IG – TC – 26 (10 years or more TC experience)

VG – 26 (non-TC practitioners, but matched in physical activity level)


Both groups were asked to accomplish a sequential risk-taking task sMRI and fMRI

Beck Depression inventory

NEO five-factor inventory

Five facets mindfulness questionnaire,

Mindful Attention Awareness Scale Barratt Impulsiveness Scale

9/10*
Kong et al (2019) [32] RCT 21 patients with fibromyalgia (± 21 y.o.)

20 healthy matched participants

TC – 60 min/each, 2/wk, 12 wks, Yang style

CG – no TC experience

fMRI

Fibromyalgia  Impact questionnaire (FIQR)

6/11**
Wu, Tang, Goh et al (2018) [33] RCT Community living older adults (60-69 y.o.)

IG – n = 16

CG – n = 10

TC: 60 min each, 3/wk, 12 wks; Yang (10 min warm-up and 10 min cool down)

CG – telephone consultation biweekly without changing lifestyle

fMRI 7/11**
Port, Santaella et al (2018) [34] Cross-sectional 8 TC practitioners (>60 y.o.)


8 water aerobics practitioners (> 60 y.o.)

NA fMRI during attention time

·                     Stroop Word Color Task – SWCT

·                     Working memory with N-back task

7/10*
Zhou, Liao, Sreepada et al (2018) [35] Single group pre-and post- comparison 6 healthy elderly individuals (> 55 y.o.) TC: 60 min each, ³ 2/wk, 12 wks MRS

NAA: N-acetylaspartate;

Cr: creatine

PCr: phosphocreatine

5/10*
Liu, Wu, Li, Guo (2018) [36] Cross-sectional IG – TC, n = 26 (10.44±5.48 yrs TC experience) (65.19±2.30 y.o.)

CG – matched group (63.92±2.87 y.o.) (no TC experience)

NA fMRI 8/10*
Wei et al (2017) [37]


Wei, Dong, Yang et al (2014) [38]


Wei, Xu, Fan et al (2013) [39]

Cross-sectional IG – TC, n = 22 (aged: 52.4 ±6.8; TC experience 14.6±8.6 years;

CG – n = 18 (aged: 54.8 ±6.8)

NA sMRI and fMRI

Attention network test (ANT)


7/10*
Tao, Liu, Liu et al (2017) [40]


Tao, Chen, Liu et al (2017) [41]


Tao, Liu, Egorova et al (2016) [42]

RCT TC-21 (62.38±4.55 y.o.)

BDJ-15 (62.33±3.88 y.o.)

CG – 25 (59.76±4.83 y.o.)

IG1 – TC: 60min, 5/wk, 12 wks; Yang-style, 24-form

IG2 – BDJ: 60min, 5/wk, 12 wks;

CG – health education

sMRI and fMRI (fALFF)

Wechsler Memory Scale (WMS)


9/11**
Zheng et al (2015) [43] RCT Community dwellers

IG  – n = 17 (68.59 y.o.)

CG – n = 17 (71.65 y.o.)

IG – combined interventions: 3/week for 6 wks

1.                   cognitive training – 18 hrs

2.                   TC 18 hrs, Yang-24

3.                   Group counseling (6 90-min sessions)

CG – two 120-min health-related lectures

fMRI


Paired associative learning test (PALT) (to examine episodic memory)


Category Fluency test (CFT) (to examine speech production)


8/11**
Yin et al (2014) [44]


Li, Zhu, Yin, Niu et al (2014) [45]

RCT 45 older community-dwellers

IG – Multimodal intervention (TC + cognitive training + counseling  – 26

CG – 19

Multimodal intervention include

IG 1 – TC (Yang style, 24 form, 60 min each, 3/wk for 6wks) +

IG 2 – Cognitive training: (60 min each, 3/wk, for 6wks) +  counseling (90,im each, 1/wk for 6 wks)

CG – daily routine, 2 120-min healthcare education

MRI

MoCA

Associative Learning Test (ALT)

Digital Span forward and Backward Tasks

Category Fluency Test

Train Making Test

Social Support Rating Scale

Satisfaction with Life Scale

8/11**
Mortimer et al (2012) [46] RCT 120 community-living older adults (primary females) – 30 in each group

·                     IG1 – TC: 67.3±5.3 y.o., 19/30 females

·                     IG2 – Walking: 67.8±5.0 y.o., 19/30 females

·                     IG3 – Social: 67.9±6.5 y.o., 21/30 females

·                     CG – No interventions: 68.2±6.5, 21/30 females


3/week for 40 wks


IG1: TC: 50 mins – 20min warm-up, 20 min TC and 10 min cool-down), 3

IG2: Walking: 50 mins – 10 warm-up, 30 min brisk walking, and 10 min cool-down in a 400-meter track

IG3: Social interaction: 60 min for any topics

CG: No interventions

sMRI and fMRI 9/11**

CG: control group; fMRI: functional magnetic resonance imaging; IG: interventional group with Tai Chi as the intervention; MME: mini-mental status exam; MRS: magnetic resonance spectroscopy; NA: not applicable; RCT: randomized control trial; rsFC: resting state functional connectivity; sMRI: structural magnetic resonance imaging; TC: Tai Chi; y.o.: years old; min: minute(s); wk: week; wks: weeks; WOMAC: Western Ontario & McMaster Universities Osteoarthritis Index.*: Newcastle-Ottawa Scale assessment; **: PEDro scale assessment;

Results

Thirty-two articles from 24 studies were qualified for analysis (Table 1) [15-46]. There were 13 randomized control trials with 17 articles [16-18,20,24,25,27,28,32, 33,40-46], 8 cross-sectional studies with 12 articles [21-23,26,29-31,34,36-39], and 3 single group pre- and post- comparisons with 3 articles [15,19,35]. Among these 24 studies, 17 of them with 21 articles had elderly subjects who were 60 years and older [20-24,26,29-31,33-36,40-46], 4/24 studies with 8 articles had mixed age groups with subjects 21-70 years old [17,19,27,28,32,37-39], and 3 studies had healthy young subjects [16,18,25]. The majority of these studies used healthy subjects [15,16,18,20-31,33-46], but only four had subjects with a medical diagnosis of osteoarthritis [15], depression [19] or fibromyalgia [17,32]. Among 13 RCTs (17 articles), activities for the control groups or other intervention groups included normal daily activities [17,20,24,32], brisk walking [16,18,25,46], Baduanjin exercise [27,29,40-42], stationary biking [27, 29], health education [27,29,40-45] and social gathering interactions [46]. In 8 cross-sectional studies (12 articles), practitioners with 5 or more years of experiences in TC were compared with comparable subjects who walked every day [21, 22] or just non-TC practitioners [23,26,31,33,36-39].

With respect to quality assessment, 13 randomized controlled trials ranged from 6-9/11 in PEDro scale, indicating good to excellent studies [13]. Newcastle-Ottawa scale [14] showed 6-9 stars/10 in 8 cross-sectional studies (suggesting good to very good), and 5/10 in two sing-group cohort studies (indicating satisfactory), respectively.

Exercise Parameters Related to TC Effects on Neuroimaging Assessments

Based on 16 prospective studies (20 articles) in this review, including 13 randomized control trials (17 articles) and 3 pre-and post-intervention comparison studies (3 articles), the TC exercise parameters varied from study to study, but some of the parameters were commonly prescribed by many TC providers. The length of each TC practice session ranged from 30-40 minutes [20], 45 minutes [24], 50-60 minutes [15-19,27,28,32,33,35,40-46] with the most commonly used one being 50-60 minutes. The exercise frequencies were 2/week [17,19,32], 2-3/week [35], 3/week [15,16,18,20,24,25,33,43-46] and 5/week [27,28,40-42] with the most common one being 3 times a week. The duration for these studies varied from 6 weeks [43-45], 8 weeks [15,16,18,24,25], 10 weeks [19], 12 weeks [17,27,28,32,33,35,40-42], 16 weeks [20] to 40 weeks [46] with 12 weeks as the most commonly used. Put together, 60 minutes per session, 3 times a week for 12 weeks are the most commonly used TC parameters by TC researchers to investigate TC effects on the human brain. However, none of these 16 prospective studies did a follow-up after their TC interventions were completed, but the effects from a longer duration of TC practice are available from 8 cross-sectional studies (12 articles), in which subjects had been practicing TC for a minimum of 5 years and showed greater changes than the control groups [21-23,26,29-31,34,36-39].

TC Effects on Different Regions of Brain

As shown in Tables 1 and 2, TC practice is able to affect the whole brain by increasing total brain volume [46], the oxygenated hemoglobin (HbO2) in the motor cortex [29], and the white matter network connectivity locally and globally in the brain [21]. In each individual brain region, TC can affect many brain areas including the frontal, parietal, temporal, and occipital lobes, insula, basal ganglia, and cerebellum, among which the frontal lobe is the area that has been studied more than others (Table 2) [15-46].

Table 2: Effects of Tai Chi on Brain Assessed with Neuroimaging Techniques

table 2

Frontal Lobe

TC practice is able to affect many regions of the frontal lobe (Table 2) by increasing 1) grey volume in the medial orbital prefrontal cortex [27], precentral gyrus [38], and dorsolateral prefrontal cortex (DLPFC) [39]; 2) oxyhemoglobin (HbO2) in the prefrontal cortical area [24,26,29]; and 3) neural activity in the left superior frontal gyrus [18,33;44]; right middle frontal gyrus (MFG) [44], and DLPFC [41]. The increased neural activity in the left superior frontal gyrus [33] and the dorsolateral prefrontal cortex [41] have been found to be associated positively and respectively with decreased error-making rates in switch/non-switch tasks [33], or with improved memory [41] in older community dwellers.

Further, increased connectivity was also reported locally in the frontal gyrus, right operculum, and precentral gyrus [32]. Decreased synchronized pattern in MFG and precentral gyrus as assessed by the VHMC technique was also found [23].

Parietal Lobe

The right postcentral gyrus shows increased cortical thickness and improved neural integration as indicated by increased functional homogeneity, which are positively associated with practitioners’ time length of TC experience and improvement of cognitive attention [39]. Increased functional connectivities were identified locally in precuneus, angular, and supramarginal gyri [32], and the middle frontal gyrus [25]. Decreased synchrony, as indicated by decreased VMHC, was seen in the precuneus, which is correlated with years of TC practice experience [23]

Temporal Lobe

Increased thickness of the cortex was identified in the left superior temporal gyrus [25,39], left inferior temporal gyrus [22], right middle temporal gyrus, and medial temporal region [22,40]. More spontaneous neural activities through fALFF assessment were detected in the left superior and middle temporal gyri [43]. The rsFC fMRI technique exerted greater functional connectivity locally in the left temporal lobe [32], medial temporal lobe [45], and bilateral primary olfactory cortex (in the lower temporal lobe) [16].

Occipital Lobe

Randomized controlled trials showed that 8-week TC practice can enhance the volume of grey matter in the middle occipital gyrus [25] and a 12-week TC program can increase resting state functional connectivity in the occipital gyrus [32]. Moreover, cross-sectional studies revealed that TC practitioners with a minimum of 5-year experience demonstrated 1) more volume of grey matter in the lingual sulcus and medial occipito-temporal sulcus [39], 2) increased HbO2 in occipital cortex [29], and 3) less activation of the right intra-calcarine cortex, lateral occipital cortex, and occipital pole during cognitive functioning (e.g., attention) time [34].

Insula and Limbic System

Grey matter can become thicker in the insula [39,40], hippocampus [20,31,40] and left thalamus [31]. Increase of the NAA/Cr (N-acetyl aspartate/creatine) ratio, a biomarker of brain functionality, was found in posterior cingulate gyrus [35]. Functional homogeneity was increased in the hippocampus, fusiform gyrus, and para-hippocampus [22], but decreased in the left ACC which is associated with years of TC experience [38]. Also increased extent of interconnectivity was identified within the left thalamus [16].

Basal Ganglia, Thalamus, Cerebellum, and Brainstem

After TC practice, neuroimaging techniques showed more grey matter in the putamen [40], and more spontaneous neural activity in the anterior and posterior lobes of the cerebellum [43,44], but decreased neural activity in brainstem [32].

Inter-regional Connectivity

As shown in Table 3, changes of inter-regional functional connectivity after TC practice were identified between different brain regions, among which the frontal lobe [15,19,25,27,30,32,37,42,45] has many more structures to make such inter-regional connections than any other neural lobes or brain areas, followed by the temporal lobe [19,42,45], limbic system [17,19,27,32,37], parietal lobe [19,25,37], insula [19], basal ganglia [30], and brainstem [32]. In the frontal lobe, the following structures, including superior, middle, and inferior frontal gyri, dorsolateral prefrontal cortex, medial prefrontal cortex, medial orbito-frontal cortex, and supplementary motor cortex, have either increased or decreased inter-regional connectivity with structures outside the frontal lobe (Table 3). In the temporal lobe and limbic system, the superior temporal gyrus, medial temporal lobe, hippocampus, cingulate gyrus, amygdala, and hypothalamus are involved in the TC-caused inter-regional connectivity. Further, the superior parietal lobule and angular gyrus in the parietal lobe, the ventral striatum in basal ganglia, the insula, and the ventral tegmentum and periaqueduct grey in the brainstem are involved as well (Table 3). Many of these connectivities are increased after TC exercise as seen in the left column of Table 3, while some of these connectivities are decreased in the right column of the table.

Table 3: Tai Chi Effects on Inter-Regional Resting-State Functional Connectivity

Increased Connectivity between

Decreased Connectivity between

  • Left superior frontal gyrus — posterior insula [19]
  • Left superior frontal gyrus — ventral striatum [30]
  • Left middle frontal gyrus — left superior parietal lobule [25]
  • Dorsolateral prefrontal cortex — anterior cingulate cortex [27,32,37]
  • Dorsolateral prefrontal cortex  — medial prefrontal cortex [32]
  • Dorsolateral prefrontal cortex  — angular gyrus [37]
  • Bilateral prefrontal cortex —– bilateral hippocampus [43]
  • Medial prefrontal cortex (mPFC) — anterior cingulate cortex [32]
  • Medial prefrontal cortex — medial temporal lobe [45]
  • Left superior parietal lobule — right posterior insula & left superior temporal gyrus – right posterior insula [22]
  • Superior temporal gyrus — right anterior cingulate cortex [22]
  • Right anterior insula — superior temporal gyrus [22]
  • Bilateral amygdala — medial prefrontal cortex (mPFC) [15]
  • Medial hypothalamus — thalamus and amygdala in fibromyalgia [17]
  • Medial orbito-frontal cortex — periaqueduct grey (PAG) and ventral tegmental area [27]
  • Dorsolateral prefrontal cortex  — supplementary motor area and anterior cingulate cortex (ACC) [28]
  • Dorsolateral prefrontal cortex — left thalamus and ventral striatum and right middle frontal gyrus [36]
  • Bilateral angular gyrus — dorsal prefrontal cortex — anterior cingulate cortex network [37]
  • Hippocampus/PAG  — ACC/mPFC [32]

Neuropsychological Functional Assessments

Neuropsychological functions were assessed in some studies and their associations with TC-caused neuroimaging changes in the brain were presented in Table 4. These studies used a variety of instruments to assess neuropsychological functions and to see how they may associate with neuroimaging changes after the TC intervention. As seen in Table 4, changes of inter-regional neural connectivity and cortical thickness (grey matter volume) were found to be associated with neuropsychological improvements such as cognition [16,18, 22, 23, 30, 31, 33, 34, 36, 38,40,41,43,45], vitality [19], depression [19], pain [15,27,28], and even the overall aspects of the fibromyalgia [17]. The cognition-related improvements may include general cognitive performance [16,23,45], attention and increased inhibitory control during attention [18,34,38], decreased errors in switch and non-switch task [33] and decreased tendency of risk-taking [31], different memory performance [22,34,40,41,43], mindfulness [36], emotional stability and judgement of inner experience [30,31.36], and speech production [43]. For examples, emotion regulation ability [30], cognitive performance [45], depression [19] and vitality [19] improvements are positively and respectively correlated with increased connectivities between the left superior frontal cortex and ventral striatum [30], between the medial prefrontal cortex and medial temporal lobe [45], between the right ACC and superior temporal gyrus [19], or between the right posterior insula and both the left superior temporal gyrus and left superior parietal gyrus [19]. Other the other hand, decreased tendency of risk-taking behavior [31] seems to parallel with increased cortical thickness in the hippocampus and thalamus [31]. In patients with knee arthritis, decreased knee pain was positively associated 1) with increased volume of grey matter in the medial orbitofrontal cortex [24] and supplementary motor cortex [28], 2) with increased connectivity between the dorsolateral prefrontal cortex (DLPFC) and anterior cingulate cortex (ACC) [27,28], but 3) with decreased connectivity in the medial orbito-frontal cortex and both periaqueduct grey and ventral tegmental area [27,28]. In addition, patients with fibromyalgia have significant improvement in functional, overall, and symptoms aspects as assessed with the Fibromyalgia Impact Questionnaire after 12-week TC practice. The improvement is positively correlated with the increased connectivity between the medial hypothalamus and the right thalamus [17].

Table 4: Function Improvements in Association with Neuroimaging Results after Tai Chi (TC) Practice

table 4

Discussion

Local Neural Responses in Different Brain Areas following TC Practice

In the frontal lobe, increased grey matter thickness, spontaneous neural activities, and/or local connectivities of the medial prefrontal cortex, dorsolateral prefrontal cortex (DLPFC), medial orbitofrontal cortex (mOFC), precentral gyrus, superior and middle frontal gyri, and frontal operculum were all reported in TC practitioners (Table 2). Functionally, the medial prefrontal cortex is responsible for memory and decision making [47], the mOFC is for goal-directed decision-making [48], DLPFC is for top-down attentional and cognitive control [49], the precentral gyrus is the primary center for voluntary motor movement [50], the superior frontal gyrus is for self-awareness of individual personality [50], and the right middle frontal gyrus is a convergence site of attention networks for higher order cognition and motor-related information processing [51]. The frontal operculum plays an important role in a network controlling the process of cognitive tasks [52]. With these together, TC practice might be able to improve neuropsychological and related neuromuscular behaviors such as memory, attention, cognitive attention, decision-making, sensorimotor integration, motor execution and control, and individual self-awareness through influence on these structures in the frontal lobe. How these different structures within the frontal lobe work in a coordinated way is not clear, but an improved functional specialization in frontal lobe structures might be an explanation. For instance, a VHMC study showed reduced homogeneity in the middle frontal gyrus and precentral gyrus [23], which may indicate an increased functional specialization of these two structures after TC practice.

In the parietal lobe, the right post-central gyrus is the only area that showed increased cortical thickness and spontaneous neural activity [38,39], while increased local connectivities were seen in the precuneus and inferior parietal lobule (angular and supramarginal gyri) [32]. Functional considerations of these structures, like the post-central gyrus for primary somatosensory processing, the precuneus for executive function, default network of self-consciousness, and mental imagery strategies and episodic memory retrieval [53], and inferior parietal lobule for recognition memory, language, and perception of emotion [54], may indicate that TC practice is able to improve sensory integration of higher-order motor execution, memory, emotion, and mental imagery strategies for motor actions [32,37,38]. Further, these TC studies [32,37,38] showed that TC experience is positively associated with increased neural activity in the right post-central gyrus [38], but negatively with decreased synchrony in bilateral precuneus as indicated by decreased VMHC value [23]. So, it is possible to assume that the longer one practices TC, the more improved general sensory is shown in certain parts (e.g., the left side) of the body, which might be through decreased synchrony between the left and right precuneus. However, whether and how such an assumption is holdable surely needs more future studies.

The temporal lobe and its superior, middle, and inferior temporal gyri showed increased volume of grey matter [22,25,39,40],spontaneous neural activity [43], and local functional connectivity [32] after TC practice. The same changes were also seen in the medial temporal lobe [22,40,45]. Comparatively the left temporal lobe showed more changes [22,25,32,39,43] than the right one (mainly the right middle temporal gyrus) [40]. The temporal lobe is functionally responsible for emotion, memory, and awareness of special sensation, and the left (dominant) side is more involved in language understanding [55,56]. Thus, it is understandable that TC could be a good exercise choice to improve emotion, memory, auditory and visual sensory, and even language perception. The medial temporal lobe that includes the hippocampus and para-hippocampus will be discussed in the paragraph of the limbic system below.

The occipital lobe showed increased oxyhemoglobin (HbO2), total hemoglobin (cHb) [29] and local connectivity [32] following TC intervention. Also, increased thickness of grey matter was noticed in the middle occipital gyrus [25], lingual sulcus, and medial occipito-temporal gyrus [42]. With consideration of functions of the occipital lobe [57], reactions to TC practice in the middle occipital gyrus and occipital cortex in general may hint that the occipital lobe could be morphologically changed to some extent [36,39], and likely participate in improving cognition and anti-memory decline [26,29], as well as improving spatial recognition and perception of objects [57] after TC practice.

In parts of the limbic system, studies demonstrated increased 1) grey matter in the insula [39,40], medial temporal gyrus [40], left thalamus [31], and hippocampus [22,31,40]; 2) increased spontaneous neural activity in hippocampus [22], fusiform gyrus [22], and para-hippocampus [22]; 3) increased extent of interconnectivity in left thalamus [16]; 4) increment of N-acetylaspartate/creatine ratio (indicating neuronal growth) in posterior cingulate gyrus [35]; and 5) increased functional specialization in anterior cingulate cortex [38]. On the other hand, decreased grey matter was found decreased [20] and decreased neural connectivity was identified in the anterior cingulate cortex and dorsolateral prefrontal cortex-angular gyrus network [37]. The insula has been regarded as a limbic system structure in respect to visceral sensation and autonomic control, but it also takes part in functions of pain processing, empathy, social cognition, attention, and decision making [60]. The medial temporal lobe (including hippocampus, para-hippocampus, and amygdala) is associated with emotion learning and behavior, as well as memory encoding, consolidation, storage, and retrieval [59,60], particularly for episodic and spatial memory [60]. A decrease in size of the posterior cingulate gyrus has been reported to play a role in cognition by influencing attentional focus by ‘tuning’ whole-brain metastability [61]. Additionally, the fusiform gyrus is responsible for object and face recognition [62] and semantic memory [63], and the thalamus is a relay hub for multiple sensory information and even memory [64,65]. However, reduction of grey matter in the hippocampus was recently reported when TC intervention was combined in an exercise program (30-40 minutes per total session) including TC-inspired exercise, dancing, and cognitive game [20], in which the TC time for each session was not long enough [20]. With respect to these studies about TC effects on the limbic system [20,22,31,35,39,40], generally speaking, they may indicate that TC is likely able to improve the practitioners’ emotion, memory, visceral and somatosensory capability, decision making, pain processing, and attention. TC may also be able to subsequently reduce the cognitive decline through the limbic system including the medial temporal lobe [66] if the TC practitioners have practiced over 5 years [22,31] or have practiced in longer duration (60 minutes each) on a daily basis [38].

In the basal ganglia and cerebellum, responses to TC exercise include increased grey matter in the putamen [40], and increased neural activity [43,44] and local connectivity in the cerebellum [32]. Literature has suggested that the putamen is functionally responsible for movement execution, working memory [67], and cognition [68]. Besides motor learning and coordination, the cerebellum is also for cognition and emotional processing (particularly the posterior cerebellar lobe) [69]. Injury to the cerebellum may cause cerebellar cognitive affective syndrome [70]. This information indicates that TC may improve motor execution, working memory and cognition through the putamen and cerebellum.

Inter-regional Connectivity after TC Practice

In addition to increased functional connectivity in each individual brain region (Table 2), there are also many inter-regional connectivities influenced by TC practice (Table 3, among which there are more increased such connectivities (see the left column of Table 3) than those decreased (see the right column of Table 3). We speculate that the increased inter-regional connectivities may suggest functional integration of different brain regions while the decreased inter-regional connectivities may indicate functional specialization of different regions. With consideration of morphological changes in each individual brain region after TC exercise, these individual brain regions might be able to functionally respond to TC practice differently depending on functions executed by these regions.

Functional Consideration

Given involved brain regions detailed in Tables 2 and 4, we can easily see that many of them are functionally and positively associated with neuropsychological behaviors. These behavior improvements were assessed with different neuropsychological instruments. For examples, following TC interventions, positive correlations were reported in improvement of 1) reduced risk-taking behavior as assessed by a series of risk-taking tasks [31]; 2) decreased error-making assessed with the switch-non-switch task [41]; 3) cognitive performance assessed by Category fluency test and attention network test [23,45]; 4) emotional regulation and stability assessed by Five Facets Mindfulness Questionnaire and Barratt Impulsiveness scale [31,36]; 5) depression by Beck Depression Inventory [19]; 6) vitality (energy and fatigue) assessed with SF-36 [19]; 7) memory as assessed by Wechsler Memory Scale [40,41] including working memory and episodic (long-term) memory [22,43]; and even knee pain as assessed by Knee Injury & Osteoarthritis Outcome Score [15,27,28]. These findings suggest that TC can be utilized not only as a physical but also a cognitive exercise, which may work by modulating both the local regional morphologies and inter-regional brain connectivity networks to improve the brain’s neural functions.

Study Limitations

There are several limitations that should be mentioned. First, due to the barrier to resources in non-English language, we were not able to access articles that were published in non-English literatures. Second, 10 out of 21 qualified studies are randomized control trials, but others include 8 cross-sectional studies, 2 single group pre- and post-TC comparisons, and 1 single-case report may reduce the level of evidence for this review study. Third, seed-based analysis is often used in resting state MRI in which a neural region of interest (ROI) is selected to determine how other regions interested by the investigators may correlate to the ROI. However, the obvious downside of such a method is that it depends on the investigators’ assumption for the ROI selection [71]. If a different ROI was picked, the involved brain regions might vary.

Conclusions

In the last 10 years, as neuroimaging techniques develop, more morphological changes of the human brain after TC practice have been investigated and identified in the frontal, temporal, parietal, and occipital lobes, insula, limbic system, basal ganglia, cerebellum, and brainstem, with the frontal and temporal lobes having more changes than other regions. These changes include increased cortical thickness or grey matter volume, altered local spontaneous neural activity, as well as changed inter-regional functional connectivities. Also, many of these changes are associated with improvements of many neuropsychological behaviors such as cognitive attention, memory, depression, vitality, risk-taking task, error-making tests, and even pain reduction. All of these imply that TC can be a great exercise program to improve the practitioners’ neural dysfunctions. However, so far, many brain structures have been found to be affected by TC exercise, but why and how only these structures are involved in response to TC practice are still not fully understood. Future studies are needed to assess how the structures are involved and how functionally some of these structures are integrated and/or specialized post-TC interventions.

Author Contributions

All five authors had substantially contributed to the conception and design of the article and interpreting the relevant literature. HL drafted the article and revised it critically with YS, SA, CN and CH for important intellectual content.

References

  1. Symms M, Jager HR, Schmierer K, Yousry TA (2004) A review of structural magnetic resonance neuroimaging. J Neurol Neurosurg Psychiatry 75: 1235-1244. [crossref]
  2. Ayaz H, Izzetoglu M, Izzetoglu K, Onaral B (2019) The use of functional near-infrared spectroscopy in neuroergonomics. In: H. Ayaz, F. Dehais: Neuroergonomics: The brain at Work and in Everyday Life. Academic Press 17-25.
  3. Liu H (2019) Tai Chi. In Chapter 39: Complementary and Integrative Therapies. (In: Umphred’s Neurological Rehabilitaion.7th Lazaro RT, Reina-Guerra SG, Quiben Q). Page 1071-1074. Mosby; Maryland Heights, Missouri.
  4. Lan C, Chen SY, Lai JS, Wong AMK (2013) Tai Chi Chuan in medicine and health promotion. Evid Based Complement Altern Med 2013: 502131. [crossref]
  5. Zhou D, Shepard RJ, Plyley MJ, Davis GM (1984) Cardiorespiratory and metabolic responses during TC Chuan exercise. Can J Appl Sport Sci 9: 7-10. [crossref]
  6. Liu H, Connors M, Grando V, Liu H (2012) Tai Chi intervention for older adults using assistive devices in a senior living community: A pilot study. Int J Ther Rehab 19: 136-142.
  7. Bonifonte P (2004) T’Ai Chi for Seniors: How to Gain Flexibility, Strength, and Inner Peace. New Page Book, Franklin Lakes, NJ.
  8. Liu H, Frank A (2010) Tai Chi as a Balance Improvement Exercise for Older Adults: A Systematic Review. J Geriat Phys Ther 33: 103-109. [crossref]
  9. Winser SJ, Tsang WWN, Krishnamurthy K, Kannan P (2018) Does Tai Chi improve balance and reduce falls incidence in neurological disorders? A systematic review and meta-analysis. Clin Rehabil 32: 1157-1168. [crossref]
  10. Glover GH (2011) Overview of functional magnetic resonance imaging. Neurosurg Clin N Am 22: 1333-1339. [crossref]
  11. Soares DP, Law M (2009) Magnetic resonance spectroscopy of the brain: review of metabolites and clinical applications. Clin Radiol 64: 12-21. [crossref]
  12. Wei J, Wei SB, Yang RX, Yang Lu, Yin Q, et al. (2018) Voxel-mirrored homotopic connectivity of resting state functional magnetic resonance imaging in blepharospasm. Front Psychol 9: 1620. [crossref]
  13. Verhagen AP, de Vet HCW, de Bie RA, kessels AG, Boers M, et al. (1998) The Delphi list: a criteria list for quality assessment of randomised clinical trials for conducting systematic reviews developed by Delphi consensus. J Clin Epidemiol 51: 1235-1241. [crossref]
  14. Wells G, Shea B, O’Connell D, et al. (2017) The Newcastle-Ottawa Scale (NOS) for assessing the quality of nonrandomized studies in meta-analysis.
  15. Shen CL, Watkins BA, Kahathuduwa C, Chyu MC, Zabet-Moghaddam M, et al. (2022) Tai Chi improves brain functional connectivity and plasma lysophosphatidylcholines in postmenopausal women with knee osteoarthritis: An exploratory pilot study. Front Med 8: 775344. [crossref]
  16. Cui L, Tao S, Yin HC, Shen QQ, Wang Y, et al. (2021) TCChuan Alters Brain Functional Network Plasticity and Promotes Cognitive Flexibility. Front Psychol 22: 665419. [crossref]
  17. Kong J, Huang YT, Liu J, Yu SY, Ming C, et al. (2021) Altered functional connectivity between hypothalamus and limbic system inMol Med 14: 17. [crossref]
  18. Shen QQ, Yin HC, Cui L, Zhang JY, Wang DL, et al. (2021) The Potential Advantages ofTCChuan in Promoting Inhibitory Control and Spontaneous Neural Activity in Young Adults. Front Behav Neurosci 15: 747733.
  19. Xu A, Zimmerman CS, Lazar SW, Ma Y, Kerr CE (2020) Distinct insular functional connectivity changes related to mood and fatigue improvements I major depression disorder following Tai Chi training: a pilot study. Front Integra Neurosci 14: 25. [crossref]
  20. Adcock M, Fankhauser M, Post J, Lutz K, Zizlsperger L, et al. (2020) Effects of an In-home multicomponent exergame training on physical functions, cognition, and brain volume of older adults: A randomized controlled trial. Front Med 6: 321.
  21. Yue C, Zou L, Mei J, Moore D, Herold F, et al. (2020) Tai Chi training evokes significant changes in brain white matter network in older women. Healthcare 8: 57.
  22. Yue C, Yu Q, Zhang Y, Herold F, Mei J, et al. (2020) Regular Tai Chi practice is associated with improved memory as well as structural and functional alterations of the hippocampus in the elderly. Front Aging Neurosci 12: 586770. [crossref]
  23. Chen LZ, Yuan X, Zhang Y, Zhang S, Zou L, et al. (2020) Brain functional specialization is enhanced among Tai Chi Chuan practitioners. Arch Phys Med Rehabil 101: 1176-1182. [crossref]
  24. Yang Y, Chen T, Shao M, Yan S, Yue GH, et al. (2020) Effects of Tai Chi Chuan on inhibitory control in elderly women: An fNIRs study. Front Human Neurosci 13: 476. [crossref]
  25. Cui L, Yin HC, Lvu SJ, Shen QQ, Wang Y, et al. (2019) Tai Chi Chuan vs General aerobic exercise in brain plasticity: a multimodal MRI study. Sci Rep 9: 17264.
  26. Tsang WWN, Chan KK, Cheng CN, Hu FSF, Mak CTK, et al. (2019) Tai Chi practice on prefrontal oxygenation levels in older adults: a pilot study. Complement Ther Med 42: 132-136. [crossref]
  27. Liu J, Chen L, Chen X, Hu K, Tu Y, et al. (2019) Modulatory effects of different exercise modalities on the functional connectivity of the periaqueductal grey and ventral tegmental area in patients with knee osteoarthritis: a randomized multimodal magnetic resonance imaging study. British J Anaesthesia 123: 506-518. [crossref]
  28. Liu J, Chen L, Tu Y, Chen X, Hu K, et al. (2019) Different exercise modalities relieve pain syndrome in patients with knee osteoarthritis and modulate the dorsolateral prefrontal cortex: A multiple mode MRI study. Brain Behav Immunity 82: 253-263. [crossref]
  29. Xie X, Zhang M, Huo C, Xu G, Li Z, et al. (2019) Tai Chi Chuan exercise related change in brain function as assessed by functio0nal near-infrared spectroscopy. Sci Rep 9: 13198. [crossref]
  30. Liu Z, Li L, Liu S, Sun Y, Li S, et al. (2020) Reduced feelings of regret and enhanced fronto-striated connectivity in elders with long-term Tai Chi experience. Soc Cogn Affect Neurosci 15: 861-873.
  31. Liu S, Li L, Liu Z, Guo X (2019) Long term Tai Chi experience promotes emotional stability and slows gray matter atrophy for elders. Front Psychol 10: 91. [crossref]
  32. Kong j, Wolcott E, Wang Z, Jorgenson K, Harvey WF, et al. (2019) Altered resting state functional connectivity of the cognitive control network in fibromyalgia and the modulation effect of intervention. Brain Imaging Behav 13: 482-492. [crossref]
  33. Wu MT, Tang PF, Goh JOS, Chou TL, Chang YK, et al. (2018) Task-switching performance improvements after Tai Chi Chuan training are associated with greater prefrontal activation in older adults. Front Aging Neurosci 10: 280. [crossref]
  34. Port AP, Santaella DF, Lacerda SS, Speciali DS, balardin JB, et al. (2018) Cognition and brain function in elderly Tai Chi practitioners: A case-control study. Explore 14: 352-356. [crossref]
  35. Zhou M, Liao H, Sreepada LP, Ladner JR, Balschi JA, et al. (2018) Tai Chi improves brain metabolism and muscular energetics in older adults. J Neuroimaging 28: 359-364. [crossref]
  36. Liu Z, Wu Y, Li L, Guo X (2018) Functional connectivity within the executive control network mediates the effects of long-term Tai Chi exercise on elders’ emotion regulation. Front Aging Neurosci 10: 315. [crossref]
  37. Wei GX, Gong XQ, Yang Z, Zuo XN (2017) Mind-body practice changes fractional amplitude of low frequency fluctuations in intrinsic control networks. Front Psychol 8: 1049. [crossref]
  38. Wei GX, Dong HM, Yang Z, Luo J, Zuo XN (2014) Tai Chi Chuan optimizes the functional organization of the intrinsic human brain architecture in older adults. Front Aging Neurosci 6: 74. [crossref]
  39. Wei GX, Xu T, Fan FM, Dong HM, Jiang LL, et al. (2013) Can Taichi reshape the brain? A brain morphometry study. PLosOne 8: e61038. [crossref]
  40. Tao J, Liu J, Liu W, Huang J, Xue X, et al. (2017) Tai Chi Chuan and Baduanjin increases grey matter volume in older adults: a brain imaging study. J Alzheimers Dis 60: 389-400. [crossref]
  41. Tao J, Chen X, Liu J, Egorova N, Xue X, et al. (2017) Tai Chi Chuan and Baduanjin mind-body training changes resting-state low-frequency fluctuations in the frontal lobe of older adults: A resting-state fMRI study. Front Human Neurosci 11: 514. [crossref]
  42. Tao J, Liu J, Egorova N, Chen X, Sun S, et al. (2016) Increased hippocampus-medial prefrontal cortex resting-state functional connectivity and memory function after Tai Chi Chuan practice in elder adults. Front Aging Neurosci 8: 25. [crossref]
  43. Zheng Z, Zhu X, Yin S, Wang B, Niu Y, et al. (2015) Combined cognitive-psychological-physical intervention induces reorganization of intrinsic functional brain architecture in older adults. Neural Plasticity 2015: 713104.
  44. Yin SF, Zhu XY, Li R, Niu Y, Wang B, et al. (2014) Intervention-induced enhancement in intrinsic brain activity in healthy older adults. Rep 4: 7309. [crossref]
  45. Li R, Zhu X, Yin S, Niu Y, Zheng Z, et al. (2014) Multimodal intervention in older adults improves resting-state functional connectivity between the medial prefrontal cortex and medial temporal lobe. Front Aging Neurosci 6: 39. [crossref]
  46. Mortimer JA, Ding D, Borenstein AR, Carli CD, Guo Q, et al. (2012) Changes in brain volume and cognition in a randomized trial of exercise and social interaction in a community-based sample of non-demented Chinese elders. J Alzheimer’s Dis 30: 757-766. [crossref]
  47. Euston DR, Gruber AJ, McNaughton BL (2012) The role of medial prefrontal cortex in memory and decision making. Neuron 76: 1057-1070. [crossref]
  48. Gourley SL, Zimmermann KS, Allen AG, Taylor GR (2016) The medial orbitofrontal cortex regulates sensitivity to outcome value. J Neurosci 36: 4600-4613. [crossref]
  49. Brosnan MB, Wiegand I (2017) The dorsolateral prefrontal cortex, a dynamic cortical area to enhance top-down attentional control. J Neurosci 37: 3445-3446. [crossref]
  50. Petrides M, Pandya DN. The Frontal Cortex. In: Mai JK, Paxinos G: The Human Nervous System (3rd). Academic Press, Cambridge, MA. 2012. Page 988-1011.
  51. Japee S, Holiday K, Satyshur MD, Mukai I, Ungerlieder LG (2015) A role of right middle frontal gyrus in reorienting of attention: a case study. Front Syst Neurosci 9: 23. [crossref]
  52. Higo T, Nars RB, Boorman ED, Buch ER, Rushworth MFS, et al. (2011) Distributed and causal influence of frontal operculum in task control. Proc Natl Acad Sci USA 108: 4230-4235. [crossref]
  53. Cavanna AE, Trimble MT (2006) The precuneus: a review of its functional anatomy and behavioral correlates. Brain 129: 563-584. [crossref]
  54. O’Connor AR, Han S, Dobbins IG (2010) The inferior parietal lobule and recognition memory: Expectancy violation or successful retrieval? J Neurosci 30: 2924-2934. [crossref]
  55. Kiernan JA (2012) Anatomy of the temporal lobe. Epilepsy Res Treat 2012: 176157.
  56. Aversi-Ferreira TA, Tamaishi-Watanabe BH, Magri MPF, Ferreira RAGMFA (2019) Neuropsychology of the temporal lobe – Laria’s and contemporary conceptions. Dement Neuropsychol 13: 251-258. [crossref]
  57. Renier LA, Anurova I, De Volder AG, Carlson S, Vanmeter J, et al. (2010) Preserved functional specialization for spatial processing in the middle occipital gyrus of the early blind. Neuron 68: 138-148. [crossref]
  58. Uddin LQ, Nomi JS, Hebert-Seropian B, Ghaziri J, Boucher O (2017) Structures and function of the human insula. Clin. Neurophysiol 34: 300-306. [crossref]
  59. Squire LR, Stark CEL, Clark RE (2004) The medial temporal lobe. Annu Rev Neurosci 27: 279-306. [crossref]
  60. Cutsuridis V, Yoshida M (2017) Memory processes in medial temporal lobe: experimental, theoretical and computational approaches. Front Syst Neurosci 11: 00019.
  61. Leech R, Sharp DJ (2014) The role of the posterior cingulate cortex in cognition and disease. Brain 137: 12-32. [crossref]
  62. Weiner KS, Zilles K (2016) The anatomical and functional specialization of the fusiform gyrus. Neuropsychol 83: 48-62. [crossref]
  63. Ding JH, Chen K, Chen Y, Fang Y, Yang Q, et al. (2016) The left fusiform gyrus is a critical region contributing to the core behavioral profile of semantic dementia. Front Hum Neurosci 10: 215. [crossref]
  64. Fama R, Sullivan EV (2015) Thalamic structures and associated cognitive functions: relations with age and aging. Neurosci Biobehav Rev 54: 29-37. [crossref]
  65. Wolff M, Vann SD (2019) The cognitive thalamus as a gateway tp mental representations. J Neurosci 39: 3-14. [crossref]
  66. Ferreira LK, Diniz BS, Forlenza OV, Busatto GF, Zanetti MV, et al. (2011) Neurostructural predictors of Alzheimer’s disease: A meta-analysis of VBM studies. Neurogiol Aging 32: 1733-1741. [crossref]
  67. Arsalidou M, Duerden EG, Taylor MJ (2013) The center of the brain: Topographical model of motor, cognitive, affective, and somatosensory functions of the basal ganglia. Human Brain Mapp 34: 3031-3054. [crossref]
  68. Middleton FA, Strick PL (2002) Basal ganglia “projections” to the prefrontal cortex of the primate. Cereb Cortex 12: 926-935. [crossref]
  69. Stoodley CJ, Valera EM, Schmahmann JD (2012) Functional topography of the cerebellum for motor and cognitive tasks: an fMRI study. Neuroimage 59: 1560-1570. [crossref]
  70. Schmahmann JD (2004) Disorders of the cerebellum: ataxia, dysmetria of thought, and the cerebellar cognitive affective syndrome. J Neuropsychiat Clin Neurosci 16: 367-378. [crossref]
  71. Lee MH, Smyser CD, Shimony JS (2013) Resting-state fMRI: a review of methods and clinical applications. Am J Neuroradiol 34: 1866-1872. [crossref]

Fetal and Neonatal Complications of Gestational Diabetes: A Survey in Two Referral Hospitals of Yaoundé, Cameroon

DOI: 10.31038/PSC.2022213

Abstract

The in-utero exposition of fetuses to Gestational Diabetes (GDM) is known to induce a wide range of metabolic modifications, with possible complications in neonates. We intended to investigate these outcomes in such fetuses and neonates delivered in two referral hospitals of Yaoundé in Cameroon. We conducted an observational study with cross-sectional design at the Yaoundé Central Hospital (YCH) and the Yaoundé Gynaeco-Obstetric and Pediatric Hospital (YGOPH). The study lasted for seven months and consisted of investigations from files of all women admitted with GDM and their neonates, from January 2018 to January 2020. Data were analyzed using SPSS software (Statistical Package for the Social Sciences) version 20. The main results obtained were the following: a total of 34 pregnant women were diagnosed with GDM out of 652 women admitted in the service during the same period, with 5.2% incidence. The majority of neonates were big and macrosomes (22: 64.7%). Prematurity occurred in 14 (41.7%), while hypoglycemia was found in 13 (38.4%) neonates. Neonatal infection was manifested by 8 (23.52%) neonates. Fetal distress was recorded in 8 (23.3%) cases, with respiratory distress being noted in 4 (11.7%) neonates, while 3 (8.3%) neonates suffered jaundice.  There were 2 abortions (5.8%) and 2 (5.8%) stillbirths, making a death rate of 4 on 34 pregnancies (11.6%). Birth obstetrical trauma was found in 1 (2.5%) neonate, while no complications occurred in 2 (5.2%) cases. From these results, we deduced neonatal complications in GDM in our context were not very different from those expected, as macrosomia, preterm and hypoglycemia were predominant complications. However, it appeared that fetuses from such pregnancies are particularly vulnerable, with significant rates of distress, prematurity, and high death rate. This indicates the need for keen fetal monitoring and effective neonatal management of such babies.

Keywords

Gestational diabetes, Fetal distress, Macrosomia, Cameroon

Introduction

The prevalence of GDM is continuously increasing worldwide, including in sub-saharan Africa and Cameroon. According to results from systematic reviews of studies conducted in the continent, this rate is estimated around 13.6%, of which central Africa alone is believed to account for more than 20.4% [1]. GDM is thought to increase perinatal morbidity, through a number of fetal and neonatal adverse outcomes. Such outcomes mainly comprise macrosomia with metabolic and hematological disorders which are mostly described, beside obstetrical birth trauma due to dystocia, just to name a few [2-6]. On the other hand, this is in turn responsible for increased rates of admissions to the neonatal intensive care unit in babies delivered from such pregnancies [7-9]. However, there is paucity of contextual investigations of such complications in fetuses and neonates in our milieu, especially from an epidemiological stand point. As such, the local clinical practice has mainly relied on findings from foreign experiences which may not absolutely be adapted, nor always true to African conditions. This study was therefore, intended to contribute as a beginning of response to this need, in quest of confirming, comforting or refuting past knowledge with new findings. This survey was also meant to provide updated data as an indirect evaluation of considerable advances in obstetrics, perinatology, and pediatric practice at large, as far as the management of GDM in our hospitals is concerned [10].

Methodology

We carried out an observational study with cross-sectional design at the Yaoundé Central Hospital and the Yaoundé Gynaeco-Obstetric and Pediatric Hospital, which are two referral and university teaching hospitals in Yaoundé, Cameroon. This was a seven-month investigation from files of all women admitted with GDM and their babies from January 2018 to January 2020. Data on sociodemographic, clinical and therapeutic characteristics were collected using a collection sheet. Data was then registered and analyzed using the Statistical Package for the Social Sciences (SPSS) software version 20.

Results

A total of 34 pregnant women with gestational diabetes were identified in both hospitals, out of 652 women admitted in the service during the same period. This corresponded to an incidence of 5.2% for GDM. The average GA at delivery was 37.7 weeks of gestation ±1.8. Most of these women (27: 79.2%) were being followed by both gynecologist and endocrinologist (21: 61.6%). All neonates were assessed and followed-up by pediatrician. Most deliveries were at term (20: 58.3%). The rate of caesarean delivery was 22 out of 34 deliveries (64.1%), and there were 20 live births (88.4%) (Table 1).

Table 1: Fetal and neonatal complications of gestational diabetes

Variables

Women who had GDM (N=34)

N

%

Fetal and Neonatal Complications


Fetal distress

8

23.3

Preterm

14

41.7

Big baby (3500-40000g)

9

26.7

Macrosomic baby (>4000g)

13

38.4

Hypoglycemia

12

35.9

Respiratory distress

4

11.7

Abortions

4

11.76

Birth obstetrical trauma

1

2.5

Neonatal infection

8

23.2

Neonatal Jaundice

3

8.3

Still birth

3

8.82

Abortion

2

5.8

Still birth

2

5.8

Total deaths

4

11.6

None

2

5.8

Discussion

In this survey, the prevalence of GDM was 5.2% and fell within the estimated range previously described by Sobgwi et al who conducted a study on gestational diabetes in six regions of Cameroon in 2010. They found that the prevalence fluctuated within 5-17% in the country. This was reproducible in our survey, probably due to context-related specificities of common population characteristics [11]. However, our finding is lower than Egbe et al investigation results, who reported a prevalence of GDM as high as 20% in a study carried out in three hospitals in the southwest region of Cameroon. This discrepancy can be explained by the lack of uniformity in diagnostic protocols, which varied from one study to the other [12].

Most pregnant women, and hence fetuses (21: 61.6%) benefited from specialized follow-up, as well as the management of intercurrent acute health issues in order to reduce in utero and perinatal complications as much as possible [13-18]. Nevertheless, there was high rate of fetal distress (23.3%), with consequent increase in the rate of abortions (5.8%) and still births (5.8%), making a total death rate of 11.6%, which was quite high in this population [8]. In effect, it is believed that intermittent hyperglycemia in GDM due to maternal insulin resistance is responsible for elevated glucose trans placental transfer to the fetus, with consequent increase of fetal insulin secretion. This induces high substrate tissue tension with immediate and increased needs for oxygen consumption. Thus, “oxygen debt” may rapidly set, leading to distress and eventually fetal death or perinatal asphyxia if not satisfied [3,13]. It is through this phenomenon that high rates of abortion and stillbirths are recorded in GDM. This therefore shows a need for continuous antenatal follow-up of such fetuses and immediate assessment of neonates from mothers with GDM [14-21]. Nevertheless, mothers should be continuously monitored and reassured as well, to prevent complications due to stressful delivery and/or caesarean section [22-32].

A high rate of premature delivery up to 41.7% was noted in our survey, but is consistent with findings from most studies on GDM. This is explained by the mechanical effects due to a fast growing fetus, which is larger for gestational age. It is responsible for precocious hyper uterine distension and increased pressure on cervix from a large fetal head. When this does not lead to premature delivery, cephalo-pelvic disproportion may occur later on during term delivery, with mechanical dystocia, and eventually an absolute indication of emergency caesarean section. However, an effective obstetrical follow-up allows anticipation of such outcomes and permits prophylactic caesarean section. The surgical delivery would thus be elective in this case, with relative indication rendering the intervention less risky and with favorable outcome [19]. Therefore, the large prescription of caesarean section appears to be indispensable and beneficial in most cases with macrosomia to prevent perinatal complications [22-33]. As a matter of fact, the rate of live births above 88% found in this survey with marked reduction of birth obstetrical trauma as low as 2.5%, justifies the high rate of caesarean section practice in this context.

Macrosomia and big babies, just as being large for gestational age were major complications in this survey (64.7%). This is very common in GDM as fetal hyperglycemia from maternal insulin resistance stimulates fetal pancreatic β-cells to release insulin which is a growth factor. The natural outcome is fetal macrosomia, characterized by increased subcutaneous fat, muscle mass, and head circum­ference. On the other hand, a sudden interruption of maternal trans placental glucose alimentation or convey takes place after delivery. Coupled with transient fetal hyperinsulinism, this may lead to acute hypoglycemia during the following hours or few days after birth, according to neonatal glycogen stock or reserves [3,13].

Respiratory distress occurred in 11.7% neonates from pregnancies with GDM. This is a regular and documented neonatal complication, which has been reported in a number of studies. It is believed that hyperinsulinism is associated with low secretion of surfactant in fetus, thereby inducing the hyaline membrane disease which is a main cause of respiratory distress. Furthermore, this is aggravated by high rates of prematurity or preterm delivery as was found in our results, bearing in mind that prematurity is strongly associated with hyaline membrane disease [34]. Another cause of respiratory distress in neonates (apart from GDM) is neonatal sepsis with pneumonia, which was quite prevalent in this population as well, although lower than that of the general neonatal population [8].

Some neonates (8.3%) in our sample manifested jaundice with hyperbilirubinemia in this survey, which is an expected complication in infants from mothers with GDM. This is associated with mild hemolysis from polycythemia originating from fetal hypoxia or perinatal asphyxia [34]. However, hypocalcemia, hypertrophic cardiomyopathy, and congenital malformations often described in the literature were not identified in our survey. This may be due to the fact that our sample size was not broad enough to see more complications, and so this constituted a limit to our study. Nevertheless, there is a need to monitor the growth of such infants in the short and long term [39-42].

Conclusion

From these results, we observed that GDM is a major issue during pregnancy in our milieu, this with the capability to induce serious fetal and neonatal complications of which macrosomia, prematurity and hypoglycemia are the most frequent. Although other expected complications including polycythemia and jaundice, neonatal infection, birth trauma with shoulder dystocia and respiratory distress can occurred as well, but with lower frequency. However, the relative high rates of death, premature delivery, and caesarean section among this population calls for prompt diagnosis, effective follow-up and management as long as after delivery.

References

  1. Muche AA, Olayemi OO, Gete YK (2019) Prevalence and determinants of gestational diabetes mellitus in Africa based on the updated international diagnostic criteria: a systematic review and meta-analysis. Arch Public Health 77: 36. [crossref]
  2. Benhalima K, Devlieger R, Van Assche A (2015) Screening and management of gestational diabetes. Best Pract Res Clin Obstet Gynaecol 29: 339-349. [crossref]
  3. Opara PI, Jaja T, Onubogu UC (2010) Morbidity and mortality amongst infants of diabetic mothers admitted into a special care baby unit in Port Harcourt, Nigeria. Ital J Pediatr 36: 1-6.
  4. Wakwoya EB, Fita FU (2018) Adverse maternal outcome and its association with gestational diabetes among women who gave birth in selected public hospitals in Eastern Ethiopia. Trop J Obstet Gynaecol 35: 58-62.
  5. Östlund I, Haglund B, Hanson U (2004) Gestational diabetes and preeclampsia. Eur J Obstet Gynecol Reprod Biol 113: 12-6.
  6. Moyo GPK, Hermann ND (2020) Caesarean Delivery as a Predictor of Inadequate Breastfeeding among a Group of Neonates in Yaoundé, Cameroon. J Perina Clin Pediatr 2: 105.
  7. Kamana KC, Shakya S, Zhang H (2015) Gestational diabetes mellitus and macrosomia: a literature review. Ann Nutr Metab 66: 14-20. [crossref]
  8. Moyo GPK, Sobguemezing D, Adjifack HT (2020) Neonatal Emergencies in Full-term Infants: A Seasonal Description in a Pediatric Referral Hospital of Yaoundé, Cameroon. Am J Pediatr 6: 87-90.
  9. Landon MB, Spong CY, Thom E, Carpenter MW, Ramin SM, et al. (2009) A multicenter, randomized trial of treatment for mild gestational diabetes. N Engl J Med 361: 1339-1348. [crossref]
  10. Werner EF, Pettker CM, Zuckerwise L, Reel M, Funai EF, et al. (2012) Screening for gestational diabetes mellitus: are the criteria proposed by the International Association of the Diabetes and Pregnancy Study Groups cost-effective? Diabetes Care 35: 529-535. [crossref]
  11. Lee KW, Ching SM, Ramachandran V, Yee A, Hoo FK, et al. (2018) Prevalence and risk factors of gestational diabetes mellitus in Asia: a systematic review and meta-analysis. BMC Pregnancy Childbirth 18: 494. [crossref]
  12. Eades CE, Cameron DM, Evans JM (2017) Prevalence of gestational diabetes mellitus in Europe: a meta-analysis. Diabetes Res Clin Pract 129: 173-181. [crossref]
  13. Ovesen PG, Jensen DM, Damm P, Rasmussen S, Kesmodel US (2015) Maternal and neonatal outcomes in pregnancies complicated by gestational diabetes. A nation-wide study. J Matern Fetal Neonatal Med 28: 1720-1724. [crossref]
  14. Moyo GPK (2020) Epidemio-clinical Profile of the Baby Blues in Cameroonian Women. Journal of Family Medicine and Health Care 6: 20-23.
  15. Moyo GPK, Djoda N (2020) The Emotional Impact of Mode of Delivery in Cameroonian Mothers: Comparing Vaginal Delivery and Caesarean Section. American Journal of Psychiatry and Neuroscience 8: 22-25.
  16. Foumane P, Olen JPK, Fouedjio JH, GPK Moyo, Nsahlai C, Mboudou E (2016) Risk factors of maternity blues after caesarean section in Yaoundé, Cameroon: a case-control analysis. Int J Reprod Contracept Obstet Gynecol 5: 4424-4427.
  17. Antoniou M-C, Gilbert L, Gross J, et al. (2019) Potentially modifiable predictors of adverse neonatal and maternal outcomes in pregnancies with gestational diabetes mellitus: can they help for future risk stratification and risk-adapted patient care? BMC Pregnancy Childbirth 19: 1-12.
  18. Ovesen PG, Jensen DM, Damm P, et al. Maternal and neonatal outcomes in pregnancies complicated by gestational diabetes. A nation-wide study. J Matern Fetal Neonatal Med 2015; 28: 1720–4. [crossref]
  19. Ethridge Jr JK, Catalano PM, Waters TP (2014) Perinatal outcomes associated with the diagnosis of gestational diabetes made by the international association of the diabetes and pregnancy study groups criteria. Obstet Gynecol 124: 571-578. [crossref]
  20. Mitanchez D (2010) Foetal and neonatal complications in gestational diabetes: perinatal mortality, congenital malformations, macrosomia, shoulder dystocia, birth injuries, neonatal complications. Diabetes Metab 36: 617-627. [crossref]
  21. Georges Pius KM, Aurore Albane E, Marie-Paul B, et al. (2022) Neonatal Sepsis: Highlights and Controversies. J Pediatr Neonatal 4: 1-5.
  22. Hermann ND. Moyo GPK (2020) Neonatal Determinants of Inadequate Breastfeeding: A Survey among a Group of Neonate Infants in Yaounde, Cameroon. Open Access Library Journal 7: 6541.
  23. Hermann ND, Moyo GPK, Ejake L, Félicitée N, Evelyn M, et al. (2020) Determinants of Breastfeeding Initiation Among Newly Delivered Women in Yaounde, Cameroon: a Cross-Sectional Survey. Health Sci Dis 21: 20-24.
  24. Moyo GPK, Dany Hermann ND (2020) Clinical Characteristics of a Group of Cameroonian Neonates with Delayed Breastfeeding Initiation. Am J Pediatr 6: 292-295.
  25. Moyo GPK, Mendomo RM, Batibonack C, Thérese Mbang AT (2020) Neonatal Determinants of Mothers’ Affective Involvement in Newly Delivered Cameroonian Women. Journal of Family Medicine and Health Care 6: 125-128.
  26. Chiabi A, Kago DA, Moyo GPK, Obadeyi B (2019) Relevance and Applicability of the Apgar Score in Current Clinical Practice. EC Paediatrics 8: 1-7.
  27. Moyo GPK, Tetsiguia JRM (2020) Discussing the “First Cry” as an Initial Assessment for Neonates. Am J of Pediatr 6: 129-132.
  28. Moyo GPK (2020) Perinatality and Childbirth as a Factor of Decompensation of Mental Illness: The Case of Depressive States in Newly Delivered Cameroonian Women. ABEB 4: 000592.
  29. Moyo GPK, Hermann ND (2020) The Psycho-Sociocultural Considerations of Breastfeeding in a Group of Cameroonian Women with Inadequate Practices. J Psychiatry Psychiatric Disord 4: 130-138.
  30. Moyo GPK (2020) Breast Pathologies and Inadequate Breastfeeding Practices: A Survey Among a Group of Newly Delivered Women in Yaounde, Cameroon. Journal of Family Medicine and Health Care 6: 87-90.
  31. Moyo GPK, Djoda N (2020) Relationship Between the Baby Blues and Postpartum Depression: A Study Among Cameroonian Women. American Journal of Psychiatry and Neuroscience 8: 26-29.
  32. Moyo GPK, Ngwanou DH, Sap SNU, Nguefack F, Mah EM (2020) The Pattern of Breastfeeding among a Group of Neonates in Yaoundé, Cameroon. International Journal of Progressive Sciences and Technologies 22: 61-66.
  33. Nguefack F, Ngwanou DH, Kamsu Moyo GP, Ejake L, Mah, EM, et al. (2020) Reasons for Delayed Breastfeeding Initiation among Newly Delivered Women in Two First-Category Hospitals in Yaoundé, Cameroon. Open J Pediatr 10: 474-485.
  34. Stewart A, Malhotra A (2015) Gestational diabetes and the neonate: challenges and solutions. Research and Reports in Neonatology 5: 31-39.
  35. Moyo GPK, Um SSN, Awa HDM, et al. (2022) The pathophysiology of neonatal jaundice in urosepsis is complex with mixed bilirubin!!! J Pediatr Neonatal Care 12: 68-70.
  36. Moyo GPK, Nguedjam M, Miaffo L (2020) Necrotizing Enterocolitis Complicating Sepsis in a Late Preterm Cameroonian Infant. Am J Pediatr 6: 83-86.
  37. Moyo GPK, Sap Ngo Um S, Awa HDM, Mbang TA, Virginie B, Makowa LK et al. An Atypical Case of Congenital and Neonatal Grave’s Disease. Annal Cas Rep Rev: ACRR 2.
  38. Ngwanou DH, Ngantchet E, Moyo GPK (2020) Prune-Belly syndrome, a rare case presentation in neonatology: about one case in Yaounde, Cameroon. Pan Afr Med J 36: 102. [crossref]
  39. Tague DAT, Evelyn Mah, Félicitee Nguefack, Georges Pius Kamsu Moyo, Lionel Loic Kago Tcheyanou, et al. (2020) Beckwith-Wiedemann Syndrome: A Case Report at the Gynaeco-Obstetric and Pediatric Hospital in Yaounde, Cameroon. Am J Pediatr 6: 433-436.
  40. Moyo GPK, Djomkam IFK (2020) Epidemio-clinical Profile of Stunting in School Children of an Urban Community in Cameroon. Am J Pediatr 6: 94-97.
  41. Moyo GPK, Djomkam IFK (2020) Factors Associated with Stunting in School Children of an Urban Community in Cameroon. Am J Pediatr 6: 121-124.
  42. Moyo GPK, Ngapout OD, Makowa LK, Mbang AT, Binda V, et al. (2022) Exogenous Cushing’s Syndrome with Secondary Adrenal Insufficiency in an Asthmatic Infant: “Healing Evil with Evil”. Arch Pediatr 7: 203.

Why Diazepam More than Other Benzodiazepines is Unsuitable for Neonates?

DOI: 10.31038/PSC.2022212

Abstract

For a good number of years, physician has learnt about the contraindication of diazepam and perhaps benzodiazepines at large in the management of neonatal seizures. However, very few scientific publications give account about underlying pathophysiological and pharmacological insights of mechanism involved. As a result, a non or poorly understood categorization of neonatal anticonvulsants is sometimes observed in daily clinical pediatric practice in some settings, with each physician going by his own way of managing seizures in neonates. This with more or less success and consequent adverse effects. This review is intended to contribute to a better understanding of phenomena implicated in the unsuitable use of diazepam beyond other benzodiazepines in the management of neonatal seizures.

Keywords

Diazepam, Benzodiazepine, Anticonvulsant, Antiepileptic, Neonatal seizure

Introduction

Neonatal seizures are a spectacular but common sign in pediatrics which may be worrying for parents and preoccupying for the physician. Although there have been considerable advances in their symptomatic treatment, their etiological enquiry and the curative aspects of their management may be quite challenging [1,2]. In effect causative factors may be due to injuries that occur during the antepartum, peripartum or postpartum periods, with possible acute or chronic complications. This underlines the necessity for deep assessment and adequate management of such infants with manifestations that can negatively impact the psychological states parents [3-25].

Despite the fact that the development of various anticonvulsant drugs has led to improvements of therapeutic attitudes towards neonatal seizures, the safety of these medications with regards to systemic immaturity in neonates remains equivocal. Therefore, a judicious choice of the wright drug in adequate doses is often required, even though instantaneous cessation of convulsive fits with drug administration is not always guaranteed [26].

Actually, the recommended first line drug for the management of neonatal seizures is phenobarbital, which belongs to the pharmacological class of barbiturates. However, it may happen that phenobarbital alone does not suffice enough to stop the seizure, and a second or third line drug required [26-29]. Since their development, benzodiazepines have become popular in general medicine, and progressively adopted as second line anticonvulsant drugs in neonatal seizure. This is mainly due to their effective anticonvulsant properties. Moreover, their myorelaxation ability, anxiolytic effects, and low toxicity, especially when given on short term, at minimum effective doses have made them more useful [27,28]. Nevertheless, their use may be associated with a number of adverse effects such as sedation, amnesia, cognitive impairment, ataxia, and dependence, contraindicating their long-term prescription. Due to the predominance of their advantages over documented side effects, progressive long-term use of benzodiazepines has been noted [27,28]. This still often occurs in current clinical practice, but not without consequences. As a matter of fact, adverse effects and their severity may vary from one benzodiazepine to another, according to specific pharmacological characteristics that differentiate them [27].

All benzodiazepines fundamentally have the same mechanism of action and may only vary in few points from each other such as receptor binding sites or subunits, the time onset of action, duration of action and adverse effects [29]. However, diazepam is among the first discovered benzodiazepines. It’s the most commonly used molecule of the kind, and seems to be the prototype of the pharmacological class, being involved in most clinical trials and experiments.

Recent research findings have led to better understanding of the mechanism of action of benzodiazepines and significant milestones in the explanation of reported side effects are being noted. In the following paragraphs, we will give a simplistic but essential description of current knowledge about benzodiazepine-receptors interaction. Emphasis will be laid on diazepam specificities and the reasons for its contraindication in neonates illustrated.

Mechanism of Action of Benzodiazepines

Benzodiazepine produces neurological effects through allosteric interaction with a particular receptor in the central nervous system known as GABAA receptor (GABAAR) [29]. This appears to be the fastest inhibitory neurotransmitter system in the brain. The receptor comprises five transmembrane-spanning subunits that combine to form a ligand-gated chloride channel [30]. Various subunits actually identified are α16, β13, γ13, δ, ε, θ, and π making GABAAR heterogeneous in constitution [31]. From an electrophysiological stand point, the combination of Gamma Amino Butyric Acid (GABA) with its natural receptor- GABAAR may occur through several patterns according to subunits involved. The involvement and combinations of these subunits generally yields a pentamer which somehow improves the functioning of the receptor. In effect, the most commonly described subunit combination is the pentamer with 2α, 2β, and 1γ subunits [32]. However, whatever the subunit pattern formed, there is neuronal action potential inhibitory effects produced. This involve increased chloride ions (Cl) flowing into the neuron, causing inhibitory postsynaptic signal (IPSP) through hyperpolarization of the cell membrane.

Over the years, studies have shown that GABAAR with specific subunits have particular distribution throughout the nervous system, producing various effects and functions according to their structural constitution and their anatomical location [30]. Indeed, diverse but specific GABAergic subunits concentrations have been identified in the cortex, hippocampus, and basal ganglia for example. This with a spectrum of complex neurological signaling depending on receptor subunits involvement [31,33] whereas, some other receptor subunits may have a random distribution throughout the central nervous system.

Benzodiazepines specifically increase by allosteric and agonistic means the affinity of GABAAR containing subunits located within the α to γ subunit interval. Contrarily, they may never interact with GABAAR that involve the α4- or α6-subunit. This selectivity permitted to understand that other drugs such as barbiturates and some antiepileptics, anesthetics, neurosteroids and ethanol, proven to affect GABAAR functioning may act through other subunits [33]. Moreover, within benzodiazepine-sensitive GABAAR subunits, different combinations or involvement may be responsible for distinct neurological effects. As such, processes derived from genetics and pharmacology permitted to improve on the selectivity of novel benzodiazepines molecules and anticonvulsants. These refined molecules are capable to produced majored distinct neurological impacts including sedative, anxiolytic, myorelaxative, or anticonvulsive effects with some precision [31]. This evolution marks the difference with conventional benzodiazepines such as diazepam which can produce intense stimulation of most GABAAR, with consequent secondary and adverse effects.

Adverse and Side Effects of Benzodiazepines in Neonates

An adverse effect might be defined as an unintended pharmacologic outcome that occurs even though the drug is administered correctly, while a side effect may be considered as a secondary unwanted repercussion that occurs as a result of a drug therapy. As stated before, under normal circumstances the interaction between GABA and GABAAR leads to the intracellular influx of Cl which causes cell membrane hyperpolarization. This is in turn responsible for inhibitory signaling against eventual depolarization, action potential or nerve impulses [29,30].

However, during the neonatal period, nerve cells are believed to have high concentrations of Cl to the point that GABA-gated Cl efflux sets up, as well as potential GABA-mediated neuro-excitation. This phenomenon seems compatible with the development of the central nervous system in humans and predominates in the neocortex [34]. As a result of this process, the neocortex shows the most delayed establishment of neuronal Cl homeostasis during development, compared with other subcortical brain regions [34-36]. Although the phenomenon reverses during maturation as nerve cells Cl concentrations progressively decrease to render GABA actions inhibitory [37,38].

Therefore, when a benzodiazepine is administered to a neonate with seizure, neocortical enhancement of GABA-gated Cl efflux may occur with GABA-mediated neuro-excitation. This might produce paradoxical effects to those expected, with rather exacerbation of myoclonus, seizures, and abnormal movements [34-36]. This could mean that cessation of neonatal seizures after benzodiazepine administration might proceed through subcortical inhibition pathways. On the other hand, the persistence of seizure might be explained by paradoxical neuro-excitation or reduced anticonvulsant activity of benzodiazepines in neonates [38-41].

Contraindicating Specificities of Diazepam in Neonates

Beyond the above listed side effects and adverse effects that may be caused by the use of benzodiazepines in the management of neonatal seizures, diazepam has specific characteristics that makes it even less recommended in such instances. In effect, being one of the earliest benzodiazepines discovered, diazepam is one of the most conventional [38-41]. It has not benefited from novel pharmacological fashioning that procure refined benzodiazepines GABAAR subunit selectivity. Therefore, it lacks specificity of action and strongly modifies the functioning of most GABAAergic subunits and with equal affinity. This with consequent secondary and adverse effects including apnea and hypotension which are most fatal [38-41]. Moreover, diazepam has a longer duration of action with one of the most delayed half-life in the pharmacological class, making its various side and adverse effects even stronger and lasting compared with other benzodiazepines. Furthermore, the metabolism of diazepam as a benzodiazepine is one of the most complex with more biochemical transformations, yielding a greater number of active metabolites which multiply expected, side and adverse effects, in comparison with other class members [38-41].

Conclusion

Although some benzodiazepines such as clonazepam are recommended as second line anticonvulsants in neonatal seizure benzodiazepine should be avoided as much as possible in neonate infants as a general rule. They may be responsible for paradoxical effects with exacerbation of initial neurological signs and symptoms, or cause adverse effects that may be fatal in some cases. This phenomenon is more common with conventional, non-selective molecules such as diazepam which strongly stimulate a wide variety of GABAAR, relatively over a longer duration. However, in case of necessity the choice of adequate benzodiazepine should consider selectivity, half-life, duration of action, availability and cost-prize effectiveness, as well as the risk-benefit adequacy.

Acknowledgement

All collaborators to this project

References

  1. Moyo GPK, Sobguemezing D, Adjifack HT (2020) Neonatal Emergencies in Full-term Infants: A Seasonal Description in a Pediatric Referral Hospital of Yaoundé, Cameroon. Am J Pediatr 6: 87-90.
  2. Georges Pius KM, Aurore Albane E, Marie-Paul B, Eteme A, Ngono V, et al. (2022) Neonatal Sepsis: Highlights and Controversies. J Pediatr Neonatal 4: 1-5.
  3. Chiabi A, Kago DA, Moyo GPK, Obadeyi B (2019) Relevance and Applicability of the Apgar Score in Current Clinical Practice. EC Paediatrics 8: 1-7.
  4. Moyo GPK, Tetsiguia JRM (2020) Discussing the “First Cry” as an Initial Assessment for Neonates. Am J of Pediatr 6: 129-132.
  5. Moyo GPK, Um SSN, Awa HDM, Mah E, Chiabi A, et al. (2022) The pathophysiology of neonatal jaundice in urosepsis is complex with mixed bilirubin!!! J Pediatr Neonatal Care 12: 68-70.
  6. Moyo GPK, Nguedjam M, Miaffo L (2020) Necrotizing Enterocolitis Complicating Sepsis in a Late Preterm Cameroonian Infant. Am J Pediatr 6: 83-86.
  7. Moyo GPK, Sap Ngo Um S, Awa HDM, Mbang TA, Virginie B, et al. (2022) An Atypical Case of Congenital and Neonatal Grave’s Disease. Annal Cas Rep Rev
  8. Ngwanou DH, Ngantchet E, Moyo GPK (2020) Prune-Belly syndrome, a rare case presentation in neonatology: about one case in Yaounde, Cameroon. Pan Afr Med J 36: 102. [crossref]
  9. Tague DAT, Evelyn Mah, Félicitee Nguefack, Moyo GPK, Tcheyanou LLK, et al. (2020) Beckwith-Wiedemann Syndrome: A Case Report at the Gynaeco-Obstetric and Pediatric Hospital in Yaounde, Cameroon. Am J Pediatr 6: 433-436.
  10. Moyo GPK, Mendomo RM, Batibonack C, Mbang AT (2020) Neonatal Determinants of Mothers’ Affective Involvement in Newly Delivered Cameroonian Women. Journal of Family Medicine and Health Care 6: 125-128.
  11. Moyo GPK (2020) Epidemio-clinical Profile of the Baby Blues in Cameroonian Women. Journal of Family Medicine and Health Care 6: 20-23.
  12. Moyo GPK, Djoda N (2020) Relationship Between the Baby Blues and Postpartum Depression: A Study Among Cameroonian Women. American Journal of Psychiatry and Neuroscience 8: 26-29.
  13. Moyo GPK (2020) Perinatality and Childbirth as a Factor of Decompensation of Mental Illness: The Case of Depressive States in Newly Delivered Cameroonian Women. ABEB 4: 000592.
  14. Moyo GPK, Djoda N (2020) The Emotional Impact of Mode of Delivery in Cameroonian Mothers: Comparing Vaginal Delivery and Caesarean Section. American Journal of Psychiatry and Neuroscience 8: 22-25.
  15. Foumane P, Olen JPK, Fouedjio JH, GPK Moyo, Nsahlai C, et al. (2016) Risk factors of maternity blues after caesarean section in Yaoundé, Cameroon: a case-control analysis. Int J Reprod Contracept Obstet Gynecol 5: 4424-4427.
  16. Moyo GPK, Djomkam IFK (2020) Epidemio-clinical Profile of Stunting in School Children of an Urban Community in Cameroon. Am J Pediatr 6: 94-97.
  17. Moyo GPK, Djomkam IFK (2020) Factors Associated with Stunting in School Children of an Urban Community in Cameroon. Am J Pediatr 6: 121-124.
  18. Moyo GPK, Ngapout OD, Makowa LK, Mbang AT, Binda V, et al. (2022) Exogenous Cushing’s Syndrome with Secondary Adrenal Insufficiency in an Asthmatic Infant: “Healing Evil with Evil”. Arch Pediatr 7: 203.
  19. Hermann ND, Moyo GPK (2020) Neonatal Determinants of Inadequate Breastfeeding: A Survey among a Group of Neonate Infants in Yaounde, Cameroon. Open Access Library Journal 7: e6541.
  20. Hermann ND, Moyo GPK, Ejake L, Félicitée N, Evelyn M, et al. (2020) Determinants of Breastfeeding Initiation Among Newly Delivered Women in Yaounde, Cameroon: a Cross-Sectional Survey. Health Sci Dis 21: 20-24.
  21. Moyo GPK, Dany Hermann ND (2020) Clinical Characteristics of a Group of Cameroonian Neonates with Delayed Breastfeeding Initiation. Am J Pediatr 6: 292-295.
  22. Moyo GPK, Hermann ND (2020) The Psycho-Sociocultural Considerations of Breastfeeding in a Group of Cameroonian Women with Inadequate Practices. J Psychiatry Psychiatric Disord 4: 130-138.
  23. Moyo GPK, Ngwanou DH, Sap SNU, Nguefack F, Mah EM (2020) The Pattern of Breastfeeding among a Group of Neonates in Yaoundé, Cameroon. International Journal of Progressive Sciences and Technologies 22: 61-66.
  24. Moyo GPK (2020) Children and Adolescents’ Violence: The Pattern and Determinants Beyond Psychological Theories. Am J Pediatr 6: 138-145.
  25. Rennie JM, Boylan GB (2003) Neonatal seizures and their treatment. Curr Opin Neurol 16: 177-181. [crossref]
  26. Connell J, Oozeer R, De Vries L, Dubowitz LM, Dubowitz V (1989) Clinical and EEG response to anticonvulsants in neonatal seizures. Arch Dis Child 64: 459-464. [crossref]
  27. Painter MJ, Scher MS, Stein AD, Armatti S, Wang Z, et al. (1999) Phenobarbital compared with phenytoin for the treatment of neonatal seizures. N Engl J Med 341: 485-489. [crossref]
  28. Glykys J, Dzhala VI, Kuchibhotla KV, Feng G, Kuner T, et al. (2009) Differences in cortical versus subcortical GABAergic signaling: a candidate mechanism of electroclinical uncoupling of neonatal seizures. Neuron 63: 657-672. [crossref]
  29. Lader M (1991) History of benzodiazepine dependence. J Subst Abuse Treat 8: 53-59. [crossref]
  30. Owen RT, Tyrer P (1983) Benzodiazepine dependence. A review of the evidence. Drugs 25: 385-398. [crossref]
  31. Campo-Soria C, Chang Y, Weiss DS (2006) Mechanism of action of benzodiazepines on GABAA receptors. Br J Pharmacol 148: 984-990. [crossref]
  32. Vinkers CH, Olivier B (2012) Mechanisms Underlying Tolerance after Long-Term Benzodiazepine Use: A Future for Subtype-Selective GABAA Receptor Modulators? Adv Pharmacoll Sci 416864.
  33. Rudolph U, Mohler H (2006) GABA-based therapeutic approaches: GABAA receptor subtype functions. Curr Opin Pharmacol 6: 18-23. [crossref]
  34. McKernan RM, Whiting PJ (1996) Which GABAA-receptor subtypes really occur in the brain? Trends in Neurosci 19: 139-143. [crossref]
  35. Sieghart W (1995) Structure and pharmacology of γ-aminobutyric acid A receptor subtypes. Pharmacol Rev 47: 181-234. [crossref]
  36. Glykys J, Staley KJ (2015) Diazepam effect during early neonatal development correlates with neuronal Cl-. Annals of Clinical and Translational Neurology 2: 1055-1070. [crossref]
  37. Glykys J, Dzhala VI, Kuchibhotla KV, Feng G, Kuner T, et al. (2009) Differences in cortical versus subcortical GABAergic signaling: a candidate mechanism of electroclinical uncoupling of neonatal seizures. Neuron 63: 657-672. [crossref]
  38. Stein V, Hermans-Borgmeyer I, Jentsch TJ, H€ubner CA (2004) Expression of the KCl cotransporter KCC2 parallels neuronal maturation and the emergence of low intracellular chloride. J Comp Neurol 468: 57-64. [crossref]
  39. Ben-Ari Y, Gaiarsa JL, Tyzio R, Khazipov R (2007) GABA: a pioneer transmitter that excites immature neurons and generates primitive oscillations. Physiol Rev 87: 1215-1284. [crossref]
  40. Cancedda L, Fiumelli H, Chen K, Poo M (2007) Excitatory GABA action is essential for morphological maturation of cortical neurons in vivo. J Neurosci 27: 5224-5235. [crossref]
  41. Griffin III CE, Kaye AM, Bueno FR, Kaye AD (2013) Benzodiazepine Pharmacology and Central Nervous System–Mediated Effects. The Ochsner Journal 13: 214-223. [crossref]

Investigating Feeding Regimen of Brown Trout (Salmo Trutta Fario) in Tonekabon River, Northern Iran

DOI: 10.31038/AFS.2022441

Abstract

The present study was conducted in a four-season period, from September 2016 to 2017, in Tonekabon River, northern Iran. A total of 91 brown trout (Salmo Trutta Fario) fish were collected from five stations using electrofishing equipment. They composed 40 females, 41 males, and 10 of unknown sex. Their age ranged from 1 to 3 years, and they had a minimum and maximum length of 41 mm and 175 mm, respectively. The preys identified within their gastrointestinal tract included insect larvae of Ephemeroptera, Diptera, Liponeura, Simulium, Hydropsyche, Coleopteran, Trichoptera, flying insect, spawn, Odonata, Oligochaeta, Plecoptera taxonomic groups. The collected fish were classified into three age groups including 1- and <1-year, 2-years, and 3-years old as a scale to define their feeding intensity. The consumption percentage of Hydropsyche and Liponeura was significantly different among three classes. However, there was no significant difference in the consumption intensities of Ephemeroptera, Plecoptera, and Simulium. The reproduction season of brown trout fish is within fall. Maximum feeding intensity occurs in spring, whereas minimum feeding takes place within summer and fall seasons. Classes 1 and <1-year-old had higher feeding intensity than other classes (classes 2 and 3 years old). In general, Plecoptera, Ephemeroptera and Simulium constitute primary preys of the fish, while Liponeura, Hydropsyche, Dipteral, Trichoptera, and Oligochaete, Coleoptera, Oligochaeta, Odonatan, flying insects, and spawn are considered as the subordinate preys for the feeding regimen of brown trout. The highest amount of prey for stations 1, 2, 3, 4 and 5 included Simolium, Ephemeroptera, Simolium, Simolium and Liponeura, respectively. Station 2 had the highest glutting stomach index, followed by station 1, both of which were located on the Se-Hezar River.

Keywords

Brown trout, Feeding habit, Gutting stomach index, Tonekabon River

Introduction

The Tonekabon River is located in western Mazandaran. Thanks to its peculiar physicochemical properties and benthic material, it is brimmed an outstanding biodiversity. This river is one of the most waterfull (Hig dischange) rivers south of the Caspian Sea. This river comprises the Do-Hezar, Se-Hezar and Valamrod rivers. In addition to aqous animals, it harbors various species, such as salmonidae, cyprinidae and angailidae [1]. Brown trout (salmo trutta fario) is one of most important species in the Tonekabon River that inhabits the conflux of these rivers. Due to its physicochemical properties [2] and the ecological condition [3,4], it is considered as a native fish. This species has economic value, especially, it is one of the most popular species among sportsman for angling [5,6]. The low survival rates of Chinook salmon (oncorhynchus tshawytscha) smolts in California’s

Central Valley has been attributed to multiple biological and physical factors, although the impact of each factor remains unclear [7]. This thesis is on effort to identify feeding regiment of this species in the Tonekabon River. As we know, feeding is one of the most important needs of an organism. Fir Fochetti, R st order necessities of an organism (growth, development and reproduction) altogether conduct with consumed energy from food entered to body all of other energy-required processes in fish body accomplish with food consumption [8]. In aquaculture, fish feeding is a critical step that everyone in encounter this issue in fishery industry for solving related issues. At present research on studying fish distribution of fish species [9,10]. It is impossible to design a logical optimization method for commercial fish reserves without identifying how the fish seek their food sources and learning about the relationship between the fish and other consumer of the food source and the connection between predators [11,12]. Understanding the type and composition of food organisms consumed by other competitors, the amount and way of food consumption, and linkage between feeding with time. Place and condition and some of other factors allow researchers to achieve a complete [13] and comprehensive perspective on the life of organisms [3]. The findings of this research can be used to a better understanding of ecological condition of brown trout’s habitat in the Tonekabon River.

Material and Methods

Ethical Statement

Respectfully yours, the red-spotted trout caught in this article were carried out in compliance with the standards, and no damage was done to the fish and the fish environment was not polluted during the fishing. It is related to a few years ago and it is related to my dissertation. Also in Iran, there is correspondence in the field of observing facial ethics. However, according to the international re, all students observed professional ethics in working with living beings regulations.

First, the Do-Hezar and Se-Hezar rivers in Tonekabon were divided into five stations. Then, the fish were collected using an electroshock instrument with a power of 1.7 KM (DC) and a 300-400V voltage. Immediately after fishing, the biometry properties of the fish were measured. Then, by cutting the gullet (in the throat) and cutting the gut in the rectum, the digestion apparatus was removed from and fixed in 70% alcohol.

The following information was collected and recorded in the sampling process: total length, fork length, standard length, fish weight, stomach weight, gender determination, gonad weight, age, and gut length. The fixed stomachs were taken from alcohol, rinsed with water, and placed in Petri dishes. The stomach was opened, and the swallowed preys were examined thoroughly [14]. The type and the number of preys, and the percentage of prey groups were recorded. The weight of the stomach content was also measured. The sexual maturity index was calculated from the following formula:

Sexual maturity index = ((gonad weight/(body weight-entrails weight))*100

The relative length of the gut, i.e., the gut length to body length ratio, was calculated. Also, the gutted stomach index (GSI) was calculated based on the following formula [15]:

GSI=stomach content weight/body weight.

Results

The average percentage of preys fed by brown trout during the perfect period is as follows: The frequency of primary, subordinate, and casual preys of brown trout was calculated using the formula below: Fp=Np*100/N1

Fp: prey frequency

Np: number of N stomach than has P prey

N1: number of investigated gutted stomach

If Fp has a value of above 50, the prey is considered primary; however, if this value is between 10-50, the prey is considered as subordinate prey. Finally, Fp values below 10 are considered as casual prey. Results from this investigation were analyzed using the variance analysis test. The amount of sexual maturity index in various seasons among the male and female fish was calculated based on the following table (Tables 1-3):

Table 1: The average percentage of prey fed by brown trout during the perfect period


Percentage

Prey

Primary prey

34.14

Simulium
Primary prey

24.36

Ephemeroptera
Subordinate prey

16.40

Liponeura
Primary prey

11.68

Plecoptera
Subordinate prey

9.08

Hydropsyche
Subordinate prey

1.58

Diptera
Casual prey

0.78

Flying insects
Casual prey

0.73

Cleoptera
Subordinate prey

0.53

Trichoptera
Casual prey

0.30

Oligochaeta
Casual prey

0.27

Odonata
Casual prey

0.14

Spawn

Table 2: The amount of sexual maturity index

Winter

Autumn Summer Spring

Sexual maturity index

0.24

1.6

3.36

0.38

Male
0.34

0.21

21.3

0.42

Female
0.27

0.73

2.79

0.43

Average

Table 3: Guttled stomach index (GSI) in males and females in different seasons

Winter

Autumn Summer Spring

GSI

166.40

132.42

170.93

276.92

male
200.65

117.98

116.41

246.48

Female

The relative length of gut (RLG) in each studied specimen was less than one, indicating the carnivore nature of the fish studied. Gutted stomach index in males and females was compared in different seasons. The maximum and minimum levels of the gutted stomach index in males were observed in spring and autumn. Also, the maximum and minimum levels of the gutted stomach index in females were in spring and summer.

Discussion

For a more accurate age-based analysis of the fish, they were divided into three classes:

Class1: the fish below equal to or below one year of age.

Class2: The two-year-old fish.

Class3: The three-year-old fish.

The variance analysis test showed a significant difference between different classes in terms of the consumption of hydropsyche. In contrast, this test did not show a significant difference between the designated classes in the consumption percentage of Ephemeroptera. The high sexual maturity index in summer confirms that the spawning season in this fish is from mid-September to autumn.

The mean of RLG in different classes was:

Class one=0.32, class two=0.33, class three=0.35

The maximum of gutted stomach index is in spring, and the minimum of this index occurs in fall and winter. These results agree with the findings of [16] on brown trout in Bager lake and the Lepenica River. Also, decreased feeding in summer and fall (especially summer) compared to winter could be a high sexual maturity index in these seasons (summer and autumn) [11].

Results from feeding intensity between three classes 2 and 3. These findings confirmed that brown trout in the early stages consumed more than later stages. The weight of stomach content in the smallest fish and the larger classes had a significant difference at (1%), but the numbers of organisms in this level had no significant differences, confirming that brown trout could catch larger prey if the prey size increased.

The results also indicated that the frequency of consumed organisms during different seasons based on presence was changeable, confirming that brown trout fed on the most frequent and most well-known prey. The presence of spawn in one of the samples also verified the selection factor based on the presence of prey. Furthermore, brown trout’s summer consumption of flying insects led to two conclusions: first, it could take some of its food (prey) at water level. Second, the feeding somehow varied with season and food (prey) presence because these land-living insects were scarce in other seasons [2,14].

Data Availability Statement

The data is related to Mehran Moslemi’s master’s thesis. The supervisor of this thesis was Dr. Mohammad Reza Ahmadi. If required, the information related to the data of this article is available in the Central Library of the University of Tehran.

References

  1. Ride ditmare (1986) Fish and fishery, translated by Vosoghi G. and Ahmadi M., Markaz-e-Daneshgahi publication 89-91.
  2. Demir O, Gumus E, Kucuk F, Gunlu A, Kepenek (2010) Some repreactive features of brown trout (Trout, Salmo trutta macrostigma Dumeril 1858) and its larval development under culture condition. Pak Vet. Journal 30: 223-226.
  3. Gunderson AR, Armstrong EJ, Stillman JH (2016) Multiple Stressors in a Changing World: The Need for an Improved Perspective on Physiological Responses to the Dynamic Marine Environment. Annual Reviews in Marine Science 8: 357-378. [crossref]
  4. Todgham AE, Stillman JH (2013) Physiological responses to shifts in multiple environmental stressors: relevance in a changing world. Integrative and Comparative Biology 53: 539-544. [crossref]
  5. Fochetti R, Argano R, Tierno De Figueroa JM (2008) Feeding ecology of various age-classes of brown trout in River Nera, Central Itally. J. Zool 138: 128-131.
  6. Vosoghi Gholamhosein, Mostajir Behzad (1990) Freshwater fish, Tehran University publication.
  7. Henderson MJ, Iglesias IS, Michel CJ, Ammann AJ, Huff DD (2019) Estimating spatial-temporal differences in Chinook salmon outmigration survival with habitat- and predation- related covariates. Can J Fish Aquat Sci 76: 1549-1561.
  8. Saidi, Ali Asghar (1990) Tonekabon River, fisheries Research Center, Mazandaran province.
  9. Bud IL, Vladau VV (2009) The geographic isolation impact on evolution of some morphophysiological features in the brown trout (Salmo trutta fario Linnaeus). AACL Bioflux 1: 31-49.
  10. Sajadi Masoud (1996) The investigation of feeding regiment in Stizostedion luciaperca, M. S. thesis, Tehran University, under supervision Dr. Mohamad Reza Ahmadi.
  11. Alp A, Kara C, Buyukcapar HM (2005) Age, growth and diet composition of the Resident Brown Trout, Salmo trutta macrostigma Dumeril 1858, in firniz stream of the River Ceyhan, Turkey. J. vel. Anim. Sci 29: 285-295.
  12. Todgham AE, Stillman JH (2013) Physiological responses to shifts in multiple environmental stressors: relevance in a changing world. Integrative and Comparative Biology 53: 539-544. [crossref]
  13. Rakocevic J, Sukovic D, Maric D (2018) Distribution and Relationships of Eleven Trace Elements in Muscle of Six Fish Species from Skadar Lake (Montenegro). Turkish Journal of Fisheries and Aquatic Sciences 18: 647-657.
  14. Nafisi Mahmoud (1990) The hand book of identification of invertebrate in running waters, project of bachelor, Tehran University, under supervision of Mohamadreza Ahmadi.
  15. Hynes HB (1970) The ecology of Running Water, University of Toronto Press, Canada. 555p.
  16. Fašaić K, Debeljak L (1986) Hidrokemijski režim u ribnjacima za vrijeme zimovanja mlađa riba biljojeda u uvjetima povećane gustoće nasada. Croatian Journal of Fisheries: Ribarstvo 41: 1-7.
fig 1

The Implicit Sense of Agency: A Decontextualized Indirect Measure of the Sense of Agency Free of Social Desirability

DOI: 10.31038/PSYJ.2022442

Abstract

The sense of agency (SoA) refers to the feeling of initiating and controlling one’s actions. SoA is thought to play an important role in a number of mental illnesses. SoA can be assessed with both explicit (self-report) and implicit (perceptual judgment) measures. However, existing measures tap only specific aspects of the SoA (e.g., temporal binding). To date, there is lack of general (decontextualized) measure of implicit SoA. The aim of the present research was to develop a new decontextualized measure of implicit SoA, based on a reaction time interference paradigm (a variant of the semantic Simon task). An examination of its relation with a decontextualized explicit measure of the SoA provided evidence for its convergent and discriminant validity. In Study 1 (N = 115 French citizens), there was a significant modest correlation between the direct and indirect measures of the SoA. In Study 2 (N = 101 British citizens), this finding was replicated in an English-speaking sample. Moreover, it was found that the indirect, but not the direct, measure of the SoA was free of social desirability bias. These findings suggest that the decontextualized direct and indirect measures of the SoA used in the present work assess the same latent underlying construct. The indirect measure may be a useful tool to assess the SoA whenever social desirability is a concern.

Keywords

Sense of agency, Direct and indirect measures, Construct validity, Reaction time-based interference measure, Social desirability

The Implicit Sense of Agency: A Decontextualized Indirect Measure of the Sense of Agency Free of Social Desirability

The sense of agency (SoA) refers to the feeling of initiating and controlling one’s own actions [1,2], and is believed to play a central role in a variety of normal and pathological behaviors [3]. Over the last two decades, researchers have been increasingly interested in exploring the SoA, and both direct and indirect measures of the construct have been developed [4]. Direct measures include self-rating scales and self-report questionnaires, where individuals are asked to make judgments about their experience of agency. Indirect measures typically include performance on perceptual tasks that require discriminating and evaluating self-generated and externally generated stimuli. These measures assess specific aspects of the SoA, and are often uncorrelated to each other [5-7]. Recently, a more general self-report measure of the SoA has been developed [6]. This direct “decontextualized” measure assesses general feelings about the SoA in general, rather than on a specific task. To date, however, there is a lack of “decontextualized” indirect measure of the SoA. The present study aimed to redress this neglect by developing a new indirect measure of implicit SoA, semantically related to the explicit judgment of agency, but with an important advantage over direct measures: control over social desirability bias [8]. In what follows, extant direct and indirect measures are described, before addressing the problem of social desirability.

Indirect Measures of the Sense of Agency

The SoA has classically been assessed in the laboratory with specific tasks such as the temporal binding task [9] and the sensory attenuation task [10]. These tasks provide an indirect measure of the sense of agency, as the participants are not explicitly asked to make judgment about their SoA. Rather, their SoA is inferred from their evaluations of specific attributes of self-generated and externally generated stimuli. In the temporal binding task, the participant has to estimate the time delay between two stimuli (two tones) when the first stimulus is either triggered by one’s own action (a key press) or externally generated (initiated by a computer program). Temporal binding refers to a reduction of the perceived time delay when the participant is the initiator of the action, compared to when the action is externally generated. In the sensory attenuation task, the participant has to evaluate the intensity of a self-initiated action, compared to the intensity of a computer-generated action. The sensory attenuation effect refers to a reduction in the subjective intensity of a self-initiated action, compared to the intensity of the same action initiated by another agent. This sensory attenuation phenomenon has been found for a variety of stimuli, including haptic, auditory and visual stimuli [11-15]. Even if there is still controversy about the precise underlying mechanisms, temporal binding and sensory attenuation have been used as SoA proxies in numerous studies [16-20].

Direct Measures of the Sense of Agency

According to a prominent model of the SoA [21] the SoA does not consist only of sensorimotor processes but also involves higher-order conceptual processes. At the most basic level, a perceptual representation (the feeling of agency) is formed based on an integration of proprioception, sensory feedback, and feed-forwards cues. However, the feeling of agency is further elaborated at a higher-order level to form a conceptual representation (the judgment of agency), contingent on current thoughts, goals, social influence and contextual cues. Therefore, the two-step account of agency [21], suggests that the SoA reflects a complex integration of two interrelated representations, the feeling of agency, at the perceptual level, and the judgment of agency, at the conceptual level.

The judgment of agency has often been assessed in specific perceptual tasks by asking participants to attribute a cause to an action-effect [22]. For example, in the temporary binding and sensory attenuation tasks participants are often asked to rate the degree to which they think that they are personally responsible for a particular action-effect on a scale from “not at all” to “absolutely” [23-26]. More recently, researchers have also sought to develop less contextualized measures of the judgment of agency, unrelated to a particular task. The sense of agency scale is a self-report questionnaire assessing the degree to which people think that they are personally responsible for what happens in their life. The scale includes items such as “I am completely responsible for everything that results from my actions” and consists of two main factors: judgment of positive (e.g. “Things I do are subject only to my free will”) and negative (e.g. “My actions just happen without my intention”) agency. To date, this self-report scale has been validated in two languages: Hebrew and French [27]. Tapal et al. reported a moderate-to-strong correlation (r = 0.35) between the negative subscale of the judgment of agency and obsessive-compulsive symptoms, providing preliminary evidence for the predictive validity of this direct measure.

Correlations between Direct and Indirect Measures of the Sense of Agency

Although people are generally aware of being the authors of their own actions, sometimes they underestimate or overestimate their agency (even in the absence of pathological disorder). The idea that the sense of agency is sometimes “just an illusion” is not new [28,29]. It is supported by a number of experiments using subliminal priming procedures [30-32]. Also consistent with the notion that individuals may lack insight on the cause of their actions, previous studies have found no significant relations between direct and indirect measures of the SoA. For example, Dewey and Knoblich measured the SoA using two indirect measures (the temporal binding task and the sensory attenuation task) in a sample of 78 young adults. They also assessed explicit judgment of agency in these specific tasks using self-rating scales. Although the sensory attenuation and temporal binding effects were replicated in these studies, somewhat surprisingly, there were no significant correlations between direct and indirect measures of the SoA. Neither temporal binding nor sensory attenuation was significantly correlated with explicit judgment of agency. These findings suggest that, even in the context of a simple perceptual task, individuals are unable to explicitly discriminate the actions they are responsible for to those they are not. In other words, these findings suggest that individuals are “strangers to their own actions”.

The findings reported by Dewey and Knoblich may indicate that the feeling and judgment of agency are two completely distinct constructs that do not overlap. However, this is at odds with the two-step account of agency which predicts that the judgment of agency is mainly a cognitive elaboration of the feeling of agency. More generally, recent research and theorizing indicate that direct and indirect measures of cognition often assess a single underlying process rather than two fundamentally distinct processes [33]. Therefore, there are theoretical reasons to expect the feeling and judgment of agency to be positively correlated with each other.

The Role of Social Desirability in the Link between Direct and Indirect SoA Measures

One variable that may affect the relation between direct and indirect measures of the SoA is social desirability. Individuals may be motivated to exaggerate their judgment of agency to give a good impression to others (impression management) or to self-enhance (self-deceptive enhancement) [34,35]. Direct and indirect measures are differently affected by social desirability responding. Direct measures are often biased by self-presentation or social desirability, because it is fairly obvious what is being measured by self-reports, and because responses on such measures are easily controllable. In contrast, indirect measures are more resistant, or less vulnerable, to social desirability, since what is being measured by these tasks is less obvious, and responses are less controllable. As a consequence, correlations between direct and indirect measures of the same construct are often moderated by social desirability, such that correlations decrease as a function of increasing social desirability. For example, social desirability moderates the relation between direct and indirect measures of attitudes towards asylum seekers. Using multilevel modelling analyses, Nosek [36-39] reported similar findings for 57 different attitude objects. Therefore, social desirability is one factor that is likely to affect the correlation between direct and indirect measures of the SoA. To the best of our knowledge, no study on the SoA has sought to control for social desirability responding.

The Present Studies

The aim of the present studies was twofold. First, a new indirect measure was developed to assess decontextualized SoA. Second, the relation between direct and indirect measures of the SoA was tested with and without taking into account the degree to which individuals are concerned with social desirability, to better identify the boundary conditions for these correlations to emerge. Correlations between direct and indirect measures of the SoA would provide support for a core prediction of the two-step account of agency. If the SoA results from the interplay of both motor and conceptual representations, then a positive correlation between direct and indirect decontextualized measures of the SoA is to be expected. Understanding under which precise conditions these correlations emerge is also important to inform researchers about when and why it is preferable to use indirect versus direct SoA measures.

Previous studies in which correlations between direct and indirect measures of the SoA were tested have focused on specific perceptual events – they were highly contextualized. In an effort to extend this work to a more general and decontextualized context, we used the newly developed SoA scale as a direct measure. To date however, there is no equivalent, decontextualized indirect measure in the literature. Therefore, in Study 1, we developed an indirect decontextualized SoA measure. To do this, a reaction time-based interference paradigm was used. This indirect measure was modeled after a measure previously used to assess implicit feeling of self-control [40], see also [41]. Study 1 tested the correlations between the direct and indirect measures of the SoA.

Study 2 aimed to replicate Study 1 findings. Another aim was to test correlations between direct and indirect measures of the SoA and social desirability. It was predicted that social desirability would be significantly correlated with the direct measure of the SoA. Such a correlation would be consistent with the idea that individuals do not accurately (e.g., exaggerate) report their SoA on direct measures. Finally, we examined whether correlations between direct and indirect measures of the SoA are moderated by social desirability, such that they decrease as a function of increasing social desirability. Such moderation would provide new insight on when and why direct and indirect SoA measures are correlated.

Study 1

In Study 1, we tested for the first time whether individual differences in direct and indirect measures of the SoA are correlated when using decontextualized measures, rather than direct and indirect measures specific to predetermined perceptual events.

Method

Participants

Because the study was conducted during the Covid-19 pandemic and the lockdown in France, it was run on the Internet. One hundred and fifteen participants (41 females, 73 males, and 1 “other”, mean age = 28.84, SD = 9.11) were recruited online from a crowdsourcing platform designed for scientific research (Prolific Academic, https://www.prolific.co/). Only French nationals fluent in French were eligible for the study (inclusion criteria). Participants received payment of 2.50£. All participants read and completed a consent form for online research. The study was approved by the Ethical Review Committee for Research of the University of Tours and Poitiers (CER-TP).

Indirect Measure of the SoA

As an indirect measure of the SoA, we used a variant of the semantic Simon task [42]. In previous studies, this task has been successfully used to measure implicit feelings of self-control. In the present study, this task was adapted to measure implicit feelings of agency. The task is based on a reaction time interference paradigm. In each trial, participants were asked to indicate as fast as possible whether the stimulus (series of words) displayed on the screen was written in uppercase or in lowercase letters by pressing the appropriate key on the keyboard (I = lowercase and E = uppercase). The stimuli (e.g., “INITIATING AN ACTION”) were directly taken from the items of the SoA scale. Participants were explicitly asked to ignore the meaning of the stimuli and to respond only to its perceptual form (lowercase vs. uppercase letters). The stimuli described an action or a state of mind. Each trial was preceded by a prime: “Me” or “Others”, presented for 1500 ms. After a fixation cross of 500 ms, the stimulus was displayed. Participants were asked to disregard the primes, described as distractors.

The task comprised twelve stimuli: six series of words congruent with the SoA (e.g., free will, responsible for my action) and six series of words incongruent with the SoA (e.g., surprised by my actions, behaving like a robot). Each stimulus was presented four times with the prime “Me” and four times with the prime “Others”, equally often in uppercase and lowercase letters, resulting in a total of 96 trials. The stimuli were presented in a full random order.

Direct Measure of the SoA

As a direct measure of the SoA, participants completed the SoA scale. This self-report measure consists of 13 items (e.g., “Things I do are subject only to my free will”, α = 0.79). Participants reported their degree of agreement with each item on a 7-point Likert scale (1 = totally disagree, and 7 = totally agree). The mean of the 13 items was computed, with higher scores indicating greater judgment of agency (M = 5.08, SD = 0.78). The SoA scale has two subscales: the sense of positive agency (SoPA, e.g., “Things I do are subject only to my free will”, α = 0.70) and the sense of negative agency (SoNA, e.g., “Nothing I do is actually voluntary”, α = 0.71). High scores on the SoPA indicate explicit judgment of positive agency (M = 4.98, SD = 0.93), whereas high scores on the SoNA indicate explicit judgment of negative agency (M = 2.82, SD = 0.87).

Procedure

The script of the experiment was written in PsychoPy3 (https://www.psychopy.org/), and them converted to JavaScript using Pavlovia (https://pavlovia.org/). The link to the study was then posted on the Prolific Academic platform for participant recruitment. Participants first performed eight practice trials of the indirect measure of the SoA, with agency-unrelated stimuli. Then, they completed the indirect measure of the SoA. This task took about 5 minutes to complete. Finally, participants completed the direct measure of the SoA. At the end of the study, they were thanked and debriefed.

Results

Data Cleaning

Concerning the indirect measure data, reaction times (RTs) larger than 1500ms (deemed to be too long) as well as those associated with incorrect responses were excluded (an average of 15.27% of the trials, SD = 11.80). Average RTs on schema-congruent trials preceded by the “Me” prime (M = 603.21, SD = 121.85) and preceded by the “Others” prime (M = 602.83, SD = 123.89) were then computed. In the same way, the average RTs on schema-incongruent trials preceded by the “Me” prime (M = 600.86, SD = 130.62) and preceded by the “Others” prime (M = 602.53, SD = 126.18) were computed. As in previous studies [40,41], we calculated a priming effect for schema-congruent trials (RTs on Others-congruent trials minus RTs on Me-congruent trials) and for schema-incongruent trials (RTs on Me-incongruent trials minus RTs on Others-incongruent trials). Higher scores on both of these indicators reflect higher agency. Thus, to create an overall SoA score, the priming effect on schema-congruent and schema-incongruent trials (M = 4.19, SD = 64.67) were added. Higher scores on this measure thus indicate higher semantic interference of schema-congruent rather than schema-incongruent stimuli with motor responses based on perceptual judgments. In other words, positive scores on this indirect measure indicate an association between the self (vs. others) with an implicit feeling of positive (vs. negative) agency.

Main Analysis

After data cleaning, the distribution of SoA scores on the indirect measure followed a normal distribution, W = 0.98, p = 0.088, Skew = 0.39, SE = 0.22. In the same way, the SoA scores on the direct measure were normally distributed, W = 0.97, p = 0.054, with a slightly left-skewed tail, Skew = −.44, SE = 0.22. Thus, parametric Pearson correlations are reported to examine the associations between direct and indirect measures of the SoA.

The correlation coefficients are reported in Table 1. As shown in this table, there was a significant positive correlation between the direct and indirect SoA measures (r = 0.24, p < 0.01). This correlation was the most pronounced with the negative subscale of the direct measure. The correlation between the implicit SoA and the SoNA was moderate-to-strong (r = −.32, p < 0.001). In contrast, the correlation between the implicit SoA and the positive subscale of the direct measure was not significant (r = 0.09) (Table 1).

Table 1: Correlation coefficients between the direct and indirect measures of the SoA in Study 1

Implicit SoA

Explicit SoA SoPA

SoNA

Implicit SoA

0.246 ** 0.097 −0.320

***

0.009 0.307

< .001

Explicit SoA 0.857 *** −0.882

***

< .001 < .001
SoPA −0.513

***

< .001

SoNA

Note. Entries are Pearson’s correlation coefficients(top line) and exact p-values(bottom line).

Implicit SoA: Sense of agency on the indirect measure, Explicit SoA: Sense of agency on the direct measure, SoPA: Self-reported Sense of Positive Agency, SoNA: Self-reported Sense of Negative Agency *p < 0.05, **p < 0.01, ***p < 0.001

Supplementary Analysis

To gain further insight on how the negative subscale of the direct SoA measure related to the interference effect in the indirect measure further analyses were conducted. The mean RTs on the indirect measure were submitted to a mixed ANOVA with schema congruence (congruence vs. incongruence) and prime (me vs. others) as within-subjects factors, and the SoNA scores (low or high based on a median split) as a between-subjects factor. In this analysis, the three-way interaction was significant, F(1, 111) = 15.00, p < 0.001, η2 = 0.11. The means indicated that participants with low scores on the SoNA subscale (i.e., participants high in the SoA) showed an interference effect (Figure 1 for the means). They showed shorter RTs on schema-congruent trials when primed with “Me” rather than “Others”, and larger RTs on schema-incongruent trials when primed with “Me” rather than “Others”. In contrast, participants with high scores on the SoNA subscale (i.e., participants low in the SoA) showed a reverse-interference effect.

fig 1

Figure 1: Means of reaction times in the indirect measure of the SoA as a function of the direct measure (SoNA)

Discussion

In this study, the SoA was measured with a direct and a newly developed indirect measure. The two measures assessed decontextualized SoA, rather than task- or domain-specific SoA. The direct measure was a validated self-report questionnaire. The indirect measure was based on a reaction time-based interference paradigm. There was a significant correlation between the direct and indirect measures of the SoA, consistent with the view that the two measures tap into overlapping processes. An unexpected finding was that the correlation was especially pronounced for the negative subscale of the direct measure. Study 2 aimed to replicate and extend these findings and to examine the relation between direct and indirect measures of the SoA, on one hand, and social desirability, on the other hand.

Study 2

The aim of Study 2 was twofold. The first aim was to replicate findings from Study 1 in an English-speaking sample, rather than a French-speaking sample. The second aim was to extend Study 1 findings by testing the hypothesis that the direct, but not the indirect measure of the SoA is positively related to social desirability. It was predicted that social desirability would moderate the association between direct and indirect measures of the SoA, such that relation between direct and indirect measures would decrease as a function of increasing social desirability. In other words, the direct measure of the SoA should be related to the indirect measure of the SoA only or mainly when social desirability is relatively low.

Method

Participants

A sample of 101 British participants was recruited on the Prolific Academic platform (58 females and 43 males, mean age = 31.48 years, SD = 13.29). The script of the experiment was written in English. There were no sound theoretical reasons to expect differences between the French and the UK sample. This study might thus contribute to extend the generality of Study 1 findings.

The sample size was large enough to provide adequate power (1 – β = 0.80) to detect a correlation in the same direction and as large as the one found in Study 1 (r = 0.246, with α = 0.05). Only UK nationals fluent in English were eligible for the study. Participants received a payment of 2.50£. All participants read and completed a consent form for online research. The study was approved by the Ethical Review Committee for Research of the University of Tours and Poitiers (CER-TP).

Materials

Indirect Measure of the SoA

The indirect measure of the SoA developed in Study 1 was translated into English. The data were cleaned, and the scores on the indirect measure of the SoA were computed as in Study 1 (M = 7.03, SD = 70.91).

Direct Measure of the SoA

The English version of the SoA scale reported in Tapal et al. [6] was used. As in Study 1, the 13 items of the scale were averaged to form a composite score of the explicit SoA (α = 0.70, M = 4.91, SD = 0.768). The means of the two subscales, the SoPA (α = 0.70, M = 4.81, SD = 0.99) and the SoNA (α = 0.70, M = 3.00, SD = 0.95), were also computed.

Social desirability

Social desirability responding was assessed with the Balanced Inventory of Desirable Responding short form (BIDR-16, [43]). This 16-item questionnaire allows to assess two main components of social desirability: self-deceptive enhancement (the tendency to give self-reports that are honest but positively biased) and impression management (deliberate self-presentation to an audience). The 16 items were averaged to form a global score of social desirability responding (α = 0.76, M = 3.96, SD = 0.77). Average scores were also calculated for self-deceptive enhancement (8 items, α = 0.73, M = 3.80, SD = 0.94) and impression management (8 items, α = 0.69, M = 4.12, SD = 0.96).

Procedure

The procedure was highly similar to the one used in Study 1, except that the study was in English and that the participants completed the BIDR-16 scale after the indirect and direct SoA measures.

Results

The SoA scores on the direct measure were normally distributed, W = 0.99, p = 0.70, Skew = − 0.11, SE = 0.24. In this sample, however, the SoA scores on the indirect measure did not follow a normal distribution, W = 0.88, p < 0.001, Skew = 1.30, SE = 0.24. A log transformation was thus applied to the data. However, the p-values and Pearson correlation coefficients were very similar when using the transformed and the non-transformed scores. The findings were also very similar when using Spearman rather than Pearson correlation coefficients. Thus, to be consistent with Study 1 and to avoid redundancy, only the results of Pearson correlation coefficients obtained with the non-transformed scores are reported in what follows.

Replication of Study 1 Findings

Table 2 presents correlations between the direct and indirect SoA measures. As shown in this table, there was a significant positive correlation between the direct and indirect measure of the SoA (r = 0.29, p < 0.005). Also, as in Study 1, the implicit SoA was significantly correlated with the SoNA (r = -.36, p < 0.001), but not with the SoPA (r = 0.08). These results thus replicated findings from Study 1 (Table 2).

Table 2: Correlations between the direct and indirect measures of the SoA and social desirability scores (Study 2)

Implicit SoA

Explicit SoA SoNA SoPA Desirability SDE

IM

Implicit SoA

0.292 ** −0.363 *** 0.080 −0.089 −0.070

−0.076

0.004 < .001 0.438 0.387 0.499

0.461

Explicit SoA

−0.808 *** 0.752 *** 0.228 * 0.241 *

0.130

< .001 < .001 0.022 0.015

0.196

SoNA

−0.220 * −0.124 −0.106

−0.094

0.027 0.218 0.290

0.348

SoPA

0.239 * 0.279 **

0.109

0.016

0.005

0.276

Desirability

0.808 *** 0.815

***

< .001

< .001

SDE

0.318

**

0.001

IM

Note. Entries are Pearson’s correlation coefficients(top line) and exact p-values(bottom line). Implicit SoA: Sense of agency (indirect measure), Explicit SoA: Sense of agency (direct measure), SoPA: Sense of Positive Agency (direct measure), SoNA: Sense of Negative Agency (direct measure), Desirability: Social desirability, SDE: Self-Deceptive Enhancement, IM: Impression Management, *p < 0.05, **p < 0.01, ***p < 0.001

As in Study 1, further analyses were conducted to gain insight on how the negative subscale of the direct measure of the SoA was related to the interference effect in the indirect measure. The mean RTs on the indirect measure were submitted to a mixed ANOVA with schema congruence and prime as within-subjects factors and the SoNA scores (low or high based on a median split) as a between-subjects factor. In this analysis, the three-way interaction was significant, F(1, 94) = 6.26, p = 0.014, η2 = 0.062. The means followed the same pattern as the one found in Study 1.

Relations between SoA and Social Desirability

Another important aim of this study was to examine the correlations between the direct and indirect measures of the SoA and social desirability scores (Table 2). As expected, the indirect measure of the SoA was not related to social desirability scores (all ps > 0.30). In contrast, the direct measure of the SoA was significantly positively correlated with social desirability in general (r = 0.22, p = 0.022), and with self-deceptive enhancement (r = 0.24, p = 0.015), in particular. Further analyses showed, however, that the two subscales of the explicit SoA were differently related to social desirability scores. While the SoNA was not associated with social desirability scores (all ps > 0.20), the SoPA was significantly associated with social desirability (r = 0.24, p = 0.016) in general, and with self-deceptive enhancement (r = 0.27, p = 0.005), in particular.

Finally, the moderation of the relation between direct and indirect measures of the SoA by social desirability was assessed. Implicit SoA was regressed on social desirability, explicit SoA, and the product term between social desirability and explicit SoA. Consistent with a moderation hypothesis, the product term was significant, B = −32.09, SE = 11.15, t = −2.87, p < 0.005. This interaction showed that the relation between explicit and implicit SoA decreased as a function of increasing social desirability (Figure 2 for predicted means). Simple slope analyses confirmed that the relation between explicit and implicit SoA was significant at low level (−1SD) of social desirability, B = 56.99, SE = 12.89, t = 4.41, p < 0.001, but not at high level (+1SD) of social desirability, B = 7.24, SE = 11.84, t = 0.61, p = 0.54.

fig 2

Figure 2: Predicted means of implicit sense of agency

Discussion

In this study, the findings observed in Study 1 were replicated. The direct and indirect measures of the SoA were significantly correlated, and this correlation was larger for the negative than for the positive subscale of the direct measure. Evidence was also found that the direct but not the indirect SoA measure is contaminated by social desirability bias. More particularly, social desirability seems to be positively related to self-reports on the positive subscale of the SoA. Finally, results of moderation analyses confirmed that social desirability suppressed the relation between the direct and indirect SoA measures.

General Discussion

Research and theory in cognitive psychology suggest that the SoA arises from a complex interplay between sensorimotor and cognitive (conceptual) processes [44]. Somewhat surprisingly, however, researchers have consistently failed to find correlations between indirect measures (perceptual tasks) and direct measures (explicit evaluation) of the SoA. This is inconsistent with the view that the explicit judgment of agency is intrinsically linked to the implicit feeling of agency. That being said, research conducted so far has focused on specific experimental tasks, and little was known about the correlation between direct and indirect measures of the SoA in less specific and constrained situations. In the present studies, this issue was directly addressed.

Study 1 relied on a semantic Simon task to measure the SoA at the implicit level, and a self-report scale to assess the SoA at the explicit level. Performance on the indirect task depended on both sensorimotor and semantic processes. While participants were instructed to ignore conceptual information (the meaning of the stimuli) and to focus on perceptual information (the shape of the stimuli), they were unable to do so. More precisely, they showed a facilitation effect when the conceptual information was consistent with their explicit judgment of agency, and an inhibition effect when the conceptual information was inconsistent with their explicit judgment of agency. The higher SoA they reported at the explicit level, the stronger interference (or facilitation) effect they showed in the indirect task. These findings strongly suggest that there is an overlap between conceptual and sensorimotor processes in the experience of agency.

In Study 2, these findings were replicated and significant correlation between social desirability and the direct SoA measure was found. The higher levels of social desirability in general and of self-deceptive enhancement in particular the participants reported, and the higher were their explicit judgments of agency. In addition, social desirability moderated the strength of the association between direct and indirect measures of the SoA. When social desirability was relatively low rather than high, the implicit feeling of agency was strongly linked with the explicit judgment of agency. These findings might contribute to explain why previous studies have failed to find correlations between direct and indirect measures of the SoA. Social desirability can also contribute to explain why in the present studies the SoPA failed to predict the implicit feeling of agency (the indirect measure). As observed in the present research, the two subscales of the explicit measure are differently related to social desirability responding. The SoPA is contaminated by social desirability responding, whereas the SoNA is not (or is less) biased.

Theoretical and Practical Implications

The present findings have a number of theoretical, methodological, and practical implications. From a theoretical perspective, the reported results are in line with the two-step account of the SoA. According to this model, the explicit judgment of agency is a direct consequence of the implicit feeling of agency. Therefore, the two-step account of the SoA would logically predict correlations between direct and indirect measures of the SoA. In line with this model, significant correlations between an indirect measure of the SoA (a reaction time-based interference task), and a direct measure of the SoA (a self-report scale) were found in two studies. Boundary conditions for these correlations were also identified in relation to social desirability concerns. The explicit judgment of agency is more likely to reflect the implicit feeling of agency when social desirability is low, rather than high. Taken together, these findings complement and extend previous findings, and offer a finer-grained analysis of the relation between different aspects of the SoA.

It might be argued that the sematic Simon task overestimates the correlations between the feeling and judgment of agency because it is not a “process pure” task. Indeed, this reaction time interference paradigm, like most other cognitive tasks (e.g., the Stroop task), is not “process pure” [45]. It involves a complex interaction between semantic/conceptual and perceptual/motor processes. However, this does not mean that it fails to capture the implicit feeling of agency. Indeed, behavioral and neuroimaging studies suggest that multiple self-knowledge systems exist (evidence-based and intuition-based, see [46]). The intuitive sense of the self does not require conscious (or deliberate) reflection. Thus, it might be argued that the semantic Simon task is well suited to study the implicit feeling of agency because performance on this task reflects the interference of the automatic activation of intuition-based self-knowledge with perceptual and motor processing.

From a methodological and practical perspective, the present findings have important implications for the assessment of the SoA. Clearly, the simplest way to measure the SoA is to ask direct questions about various aspects of a person’s sense of agency. However, it may not be the best way to measure the SoA because self-reports are sensitive to social desirability responding and self-presentation strategies. Here, it was shown that individuals tend to overestimate their SoA on a direct, self-report scale because of social desirability. The present studies were conducted online, in private and anonymous conditions, which are likely to minimize the problem of social desirability. Social desirability may be an even bigger problem in more ecological conditions (when responses are not anonymous or when they are public). Importantly, however, it was found that the indirect measure of the SoA was free of social desirability bias. The indirect measure showed very good convergent validity with the direct measure, but only when social sociability was low. This suggests that the indirect measure of the SoA should be favored whenever social desirability is a concern.

Limitations

There are a number of limitations of the present studies that deserve to be addressed in future research. First, the indirect measure used in the present work needs to be further validated. The present findings provide evidence for the convergent and discriminant validity of the indirect measure with the direct measure in two languages. However, the discriminant validity of the indirect measure, compared to the direct measure, needs to be further explored. For example, Tapal et al. found a moderate-to-strong correlation between the SoNA subscale and obsessive-compulsive symptoms. In future studies, it would be interesting to examine the respective associations of the direct and indirect measures of the SoA with obsessive-compulsive symptoms. It might contribute to better understand how the SoA is related to clinical disorders.

Another limitation is that there were no behavioral measures in the present studies to test the predictive validity of the indirect measure of the SoA. Further studies are needed to examine the predictive validity of the indirect measure for a variety of criterion outcomes. Interestingly, Huntjens et al. used a similar indirect measure to assess trait self-control and showed that this indirect measure has superior predictive power for spontaneous trait-related behavior (task persistence and delay discounting) than direct self-report measures of self-control. These findings should be taken with caution, as the sample size was quite small in their study. However, Huntjens et al.’s findings clearly suggest that the indirect measure of the SoA has the potential to predict relevant behaviors, and it should be tested in subsequent lab studies.

Conclusion

The clear take-home message of the present work is that implicit SoA can be measured with a decontextualized reaction time interference paradigm in less than 5 minutes. The task is currently available in two languages (French and English) and is free of social desirability bias. The implicit feeling of agency, as measured with this task, is positively related (with moderate-large effect size) to more explicit judgment of agency, but only when social desirability is low. Thus, whenever social desirability is a concern, the indirect measure might provide a better estimate of the SoA than a self-report scale.

References

  1. Haggard P, Chambon V (2012) Sense of agency. Current Biology 22: 390-392.
  2. Synofzik M, Vosgerau G, Voss M (2013) The experience of agency: an interplay between prediction and postdiction. Frontiers in Psychology 4: 127. [crossref]
  3. Moore JW (2016) What is the sense of agency and why does it matter? Frontiers in Psychology 7: 1272. [crossref]
  4. Moore JW,Middleton D, Haggard P, Fletcher PC (2012) Exploring implicit and explicit aspects of sense of agency. Consciousness and Cognition 21: 1748-53. [crossef]
  5. Dewey JA, Knoblich G (2014) Do implicit and explicit measures of the sense of agency measure the same thing? PloS One 9: e110118.
  6. Tapal A,Oren E, Dar R, Eitam B.(2017) The sense of agency scale: A measure of consciously perceived control over one’s mind, body, and the immediate environment. Frontiers in Psychology 8: 1552. [crossref]
  7. Merrick S.(1995) Validity of psychological asessment: validation of inferences from persons’ responses and performances as scientific inquiry into score meaning. Am Psychologist 50: 741.
  8. Gawronski B, LeBel EP, Peters KR (2007) What do implicit measures tell us?: Scrutinizing the validity of three common assumptions. Perspectives on Psychological Science 2: 181-93. [crossref]
  9. Haggard P, Clark S, Kalogeras J (2002) Voluntary action and conscious awareness. Nature Neuroscience 5: 382-5.
  10. Desantis A, Weiss C, Schütz-Bosbach S, Waszak F (2012) Believing and perceiving: authorship belief modulates sensory attenuation. PLoS One 7: e37959. [crossref]
  11. Blakemore SJ, Wolpert DM, Frith CD (1998) Central cancellation of self-produced tickle sensation. Nature Neuroscience 1: 635-40. [crossref]
  12. Blakemore SJ, Frith CD, Wolpert DM (1999) Spatio-temporal prediction modulates the perception of self-produced stimuli. Journal of Cognitive Neuroscience 11: 551-9. [crossref]
  13. Weiss C, Herwig A, Schütz-Bosbach S (2011) The self in action effects: selective attenuation of self-generated sounds. Cognition 121: 207-18. [crossref]
  14. Reznik D, Henkin Y, Levy O, Mukamel R (2015) Perceived loudness of self-generated sounds is differentially modified by expected sound intensity. PloS One 10: e0127651. [crossref]
  15. Gentsch A, Schütz-Bosbach S (2011) I did it: unconscious expectation of sensory consequences modulates the experience of self-agency and its functional signature. Journal of Cognitive Neuroscience 23: 3817-28. [crossref]
  16. Engbert K, Wohlschläger A, Haggard P (2008) Who is causing what? The sense of agency is relational and efferent-triggered. Cognition 107: 693-704. [crossref]
  17. Desantis A, Roussel C, Waszak F (2011) On the influence of causal beliefs on the feeling of agency. Consciousness and Cognition 20: 1211-20.
  18. Haering C, Kiesel A (2012) Mine is earlier than yours: Causal beliefs influence the perceived time of action effects. Frontiers in Psychology 3: 393. [crossref]
  19. Moore JW, Dickinson A, Fletcher PC (2011) Sense of agency, associative learning, and schizotypy. Consciousness and Cognition 20: 792-800. [crossref]
  20. Moore JW, Wegner DM, Haggard P (2009) Modulating the sense of agency with external cues. Consciousness and Cognition 18: 1056-64. [crossref]
  21. Synofzik M, Vosgerau G, Newen A (2008) Beyond the comparator model: a multifactorial two-step account of agency. Consciousness and Cognition 17: 219-39.
  22. Wegner DM, Wheatley T (1999) Apparent mental causation: Sources of the experience of will. American Psychologist 54: 480. [crossref]
  23. Aarts H, Custers R, Wegner DM (2005) On the inference of personal authorship: Enhancing experienced agency by priming effect information. Consciousness and Cognition 14: 439-58.
  24. Dewey JA, Carr TH (2013) When dyads act in parallel, a sense of agency for the auditory consequences depends on the order of the actions. Consciousness and Cognition 22: 155-66. [crossref]
  25. Frith C (2013) The psychology of volition. Experimental Brain Research 229: 289-99. [crossref]
  26. Sato A, Yasuda A (2005) Illusion of sense of self-agency: discrepancy between the predicted and actual sensory consequences of actions modulates the sense of self-agency, but not the sense of self-ownership. Cognition 94: 241-55.
  27. Hurault JC, Broc G, Crône L, Tedesco A, Brunel L (2020) Measuring the Sense of Agency: A French Adaptation and Validation of the Sense of Agency Scale (F-SoAS). Frontiers in Psychology 11. [crossref]
  28. Wegner DM (2002) The illusion of conscious will. MIT press.
  29. Wegner DM (2003) The mind’s best trick: How we experience conscious will. Trends in Cognitive Sciences 7: 65-9. [crossref]
  30. Aarts H, Custers R, Marien H (2009) Priming and authorship ascription: When nonconscious goals turn into conscious experiences of self-agency. Journal of Personality and Social Psychology 96: 967. [crossref]
  31. Dijksterhuis A, Preston J, Wegner DM, Aarts H (2008) Effects of subliminal priming of self and God on self-attribution of authorship for events. Journal of Experimental Social Psychology 44: 2-9.
  32. Wenke D, Fleming SM, Haggard P (2010) Subliminal priming of actions influences sense of control over effects of action. Cognition 115: 26-38.
  33. De Houwer JD (2014) A propositional model of implicit evaluation. Social and Personality Psychology Compass 8: 342-53.
  34. Paulhus DL (1984) Two-component models of socially desirable responding. Journal of Personality and Social Psychology 46: 598.
  35. Paulhus DL, Reid DB (1991) Enhancement and denial in socially desirable responding. Journal of Personality and Social Psychology 60: 307.
  36. Anderson JR (2019) The moderating role of socially desirable responding in implicit–explicit attitudes toward asylum seekers. International Journal of Psychology 54: 1-7. [crossref]
  37. Gamberini L, Spagnolli A, Corradi N, Sartori G, Ghirardi V etal.(2014) Combining implicit and explicit techniques to reveal social desirability bias in electricity conservation self-reports. Energy Efficiency 7: 923-35.
  38. Nosek BA (2005) Moderators of the relationship between implicit and explicit evaluation. Journal of Experimental Psychology: General 134: 565.
  39. Riketta M (2005) Gender and socially desirable responding as moderators of the correlation between implicit and explicit self-esteem. Current Research in Social Psychology 11: 14-28.
  40. Huntjens RJ, Rijkeboer MM, Krakau A, de Jong PJ (2014) Implicit versus explicit measures of self-concept of self-control and their differential predictive power for spontaneous trait-relevant behaviors. Journal of Behavior Therapy and Experimental Psychiatry 45: 1-7. [crossref]
  41. Weertman A, Arntz A, de Jong PJ, Rinck M (2008) Implicit self-and other-associations in obsessive-compulsive personality disorder traits. Cognition and Emotion 22: 1253-75.
  42. De Houwer J (1998) The semantic Simon effect. The Quarterly Journal of Experimental Psychology Section A 51: 683-8.
  43. Hart CM, Ritchie TD, Hepper EG, Gebauer JE (2015) The balanced inventory of desirable responding short form (BIDR-16). Sage Open 5: 2158244015621113.
  44. Jeunet C, Albert L, Argelaguet F, Lécuyer A (2018) “Do you feel in control?”: towards novel approaches to characterise, manipulate and measure the sense of agency in virtual environments. IEEE Transactions on Visualization and Computer Graphics 24: 1486-1495. [crossref]
  45. Sörqvist P (2014) On interpretation and task selection in studies on the effects of noise on cognitive performance. Frontiers in Psychology 5: 1249. [crossref]
  46. Lieberman MD, Jarcho JM, Satpute AB (2004) Evidence-based and intuition-based self-knowledge: an FMRI study. Journal of Personality and Social Psychology 87: 421. [crossref]
fig 2

Anergy in COVID-19 Infected and COVID-19 vaccinee

DOI: 10.31038/JIPC.2022213

Abstract

Reduced immune reactivity RIR has been documented in some phases of sars-cov-2 infected and vaccinee. RIR attributed to; anergy, tolerance, exhaustion and hypo-activity. The present opinion was an at glance review of anergy in COVID-19 infected and COVID vaccinee. Anergy has gross organ system presentation and cellular basis. Lymphocyte anergy and lymphocyte exhaustion are associated with changes in genetic landscape, epigenetic control and metabolic reprograming. Anergic B cells are found of multiple phenotypes and some of which associated with COVID-19 vaccine boost anergy as that found in Indian health care workers. Both CD4+ and CD8+ T cells were associated with immune protection among COVID infected and vaccinee. CD4+ anergy and CD8+ exhaustion [Though some debate] were reported in covid vaccinee.

Keywords

Anergy, COVID-19, Exhaustion, Hypo-function, Infected, Vaccine

Introduction

The immune system ensemble in human being living in continuum with his own ecologic niche may express three immune-biological phases as; normogy, allergy and anergy [1-5]. This came in accordance with normal, abnormal and subnormal functioning immune system. Three descriptive concepts are known in evaluation of this subnormal functioning immune system. Though they are being not well demarcated. Exhausted, tolerant and anergic immune cells are actually allied but not identical and may be overlapping both in sense and use [2-6]. The present opinion stands as an attempt to visualize the immunobiology of lymphocyte anergy and to pinpoint the role of anergy in COVID-19 infection and COVID-19 vaccination.

Reduced Immune Reactivity

Normogy is a state of normal functioning human immune system. Allergy is a condition of hyper-functioning immune system towards certain exo- or endogenous materials, the allergens. While anergy is a state of reduced or hypo-functioning immune system in presence of certain antigens within the continuum of the immune cells niche. Anergy is one of the processes that induce tolerance and modify immune cells to in order to prevent self –destruction [1-6]. Allied to anergy are; clonal deletion, immune regulation and immune cell exhaustion, Figures 1 and 2. These allied reduced immune reactivity concepts can be delineated on the bases of three related, none-identical but overlapping senses which are identity, cause and function, the convergence strategy. Exhaustion can be defined on the bases of the aforementioned concepts, as that cells when exposed to chronic high, antigen exposure, are activated and proliferated before becoming dysfunctional. The first is that cell is evident in absence of effector response. Second is that cell that are produced in presence of a given cause like exposure to an antigen and the third is that cell presenting same molecular marker of death the programmed cell death protein-1 (PD-1) [2]. In this opinion reduced immune cell function was defined and anergic cells were visualized, their potential role played in COVID-19 was mapped.

fig 1

Figure 1: Effectors of lymphocyte hypo-function

fig 2

Figure 2: The Allied forms of lymphocyte Hypo-function

Cellular Basis of Anergy

Anergy in practice have two identifying facets. First, the reduced or absent gross clinical presentation and second the reduced or absent cellular functions. Herein, the study concerned with the cellular facets. The anergy is mainly tackled in lymphocytes [7-12] though there was report on anergy in basophils [13].

Mechanisms For Induction of Anergy In Lymphocytes

The target deletion in immune repose genes are associated with hyper-proliferation of T or B lymphocytes, frank autoimmune disease. These immune suppression genes represents the negative regulators that suppress self – reacting ability by enforcing negative selection in thymus for T cells and in bone marrow for B cells. The expression of these genes interferes with generation and/or function of regulatory T cells, altering signaling through T or B cells antigen receptors or promote apoptosis of peripheral T or B cells these two immune events outcomes with either T or B cell anergy. Such lymphocyte anergy might represent default genetic program, globally imposed on either mentioned lymphocyte types by low-level intracellular calcium influx occurring in response to recognition of self- antigen [6,8,13,14].

Mechanism of B cell Anergy

Yarkoni and associates [15] and Waterman and Cambier [12] have been thoroughly reviewing the multiple possible mechanisms for induction of B cell anergy. Going through these reviews, a hypothesis was arise from a collective viewing to the presented facts that may unify the mentioned mechanisms and was phrased as in the following;

  1. B cell face chronic antigen stimulation
  2. Surface immunoglobulin undergoes re –arrangement.
  3. Blockade of the second transducing signal.
  4. Notable Intracellular collective biochemical changes
  5. Activation of anergy specific gene circuit expression
  6. Genetic reprograming as a default genetic program
  7. Metabolic reprograming.

Mechanisms for Induction of Anergy In T cells

The induction of T cell anergy was based on the work of Valdor and Macian [7,16] and depicted in the following steps;

  1. Engagement of TCR and CD28.
  2. Free intracellular Ca influx.
  3. Activation of transcription factors
  4. NFAT form complex with AP1 with AP-1 inactivation
  5. NFAT direct the expression of anergy inducing genes.
  6. Expression of anergy inducing genes.

Mechanisms of induction of Exhaustion in T cells

Rha and Shin [17] were briefing the features of exhausted T cells which may in some way explained the mechanisms of induction of exhaustion in T cells, and were depicted in the followings

  1. Loss of effector function
  2. Sustained expression of inhibitory receptors
  3. Alteration in genetic and epigenetic landscape.
  4. Metabolic reprograming

B Cell Anergy

Anergic B cells are characterized by; Low surface IgM, normal surface IgD levels with reduction in their functional capacity. Reduced life span in absence of T cell help, inhibition of second signal transduction so that B cell does not release calcium as a critical pathway in activation of B cells. Anergic B cell undergoes change in migration patterns and distinctive recirculation fashion through lymphoid system as compared to normal functioning B cells. Normal B cells becomes anergic upon chronic exposure to self- antigen and reactivated to normal state by the expression to CD40 ligand in presence of IL4 (Table 1) [18].

Table 1: Comparative view to the immunobiologic features of anergic and exhausted lymphocytes as compared to normal

Features

Normal B cells Anergic B cell [10] Normal T cell Anergic T cell [7,8,14]

Exhausted T cell [17]

Origin and migration Bone marrow, peripheral lymphoid tissues Bone marrow, peripheral lymphoid tissue Bone Marrow, Thymus Bone Marrow, thymus Bone marrow, thymus
Developmental stage on migration for maturation Mature, bone marrow Mature, bone marrow Immature, thymus Immature, thymus Immature, Thymus
Surface Markers CD19, CD20, CD22, CD5, CD35, BCR, B7 IgD, CD10, CD24, CD36, CD9 TCR, CD2, CD3, CD28, CD5, CD7, CD45, CD4 or CD8 TCR and CD28 engagement CD28, CD5, CD2, CD3, CD5, CD7, CD45, CD8
Signaling Two signals Stimulatory Two signals Stimulatory Two signals
Anergy/phenotypic changes Down-regulation of IgM, antigen irresponsive Inhibition of cytokine production, Irresponsive to antigen
Exhaustion phenotypic changes PD-1, TIM-3, LAG-3, CTLA-4, TIGIT, Markers & Expression of exhaust associated genes
Reactivation BAFF, TLR, INF gamma, CD40L with IL4 Fas and Bcl-2 proteins In-vivo patient recovery

Auto-reactive B cells not controlled by receptor editing or clonal deletion may become anergic. Mature human B cell subsets that are naturally auto-reactive and controlled by the tolerizing mechanisms are those of functional anergy [9].

In healthy human IgMlo phenotypes are characterized by the absence of activation markersCD69,CD86and CD95,reduced expression of co-stimulatory molecules CD19 and CD21 with an evident inhibition levels of CD22. Therein the major fractions of mature B cell have a reversible anergic phenotypes determined impart by a down-regulation of sIgM that appears to determine a higher threshold for their activation through BCR [whether IgM or IgD] [10].

IgM but not IgD is down-regulated on auto-reactive B cells. IgD is less sensitive than IgM to endogenous antigens in-vivo. So the decision for the B cell developmental fate are shifted accordingly. The role of B cell surface IgD is in maintaining the quiescence of their auto-reactivity and restoring their differentiation into antibody secreting cells [11].

Clonal anergy was proposed as a way for inactivation of B cells stimulated early in their developmental phases when only auto-antigen would be present Anergic B cells are naïve-like B cells identified by the down-regulation of the complement -2 cell surface receptor (CD21) [10]. Though, the human anergic B cells are quite divergent and of multiple phenotypic forms [19].

There are about 2.5%-30% of human peripheral CD27- B cells are auto-reactive and anergic based on un-responsiveness to antigen-receptor BCR stimulation and auto-reactivity of cloned and expressed BCR. Human anergy is maintained by elevated expression of PTEN [a phosphatidylinositol 3 4 5 P-3- phosphatase],Reduction in expression of micro-RNA coding PTEN was associated with up-regulation PTEN and anergy in B cells (Table 1) [20].

Functions of Anergic B Cells

Rosenspire and Chen [6] deduced four main functions of anergic B lymphocytes in human welfare as:

  1. In healthy individuals it is found inactive and self -reactive.
  2. In autoimmune conditions, activated B cells found binding to self- antigenic epitopes.
  3. In state of infection with microbe bearing self- mimicking epitope, anergic cell found binding to cross-reacting epitope of the microbe.
  4. In fulminant Infection conditions, TLR signaling synergize with the anergic B cells allowing them to transition from the anergic cell pool, this in turn will lead to expression of active B cells which recognize host mimicking epitope on the pathogen as well as antigens on the host.

T Cell Anergy

Anergy in T cells is a state of growth arrest designed to reduce their proliferation during T cell immune responses. Failure of normal naïve T cell to establish the second signal transduction due to any cause will lead to T cell anergy state. The T cell anergy inducers are; peptide-MHc occupation, cross-link with concavalin A in absence of APC, binding with anti-CD3 mAb. Anergic T cells showed reduced IL2 to 25 to 50 folds lower than normal T cells and inhibition of CD40 ligand (Table 1) [21].

T cell anergy is a tolerance mechanism in which the lymphocyte is intrinsically functionally inactive following an antigen encounter but remain alive for an extended period of time in an hypo-responsive state. Two model explanations have been held for CD4 and CD8 T cells. First was the clonal anergy which principally growth arrest arise from an incomplete T cell activation. The second was the in-vivo anergy which represent more generalized inhibition of proliferation and effector function due to naïve T cell stimulated by deficient co-stimulation. Both of clonal anergy and in-vivo anergy are found in T reg. subsets [22].

T cell anergy is induced in previously activated T cells or cell clones by re-stimulation through T cell receptor TCR in absence of co-stimulating signal. Such anergic cells were found to be of reduced calcium flux, expression of protein enriched specifically by anergic program to induce T cell anergy. The induction ability of anergy in T cells depends on the intracellular assembly of E3 ubiquitin ligase activity [23].

Among a number of mechanisms that coevolved to control the adaptive immunity is the anergy. Which is the functional inactivation of T lymphocyte that responds to antigens in absence of inflammation. There found to be an intracellular protein in quiescent T cell that function to integrate signals for antigens co-stimulation and growth factor receptors. These factors ensure that all cells that fail to engage them from all the three pathways are shunted into alternative transcriptional program designed to dissuade them from participating in the subsequent immune response. Anergy is a combine result of factors that negatively regulate with a program of active transcriptional silencing that reinforced through epigenetic mechanisms [24].

One mechanism that is in place to control the activation of mature T cells that bears self- reactive antigen receptor is anergy, a long term state of hypo-responsiveness that establish T cell in response to sub-optimal antigen re-stimulation. T cell receive signals not only from antigen recognition and co-stimulation but also from other sources including cytokine receptor, inhibitory receptor or metabolic sensors. Under conditions that induce anergy, T cells activate program of gene expression that lead to the production of protein that block T cell receptor signaling and inhibit cytokine gene expression [8].

T cell anergy is already present in non-ventilated COVID-19 patients and strongly associated with virus persistence and reversible with clinical recovery [25].

Functions of T cell Anergy

T cell anergy may have the biological potentials to function in several immune conditions [7,14,25-28];

  1. Silence the auto-reactive T cells, so that in absence of such slience provoke marked autoimmune condition [7,14].
  2. Silence the allergenic reactions post-allergen vaccination [7,28]
  3. The developmental path of T cell anergy phases may serve potential target of pharmaceutical interventions [7].
  4. Serve as a pathognomic marker for viral persistence in severe viral infections including COVID-19 [25].
  5. Share part with T reg, functions in regulation of an aberrant immune responses [7].

Exhausted T Cells

It is a T cell that express hypo-functioning as well as reversible functional mode. Current information have develop a number of characteristics for this T cell functional form. Though its phenotype referred to as CD8+ T cells. Exhausted T cells have shown to be with; loss of effector function, alteration in the transcriptional and epigenetic landscape and metabolic reprograming. The presence of these cells in COVID-19 vaccine is contra-versial [17].

Anergy in Normal Human Being

Like the state of normal human being in whom there are percentages of auto-reactive cells and autoantibodies that represent the baseline levels of normal physiological autoimmune reactions [29-33]. There are normal levels of anergic immune cells like anergic B, anergic T and anergic myeloid cells [9].

Anergy in Sars-Cov-2 Human Infections

Both B and T cell immunity are involved in sars-cov-2 human infections. B cell produce Sars-cov-2 specific antibodies and T cells produce a spectrum of cytokines that take a role in the pathogenesis and immune-pathogenesis of sars-cov-2 infections. CD4 T cells helps B cells in production of antibodies. CD8+ T cells kills virus infected cells. T cells interferon gamma controls viral infection. Lymphopenia is evident in sars-cov-2 infection affecting CD4+,CD8+ and B cells. T cell responses in severe COVID infection forms may be over-activated, impaired or inappropriate. Post infection immunity yield memory B, memory CD4 and memory CD8 phenotypes [1]. Severe fatal sars-cov-2 infections in man showed a spectrum of immune responses that involve three phases; i-normal or hypo-immune, ii-hyper-activation and iii-Anergy [5]. COVID-19 infectious epidemic pneumonia is associated with; i-hyper-inflammation and ii- clear lymphocyte hypo-function that are mainly noted in hospitalized severe infection needing ventilation and associated with viral persistence [25]. Thus severe cod-19 infection is presenting both lymphopenia and lymphocyte hypo-function or anergy.

Anergy versus Antigens

Immune tolerance is either central genetic or peripheral, acquired. It can be of low or high dose tolerance depending on the toleragen dose, exposure frequency and continual coexistence facing the immune cells. On the absence of the antigen cells becomes reactive normal. Anergy need continual exposure of lymphocytes to the antigen which impacts the phenotypic, the migration behavior and the function. Regulatory T cell may function both in tolerance and anergy [26,27]. Vaccine for allergy in post-vaccination period may influence anergy in immune cells [28].

Anergy and Sars-Cov-2 Antigens

Sars cov-2 virus have an array of antigens; like spike, neucleo-capsed membranous as well as nonstructural protein [Grifoni et al. [29], Le Bert et al. [30]. This virus appeared to have super-antigen, super-antigen like and/or super-antigen trigger host cytokine storm, lymphocyte differentiation, lymphocyte apoptosis, anergy and autoimmunity [31].

The order of sars-cov-2 antigen exposure determine the nature of the immune response. Since it impacts the distribution between spike specific and non-spike specific responses. Thus the exposure history shapes phenotype and specificity of memory T cells [32].

Life Extreme and Vaccines

Life extremes are childhood and senescence. Ageing as life extreme impacts human immune system mainly as brook of immune tolerance, appearance of autoimmune reactions and reduction of other immune functions as; Decreased phagocytic activity, disturbed processing and presentation of antigens, decrease in functionality of innate and adaptive immune system, impaired responses to microbial vaccines in general and to sars-cov-2 vaccine. Low NK function, poor priming of T cells. B cell produces non-protective antibodies. These impacts may make aged subject vulnerable to respiratory infection and pneumonia [4].

Anergy versus COVID-19 Vaccines

In a population of 205 health care workers that were elected in Jan 2021. They were enrolled in a covisheild vaccine [same as ChAdOxl] vaccine. Vaccinated subjects were subjected to blood collection at the day14 and 28 after the first shot and three months after the second shot. Non-responder rate was 35:205 17% at the day 14 and 5;205 2% at the day 28. At the second dose all vaccinated were responders with 17 fold increase in anti-spike protein antibodies. Non-responder rates were higher in male and senior citizens. A 1.5 folds decrease in ASSA titers in the previously exposed. Thus, vaccination in non-exposed express prime-boost effects and in previously exposed express boost anergy effects [33,34]. Continual exposure to COVID vaccine induced anergy.

Vaccination after infection leads to expansion of spike specific T cell and differentiation of CCR-CD 4RA+ effector. In contrast Individuals after break through infection mount vigorous non-spike specific responses and diversify the T cell memory repertoire. Current vaccination protocols continue to expand and differentiate spike specific memory [32].

Conclusion

Reduction of immune reactivity of lymphocytes may be attributed to hypo-function, tolerance, exhaustion or anergy. Genetic versus epigenetic change, loss of function, identity, cause and function may be a helpful parameters for evaluation of these cell entities. Anergy influence change in phenotype, migration behavior and function of lymphocyte. Anergic lymphocytes were noted in; normal, chronic infected and vaccinated. Chronic viral infections and viral vaccination forms an insult for initiation of anergy. Post vaccination by viral vaccines and allegen vaccines can be terminate by anergic lymphocytes. Since continual antigen exposure to lymphocytes is one of the known ways for induction of anergic state in lymphocytes. One of the possible potentials of anergic cell is to silence auto-reactive cells and mediators. COVID-19 vaccination in exposed health care workers lead to boost anergy.

References

  1. Puddemann A, Aranson (2020) what is the role of T cells in covid-19 infection. why immunity is about more than antibodies. Oxford Covid-19 evidence team, Centre for evidence based medicine, Nuffield Department of Primary Care Health Sciences, University of Oxford. Oct.19.2020.
  2. Kaminski H, Lemone M, Paradeu T (2021) Immunological exhaustion; How to make a disparate concept operational? Plos Pathogen 17: e1009892. [crossref]
  3. Goldman M, Hermans C (2021) Thrombotic thrombocytopenia associated with covid-19 infection or vaccination; Possible to platelet factor 4 autoimmunity. Plos Medcine 18: 1003648. [crossref]
  4. Andryelkov BG, Besednova N (2021) Older adults: Panoramic view on covid-19 vaccination. Pub Hlth 8: 388-415. [crossref]
  5. Zhou X, Ye Q (2021) Cellular Immune responses to covid-19 and potential modulators. Front Immunol 12: 646333. [crossref]
  6. Rosenspire AJ, Chen K (2015) B cells precarious on call warriors at the nexus of autoimmunity and false flagged pathogens. Front Immunol 6: 580. [crossref]
  7. Valdor R, Macian F (2010) Mechanisms of Self inactivation in anergic T cells. Immunologia 29: 20-33.
  8. Valdor R, Macian F (2013) Induction and stability of anergic phenotype in T cells. Sem Immunol 25: 313-320. [crossref]
  9. Duty JA, Szodoray P, Zheng NY, Koelsch KA, Zhang Q, Swiatkowski M, et al. (2008) Functional anergy in subpopulation of naïve B cells from healthy human that express auto-reactive immunoglobulin receptor. J Exp Med 206: 139-151. [crossref]
  10. Quach TD (2010) human anergic B cells: IgMlo. PhD thesis. School of Medicine and Dentistry, University of Rochester, New York.
  11. Noviski M, Mueller JL, Satterwaite A, Sinha LAG, BromBacher F, et al. (2018) IgM and IgD B cell receptors functionally respond to endogenous antigen and control B cell fate. eLife 7: 35074. [crossref]
  12. Waterman PM, Cambier JC (2010) The conundrum of inhibitory signaling by ITAM containing immune-receptors: Potential molecular mechanisms. FEBS Letters 584: 4878-4882. [crossref]
  13. Ma A, Patil G, Lund K et al. (2012) Antigen induced anergy in human Basophils is not antigen specific. J Allergy Clin Immunol 129: AB123.
  14. Macian F, Im SH, Gavacia-Cozar FJ, et al. (2004) T cell anergy. Cur Opin Immunol 16: 209-216.
  15. Yarkoni Y, Getahun A, Cambier JC (2010) Molecular underpinning of B cell anergy. Immunol Rev 237: 249-253. [crossref]
  16. Belanti J A(ed) (2012) Immunology IV: Clinical application in health and disease, Distruption of co-stimulatory signal and anergy. Care Press. MD. Immunopedia.Org.Za.
  17. Rha MS, Shin EC (2021) Activation or exhaustion of CD8+ T cells in patients with covid-19. Cellular Mol Immunol 18: 2325-2333. [crossref]
  18. Tartinton DM (1998) Anergy B cells, Delves PJ, Roitt IM(ed.). Encyclopedia of Immunology 2nd London. Academic Press 105-108.
  19. Andrews SF, Wilson PC (2010) The anergic B cells. Blood 115: 4976-4977.
  20. Smith MJ, Ford MR, Rihanek M, Coleman BM, Getahun A, et al. (2019) Elevated PTEN expression maintain anergy in human B cells and reavels unexpectedly high repertoire autoreactivity. JCI Insight 4: 123384. [crossref]
  21. Shwartz RH (1998) Anergy T cells, Delves and Roitt IM eds. Encyclopedia of Immunology, 2nd London, Academic Press 109-111.
  22. Shwartz RH (2003) T cell anergy. Ann Rev Immunol 21: 305-334. [crossref]
  23. Fathman CG, Lineberry NB (2007) Molecular mechanisms of CD4+ T cell anergy. Nat Rev Immunol 7: 599-609. [crossref]
  24. Wells AD (2009) New insight into molecular basis of T cell anergy, factors, avoidance, sensors and epigenetic imprinting. J Immunol 182: 7331-7341. [crossref]
  25. Renner K, Schwittay T, Chaabane S (2021) Severe T cell hypoactivity in ventilated covid-19 patients correlate with roploged virus persistence and poor outcomes. Nat Immunol 12: 3006. [crossref]
  26. Tolar P, Sohn HW, Pierce SK (2005) The initiation of antigen induced B cell receptor signaling viewed in living cells by fluorescence resonance energy transfer. Nat Immunol 6: 1168-1176. [crossref]
  27. Gauld SB, Benschop RJ, Merrell KT, Cambier JC (2005) Maintainence of B cell anergy requires constant antigen receptor occupancy and signaling. Nat Immunol 6: 1160-1167. [crossref]
  28. Cao Y, Yang M, Luo Z, Monapatra SS (1997) Vaccination with multi-epitope recombinant allergen induce deviation via T cell anergy. Immunol 90: 46-51. [crossref]
  29. Grifoni A, Weiskopf D, Ramirez SI (2020) Target T cell responses to sars-cov-2 coronavirus in human with covid-19 disease unexposed individual. Cell 181: 1489-1501. [crossref]
  30. Lebert N, Tan AT, Kabasegaran K, Tham CYL, Hafezi M, et al. (2020) Sars-cov-2 T cell immunity in cases of covid-19 and sars and un-infected controls. Nature 484: 457-462. [crossref]
  31. Hamdy A, Leonardi A (2022) Superantigens and sars-cov-2. Pathogens 11: 390. [crossref]
  32. Minervina AA, Pogorely MV, Kirk AM, et al. (2022) Sars-co-2 antigen exposure history shape phenotypes and specificity of memory CD8+ T cells. Nat Immunol 597: 268-273.
  33. Shnawa IMS (2022) Post-infection-post-vaccination autoimmune neural long covid. J Pharmaceutical Res Inter 34: 1-7.
  34. Kannian P et al (2022) Booster and anergic effects of covishield vaccine among health care workers in south India. medRxiv. a license to display pre-print in perpetuating. It is made available under a CC-By4.0, international licensed.
fig 4

Treatment of Hydrophobic Poly Aromatic Hydrocarbons and Toxicity Using GO-TiO2-Sr(OH)2/ SrCO3 Nanocomposite via Photocatalysis

DOI: 10.31038/NAMS.2022512

Abstract

The effects of increasing sun light irradiaiton time (30 min, 120 min, 240 and-360 min), increasing photocatalytic power (10 W, 50 and 100 W), increasing graphene oxide (GO) nanoparticle concentrations (2 mg/l, 4 and 8 mg/l), increasing titanium dioxide (TiO2) nanoparticle concentrations (1 mg/l, 3 mg/l, 6 and 9 mg/l), increasing GO-TiO2-Sr(OH)2/SrCO3 nanocomposite concentrations (1 mg/l, 2 and 4 mg/l) on the destructions of four hydrophobic polycyclic aromatic hydrocarbons (PAHs) in a real petrochemical industry wastewater in Izmir (Turkey) were investigated. The yields in more hydrophobic PAHs with high benzene rings [benzo[a]pyrene (BaP) and benzo[k]fluoranthene (BkF)] were as high as the less hydrophobic PAHs with lower benzene rings [acenaphthylene (ACL) and carbazole (CRB)] at pH = 7.0, at 22°C after 360 min sun light irradiation time. Maximum 97% ACL, 98%CRB, 98%BaP and 99%BkF PAHs removals was detected at 4 mg/l GO-TiO2-Sr(OH)2/SrCO3 nanocomposite concentration, under sun light intensity = 100 mW/cm2, at photocatalytic power = 100 W, at sun light irradiation time = 360 min, at pH = 7.0 and at 22°C, respectively. The effective PAHs concentrations caused 50% mortality in Daphnia magna cells increased from initial EC50 = 342.56 ng/ml to EC50 = 631.05 ng/ml, at pH = 7.0 and at 22°C after 360 min photocatalytic degradation time resulting in a maximum acute toxicity removal of 99.99% at GO-TiO2-Sr(OH)2/SrCO3 nanocompoasite concentration of 4 mg/l. The Daphnia magna acute toxicity was significantly reduced.

Keywords

Daphnia magna acute toxicity, Graphene oxide, GO-TiO2-Sr(OH)2/SrCO3 nanocomposite, Petrochemical industry wastewater, Photocatalytic degradation, Polycyclic aromatic hydrocarbons, titanium dioxide

Introduction

Polycyclic aromatic hydrocarbons (PAHs) are an important class of persistent organic pollutants (POPs), and have been ubiquitously found in the environment [1]. Besides the natural sources, PAHs are often from anthropogenic sources such as incomplete combustion of fossil fuels, and accidental spillages of crude and refined oils [2,3]. Due to their persistence and potential harmful impact on the ecosystem and human health, PAHs have been classified as priority pollutants by the United States Environmental Protection Agency (USEPA) [4].

Wastewater treatment plants, especially those serving industrial areas, consistently receive complex mixtures containing a wide variety of organic pollutants. Groups of compounds present in the petrochemical industries include polycyclic aromatic hydrocarbons (PAHs), which are listed as US-EPA and EU priority pollutants, and concentrations of these pollutants therefore need to be controlled in treated wastewater effluents [5]. PAHs are ubiquitous environmental pollutants with mutagenic properties, which have not been included in the Turkish guidelines for treated waste monitoring programs [6]. Several hydroxy-PAHs such as hydroxylated derivatives of Benzo[a]pyrene (BaP) and Chrysene (CHR) have been shown to possess estrogenic activity and cause damage to DNA leading to cancer and possibly other effects [7]. As a consequence of their strongly hydrophobic properties and their resistance to biodegradation, PAHs are not always quantitatively removed from wastewaters by activated sludge treatments, which very efficiently relocate them into treated effluents.

Titanium dioxide (TiO2) is the most used photocatalyst due to its environment friendliness, abundant supply and cost-effectiveness [8]. However, due to the wide bandgap (3.2 eV for anatase and 3.0 eV for rutile) [9], TiO2 can only be excited in the ultraviolet (UV) range, which accounts for only 4% of the solar radiation [10]. Therefore, various efforts have been attempted to extend the utilization of TiO2 to the visible light range (>40% of the solar energy), such as metal/non-metal doping, noble metal deposition, semiconductors coupling, and photosensitization [11,12].

Graphene is a flat monolayer of carbon atoms tightly packed into a two-dimensional honeycomb lattice. In recent years, graphene has attracted a great deal of attentions for its potential applications in many fields, such as nano-electronics, fuel-cell technology, supercapacitors, and catalysts [13,14]. Graphene oxide (GO) is one of the most important precursors of graphene, and thus, they share similar sheet structures and properties such as high stability and semiconducting characteristics [15]. GO can enhance the light absorption via expanding the photoresponsive range to visible light and suppress the charge recombination by serving as a photo-generated electron transmitter, when coupled with TiO2. To further enhance the conductivity and reduce the bandgap, noble metals (e.g., gold, palladium and platinum) are often incorporated to the GO-TiO2 nanocomposite by surface deposition [16].

Compared with noble metals, strontium (Sr), as an alkaline earth metal, has much wider and richer sources, and it is the 15th most abundant element in the Earth’s crust with an estimated abundance of nearly 360 mg/l [17]. Sr has been widely employed as a dopant for various semiconductors (e.g., TiO2, zinc oxide and germanium dioxide) to enhance the photocatalytic activities [18]. Moreover, the OH and carbonate forms of Sr (Sr(OH)2/SrCO3) have been reported to have high photocatalytic activity under visible-light irradiation [19-21].

The reactive oxygen species (ROS) formed during TiO2 photocatalysis include the hydroxyl radical (OH), superoxide anion radical (O2-●), hydroperoxyl radical (HO2), singlet oxygen (1O2), and their subsequent reactions with the target contaminants occur at or very near the TiO2 surface [22]. OH radicals, generated on the surface of the catalyst following oxidation of water from the positive holes of TiO2, are non-selective oxidizing species with strong oxidation potential (2.80 V) that rapidly react with most organic compounds with rate constants in the order of 106-1010 1/M.s [23]. Various studies have investigated the degradation of MC-LR in pure solutions or crude extracts with TiO2 photocatalysis to study the effect of specific water quality parameters [24-27] or the properties of the photocatalyst used [28-32]. Solar light activated materials have also been tested to reduce application cost [33]. Herein, sulfate radical generating oxidants were added as a way to reduce the energy requirements of the photocatalytic system for the removal of MC-LR as most of the light activated materials are not currently mass produced. Sulfate radicals (SO4-●) are among the strongest oxidants known for the abstraction of electrons [2.5-3.1 V] [34,35]. They are much stronger than OH radicals [1.89-2.72 V (Buxton et al., 1988)] and other commonly used in the drinking water industry oxidants, such as permanganate [E = 1.70 V] [36] and hypochlorous acid [E = 1.49 V] [37]. SO4-● radicals can be produced through homolytic dissociation of the oxidants through heat and radiation and e transfer mechanisms from Fenton-like reagents [38-40] reported that owing to their selectivity, SO4-● radicals are more efficient oxidants for the removal of organic compounds with unsaturated bonds and aromatic constituents than the OH radicals. Yet there are limited studies on SO4-● based AOPs (compared with OH) for the degradation of recalcitrant organic contaminants and especially cyanotoxins [41-43]. Even fewer studies have investigated the effect of coupling SO4-● radical generating oxidants with TiO2 on the removal of emerging contaminants with various light sources. Furthermore, simulated solar irradiation (SSI) has been used in the SSI/TiO2/PS treatment [44] and showed higher potential for the removal of the pesticide DEET compared with the SSI/TiO2/H2O2 system. PS was also coupled with TiO2 photocatalysts for the degradation of dyes under solar [45] and UV radiation [46].

The aim of this study was to determine the effects of increasing GO-TiO2-Sr(OH)2/SrCO3 concentrations (1 mg/l, 2 and 4 mg/l), increasing GO concentrations (2 mg/l, 4 and 8 mg/l), increasing TiO2 concentrations (1 mg/l, 3 mg/l, 6 and 9 mg/l), increasing photocatalytic powers (10 W, 50 and 100 W) and increasing sun light irradiation times (30 min, 120 min, 240 and 360 min) on the photocatalytic degradation of four hydrophobic PAHs namely ACL, CRB, BaP and BkF at pH = 7.0 and at 22°C, respectively. Furthermore, the effects of the operational conditions on the removal of acute toxicity were also determined using Daphnia magna.

Materials and Methods

Material Synthesis

GO was synthesized according to the modified Hummers method [47], and titanium dioxide nanoparticles (Nano-TiO2) were prepared following the approach reported in [48]. Supporting Information (SI) Text S1 provides detailed procedures for the preparation of GO and Nano-TiO2. The GO-TiO2 nanocomposite was then synthesized through the sono-chemical reaction of Nano-TiO2 in the presence of the GO. In brief, 3 g of the mixture of GO and Nano-TiO2 (mass ratio = 2:1) was added to 100 ml of distilled water, and stirred for 0.5 h at room temperature (22 ± 1°C). The suspension was then sonicated for 1 h. The resultant composite was recovered by filtration, rinsed with ethanol and then freeze-dried to yield the GO-TiO2 composites. Subsequently, dispersing known mass of GO-TiO2 (30 wt% of the final mass) in a 500 ml of sodium hydroxide (NaOH) solution (1 M), and a pre-determined amount of strontium chloride (SrCl, 0.5 M) was added dropwise to the dispersion at a rate of 2.0 ml/min using a Titronic Universal titrator (SCHOTT, Mainz, Germany). The resulting material, GO-TiO2-Sr(OH)2/SrCO3, was then filtered, washed with distilled water until no chloride was detected in the washing water, and then freeze-dried for 48 h. For comparison, a GO-Sr(OH)2/SrCO3 nanocomposite was also prepared by the similar procedure with 20 wt% GO but without TiO2.

Material Characterization

The X-ray diffraction (XRD) measurements were performed on a PW1820 X-ray diffractometer (Philips, Amsterdam, Netherlands) using Cu Kα radiation. Scanning electron microscopy (SEM) images were obtained with a JSM-840A electron microscope (JEOL, Tokyo, Japan) equipped with energy dispersive X-ray (EDX) micro-analytical system (EDAX, Mahwah, NJ, USA). The EDX analysis was performed at 263.15°C magnification to map the distribution of Sr and Ti on the nanocomposite surface. Fourier transform-infrared (FTIR) measurements were carried out with a Nicolet 560 FTIR spectrometer on KBr wafers (Thermo Fisher Scientific Inc., MA, USA). The spectra were recorded from 4000 to 400 1/cm at a resolution of 4 1/cm. Nitrogen (N2) adsorption-desorption isotherms were measured using AS1Win (Quantachrome Instruments, FL, USA) at the liquid N2 temperature of 196.15°C, from which Brunauer-Emmett-Teller (BET) specific surface area (SBET), micropore volume (Vmic), total pore volume (Vt), and pore size distribution (PSD) were derived. Potentiometric titration measurements were carried out with a T50 automatic titrator (Mettler Toledo, Columbia, MD, USA) and the total surface charge (Qsurf, mmol/g) of the nanocomposite was then calculated. Differential thermal gravimetric (DTG) analysis was conducted on an STA449F3 instrument (Netzsch, Selb, Germany). Reactive oxydizing agents such as potassium peroxymonosulfate (PMS, HSO5), potassium persulfate (PS, K2S2O8), and the quenching agent sodium thiosulfate (Na2S2O3) were purchased from Sigma-Aldrich (Poole, UK).

Photocatalytic Degradation

Simulated sun light was generated using a 94041A solar simulator (Newport Corporation, Irvine, CA). A cylindrical quartz tank reactor with a Pyrex pillar (80 × 70 mm) was fabricated as the photoreactor. The light intensity reached the reactor was 100 mW/cm2. The detailed information on the solar simulator and photoreactor has been reported elsewhere [49]. PAHs were purchased from Alfa Aesar (Ward Hill, MA, USA), and a stock solution of 2 g/l was prepared in methanol. Deionized (DI) water (Millipore Co., 18.2 MΩ·cm) was used in preparing all aqueous solutions. Typically, the photocatalytic degradation kinetic tests were conducted under the following conditions: solution volüme = 250 ml, initial PAHs concentration = 1 mg/l, 5 mg/l and 10 mg/l, catalyst dosage = 50 mg/l, pH = 7.0 ± 0.2, and T = 22 ± 1°C. The solution-photocatalyst mixture was first stirred in the dark for 2 h to allow PAHs adsorption to reach equilibrium. Subsequently, photodegradation was initiated by exposing the reactor to the simulated sun light.

Analytical Methods

UV-Visible spectra of solutions were obtained using an HP 8453 UV-Vis spectrophotometer (Agilent Technologies, Santa Clara, CA, USA). PAHs concentration was determined using an HP 1100 HPLC system (Agilent Technologies, Santa Clara, CA, USA) with a detection limit of 2.5 μg/l at the UV detection wavelength of 250 nm. Photodegradation intermediates were analyzed using an HP7890A/HP5975C gas chromatography-mass spectrometry (GC-MS) system (Agilent Technologies, Santa Clara, CA, USA).

The contributions of various reactive oxygen species (ROS) during the photocatalytic degradation process were investigated by adding scavengers to selectively quench radicals, i.e., potassium peroxymonosulfate (PMS, HSO5), potassium persulfate (PS, K2S2O8), and the quenching agent sodium thiosulfate (Na2S2O3) were used.

PAHs Measurements

For PAHs and some metabolites (hydroxy-benzoic acid, benzoic acid) analyses the samples were first filtered through a glass fiber filter (47 mm-diameter) to collect the particle-phase in series with a resin column (~10 g XAD-2) and to collect dissolved-phase polybrominated diphenyl ethers. Resin and water filters were ultrasonically extracted for 60 min with a mixture of 1/1 acetone: hexane. All extracts were analyzed for four PAHs (Table 1) gas chromatographically (Agilent 6890N GC) equipped with a mass selective detector (Agilent 5973 inert MSD). A capillary column (HP5-MS, 30 m, 0.25 mm, 0.25 µm) was used. The initial oven temperature was kept at 50°C for 1 min, then raised to 200°C at 25°C/min and from 200 to 300°C at 8°C/min, and then maintained for 5.5 min. High purity He(g) was used as the carrier gas at constant flow mode (1.5 ml/min, 45 cm/s linear velocity). PAHs and their metabolites were identified on the basis of their retention times, target and qualifier ions and were quantified using the internal standard calibration procedure. To determine the degradation intermediates, samples (10 ml each) were collected at 0 min, 30 min, 120 min, 240 min and 360 min. The hydrophobic PAHs (ACL, CRB, BaP and BkF) were performed using a HPLC (Agilent-1100) with a method developed by Lindsey and Tarr [50]. The chromatographic conditions for The hydrophobic PAHs (ACL, CRB, BaP and BkF) determination were as follows: C-18 reverse phase HPLC column (Ace 5C18; 25-cm x 4.6-mm, 5 μm, mobile phase: 50/50 (v/v) methanol/organic-free reagent water). pH, temperature, oxidation-reduction potential (ORP) were monitored following Standard Methods 2550, 2580 and 5220 D [51]. H2O2 was quantified with a colorimetric method following Standard Method 3550.

Table 1: Energy efficiency of photocatalysis with different sun light intensities at ambient conditions after 360 min sun light irradiation time (n=3, mean values, n: deionized water and petrochemical wastewater containing PAHs)

Energy efficiency of photocatalysis with different sun light intensities

Sun light intensity (W/cm2)

Power density (W/ml) Specific energy (kWh/kg COD-in influent)

COD removal efficiency (%)

17

0.12 8.29

47

38

0.91 8.90

59

24.03

1.34 9.26

68

39.09

1.71 9.91

77

46

1.97 10.83

80

52.3

2.38 12.42

86

Data Analysis

The pseudo-first-order kinetic model was employed to fit the kinetic data:

for 1

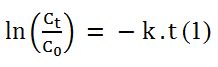
Where, Ct and C0 are the PAHs concentrations (μg/l) at the reaction time of t and 0 min, respectively, and k is the rate constant (1/min). The integration of UV-Vis absorbance of PAHs was achieved using the software OriginPro 8 (OriginLab Corporation, Northampton, MA, USA). The correlation fittings between the reaction rate constant and various water quality parameters were conducted by using OriginPro 8 or GraphPad Prism 6 (GraphPad Software, Inc., La Jolla, CA, USA). The fitting models included fourth-order polynomial and sigmoidal (Boltzmann and DoseResp functions) equations.

Daphnia magna Acute Toxicity Test

To test toxicity 24 h old Daphnia magna were used as described in Standard Methods. After preparing the test solution, experiments were carried out using 5 or 10 daphnids introduced into the test vessels. These vessels had 100 ml of effective volume at 7-8 pH, providing a minimum DO concentration of 6 mg/l at an ambient temperature of 20-25°C. Young Daphnia magna were used in the test (≤24 h old). A 24 h exposure is generally accepted as standard for a Daphnia acute toxicity test. The results were expressed as mortality percentage of the Daphnids. Immobile animals were reported as dead Daphnids.

All experiments were carried out three times and the results given as the means of triplicate samplings. Individual PAH concentrations are given as the mean with standard deviation (SD) values.

Statistical Analysis

The regression analysis between y (dependent) and x (independent) variables was carried out using Windows Excel data analysis. An ANOVA test was performed in order to determine the statistical significance between x and y variables.

Results and Discussion

Raw Wastewater

Characterization of raw petrochemical wastewater taken from the influent of the aeration unit of a petrochemical industry wastewater treatment plant was performed. The results are given as the mean value of triplicate sampling. The mean values for pH, ORP were recorded as 7.21 and 28.20 mV, respectively. The mean TSS and TVSS concentrations were measured as 310.3 and 250.6 mg/l, respectively. The mean DO, BOD5, CODtotal, CODdissolved concentrations were 1.78, 584, 1475 and 1127 mg/l while the Total-N, NH4-N, NO3-N, NO2-N, Total-P, PO4-P and oil concentrations were measured as 15.40, 2.20, 1.80, 0.05, 10.60, 6.80 and 206 mg/l, respectively. The less hydrophobic ACL and CRB concentrations were 124.2 ng/ml and 3.60 ng/ml while the more hydrophobic BaP and BkF concentrations were measured as 5.41 and 0.64 ng/ml, respectively, in the petrochemical industry wastewater. Physical and chemical properties of the PAHs studied in this work was shown at Table 2.

Table 2: Physical and chemical properties of the PAHs studied in this work

PAHs

CAS-No MF MW

(g/ mol)

TM

(°C)

TB

(°C)

Sw (25°C) (mg/l) VP (25°C) (mm Hg) H (25°C) (atm m3/mol) log KOA

(25°C)

log KOW

SORC

ACL

208-96-8

C12H8 152 93 280 16.1 6.68E-03 1.14E-04 6.34 3.94

23.56E+10

CRB

86-74-8

C12H9N 167 246 355 1.8 7.50E-07 1.16E-06 8.03 3.72

24.67E+10

BkF

207-08-9

C20H12 252 217 480 0.0008 9.70E-10 5.84E-08 11.37 6.11

0.45E+8

BaP

50-32-8

C20H12 252 177 495 0.00162 5.49E-09 4.57E-07 11.56 6.13

0.32 E+8

Acenaphthylene (ACL), Carbazole (CRB), Benzo[k]fluoranthene (BkF), Benzo[a]pyrene (BaP)
MF: Molecular Formula, MW: Molecular weight, TM: Melting point (°C), TB: Boiling point(°C), Sw: Solubility in water (mg/l), VP: Vapor pressure (mm Hg), H: Henry’s law constant (atm m3/mol), log KOA: Octanol-air coefficient, log KOW: Octanol-water coefficient, SORC: second-order reaction rate constants (ng/ml.s).

Characterization of Photocatalysts

The XRD spectra of the prepared nanocomposites (GO-Sr(OH)2/SrCO3 and GO-TiO2-Sr(OH)2/SrCO3) (Figure 1). For both composite materials, the diffraction peak at about 10° is attributed to GO (Kyzas et al., 2014). For GO-Sr(OH)2/SrCO3, the broad peaks at 2θ = 25°, 28°, 36° and 43° are assigned to the crystalline phase of SrCO3 (JCPDS Card No. 005-0418), whereas weak peaks for Sr(OH)2, Sr(OH)2·. H2O and Sr (OH)2·. 8H2O were also observed as confirmed by JCPDS Cards Nos. 27- 0847, 28-1222, and 27-1438, respectively [52]. The XRD pattern of GOTiO2-Sr(OH)2/SrCO3 showed much sharper peaks than those of GO-Sr (OH)2/SrCO3, indicating well-developed crystalline phases. The peaks at 2θ = 25°, 28°, 36° and 43° are attributed to TiO2 belonging to the rutile phase (JCPDS Card No. 88-1175), while minor peaks from the anatase phase (JCPDS Card No. 84-1268) were also observed [53]. Besides, the peaks at 2θ = 24°, 32.7°, 40.1°, 46.6°, 57.8° and 67.9° can be attributed to the perovskite-type phase of cubic symmetry of SrTiO3 (STO) (JCPDS Card No. 86-0179) [54,55].

fig 1

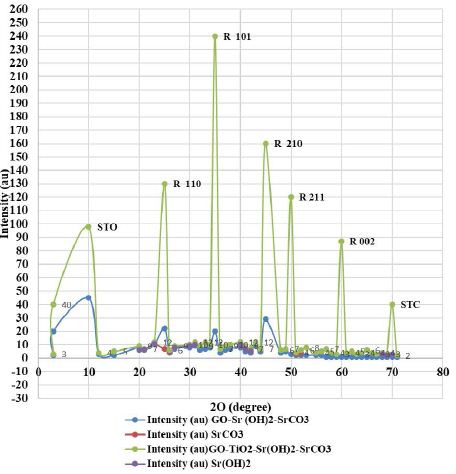
Figure 1: XRD patterns of GO-Sr(OH)2/SrCO3 and GO-TiO2-Sr(OH)2/SrCO3 nanocomposites

The SEM images along with the EDX maps of the elemental distribution (Figure 2) reveal that Sr and/or Ti are rather uniformly distributed in the GO-Sr(OH)2/SrCO3 and GO-TiO2-Sr(OH)2/SrCO3 nanocomposite matrices. The nano-rods in Figure (2a) are SrCO3, while the nanospheres on the GO surface in Figure (2c) are likely to be the aggregates of SrTiO3 nanoparticles with an average diameter of about 1 μm [56].

fig 2(1) fig 2(2)

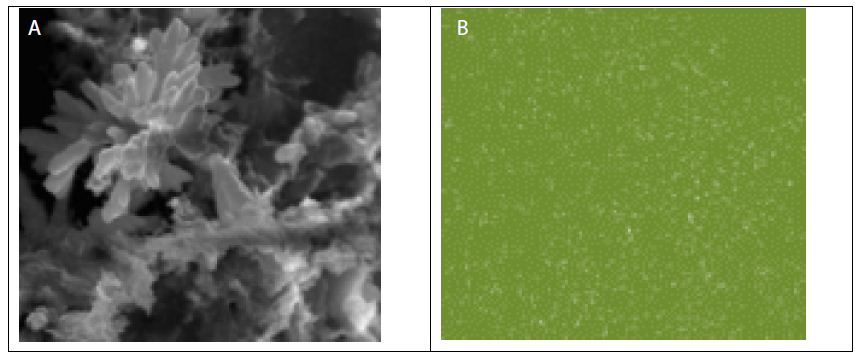
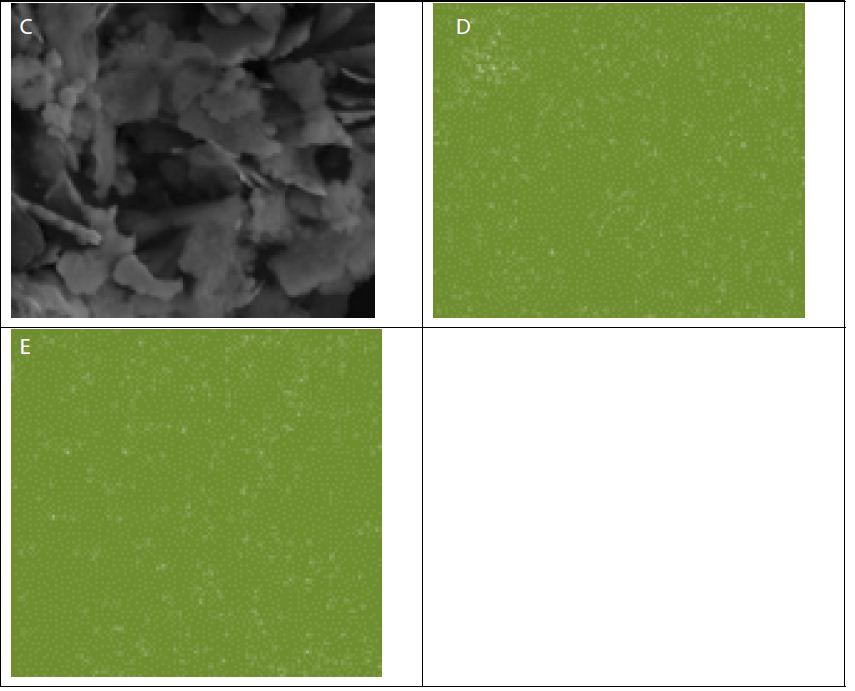
Figure 2: SEM images of (a) GO-Sr(OH)2/SrCO3, (b) Sr distribution map with GO-Sr(OH)2/SrCO3, (c) GO-TiO2-Sr(OH)2/SrCO3, (d) Sr distribution map with GO-TiO2-Sr(OH)2/SrCO3 and (e) Ti distribution map

Figure (3a) shows the FTIR spectrum for GO. The characteristic bands are assigned as follows: carboxyl groups at 1070 and 1760 1/cm, C]C stretching vibration of the sp2 carbon skeletal network at 1600 1/cm, OeH groups at 1380 and 1000 1/cm, and epoxy groups at 900 1/cm [57]. The peak at 1240 1/cm can be attributed to the S]O asymmetric stretching vibrations arising from sulfones or sulfates that were formed upon graphite oxidation with H2SO4 (SI Text S1). Figure (3b) presents the FTIR spectra of the nanocomposite materials, i.e., GO-Sr (OH)2/SrCO3 and GO-TiO2-Sr(OH)2/SrCO3. The characteristic bands of GO are clearly seen in the spectra of both nanocomposites. For GO-Sr (OH)2/SrCO3, the bands at 1071 and 1760 1/cm are attributed to the asymmetric and symmetric stretching vibrations of the carboxylate groups. The band at 1446 1/cm is attributed to the asymmetric stretching vibration of carbonate anion (CO3 −2) in SrCO3 that has a D3h symmetry, while the bands at 860 and 600 1/cm are assigned to the vibrations of the carbonate anion due to bending out of plane and in plane, respectively (Alavi and Morsali, 2010). The bands at 3200, 1380 and 1000 1/cm are due to stretching mode of -OH groups and can be attributed to Sr(OH)2, Sr(OH)2·. H2O and Sr(OH)2·. 8H2O. For GO-TiO2-Sr(OH)2/SrCO3, a new broad peak was observed in the range of 550-780 1/cm, which can be ascribed to the TieO stretching. The bands at 1760 and 1384 1/cm for the carboxylate groups disappeared, indicating that these groups have been bounded to TiO2. The bands at 3200, 1384 and 1020 1/cm were diminished, indicating that less crystalline phases of Sr(OH)2, Sr(OH)2.H2O and/or Sr(OH)2·. 8H2O were formed (Alavi and Morsali, 2010).

fig 3

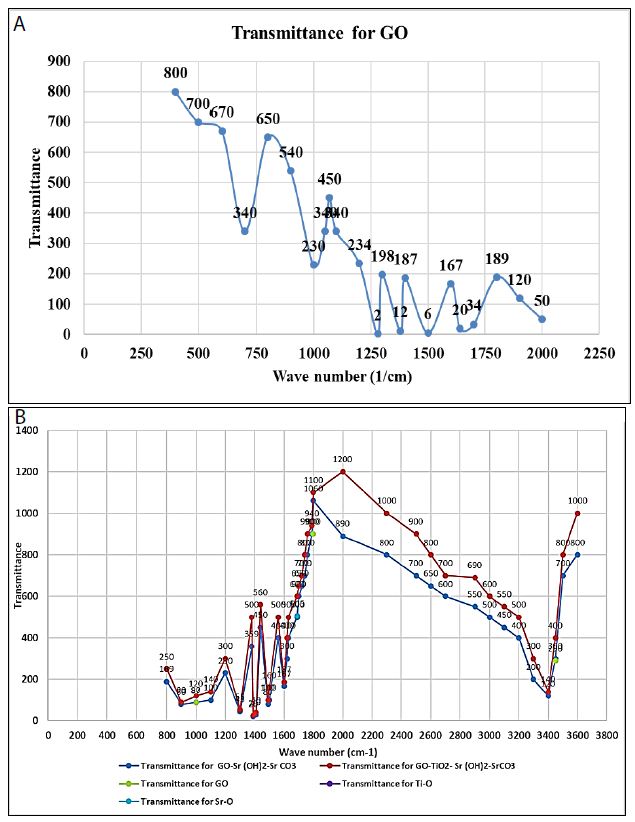
Figure 3: FTIR spectra of (a) GO and (b) GO-Sr(OH)2/SrCO3 versus GO-TiO2-Sr(OH)2/SrCO3 nanocomposites

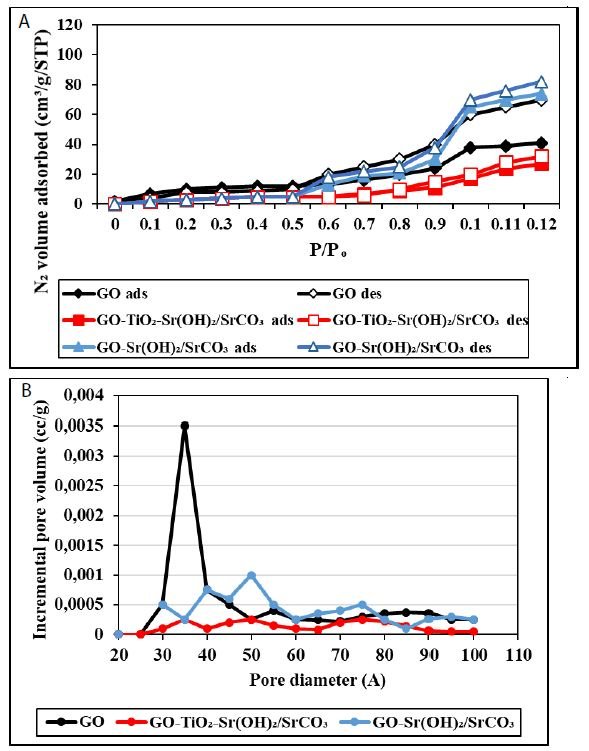
The textural features of the nanocomposites were investigated with the N2 adsorption-desorption isotherms and the results are shown in Figure 4a. According to the International Union of Pure and Applied Chemistry (IUPAC), the shape of the isotherm for the GO-Sr(OH)2/SrCO3 nanocomposite can be classified as a combination of Type II and Type III, indicating the coexistence of mesopores and macropores [58]. The deviation of the desorption isotherm from the adsorption isotherm (hysteresis) can be attributed to the presence of slit or bottle neck pores. The isotherm displayed a significant increase of N2 uptake at P/Po > 0.95, indicating the presence of external surface area and/or textural porosity. In contrast, the isotherm for GO-TiO2-Sr(OH)2/SrCO3 conforms to the Type II isotherm, which is characteristic of low-porosity materials or materials with large macropores. The decrease of the mesopores and macropores volume in GO-TiO2-Sr(OH)2/SrCO3 can be attributed to occupying part of the pores by TiO2 and SrTiO3 reaction products. The inset in Figure 4b presents the pore size distributions for GO, GO-Sr(OH)2/SrCO3 and GO-TiO2-Sr(OH)2/SrCO3 estimated by the density functional theory (DFT) calculations of the N2 adsorption data. The presence of mesopores and macropores is clearly evident in GO, which are then sharply diminished with the addition of Sr(OH)2/SrCO3 and TiO2. Moreover, the specific surface area of GO-TiO2-Sr(OH)2/SrCO3 (5.64 m2/g) was found 75% less than that of GO-Sr(OH)2/SrCO3 (21.47 m2/g), and the pore volume of GO-TiO2-Sr(OH)2/SrCO3 (0.0319 cm3/g) was 84% less than that of GO-Sr(OH)2/SrCO3 (0.1842 cm3/g).

fig 4

Figure 4: (a) Nitrogen adsorption-desorption isotherms and (b) pore size distribution of GO, GO-Sr (OH)2/SrCO3 and GO-TiO2-Sr(OH)2/SrCO3

Effect of Increasing GO Nanoparticle Concentrations during Hydrophobic PAHs Treatment with Photocatalytic Degradation Under Sun Light İrradiation

Preliminary studies showed that the optimum sun light intensity, irradiation time, pH, and temperature were 100 mW/cm2, 360 min, pH = 7.0 and at 22°C, respectively in the presence of 7 mg/l GO nanocomposite concentration (data not shown). The effects of increasing GO nanoparticle concentrations (2 mg/l, 4 mg/l and 8 mg/l) on the removals of PAHs [less hydrophobic (ACL, CRB) and more hydrophobic (BaP, BkF)] under a sun light intensity of 100 mW/cm2, at a sun light irradiation time of 360 min, at pH = 7.0 and at 22°C, respectively (Table 3; SET 1). The maximum removals of ACL, CRB, BaP and BkF hydrophobic PAHs were 87%, 87%, 85% and 84% at 8 mg/l GO nanoparticle concentration under a sun light intensity = 100 mW/cm2, at a photocatalytic powerof 100 W, at sun light irradiation time of 360 min, at a pHof 7.0 and at 22°C, respectively (Table 3; SET 1). The increasing GO nanoparticle concentrations were positively affect the photocatalytic degradation of hydrophobic PAHs (ACL, CRB, BaP and BkF) (Table 3; SET 1).

Table 3: Effect of increasing experimental parameters on photocatalytic degradation of hydrophobic PAHs in a petrochemical industry wastewater under sun light irradiaiton process, at sun light intensity=100 mW/cm2, at pH=7.0 and at 22°C, respectively (n=3, mean values)

Set

Parameters Hydrophobic PAHs removals (%)
Less hydrophobic

More hydrophobic

ACL

CRB BaP

BkF

1 GO nanoparticle concentrations (mg/l)
2

54

56 59

58

4

71

73 70

69

8

87

87 85

84

2 TiO2 nanoparticle concentrations (mg/l)
1

59

57 64

75

3

63

66 77

81

6

76

78 83

86

9

89

90 91

92

3 GO-TiO2-Sr(OH)2/SrCO3 nanocomposite concentrations (mg/l)
1

76

75 80

92

2

89

84 86

97

4

97

98 98

99

4 Sun light irradiation times (min)
30

56

61 60

65

120

65

68 65

66

240

74

76 72

79

360

81

80 84

84

2 Photocatalytic Powers (W)
10

56

62 67

69

50

69

70 78

74

100

84

86 88

89

Effect of Increasing TiO2 Nanoparticle Concentrations during Hydrophobic PAHs Treatment with Photocatalytic Degradation Under Sun Light Irradiation

The preliminary studies showed that the optimum removals for PAHs [less hydrophobic (ACL, CRB) and more hydrophobic (BaP, BkF)] were obtained at a TiO2 concentration of 8 mg/L under sun light intensity of 98 mW/cm2, at photocatalytic power of 95 W, at sun light irradiation time of 350 min, at pH = 7.1 and at a temperature of 22°C (data not shown). The effects of increasing TiO2 nanoparicle concentrations (1 mg/l, 3 mg/l, 6 mg/l and 9 mg/l) were measured to detect the PAHs yields [less hydrophobic (ACL, CRB) and more hydrophobic (BaP, BkF)] under a sun light intensity of 100 mW/cm2, at photocatalytic power = 100 W, at sun light irradiation time of 360 min, ata pH = 7.0 at 22°C (Table 3; SET 2). The removals of BaP, BkF, ACL and CRB PAHs increased from 75% up to 86% as the TiO2 nanoparticle concentrations was increased from 1 mg/l up to 6 mg/l, whereas 1-3 mg/l TiO2 nanoparicle concentrations dis not significantly contribute to the hydrophobic PAHs (ACL, CRB, BaP and BkF) removals (Table 3; SET 2). The maximum 89%ACL, 90%CRB, 91%BaP and 92%BkF hydrophobic PAHs removals were detected at 9 mg/l TiO2 nanopartilce concentration, under a sun light intensity = 100 mW/cm2, at a photocatalytic powerof 100 W, at sun light irradiation time of 360 min, at a pHof 7.0 and at 22°C, respectively (Table 3; SET 2). The increasing of TiO2 nanoparticle concentrations positively affected the photocatalytic degradation of hydrophobic PAHs (ACL, CRB, BaP and BkF) during sun light irradiation process (Table 3; SET 2).

Effect of Increasing GO-TiO2-Sr(OH)2/SrCO3 Nanocomposite Concentrations during Hydrophobic PAHs Treatment with Photocatalytic Degradation under Sun Light Irradiation

Based on the preliminary studies the optimum removals of some less hydrophobic (ACL, CRB) and more hydrophobic (BaP, BkF)] PAHs were researched at a sun light intensity of 100 mW/cm2, at photocatalytic power = 100 W, at sun light irradiation time = 360 min, at pH = 7.0 and at 22°C, respectively at a GO-TiO2-Sr(OH)2/SrCO3 concentrations of 3 mg/l (Table 3; SET 3). The removals in BaP, BkF, ACL and CRB increased from 92%, up to 99% as the GO-TiO2-Sr(OH)2/SrCO3 nanocomposite concentration was increased from 1 up to 4 mg/l, at a sun light intensity = 100 mW/cm2, at a photocatalytic power = 100 W, ata sun light irradiation time = 360 min, at 22°C (Table 3; SET 3). The maximum 97%ACL, 98%CRB, 98%BaP and 99%BkF hydrophobic PAHs removals were found at 4 mg/l GO-TiO2-Sr(OH)2/SrCO3 nanocomposite concentration under a sun light intensity = 100 mW/cm2, at a photocatalytic powerof 100 W, at sun light irradiation time of 360 min, at a pHof 7.0 and at 22°C, respectively. The increasing GO-TiO2-Sr(OH)2/SrCO3 nanocomposite concentrations were found to be positively affect for the photocatalytic degradation of hydrophobic PAHs (ACL, CRB, BaP and BkF) (Table 3; SET 3).

An optimum GO-TiO2-Sr(OH)2/SrCO3 nanocomposite concentration of 4 mg/l increase the ionic strength of the aqueous phase, driving the PAHs to the bulk-bubble interface in a photocatalytic reactor. This, increases the partitioning of the PAH species upon radical scavengers in a photocatalytic reactor. Beyond the partitioning enhancement, the presence of salt reduces the vapor pressure and increases the surface tension of the PAHs [59]. Therefore, the solubility of the solution decreases and the diffusion of solutes decreases from the bulk solution to the bubble-liquid interface with administration of decreasing GO-TiO2-Sr(OH)2/SrCO3 nanocomposite concentrations in the photocatalytic reactor [60]. The high PAH removals in raised GO-TiO2-Sr(OH)2/SrCO3 nanocomposite concentrations can be explained by the fact that a higher amount of GO-TiO2-Sr(OH)2/SrCO3 nanocomposite will create more salting out effect than the lower amount and thus increase the interfacial concentration of the PAHs. In our study, no contribution of GO-TiO2-Sr(OH)2/SrCO3 nanocomposite >4 mg/l to the PAH yields could be attributed to the sinergistic and antagonistic effects of the by-products and to the more hydrophobic (BaP, BkF) and less hydropholic (ACL, CRB) nature of PAHs present in petrochemical industry wastewaters (Table 3; SET 3).

Effect of Increasing Sun Light Irradiation Times during Hydrophobic PAHs Treatment with Photocatalytic Degradation Under Sun Light Irradiation

The effects of increasing sun light irraditiaon times (30 min, 120 min, 240 min and 360 min) were measured in PAHs [less hydrophobic (ACL, CRB) and more hydrophobic (BaP, BkF)] under sun light intensity = 100 mW/cm2, at photocatalytic power = 100 W, at pH = 7.0 at 22°C, respectively (Table 3; SET 4).

The removals of BaP, BkF, ACL and CRB increased from 56-65% up to 72-79% as the sun light irradiation times was increase from 30 min up to 240 min, whereas 30-120 min sun light irradiation times dis not significantly contribute to the hydrophobic PAHs (ACL, CRB, BaP and BkF) removals was not observed (Table 3; SET 4). The maximum 81%ACL, 80%CRB, 80%BaP and 84%BkF hydrophobic PAHs removals were indicated at 360 min sun light irradiaiton time, under sun light intensity = 100 mW/cm2, at photocatalytic power = 100 W, at pH = 7.0 and at 22°C, respectively (Table 3; SET 4). The increasing sun light irradiaiton times were affected positively effect for the photocatalytic degradation hydrophobic PAHs (ACL, CRB, BaP and BkF) during sun light irradiation process (Table 3; SET 4).

Effect of Increasing Photocatalytic Powers During Hydrophobic PAHs Treatment with Photocatalytic Degradation Under Sun Light Irradiation

The effects of increasing photocatalytic powers (10 W, 50 W and 100 W) were measured in PAHs [less hydrophobic (ACL, CRB) and more hydrophobic (BaP, BkF)] under sun light intensity = 100 mW/cm2, at sun light irradiation time = 360 min, at pH = 7.0 at 22°C, respectively (Table 3; SET 5).

The removals of BaP, BkF, ACL and CRB increased from 56-69% up to 69-78% as the photocatalytic powers was increase from 10 W up to 50 W, whereas 10-50 W photocatalytic powers dis not significantly contribute to the hydrophobic PAHs (ACL, CRB, BaP and BkF) removals was not obtained (Table 3; SET 5). The maximum 84%ACL, 86%CRB, 88%BaP and 89%BkF hydrophobic PAHs removals were indicated at 100 W photocatalytic power, under sun light intensity = 100 mW/cm2, at sun light irradiation time = 360 min, at pH = 7.0 and at 22°C, respectively (Table 3; SET 5). The increasing photocatalytic powers were affected positively effect for the photocatalytic degradation hydrophobic PAHs (ACL, CRB, BaP and BkF) during sun light irradiation process (Table 3; SET 5).

Photocatalytic Activity

PAHs is resistant to photolysis under sun light [61]. The control tests showed that nearly 85% of PAHs still retained in the solution after 360 min sun irradiation time (Table 4 and Figure 5) and the pseudo-first-order rate constant was k = 0.0006 ± 0.0001 1/min. The addition of TiO2 nanoparticle enhanced the photodegradation rate by 3 folds (k = 0.0016 1/min) (Table 4 and Figure 5). The addition of GO increased the photodegradation yield (k = 0.0019 ± 0.0001 l/min) (Table 4 and Figure 5). The UV light in the sun light irradiation is the main driving energy for the photocatalytic activity of TiO2. The synthesized GO-Sr(OH)2/SrCO3 showed a slightly better photocatalytic activity (k = 0.0021 ± 0.0001 1/min) than TiO2 and GO nanoparticle (Table 4 and Figure 5). As expected, the GO-TiO2-Sr(OH)2/SrCO3 nanocomposite exhibited the highest photocatalytic activity and greatly accelerated the photocatalytic degradation rate. It was shown a synergistic interaction among the three nanocomponents, i.e., GO, TiO2 and Sr(OH)2/SrCO3, which can facilitate utilization of both UV and visible light energy in the sun light irradiation.

Table 4: The rate constants of GO, TiO2 and GO-TiO2-Sr(OH)2/SrCO3 after photocatyalytic degradation with sun light irradiation process

Sun light irradiaiton time (min)

k (1/min)
Control GO TiO2

GO-TiO2-Sr(OH)2/SrCO3

30

0.0001 ± 0.00001

0.0005 ± 0.0001 0.0004 ± 0.0001

0.0009 ± 0.0001

120 0.0003 ± 0.0001 0.0011 ± 0.0001 0.0009 ± 0.0001

0.0013 ± 0.0001

240

0.0005 ± 0.0001 0.0014 ± 0.0001 0.0012 ± 0.0001 0.0017 ± 0.0001
360 0.0006 ± 0.0001 0.0019 ± 0.0001 0.0016 ± 0.0001

0.0021 ± 0.0001

fig 5

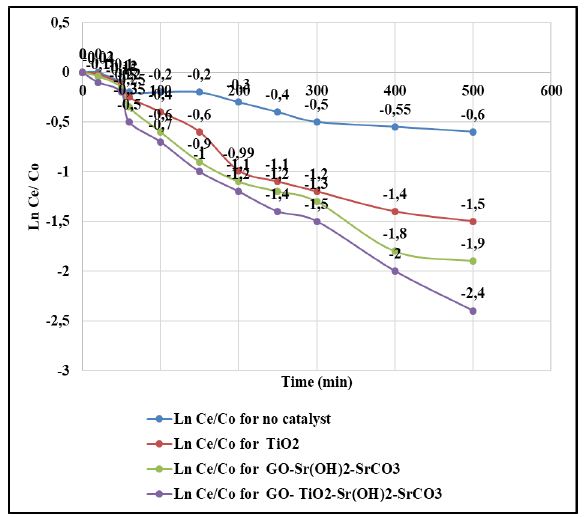
Figure 5: Photocatalytic degradation of PAHs by various synthesized catalysts, at light intensity = 100 mW/cm2, at solution volume = 250 ml, at initial PAHs concentration = 1 mg/l, catalyst dosage = 50 mg/l, at sun light irradiation time = 360 min, at pH=7.0 and at 22°C

In the photocatalytic activity of GO-TiO2-Sr(OH)2/SrCO3 firstly, the hybridization of the two coupling semiconductors (TiO2 and Sr(OH)2/SrCO3) shifted the optical absorption to the higher wavelength region and impel the transfer of photo-excited electron and holes to opposite directions (data not shown) [62]. Secondly, the GO sheets can further promote the transport of the photo-excited electrons, and thus inhibit the recombination of electrons and holes. And thirdly, the reaction product SrTiO3 has high photocatalytic activity and can also contribute to the enhanced photodegradation of PAHs.

Contribution of Reactive Oxygen Species (ROS) on the Photocatalytic Yields of PAHs

In generally, photocatalytic oxidation processes, ROS (potassium peroxymonosulfate (PMS, HSO5), potassium persulfate (PS, K2S2O8) and the quenching agent sodium thiosulfate (Na2S2O3) generated during the photocatalytic reactions are mainly responsible for the degradation of organic pollutants [63]. Preliminary studies showed that among the concentrations studied with 1.1 mg/l PMS, 0.9 mg/l PS and 0.79 mg/l Na2S2O3 highest photooxidaton yields was detected.

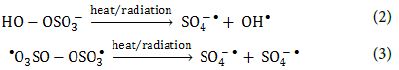
PS and PMS can undergo homolytic dissociation of the peroxide bond from radiation or thermal activation and give SO4-● radicals, and sulfate and OH radicals, respectively (Equation 2 and Equation 3).

for 2,3

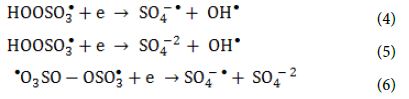
The oxidants can also act as electron acceptors of the photo-excited electron from the conduction band of the GO-TiO2-Sr(OH)2/SrCO3 and through electron transfer mechanisms to give additional sulfate and hydroxyl radicals based on the reactions listed below (Equation 4, Equation 5 and Equation 6) [64-66].

for 4,5,6

Heat activation of oxidants did not contributed on radical formation because of the temperature in the reactor and the relatively short treatment times compared to what was reported needed in the literature. On the other hand, homolytic dissociation of the peroxide bond of the oxidants through radiation seems to be a more probable mechanism. Even though, both oxidants have low absorption in the UVA range, the adsorption of PS at λ = 365 nm is four times the one of PMS, when measured in solutions of the same concentration of active species. This indicates that PS has a better ability to adsorb photons compared to PMS and therefore, more radicals can be formed. The remaining PMS and form peroxymonosulfate radicals (SO5-●) (Equation 7 and Equation 8) that have significantly reduced oxidation ability and higher selectivity (redox potential 1.1 V, at pH = 7.0) to SO4-● radicals (Table 5).

for 7,8

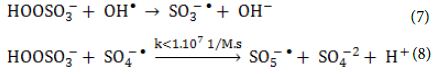
On the other hand, reaction of PS with a SO4-● radical will cause the formation of another SO4-● radical (Equation 9) which leaves the oxidative capacity of the system unaltered. The effects of (PMS, HSO5), (PS, K2S2O8) and Na2S2O3 on the photocatalytic degradation rates of the studied BkF PAH were tabulated (Table 5).

for 9

Table 5: Contributions of ROS to photocatalytic degradation of BkF PAH by GO-TiO2-Sr (OH)2/SrCO3 under simulated solar irradiation

Scavengers

Scavenging radicals

k (1/min)

None (Only GO-TiO2-Sr (OH)2/SrCO3)

0.0061

PMS

HSO5 –

0.0062

PS

K2S2O8

0.0067

Na2S2O3

SO4-2

0.0063

Photodegradation Pathway

At Table 6 and Figure 6 presents the reaction intermediates during the photocatalytic degradation of hydrophobic PAHs (ACL, CRB, BaP and BkF) by GO-TiO2-Sr(OH)2/SrCO3 under sun light irradiation process. It is noteworthy that the reaction rate and selectivity can be altered by the reaction matrix. For example, using dimethyl carbonate instead of water as the medium, the selectivity of TiO2 for the partial photooxidation of hydrophobic PAHs (ACL, CRB, BaP and BkF) was enhanced.

Table 6: By-products of BkF, BaP and ACL PAHs at sun light intensity = 100 mW/cm2, at solution volume= 250 ml, at initial PAHs concentration = 1 mg/l, at pH=7.0 ± 0.2, at 22°C, at 360 min sun light irradiaiton time, respectively (n=3, mean ± SD)

PAHs name

Initial PAH concentration (ng/ml)

Photocatalytic degradation metabolites (ng/ml)

BkF

0.804 ± 0.001

benzoic acid: 0.21 ± 0.002

FL: 0.59 ± 0.005

BaP 0.077 ± 0.003 benzoic acid: 0.028 ± 0.001

PY: 0.0040 ± 0.00014

ACL 53.42 ± 0.05 NAP: 44.13 ± 0.07

fig 6

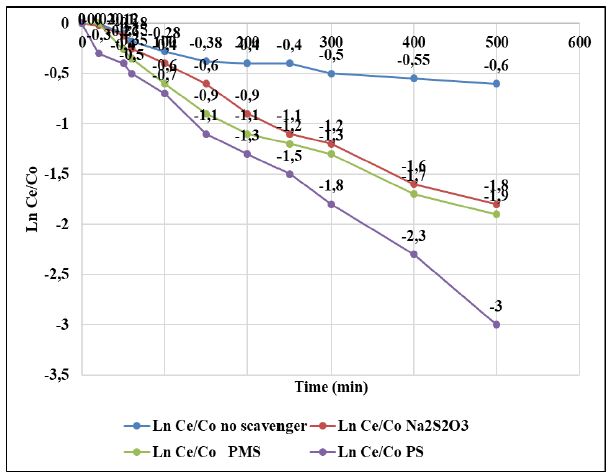
Figure 6: Photocatalytic degradation of PAHs by GOTiO2-Sr(OH)2/SrCO3 in the various radical scavengers, at sun light intensity = 100 mW/cm2, at solution volume= 250 ml, at initial PAHs concentration = 1 mg/l, at catalyst dosage = 50 mg/l, at pH=7.0 ± 0.2, T=22 ± 1°C, at TBA dosage = 200 mg/l, at NaN3 dosage = 200 mg/l, at BQ dosage = 200 mg/l and at CAT dosage = 4000 U/ml, respectively

Determination of the Acute Toxicity of Studied PAHs on Daphnia magna before and after Treatment of Hydrophobic PAHs Under Photocatalytic Degradation at Different Experimental Conditions

The raw petrochemical industry wastewater samples induced 95% motility inhibition to Daphnia magna cells (Table 7). This inhibition could be attributed to the mixed reacalcitrant carcinogenic hydrophobic PAHs with high benzene rings and to the synergistic effects of the aforementioned more hydrophobic PAHs with less hydrophobic PAHs in petrochemical industry wastewaters. When Daphnia magnas were exposed to the effluent samples treated withonly photolysis without catalyst at 22°C for 360 min sun light irradiaiton time a significant reduction in inhibition (10.01%) was not observed (the inhibition decreased from initial 98% to 88%). In other words, photolysis alone was not sufficient to remove the toxicity of recalcitrant by-products from the petrochemical wastewater (Table 7). The maximum removals in inhibition were observed in photocatalytic degraded petrochemical wastewater containing 8 mg/l GO nanoparticle, 9 mg/l TiO2 nanoparticle and 4 mg/l GO-TiO2-Sr(OH)2/SrCO3 nanocomposite concentrations at a neutral pH = 7.0 after 360 min sun light irradiation time at 22°C. A decreasing toxicity trend due to long sun light irradiaiton time with catalyst can be explained by the formation of less toxic by-products over time. The petrochemical wastewater containing TiO2 nanoparticles >10 mg/l displayed toxicity to Daphnia magna after 360 min sun light irradiation time. Similarly, GO nanoparticle and GO-TiO2-Sr(OH)2/SrCO3 nanocomposite concentrations >10 mg/l and >6 mg/l caused inhibition to Daphnia magna motility after 360 min sun light irradiation time at 22°C. A significant corrrelation between Daphnia manga acute toxicity and TiO, GO and GO-TiO2-Sr(OH)2/SrCO3 nanocomposite concentrations was observed after 360 min sun light irradiation time according to multiple regression analysis (R2 = 0.87, F = 17.99. p = 0.001).

Table 7: Effect of sun light irradiaiton times during photocatalytic degradation process on the acute toxicity (EC50) removal efficiencies at different operational conditions at pH=7.0, at 22°C (n=3, mean values)

Sets

IAT

Operational conditions


PDA at 22 °C (Control)

GO TiO2

GO-TiO2-Sr(OH)2/SrCO3

EC50

t=0

ATRi SLIT a EC50


ATR GO b EC50

t=360

ATRe TiO2 c EC50 t=360 ATRe GO-TiO2-Sr(OH)2/SrCO3d EC50

t=360

ATRe

1

342.56

98 30 359.04 2.01 2 631.05 99.99 1 484.67 67 1 590.56 97.00
2 342.56 98 120 364.78 6.23 4 604.67 90.00 3 545.56 78 2 626.56

99.00

3

342.56 98 240 377.67 8.34 8 540.78 76.99 6 587.45 94 4 630.45 99.94
4 342.56 98 360 380.12 10.01 9 504.67 70
IAT: Initial acute toxicity; a: sun light irradiation times (min); b: GO concentration (mg/l); c: TiO2 nanoparticle concentrations (mg/l); d: GO-TiO2-Sr(OH)2/SrCO3 nanocomposite concentration (mg/l); PDA: Photocatalytic degradation alone without additives (Control); EC50 t=0 : Initial acute toxicity before photocatalytic degradation (ng/ml); ATRi: Initial inhibition percentage before photocatalytic degradation; EC50 : Acute toxicity after photocatalytic degradation in control versus sun light irradiation time (ng/ml); ATR: Acute toxicity removal (%) in control versus sun light irradiation time; ATRe: Acute toxicity removal (%) after 360 min sun light irradiation time; EC50 t=360 : acute toxicity after 360 min sun light irradiaiton time (ng/ml).

Toxicity results showed that both high concentrations of GO, TiO2 and GO-TiO2-Sr(OH)2/SrCO3 influence the toxicity of PAH mixtures which may interact with the PAHs and their degraded metabolites to form different by-products during photocatalytic degradation. These by-products exhibit synergistic and antagonistic toxicity effects on Daphnia magna as well. The effective PAH concentrations caused 50% mortality in Daphnia magna cells (EC50 value as ng/ml) increased from initial 342.56 ng/ml to EC50 = 631.05 ng/ml, at pH = 7.0 and at 22°C after 360 min sun light irradiation time resulting in a maximum acute toxicity removal of 99.99% at 1 mg/l GO-TiO2-Sr(OH)2/SrCO3 nanocompoasite concentration (Table 7; SET 1). The EC50 value increased from initial 342.56 ng/ml to EC50 = 587.45 ng/ml at a TiO2 concentration of 6 mg/l after 360 min sun light irradiation time, at pH = 7.0 and at 22°C resulting in a maximum acute toxicity removal of 94.00% (Table 7; SET 3). The EC50 value increased from initial 342.56 ng/ml to EC50 = 630.45 ng/ml at 8 mg/l GO nanopartilce concentration was measured to 99.94% maximum acute toxicity removal, at pH = 7.0, at 22°C after 360 min sun light irradiation time, respectively (Table 7; SET 3). In this acute toxicity reduction the EC50 value of petrochemical industry wastewater increased to EC50 = 631.05 ng/ml. Low acute toxicity removals found at high GO nanoparticle concentrations could be attributed to their detrimental effect on the Daphnia magna cells (Table 6; SET 1).

A strong significant correlation between EC50 values and PAH removals showed that the Daphnia magna acute toxicity test alone can be considered aa a reliable indicator of petrochemical wastewater toxicity (R2 = 0.87, F = 17.99. p = 0.001). Similarly, a strong linear correlation between threshold concentrations of GO, TiO2, GO-TiO2-Sr(OH)2/SrCO3 and decrease in inhibitions was observed (R2 = 0.91, F = 3.89, p = 0.001) while the correlation between the inhibition decrease and GO, TiO2 and GO-TiO2-Sr(OH)2/SrCO3 nanocomposite concentrations above the threshold values was weak and not significant (R2 = 0.38, F = 3.81, p = 0.001). In this study, the Daphnia magna acute toxicity test alone can be considered a reliable indicator of petrochemical industry wastewater toxicity.

Conclusion

The results of this study showed that the hydrophobic PAHs in a petrochemical industry wastewater with high benzene rings could be removed as successfully as the less hydrophobic PAHs (ACL and CRB) and more hydrophobic PAHs (BaP and BkF) with photocatalytic degradation under sun light irradiation process. The maximum removals of ACL, CRB, BaP and BkF hydrophobic PAHs were 87%, 87%, 85% and 84% at 8 mg/l GO nanoparticle concentration under a sun light intensity = 100 mW/cm2, at a photocatalytic powerof 100 W, at sun light irradiation time of 360 min, at a pHof 7.0 and at 22°, respectively. The maximum 89%ACL, 90%CRB, 91%BaP and 92%BkF hydrophobic PAHs removals were detected at 9 mg/l TiO2 nanopartilce concentration, under a sun light intensity = 100 mW/cm2, at a photocatalytic powerof 100 W, at sun light irradiation time of 360 min, at a pHof 7.0 and at 22°C, respectively. The maximum 97%ACL, 98%CRB, 98%BaP and 99%BkF hydrophobic PAHs removals were found at 4 mg/l GO-TiO2-Sr(OH)2/SrCO3 nanocomposite concentration under a sun light intensity = 100 mW/cm2, at a photocatalytic powerof 100 W, at sun light irradiation time of 360 min, at a pHof 7.0 and at 22°C, respectively.

The addition of TiO2 nanoparticle enhanced the photodegradation rate by 3 folds (k = 0.0016 1/min). The addition of GO increased the photodegradation yield (k = 0.0019 ± 0.0001 l/min). The synthesized GO-Sr(OH)2/SrCO3 showed a slightly better photocatalytic activity (k = 0.0021 ± 0.0001 1/min) than TiO2 and GO nanoparticle. As expected, the GO-TiO2-Sr(OH)2/SrCO3 nanocomposite exhibited the highest photocatalytic activity and greatly accelerated the photocatalytic degradation rate. It was shown a synergistic interaction among the three nanocomponents, i.e., GO, TiO2 and Sr(OH)2/SrCO3, which can facilitate utilization of both UV and visible light energy in the sun light irradiation. 1.1 mg/l PMS, 0.9 mg/l PS and 0.79 mg/l Na2S2O3 highest photooxidaton yields was detected.

The effective PAH concentrations caused 50% mortality in Daphnia magna cells (EC50 value as ng/ml) increased from initial 342.56 ng/ml to EC50 = 631.05 ng/ml, at pH = 7.0 and at 22°C after 360 min sun light irradiation time resulting in a maximum acute toxicity removal of 99.99% at 1 mg/l GO-TiO2-Sr(OH)2/SrCO3 nanocompoasite concentration. In sum, GO-TiO2-Sr(OH)2/SrCO3 nanocomposites holds the potential to serve as a highly effective and robust photocatalyst for energy-effective photodegradation of PAHs (and potentially other persistent organic pollutants) in complex water matrices, and the multiplicative model is a useful tool for predicting the photocatalytic performances under several experimental conditions.

Acknowledgements

This research study was undertaken in the Environmental Microbiology Laboratury at Dokuz Eylül University Engineering Faculty Environmental Engineering Department, Izmir-Turkey.

References

  1. Fu J, Sheng S, Wen T, Zhang Z-M, Wang Q, et al. (2011a) Polycyclic aromatic hydrocarbons in surface sediments of the Jialu River. Ecotoxicology 20: 940-950. [crossref]
  2. Fu J, Gong Y, Zhao X, O’Reilly SE, Zhao D (2014) Effects of oil and dispersant on formation of marine oil snow and transport of oil hydrocarbons. Environmental Science & Technology 48: 14392-14399. [crossref]
  3. Gong Y, Fu J, O’Reilly SE, Zhao D (2015) Effects of oil dispersants on photodegradation of pyrene in marine water. Journal of Hazardous Materials 287: 142-150. [crossref]
  4. Fu J, Ding Y-H, Li L, Sheng S, Wen T, et al. (2011b) Polycyclic aromatic hydrocarbons and ecotoxicological characterization of sediments from the Huaihe River, China, Journal of Environmental Monitoring and Assessment, 13: 597-604. [crossref]
  5. Banjoo DR and Nelson PK (2005) Improved ultrasonic extraction procedure for the determination of polycyclic aromatic hydrocarbons in sediments. Journal of Chromatography A, 1066: 9-18. [crossref]
  6. Sponza DT and Oztekin R (2010) Effect of sonication assisted by titanium dioxide and ferrous ions on Poly aromatic hydrocarbons (PAHs) and toxicity removals from a petrochemical industry wastewater in Turkey. Journal of Chemical Technology and Biotechnology 85: 913-925
  7. Quesada-Peñate I, Julcour-Lebigue C, Jáuregui-Haza U.-J, Wilhelm A-M, et al. (2009) Sonolysis of levodopa and paracetamol in aqueous solutions. Ultrasonics Sonochemistry 16: 610-616.
  8. Hoffmann MR, Martin ST, Choi W, Bahnemann DW(1995) Environmental applications of semiconductor photocatalysis. Chemical Reviews 95: 69-96.
  9. Sannino F, Pernice P, Imparato C, Aronne A, D’Errico G, et al. (2015) Hybrid TiO2-acetylacetonate amorphous gel-derived material with stably adsorbed superoxide radical active in oxidative degradation of organic pollutants. RSC Advances, 5: 93831-93839.
  10. Zeng P, Zhang Q, Zhang X, Peng T (2012) Graphite oxide-TiO2 nanocomposite and its efficient visible-light-driven photocatalytic hydrogen production. Journal of Alloys and Compounds 516: 85-90.
  11. Di Paola A, Garcia-López E, Ikeda S, Marcı G, Ohtani B. (2002) Photocatalytic degradation of organic compounds in aqueous systems by transition metal doped polycrystalline TiO2. Catalysis Today 75: 87-93.
  12. Zhao K, Zhao SL, Qi J, Yin HJ, Gao C, et al. (2016) Cu2O clusters grown on TiO2 nanoplates as efficient photocatalysts for hydrogen generation. Inorganic Chemistry Frontiers 3: 488-493.
  13. Qu L, Liu Y, Baek JB, Dai L (2010) Nitrogen-doped graphene as efficient metal-free electrocatalyst for oxygen reduction in fuel cells. ACS Nano 4: 1321-1326. [crossref]
  14. Liang Y, Li Y, Wang H, Zhou J, Wang J. (2011) Co3O4 nanocrystals on graphene as a synergistic catalyst for oxygen reduction reaction. Nature Materials 10: 780-786. [crossref]
  15. Guo J, Zhu S, Chen Z, Li Y, Yu Z (2011) Sonochemical synthesis of TiO2 nanoparticles on graphene for use as photocatalyst, Ultrasonics Sonochemistry.18: 1082-1090. [crossref]
  16. Stengl V, Henych J, Vomáčka P and Slušná M (2013) Doping of TiO2-GO and TiO2-rGO with noble metals: synthesis, characterization and photocatalytic performance for azo dye discoloration. Photochemistry and Photobiology 89: 1038-1046.
  17. Turekian KK, Wedepohl KH (1961) Distribution of the elements in some major units of the Earth’s crust. Geological Society of America Bulletin 72: 175.
  18. Yousefi R, Jamali-Sheini F, Cheraghizade M, Khosravi-Gandomani S, Sáaedi A, et al. (2015)Enhanced visible-light photocatalytic activity of strontium-doped zinc oxide nanoparticles. Materials Science in Semiconductor Processing 32: 152.
  19. Song L, Zhang S, Chen BA (2009) novel visible-light-sensitive strontium carbonate photocatalyst with high photocatalytic activity. Catalysis Communications 10: 1565-1568.
  20. Momenian HR, Gholamrezaei S, Salavati-Niasari M, Pedram B, Mozaffar F, et al. (2013) Sonochemical synthesis and photocatalytic properties of metal hydroxide and carbonate (M: Mg, Ca, Sr or Ba) nanoparticles. Journal of Cluster Science 24: 1031-1042.
  21. Márquezherrera A, Ovandomedina V, Castilloreyes B, Zapatatorres M, Meléndezlira, M, et al. (2016) J. Facile synthesis of SrCO3-Sr(OH)2/PPy nanocomposite with enhanced photocatalytic activity under visible light. Materials 9: 30. [crossref]
  22. Pichat PA (2007) brief overview of photocatalytic mechanisms and pathways in water. Water Science and Technology 55: 167-173. [crossref]
  23. Buxton GV, Greenstock CL, Helman WP, Ross AB (1988) Critical review of rate constants for reactions of hydrated electrons, hydrogen atoms and hydroxyl radicals in aqueous solution. Journal of Physical and Chemical Reference Data 17: 513-886.
  24. Robertson PKJ, Lawton LA, Münch B, Rouzade J (1997) Destruction of cyanobacterial toxins by semiconductor photocatalysis. Chemical Communications 393-394. [crossref]
  25. Feitz AJ, Waite TD, Jones GJ, Boyden BH, Orr PT (1999) Photocatalytic degradation of the blue green algal toxin microcystin-LR in a natural organic-aqueous matrix. Environmental Science and Technology 33: 243-249.
  26. Lawton LA, Robertson PKJ, Cornish BJPA, Marr IL, Jaspars M (2003) Processes influencing surface interaction and photocatalytic destruction of microcystins on titanium dioxide photocatalysts. Journal of Catalysis 213: 109-113 [crossref]
  27. Pelaez M, de la Cruz AA, O’Shea K, Falaras P, Dionysiou DD (2011) Effects of water parameters on the degradation of microcystin-LR under visible light-activated TiO 2 photocatalyst. Water Research 45: 3787-3796. [crossref]
  28. Choi H, Antoniou MG, Pelaez M, De La Cruz AA, Shoemaker JA, et al. (2007) Mesoporous nitrogen-doped TiO2 for the photocatalytic destruction of the cyanobacterial toxin microcystin-LR under visible light irradiation. Environmental Science and Technology 41: 7530-7535 [crossref]
  29. Pelaez M, Falaras P, Likodimos V, Kontos AG, de la Cruz AA, et al. (2010) Synthesis, structural characterization and evaluation of sol-gel-based NF-TiO2 films with visible lightphotoactivation for the removal of microcystin-LR. Applied Catalysis B: Environmental 99: 378- 387.
  30. Andersen J, Han C, O’Shea K, Dionysiou DD. (2014) Revealing the degradation intermediates and pathways of visible light-induced NF-TiO2 photocatalysis of microcystin-LR. Applied Catalysis B: Environmental 154-155: 259-266.
  31. Fotiou T, Triantis TM, Kaloudis T, Hiskia A (2015) Evaluation of the photocatalytic activity of TiO2 based catalysts for the degradation and mineralization of cyanobacterial toxins and water off-odor compounds under UV-A, solar and visible light. Chemical Engineering Journal 261: 17-26.
  32. Fotiou T, Triantis TM, Kaloudis T, O’Shea KE, Dionysiou DD, et al. (2016) Assessment of the roles of reactive oxygen species in the UV and visible light photocatalytic degradation of cyanotoxins and water taste and odor compounds using C-TiO2. Water Research 90: 52-61. [crossref]
  33. Pelaez M, Falaras P, Kontos AG, De la Cruz AA, O’shea K, et al. (2012) A comparative study on the removal of cylindrospermopsin and microcystins from water with NF-TiO 2-P25 composite films with visible and UV- vis light photocatalytic activity. Applied Catalysis B: Environmental 121-122: 30-39.
  34. Eberson L (1982) Electron-Transfer Reactions in Organic Chemistry, Advances in Physical Organic Chemistry 18: 79-185.
  35. Neta P, Huie RE, Ross AB (1988) Rate constants for reactions of inorganic radicals in aqueous solution. Journal of Physical and Chemical Reference Data 17: 1027-1284.
  36. Wang Y, Hong C (1999) Effect of hydrogen peroxide, periodate and persulfate on photocatalysis of 2- chlorobiphenyl in aqueous TiO2 suspensions. Water Research.33: 2031-2036.
  37. Legrini O, Oliveros E, Braun AM (1993) Photochemical processes for water treatment. Chemical Reviews 93: 671-698. [crossref]
  38. Anipsitakis GP, Dionysiou DD (2004) Transition metal/UV-based advanced oxidation technologies for water decontamination. Applied Catalysis B: Environmental 54: 155-163.
  39. Anipsitakis GP, Dionysiou DD, MA Gonzalez (2006) Cobalt-mediated activation of peroxymonosulfate and sulfate radical attack on phenolic compounds, Implications of chloride ions. Environmental Science and Technology 40: 1000-1007. [crossref]
  40. Antoniou MG, de la Cruz AA, Dionysiou DD (2010a) Degradation of microcystin-LR using sulfate radicals generated through photolysis, thermolysis and e- transfer mechanisms. Applied Catalysis B: Environmental 96: 290-298.
  41. Antoniou MG, De La Cruz AA, Dionysiou DD (2010b) Intermediates and reaction pathways from the degradation of microcystin-LR with sulfate radicals. Environmental Science and Technology.44: 7238-7244.
  42. He X, de la Cruz AA, O’Shea KE, Dionysiou DD (2014) Kinetics and mechanisms of cylindrospermopsin destruction by sulfate radical-based advanced oxidation processes. Water Research 63: 168-178
  43. He X, de la Cruz AA, Hiskia A, Kaloudis T, O’Shea K, et al. (2015) Destruction of microcystins (cyanotoxins) by UV-254 nm-based direct photolysis and advanced oxidation processes (AOPs): Influence of variable amino acids on the degradation kinetics and reaction mechanisms. Water Research.74: 227-238. [crossref]
  44. Antonopoulou M and Konstantinou IK (2014) Effect of oxidants in the photocatalytic degradation of DEET under simulated solar irradiation in aqueous TiO2 suspensions. Global NEST Journal 16: 507-515.
  45. Augugliaro V, Baiocchi C, Prevot AB, García-López E, Loddo V, et al. (2002) Azo-dyes photocatalytic degradation in aqueous suspension of TiO2 under solar irradiation. Chemosphere .49: 1223-1230. [crossref]
  46. Saquib M and Muneer M (2003) TiO2/mediated photocatalytic degradation of a triphenylmethane dye (gentian violet), in aqueous suspensions. Dyes and Pigments 56: 37-49.
  47. Hummers Jr WS and Offeman RE (1958) Preparation of graphitic oxide. Journal of the American Chemical Society 80: 1339.
  48. Xu Z, Li Q, Gao S, Shang JK (2010) As(III) removal by hydrous titanium dioxide prepared from one-step hydrolysis of aqueous TiCl4 solution. Water Research 44: 5713-5721. [crossref]
  49. Fu J, Gong Y, Cai Z, O’Reilly SE, Zhao D (2017) Mechanistic investigation into sunlight- facilitated photodegradation of pyrene in seawater with oil dispersants. Marine Pollution Bulletin 114: 751-758.
  50. Lindsey ME and Tarr MA (2000) Quantitation of hydroxyl radical during Fenton oxidation following a single addition of iron and peroxide. Chemosphere 41: 409-417. [crossref]
  51. Eaton AD, Clesceri LS, Rice EW, Greenberg AE, Franson MAH. (2005) Standard Methods for the Examination of Water and Wastewater’, Ed. by Franson MAH, (21th ed.), American Public Health Association (APHA), American Water Works Association (AWWA), Water Environment Federation (WEF), American Public Health Association (APHA)
  52. Alavi MA, Morsali A (2010) Syntheses and characterization of Sr(OH)2 and SrCO3 nanostructures by ultrasonic method. Ultrasonics Sonochemistry 17: 132-138. [crossref]
  53. Thamaphat K, Limsuwan P, Ngotawornchai B (2008) Phase characterization of TiO2 powder by XRD and TEM Kasetsart. Journal of Natural Sciences 42: 357-361.
  54. Huang S.-T, Lee WW, Chang J-L, Huang W-S, Chou S.-Y(2014) Hydrothermal synthesis of SrTiO3 nanocubes: characterization, photocatalytic activities, and degradation pathway. Journal of the Taiwan Institute of Chemical Engineers 45: 1927-1936.
  55. Wysmulek K, Sar J, Osewski P, Orlinski K, Kolodziejak K, et al. (2017) SrTiO3-TiO2 eutectic composite as a stable photoanode material for photoelectrochemical hydrogen production. Applied Catalysis B: Environmental 206: 538-546
  56. He Z, Sun X-Y, Gu X (2017) Electrospinning fabrication of SrTiO3: Er3+ nanofibers and their applications of upconversion properties. Ceramics International 43: 7378-7382.
  57. Kyzas GZ, Travlou NA, Deliyanni EA (2014) The role of chitosan as nanofiller of graphite oxide for the removal of toxic mercury ions. Colloids and Surfaces B: Biointerfaces113: 467-476.
  58. Lowell S (1979) Introduction to Powder Surface Area. John Wiley & Sons
  59. Chakinala AG, Gogate PR, Chand R, Bremner DH, Molina R, et al. (2008) Intensification of oxidation capacity using chloroalkanes as additives in hydrodynamic and acoustic cavitation reactors. Ultrasonics Sonochemistry 15: 164-170. [crossref]
  60. Fu J, Kyzasc GZ, Cai Z, Deliyanni EA, Liu W, et al. (2018) Photocatalytic degradation of phenanthrene by graphite oxide-TiO2-Sr (OH)2/SrCO3 nanocomposite under solar irradiation: Effects of water quality parameters and predictive modelling. Chemical Engineering Journal 335: 290-300.
  61. Chen J, Peijnenburg WJGM, Quan X, Chen S, Martens D, et al. (2001) Is it possible to develop a QSPR model for direct photolysis half-lives of PAHs under irradiation of sunlight? Environmental Pollution 114: 137-143. [crossref]
  62. Kanagaraj T and Thiripuranthagan S (2017) Photocatalytic activities of novel SrTiO3-BiOBr heterojunction catalysts towards the degradation of reactive dyes. Applied Catalysis B Environmental 207: 218-232.
  63. Cavalcante RP, Dantas RF, Bayarri B, González O, Giménez J, et al. (2016) Photocatalytic mechanism of metoprolol oxidation by photocatalysts TiO2 and TiO2 doped with 5% B: primary active species and intermediates. Applied Catalysis B: Environmental 194: 111-122.
  64. Anipsitakis GP and Dionysiou DD (2003) Degradation of organic contaminants in water with sulfate radicals generated by the conjunction of peroxymonosulfate with cobalt. Environmental Science and Technology 37: 4790-4797. [crossref]
  65. Konstantinou IK and Albanis TA (2004) TiO2-assisted photocatalytic degradation of azo dyes in aqueous solution: Kinetic and mechanistic investigations: A review. Applied Catalysis B Environmental 49: 1-14.
  66. Antoniou MG, Nicolaou PA, Shoemaker JA, de la Cruz AA, Dionysiou DD (2009) Impact of the morphological properties of thin TiO2 photocatalytic films on the detoxification of water contaminated with the cyanotoxin, microcystin-LR. Applied Catalysis B: Environmental 91: 165-173.

Wilyman Report on Vaccines: How do We Handle the Next Pandemic, Small, Large or ‘Predicted’?

DOI: 10.31038/IDT.2022321

Abstract

Censorship and active suppression of science and medicine exercised on scale during the COVID-19 pandemic has prevented the wide circulation of legitimate scientific inquiry, critical analysis and discussion. Together with the vaccination failure itself, as foreshadow by Judy Wilyman, the officially sanctioned censorship is now the No.1 issue of our time. It has involved the lockstep behaviour of BigPharma, the Main Stream Media, Big Tech, Governments, Peak Medical, Scientific and Public Health authorities. How did this happen? What are the well spring roots of this extraordinary co-ordinated active suppression of legitimate alternative viewpoints and data analysis in science and medicine?

Introduction – Origin and Global Spread COVID-19

My scientific colleagues and I have been tracking and endeavouring to understand, and thus explain, the space origins and global spread of COVID-19 since late 2019 – early 2020 [1]. We have had to vigorously confront this censorship head on in order to get our scientific message and narrative into the public square. We have tried many ‘publication’ routes to circumvent the pernicious influence of media-sanctioned censorship, both popular press and scientific press.

Our first attempt, an article for the general reader intended for publication in The Australian newspaper was spiked – despite prior back and forth telephone negotiated discussion with then Editor John Lehmann in the first week of February 2020 – by the newspaper’s Health Writer/Editor Natasha Robinson … “because on peer review with your epidemiology and infectious diseases colleagues in Australia, no one believes your explanation” [2]. Of course, that was not the point at all, and I warned both Robinson and Lehmann in prior email and telephone communications that we should not be ‘peer reviewed’ and gave my reason: – a balanced and supposedly fair newspaper like The Australian should have simply let our scientific story ventilate in the public mix of explanations irrespective of the story clashing with conventional received wisdom.

However, it is now clear to many of us that any deviation from the main-stream narrative that COVID-19 jumped from an infected bat or pangolin virus reservoir at a Wuhan wet market or from a Wuhan virus research laboratory could not be ventilated. Our coherent and evidence-based explanation on COVID-19 space origins and global spread by global prevailing wind systems, as well as our analysis of the subsequent vaccination failures and adverse reaction rates has been actively suppressed by continuous mainstream censorship. It is evident that powerful webs of official corruption, influence and collusion between the main stream media have included: Big Tech (Google, Facebook, etc particularly in Australia by Rupert Murdoch’s News Corp); BigPharma (pharmaceutical industry) pushing the vaccine rollouts around the world; National and Federal government endorsement of mandatory vaccinations by all political persuasions, and supported by administrators of our public health policies and pandemic responses. This was implemented through such government health administrative bodies which include: the TGA (Therapeutics Goods Administration, Australia), AMA (Australian Medical Association), ATAGI (Australian Technical Advisory Group on Immunisation), AHPRA (Australian Health Practitioners Regulatory Agency)- equivalent and similar bodies exist in most of the Western Democracies e.g. SAGE (Scientific Advisory Group for Emergencies, Gov. UK), FDA (Food and Drug Administration USA), CDC (Centers for Diseases Control USA).

The Wilyman PhD Thesis

My main motivation in reviewing Judy Wilyman’s 2015 PhD thesis has been to further ventilate her important research, scholarship and evidence-based analyses on how the present public health catastrophe in the response to the COVID-19 pandemic, has unfolded from an evidence-based historical perspective [3]. It has deep historical roots in the commercial profit-inspired modus operandi of the pharmaceutical industry producing vaccines for at least the past 35-40 years.

The issue of how effective the mandated political coercion and lack of informed consent has been in the COVID-19 vaccine roll-out, particularly in Australia and Great Britain, has also been exposed repeatedly and separately by the independent Australian researcher Elizabeth Hart.

See: Compulsory Vaccination and the Media – The Australian Experience, 12 May 2015 or https://davidhealy.org/compulsory-vaccination-and-the-media-the-australian-experience/ Censorship of comments re vaccination policy by The Conversation, 24 April 2016, or https://elizabethhart.files.wordpress.com/2019/05/gmail-censorship-of-comments-re-vaccination-policy-by-the-conversation.pdf; and see her website on investigating the gross over-use of vaccine products and conflicts of interest in vaccination policy vaccinationispolitical.net. Finally listen to her forthright interview on mandated vaccine coercion by Governments, Big Business, Bill and Melinda Gates Foundation, and BigPharma on TNT Radio “Politically Incorrect”, with Mike Tennessee & Richard (Dick) Carsson, Saturday 28 May 2022, https://tntradiolive.podbean.com/e/elizabeth-hart-on-politically-incorrect-28-may-2022/

Accordingly, in my review of the Wilyman thesis all relevant public domain papers and interviews are cited and listed with direct embedded URL links. These include references to: traditional peer-reviewed journal outlets; fast accelerated non-peer reviewed and thus non-censored outlets (Virology Current Research, Infectious Diseases and Therapeutics); URL links to actual interviews as Videos and /or Podcasts as important public records that can be cited legitimately and accessed on non-censored internet sites. These citation actions are because of the necessity for us to get our unfolding COVID-19 epidemiological and genetic data and analysis out into public domain, unfiltered, so other objective interested parties can then peer review our conclusions if they want to – nothing has been hidden or held back, including potential mistakes that will be revealed by further data and analyses in the fullness of time.

Recommended Wilyman Citations and Associated Key Published Papers

These are in Reference list but highlighted first here as a dot-point list:

The Wilyman thesis is in two main parts: First a detailed description of all the cohesive corruption pathways brought about by the pharmaceutical (BigPharma) industry’s commercial agenda in influencing government policy, university research funding (and thus the formal peer reviewed scientific literature), peak medical and regulatory bodies down to the medical coal-face of family doctors and medical specialists – who often get de-listed by the Australian Health Practitioners Regulatory Agency (AHPRA) if they question AMA/AHPRA directives on any of the COVID medical mandates (e.g. Queensland’s Dr Robert Brennan who interviews Specialist Gastroenterologist Dr Andrew McIntyre on TNT Radio https://tntradiolive.podbean.com/e/dr-andrew-mcintyre-on-an-hour-with-robert-brennan-11-may-2022/). This topic occupies content at great depth and length in Chapters 2 through 8 inclusive. This is to be expected in a PhD thesis – great depth of analysis at all crucial levels. I read most but skipped sections that to me were repetitive or obvious, as adjudged by my prior 50 years of lived experience of research funding and its administration in universities and biomedical research institutes. Second a detailed review of the recent science on the foundations of the origins of epidemics and pandemics small, large or ‘created’. This is reviewed and analysed in Chapters 9,10, particularly the roll out of the vaccines actually deployed in two succinct exemplar “created” or “low risk mortality” pandemics: Human Papilloma Virus (HPV) vaccines and protection against cervical cancer (Chapter 9) and the Swine Flu Pandemic 2009 (Chapter 10).

There is much overlap between these two themes and all chapters need to be read and understood to grasp the whole Wilyman achievement, particularly Chapter 2 first which introduces essential foundation concepts. On the issue of actual origins of genuine pandemics throughout history like the recent series of very familiar Influenza pandemics of the 20th Century – such as 1918-19 Spanish Flu and others such as Asian Flu 1957 and Hong Kong Flu 1968, including Swine Flu 2009 – Wilyman’s explanations understandably rely on the mainstream narrative as represented in Hays [7]. This story is familiar: the original viral or pathogen origins begin in an undetected animal reservoir (e.g., chickens, birds, swine, bats, monkeys, camels etc.) and then rapidly jumps to humans by an accumulation of discrete genetic mutations to become a human pathogen, and then rampant person-to-person spread (P-to-P). This traditional understanding of how pandemics emerge and spread in history is of course precisely what our recent work with COVID-19 challenges head on [1,8-10].) and is based, as indicated, on the prior ground breaking epidemiological analyses and historical examples of the 1979 book by astrophysicists and astrobiologists Fred Hoyle and N. Chandra Wickramasinghe now re-printed and updated [11,12].

The tendency of peak health authorities and infectious disease experts to prefix an animal name to the new emerging disease distorts our understanding of the real origins discussed by Hoyle and Wickramasinghe [11]. When a new pathogen comes in like this suddenly from space (protected in putative carbonaceous meteorite dust) some pathogen varieties may also equally infect animals and humans to varying degrees at the same time. That needs to be clearly understood. The full host-range and thus infectivity and spreadability (person-to-person) is unknown at that point. So on the emergence of genuine pandemics throughout history I would disagree with Judy’s mainstream origins assumptions (based on Hayes [7]), but agree with every other aspect of her analyses – on vaccine non-performance, high incidence of adverse events, undone science and the powerful forces of political and financial coercion she describes in clear detail. The problem is, as she clearly shows, that several of the more recent pandemics have been insignificant and of low risk to life no more serious than seasonal Flu mortality (Swine Flu 2009, Chapter 10), or literally ‘created’ as with the roll out of the HPV vaccine to ‘protect women against developing cervical cancer’ (Chapter 9). This led me to question the effectiveness, and thus relevance, of all our prior work on COVID-19’s space origin and subsequent spread by prevailing wind systems [1]. Even if our main recommendations are implemented on global near-Earth surveillance for incoming meteorite pathogens as well as the introduction of safe and effective oral-nasal vaccines for any future respiratory pathogen (cold or flu) the cohesive chains of BigPharma-controlled corruption would ensure all our work on understanding the origin and global spread of COVID-19 would come to naught.

This depressing thought means that pretty well all of Judy Wilyman’s research recommendations (and Elizabeth Hart’s independent analysis and conclusions) need implementation. This is the political challenge:  How do we break these causal corruption chains for the next really big global pandemic? e.g., globally dispersed like COVID-19, even though only a low risk ‘common cold’ virus in the present case [1,9]. The biggest casualty is public trust in our political and health care institutions. Many of us have experienced it directly in Australia, particularly in Victoria where the public health system has frayed or collapsed due to incompetent government pandemic control policies. The cohesive web of corruption revealed by Wilyman’s research is on a massive scale. Particularly all the fault lines revealed by the ‘undone science,’ yet sold as ‘settled science’ to a trusting public. To me the corruption chain is very clearly outlined and can be summarised in the bolded symbolic sequence:

BigPharma $$$<>Government/Politicians<>TGA/FDA, CDC<>AMA, AHPRA, ATAGI<>Research funding in Institutes and Universities<>Family doctors, specialists in hospitals at the medical frontline.

The excitation of fear among frontline doctors fearing de-listing by AHPRA has been staggering to witness by us all who have any medical condition requiring treatment. To be perfectly blunt all the authorities higher up the chain from the frontline have literally been ‘bought off’ so BigPharma can make huge profits. It is a gargantuan scandal, and the COVID-19 response has been a massive public health failure. So again, the question is – How do we break these causal corruption chains in order to handle the next really big genuinely lethal global pandemic, which will inevitable come to our shores?

The first requirement in Australia is that the TGA, the body the public trusts in approving new medicines and vaccines for human use must not receive any funds at all from the pharmaceutical industry– as is the case at present. It must be truly independent – and make the approval or rejection calls based on clear answers to questions like:

  • What is the undone science with this medicine or vaccine?
  • Does it protect human beings from the target disease or does it supply effective safe therapy for the disease or medical condition?
  • How safe is this drug, medicine or vaccine really in the short, medium and long term?

Water-tight unbiased decisions based on evidence must be performed by the TGA – which is clearly not the case at present with COVID-19 vaccines, which have not protected anyone anywhere in the world from catching COVID-19 as we have discussed [1,9,13,14]. Updates on the COVID-19 vaccine in-effectiveness on this issue by the current work of Judy Wilyman and associates can be viewed at People for Safe Vaccines  https://www.peopleforsafevaccines.org.

The entrenched corruption actually enfeebles us – and weakens us, and destroys our ability to act in the public interest in real medical emergencies. We have been lucky with COVID-19. The fact is that COVID-19 is ‘lethal’ – resulting in death – for only a very small faction of the unvaccinated population, perhaps 0.1% of all those exposed to COVID-19 (in the “Immune Defenceless Elderly Co-morbid” portion of the human population). Prior to the vaccine roll-outs this was clear [1,9] even by Dr Fauci and associates [15]. Indeed, all the indications from the publicly available Australian medical COVID-19 epidemiological data analysed by Wilyman and associate Sandy Barrett indicates the COVID-19 associated death rate actually increases (in linear regression) with increasing numbers of vaccine doses, implying a causal role for vaccination itself increasing the COVID-19 associated death rate [16]. This conclusion follows the Omicron strikes since mid- Dec 2021 [1] – the serial vaccinations and boosters are not only ineffective in protection against contracting COVID-19 but are actually causing COVID-19 associated death in vulnerable citizens – this is an appalling public health outcome on a mass scale as vaccination have been widely mandated by intense coercion in Australia to protect people against COVID-19 and stop them spreading the disease.

Precautionary Principle

So, the “Precautionary Principle” [5] which in medicine itself clearly advises “First do no Harm” has been misused, abused and violated by all BigPharma, Governments, Politicians, Public Servants, Public Health Officials and their main bodies in Australia such the AMA, TGA, AHPRA, ATAGI and others. To quote Wilyman [5]: “When the precautionary principle is reversed to put the burden of proof of harmlessness on the general public, instead of the pharmaceutical companies and governments then it can be used to protect the vested interests of industry in government vaccination policies and not the health of the general public.” It represents a massive scandal and betrayal of trust in scientific medicine. One cannot ‘gild the lily’ on this – a blunt confrontation with reality is required by all officials involved in Australia responsible for public health care provision and vaccine roll outs, which were mandated and unleashed on a trusting public – a putative and experimental new generation mRNA Spike protein expression-vector supposed protective medicine that is ineffective as it provides no protective benefit, and is positively dangerous with high adverse event rates, because it was not adequately safety tested that is, the “undone science” as put by Wilyman [3]. The first step is to publicly admit this massive failure and then a genuine honest reform process to begin, to ensure it never happens again in Australia or anywhere else in the world. Other biomedical scientists are making the same call [17,18].

Dangers of All Recent Vaccine Roll-Outs of the past 30-40 Years

The health of our children these past 25 or so years has been weakened and compromised by repeated vaccination early in life, with different antigen types and adjuvants. We have known this for at least 10 years. Thus, the real rise in infant mortality rates in the first year of life (Sudden Infant Death Syndrome, or SIDS) is causally related (linear regression) to the number of vaccine doses routinely given in the first year of life Miller and Goldman [6]. This is the tip of the iceberg disaster and violation of the Precautionary Principle. See Tables 1 and 2 present in Miller and Goldman study [6].

Even a casual observer will ask: What of all those newborn children who do not die suddenly before one year of age? How many will carry chronic debilitating developmental diseases into later life (e.g., allergies, autoimmune disorders, autism-spectrum disorders, through full blown autism)?  If vaccine-induced extreme outcome in the first year of life is death, the real rate of chronic maladies in survivors can only be imagined. The National Disability Insurance Scheme (NDIS) has been set up in Australia to handle the acknowledged rise in many debilitating chronic diseases over the past few decades – is there a connection between early life multiple and booster vaccinations (of all antigenic types) and the political need to introduce a NDIS program? (The question posed recently on TNT Radio by presenter Richard Carsson who made the connection live on air https://tntradiolive.podbean.com/e/professor-edward-j-steele-on-politically-incorrect-07-may-2022/).

Thus in 2009 a country with almost the lowest Rank in SIDS, Sweden with an Infant Mortality Rate (IMR) at 2.75 Deaths per 1000 births each child had a total number of childhood vaccine doses of 12 (covering the standard series Diptheria, Tetnus, Pertussis, Polio etc). In Australia and the United States (including Canada and Netherlands) the number of vaccine shots in the first year of life rises to 24-26 with an IMR per 1000 births of 4.73 – 6.22 (latter rate is for the USA).  If we assume that there are 10-20 times more living with chronic maladies this means at one extreme one 1 in 8 children in the United States may suffer a vaccine-induced chronic disease in later life. It is not surprising there has been a rise in chronic diseases in the generations born 20-30 years ago. This is a scandalous implication of the real world publicly available data published in 2011 by Miller and Goldman [6] and other data discussed and analysed by Judy Wilyman. This means that all vaccination of new born babies must cease immediately– if we are to retrospectively apply the Precautionary Principle as clearly articulated by Judy Wilyman [3,5] and the clear principle of seeking  Informed Consent from a patient prior to a medical intervention outlined by Elizabeth Hart (vaccinationispolitical.net).

Creation of a Public Health Pandemic by BigPharma for Low-Risk Diseases with much UNDONE Science

Wilyman [3] in Chapters 9 and 10 analyses examples of low risk-to-life, yet created and beat up, recent Pandemics (Chapter 9 Human Papilloma Virus and Cervical Cancer; Chapter 10 2009 Swine Flu Pandemic) The sequence is familiar: create fear of a serious pandemic real or imagined, then roll out the campaign by government and big business by mandated coercion for mass vaccination “to protect yourself, your family and the community” against catching the disease. This sounds like a familiar story. The most successful campaign in my mind prior to the COVID-19 mass vaccination effort was the campaign to vaccinate girls and women with “a vaccine to protect them from developing cervical cancer”.

Human Papilloma Virus (HPV) and Cervical Cancer

Human Papilloma Virus (HPV) is a sexually transmitted endemic disease across the developed and developing world.  In women the virus infects and grows in the mucosal epithelial surfaces of the genital tract. It can, as a result of sexual activity, flourish also in the oral-nasal mucosa and upper respiratory tract and can be transmitted via infected penile surfaces. It is not normally known to spread via the blood or lymph to other tissues. There are some 18-20 HPV variant strains in circulation and two dominate (#16, #18) in both the developed and developing world. However, the global strain composition differs between the developed and developing world – in the developing world many other minor strains are prominent in circulation frequency. HPV infection and exposure is a known necessary co-factor for the development of cervical cancer in later life which is the crux of how Big Pharm created the global pandemic, namely ‘exposure to HPV infection in the female genital tract causes cervical cancer later in life’ ergo ‘we need to immunise women and girls against HPV’. However, as Wilyman explains, while there is a precursor HPV association there are many other co-factors predisposing to cervical cancer such as general sanitation and public health measures, multiplicity of sexual partners, fresh water, nutrition and poverty, and general quality health care/surveillance (regular Pap smears). This precursor relationship is akin to UV light exposure in childhood tropical zones (particularly for the fair skinned) increasing the risk of suspicious skin moles in later life (in situ skin cancers) and thus leading eventually to malignant spreading melanoma if left untreated – all of which can be prevented by regular skin checks and excision of all suspicious moles. The same efficacy for early detection and removal of suspicious cervical growths applies to prevention of cervical cancer. In the developed world the incidence is very low perhaps 0.1% of all those HPV exposed and the regular Pap smear surveillance catches them early. The same applies to the developing world but all the other co-factors listed play a role in high incidence of both HPV strains and cervical cancer.

There is no doubt that systemic intramuscular (jab in the arm) vaccination, given over several shots can reduced the targeted strain incidence in the cervical mucosal [19] – thus systemic immunisation can induce both IgG and secretory IgA and thus purifying immunity at mucosal surfaces in the genital tract [20]. But does such elimination of dominant HPV strains decrease the incidence of cervical cancer later in life?  It is clear from Wilyman’s analysis there is no evidence for this second main claim which is the whole scientific basis of the HPV vaccine roll out since 2006. And that is the ‘necessary problem’ which BigPharma created by a massive fear campaign in young girls and woman “to get the jab” or “you will die of cervical cancer”. Given what has now happened with COVID-19 this sounds familiar. Front line doctors in the USA were co-opted in the education campaign and paid $4,200 to deliver ‘townhall’ public lectures on the necessity of women and girls “to get the HPV jab”, PowerPoint presentations and talking points provided by the vaccine manufacturers. Indeed, reading all the evidence laid out by Wilyman (Chapter 9) there is NO evidence that HPV vaccination has had any impact on cervical cancer incidence. There was no HPV-Cervical cancer pandemic. That had to be literally created by BigPharma. And it is clear that the massive vaccination roll out for the HPV vaccine was a controlled-for-profit BigPharm fraud operation on a truly global scale. And, of course, safety testing for adverse events and vaccine injury in later life has not been systematically undertaken in the vaccinated versus unvaccinated groups (and probably never will be now).

For me personally I now understand how the COVID-19 vaccine roll out in Australia was so successful. Thus, our now departed Health Minister Greg Hunt and our now departed former Prime Minister Scott Morrison were publicly declaring circa mid 2020 that “Australia would be a fully vaccinated country to begin in the second half 2021 and to be completed by December 2021” – in order to keep us all safe. The propaganda campaign in the mass media led by News Corp, the major TV networks and the taxpayer-funded ABC was at saturation – necessary in all propaganda campaigns as we all well know [4]. I was distracted with many other COVID-19 issues at that time (mid 2020) – but I now understand how and why the Morrison government was so confident in achieving success “in vaccinating the entire country” by Christmas 2021. Like the clear end-destinations known in advance when laying down new tram tracks or new railway tracks, teams of specialist workers swing into action and roll out the tracks in record time like a well-oiled machine of co-ordinated linesman and operators. At all levels in the cohesive chain of corruption set up by BigPharma the global vaccine operation was ruthlessly rolled out, as indicated earlier:-

BigPharma $$$<>Government/Politicians<>TGA/FDA, CDC<>AMA, AHPRA, ATAGI<>Research funding in Institutes and Universities<>Family doctors, specialists in hospitals at the medical frontline.

Thus, all the established corruption chains and pathways were in place and President Trump’s “Operation Warped Speed” just needed the greenlight. And given the association of the word “vaccine” in the trusting public mind with “safe protection against catching a deadly COVID infection that can kill you” most of the population complied with mandatory vaccination or forced tragically to comply or lose their employment.

The Swine Flu Pandemic of 2009 (Chapter 10)

A similar low death-risk seasonal Flu very much like COVID-19 emerged suddenly in parts of Mexico and then California in April 2009, and was hypothesized to have arisen first in domestic pigs then jumped to humans prior to P-to-P spread. The segmented Flu genome was a reassortment of derivatives of known bird, swine and human flu viruses combined further with a Eurasian pig flu virus- so it was a unique and complex segmented genome reassortment or shuffling of prior known genomic segments [21]. As it was also a variant of the H1N1 serotype, the same serotype as the Spanish Flu 1918-19, the WHO put the world on alert to further pandemic spread. And Swine Flu certainly did appear to infect many developed countries (incidence in Africa was low), but it was no more lethal than a seasonal influenza outbreak – the vulnerable patients very similar to the age and co-morbidity profile seen with COVID-19. The most vulnerable were the Immune Defenceless Elderly Co-morbids, the death rate being 0.1% of all those exposed to Swine flu 2009 (c.f. Steele, Gorczynski, Rebhan et al [9]). By August 2010 infection rates had subsided and then largely disappeared.

It is highly unlikely that the Swine Flu 2009 arose by mixed infections of pigs with multiple strains, then genomic segment shuffling at viral assembly during mixed cellular infections with the various precursor strains in the same infected cells. A direct experiment to test this origins hypothesis yielded negative results i.e., no fully assembled Swine Flu 2009 variant of H1N1 serotype emerged with the total combination of expected segments in any multiple infected test pigs [22].

In most flu seasons it is well known the vaccine protective efficacy is usually low and variable – one reason being that the vaccines are prepared for the variants in circulation in the previous season, thus during antigenically unmatched years [23]. There are other reasons, mainly the failure, as with all current ineffective COVID-19 intramuscular jab in the arm vaccines, to stimulate protective oral-nasal mucosal immunity involving secretory IgA and other aspects of cellular mucosal immunity including elevated Innate Immunity [1,14]. What then of the protective efficacy of the vaccination program roll out to protect against Swine Flu 2009 during that pandemic 2009-2010?  Indeed, in closely reading Wilyman’s summary of the machinations by the WHO and national governments in declaring a pandemic for this minor Flu illness in most infected people, it is not clear that the vaccine roll out in anyway contributed to protecting anyone against Swine flu 2009. A result strikingly similar to the lack of protective efficacy for the jab-in the-arm vaccine roll out against COVID-19 [13,14]. It was also clear from the global COVID-19 epidemiology and vaccination rate data that the pandemic as measured by the metric “% COVID-19 Associated death” was in steep decline via Natural Herd Immunity processes in 2020 and early 2021 well before the vaccine roll out had begun in many Northern Hemisphere infected zones [24]. It is hard to avoid Wilyman’s major conclusion that the Swine Flu 2009 pandemic “was created for profit” – although global in its infection reach, it was so minor in severity the only motivation for a massive vaccine roll out would be the profit motive by BigPharma producing millions of vaccine doses as requested by national governments.

Has Judy Wilyman’s Scholarship and Research been a Success?  A Deep Dive read of Judy Wilyman’s PhD Thesis (2015)

Apart from diligent PhD supervisors and commissioned academic peer-reviewers many of us do not have the time in our busy lives to actually read PhD theses -it can be heavy going. But this thesis was a clear exception.  I did read it through and I learnt a lot and had the scales lifted from my eyes. Wilyman’s work is the result of about 20 years research and analysis – it is extensive, systematic, scholarly, balanced, and thoroughly researched. In Wilyman’s own words “The aim of this thesis is to examine the complex relationship between policy development and scientific knowledge in order to assess the adequacy of the Australian government’s National Immunisation Program (NIP) in protecting public health.” This goal has been overwhelmingly achieved. It is pretty clear to me, as a biomedical scientist with 50 years’ experience trained in microbiology and immunology that Australia’s immunization program needs a complete re-think and overhaul at every level: scientific, medical, administrative and political. And this conclusion would apply to all comparable developed countries that Australia likes to compare itself. This will be one of the few books that will still be read hundreds of years hence. The other is on the origins of suddenly emergent pandemics throughout human history – the 1979 science masterpiece by Fred Hoyle and N Chandra Wickramasinghe “Diseases from Space” [11]. Arthur Koestler, the great expatriate Hungarian and British writer, war correspondent, philosopher, historian of science and staunch fighter against communist totalitarianism (particularly in Soviet Russia), often used to state “He was writing for the reader of the future perhaps 100 years hence” – that was his benchmark and I agree with him. Judy’s thesis will still be read and re-read hundreds of years from now, providing of course mankind does not self-destruct.

Two Final Thoughts

Immunology and protective vaccination programs need to return to their historical roots – mimic natural infection as much as possible, via portal of entry of vaccine and type: traditional defective whole virus or whole cell, attenuated fully safety tested vaccines. The elevation of local frontline mucosal Innate Immunity will assist all vaccine protective efficacy for those respiratory pathogens that enter first oral-nasally – current experimental data are very encouraging in this regard [25-27]. Professionals in Public Health at ALL levels, should not accept money at all from the pharmaceutical industry especially regulatory authorities such TGA, AMA, ATAGI, AHPRA and public health training Research Institutes and Universities with regard to the production and testing of medicines and vaccines. That would include such inducements as conference trips, public education lecture fees, and Research grants accepted with no strings attached to the pharmaceutical industry- BigPharma of course can do its own in-house research but has to be closely controlled and supervised in any financial support to universities and research institutes.

Acknowledgement

I thank Dr Judy Wilyman for comment on an earlier version of the manuscript.

References

  1. Steele EJ, Gorczynski RM, Lindley RA, Carnegie PR, Rebhran H, et al. (2022) Overview SARS-CoV-2 Pandemic as January-February 2022: Likely Cometary Origin, Global Spread, Prospects for Future Vaccine Efficacy. Infectious Diseases and Therapeutics 3: 1-16. DOI: 31038/IDT.2022311
  2. Wickramasinghe NC, Steele EJ (2020) The Coronavirus May Have Come from Space. At archive site viXra:2002.0118 and https://vixra.org/abs/2002.0118
  3. Wilyman J (2015). A critical analysis of the Australian government’s rationale for its vaccination policy, Doctor of Philosophy thesis, School of Humanities and Social Inquiry, University of Wollongong. https://ro.uow.edu.au/theses/4541
  4. Robinson, Piers (2021) Covid is a Global Propaganda Operation ASIA PACIFIC TODAY Published August 4, 2021 https://rumble.com/vkppo0-covid-is-a-global-propaganda-operation.html
  5. Wilyman J (2020) Misapplication of the Precautionary Principle has Misplaced the Burden of Proof of Vaccine Safety. Science, Public Health Policy, and The Law 2: 23-33. Ethics in Science and Technology The Misuse of the Precautionary Principle in Government Vaccination Policy (An Institute for Pure and Applied Knowledge (IPAK) Public Health Policy Initiative (PHPI) or https://www.semanticscholar.org/paper/Misapplication-of-the-Precautionary-Principle-has-Wilyman/ed068937c7275bc0e060139cc35e207bf390fede
  6. Miller NZ and Goldman S. (2011) Infant mortality rates regressed against number of vaccine doses routinely given: Is there a biochemical or synergistic toxicity? Human Experimental Toxicology, 30: 1420–1428. [crossref]
  7. Hays JN. (2000) The Burden of Disease: Epidemics and Human Response in Western History. New Brunswick, NJ: Rutgers University Press.
  8. Steele EJ, Gorczynski RM, Rebhan H, Carnegie P, Temple R, et al. (2020) Implications of haplotype switching for the origin and global spread of COVID-19 Virologl Current Research 4: 2. DOI: 37421/vcrh.2020.4.135
  9. Steele EJ, Gorczynski RM, Rebhan H, Tokoro G, Wallis DH, et al. (2021) Exploding Five COVID-19 Myths on the Origin, Global Spread and Immunity. Infectious Diseases and Therapeutics. 2: 1-15. DOI: 31038/IDT.2021223
  10. Steele EJ, Gorczynski RM, Lindley RA, Tokoro G, Temple R, et al. (2020) Origin of new emergent Coronavirus and Candida fungal diseases- Terrestrial or Cosmic? Advances in Genetics 106: 75-100. [crossref]
  11. Hoyle F, Wickramasinghe NC (1979) Diseases from Space JM Dent Ltd. London.
  12. Wickramasinghe C (2020) Diseases from Outer Space 2nd reprint edition “Diseases from Space” World Scientific Publishing Co, Singapore.
  13. Subramanian SV, Kumar A (2021) Increases in COVID-19 are unrelated to levels of vaccination across 68 countries and 2947 counties in the United States. European J Epidemioogyl 36: 1237-1240. https://doi.org/10.1007/s10654-021-00808-7
  14. Gorczynski RM, Lindley RA, Steele EJ, Wickramasinghe NC (2021) Nature of Acquired Immune Responses, Epitope Specificity and Resultant Protection from SARS-CoV-2. Pers. Med 11: 1253. [crossref] https://doi.org/10.3390/jpm11121253
  15. Fauci AS, Lane HC, Redfield RR (2020) Covid-19 — Navigating the Uncharted. New Engl J Medicine 382: 1268-1269. [crossref]
  16. Barrett S, Wilyman J (2022) People for Safe Vaccines at www.p4sv.org/our-work, a site that provides analysis of the raw number across all Australian states prepared from public domain data at https://ourworldindata.org/covid-vaccinations and https://www.peopleforsafevaccines.org/post/scorecard-on-national-plan“.
  17. Alexander, PE (2021) Twenty Steps to End the Madness. Brownstone Institute. https://brownstone.org/articles/twenty-steps-to-end-the-madness/
  18. Blaylock RL (2022) COVID UPDATE: What is the truth? Surgery Neurology International 13:167. [crossref] https://www.ncbi.nlm.nih.gov/pmc/articles/PMC9062939/ and https://www.ncbi.nlm.nih.gov/pmc/articles/PMC9062939/pdf/SNI-13-167.pdf?fbclid=IwAR2w8vecUhAo7Sny8OZXgnPUcR1VeKoh3KNBw4u8II1lOGdcAvVz3-uhJqs
  19. Garland SM, Hernandez-Avila M, Wheeler CM, Perez G, Harper DM, et al. (2007) Quadrivalent Vaccine against Human Papillomavirus to Prevent Anogenital Diseases. New Engl J Medicine 356: 1928–43. [crossref]
  20. Mestecky J, Russell MW (2019) Mucosal Immunity in Sexually Transmitted Infections. In: Diagnostics to Pathogenomics of Sexually Transmitted Infections, pp. 1-26, First Edition. Edited by Sunit K. Singh. © 2019 John Wiley & Sons Ltd. Published 2019 by John Wiley & Sons Ltd. https://complements.lavoisier.net/9781119380849_diagnostics-to-pathogenomics-of-sexually-transmitted-infections_Chapitre1.pdf
  21. Trifonov V, Khiabanian H, Rabadan R (July 2009). “Geographic dependence, surveillance, and origins of the 2009 influenza A (H1N1) virus”. New Engl J Medicine 361: 115–19. [crossref] (https://doi.org/10.1056%2FNEJMp0904572)
  22. Ma W, Liu Q, Qiao C, del Real G, García-Sastre A, et al. (2014) North American triple reassortant and Eurasian H1N1 swine influenza viruses do not readily reassort to generate a 2009 pandemic H1N1-like virus. mBio 5: e00919-13. [crossref]
  23. Osterholm MT, Kelley NS, Sommer A, Belongia EA (2012) Efficacy and effectiveness of influenza vaccines: a systematic review and meta-analysis. Lancet Infect Dis 12: 36–44. [crossref]
  24. Steele EJ, Gorczynski RM, Lindley RA, Tokoro G, Wallis DH, et al. (2021) An End of the COVID-19 Pandemic in Sight? Infectious Diseases and Therapeutics 2: 1-5. DOI:31038/IDT.2021222
  25. Oh JE, Song E, Moriyama M, Wong P, Zhang S, et al. (2021) Intranasal priming induces local lung-resident B cell populations that secrete protective mucosal antiviral IgA. Science Immunology 6: eabj5129. [crossref]
  26. Xiao Y, Lidsky PV, Shirogane Y, Aviner R, Wu CT, et al. (2021) A defective viral genome strategy elicits broad protective immunity against respiratory viruses. Cell 184: 6037-6051. [crossref]
  27. Afkhami S, D’Agostino MR, Zhang A, Stacey HD, Marzok A, et al. (2022) Respiratory mucosal delivery of next-generation COVID-19 vaccine provides robust protection against both ancestral and variant strains of SARS-CoV-2. Cell 185: 896-915. https://doi.org/10.1016/j.cell.2022.02.005

Note in Proof

The scientific journey on vaccine efficacy and safety by the British clinical-biomedical scientist Dr Andrew Wakefield, has direct similarities to the scientific and academic journey on vaccine efficacy and safety of the Australian scholar Dr Judy Wilyman. Both their backgrounds are very different however, their conclusions are very similar, over similar time periods, and the cohesive corruption exerted by the BigPharma consortia as discussed above in both cases attempted to both destroy and smear them and the truthfulness of their scientific discoveries. The most recent interview June 9 2022 of Dr Andrew Wakefield can be found at https://rumble.com/v17xp5j-andrew-wakefield-interview.html

The Unvaccinated versus Vaccinated study mentioned by Dr Wakefield is : Hooker BS, Miller NZ. 2020. Analysis of health outcomes in vaccinated and unvaccinated children: Developmental delays, asthma, ear infections and gastrointestinal disorders. SAGE Open Med. 2020 May 27;8:2050312120925344. doi: 10.1177/2050312120925344. eCollection 2020. https://pubmed.ncbi.nlm.nih.gov/32537156/