DOI: 10.31038/IJVB.2017115
Abstract
The purpose of this study was to document the continued reproducibility of results yielded in different laboratories that perform a monoclonal antibody cocktail-based enzyme-linked immunosorbent assay (macELISA) for detection of allergen specific immunoglobulin IgE in companion animals. Replicate samples of 21 different sera pools were independently evaluated in a single blinded fashion by each of 10 different technicians functioning in 8 different laboratories. For evaluations completed by multiple operators, the average inter-operator variance was calculated to be 7.1% (range = 3.4-10.7%). The average intra-assay variance among reactive assay calibrators in all laboratories was 4.6% (range = 1.6-11.5%). The overall inter-assay inter-laboratory variance evident with reactive calibrators was consistent among laboratories and averaged 12.1% (range 11.2-13.4%). All laboratories yielded similar profiles and magnitudes of responses for replicate unknown samples; dose response profiles observed in each of the laboratories were indistinguishable. Correlation of optical density values observed for individual allergens between and among all laboratories was strong (r > 0.90, p < 0.001) and concordance of results across the entire spectrum of responses exceeded 95%. Collectively, the results demonstrate that the macELISA for measuring allergen specific canine IgE is robust and continues to yield reproducible and consistent results among different operators and between laboratories using the assay.
Keywords
IgE, ELISA, Proficiency, Atopy, Allergy, Immunotherapy
Introduction
The preferred method often selected for intervention in allergic diseases in companion animals encompasses allergen-specific immunotherapy [1-9]. Many clinicians rely on demonstration of IgE-mediated hypersensitivity by allergen-specific IgE serology as the basis for selection of allergens to include in the allergen specific therapeutic regimen [1-11]. One of the most well characterized in vitro assays for detection of allergen specific IgE in dogs for which the development and performance characteristics of the assay have been documented is a monoclonal antibody cocktail-based ELISA (macELISA) manufactured by Stallergenes Greer [11-13]. To ensure validity of the assay results, Stallergenes Greer maintains a proficiency monitoring program for laboratories that routinely run macELISA for evaluation of allergen-specific IgE in serum samples. The foundation for this program is based in the desire for inter-laboratory standardization and quality control measures that ensure the uniformity, consistency, and reproducibility of results among laboratories that perform the assay. This program is designed to evaluate the proficiency of laboratories and ensures that individual operators yield consistent and reproducible results; communication of these results to the veterinary community is an integral component of this program. The inaugural proficiency evaluations, initiated in 2009 and repeated in 2010, in six different laboratories documents that inter-laboratory standardization and quality control measures in the veterinary arena documents that reliability of results between and among laboratories is achievable [12]. Similarly, reproducibility of results among ten different laboratories was documented in the subsequent proficiency evaluations completed in 2013 [13]. The results presented herein summarize the comparative results observed in the affiliate laboratories using macELISA for the proficiency evaluations that were completed in 2016.
Materials and Methods
Eight independent Veterinary Reference Laboratories participated in the 2016 proficiency evaluation. Participating laboratories included three separate IDEXX laboratories located in Memphis, Tennessee, Ludwigsburg, Germany, and Markham, Ontario Canada. Other affiliated European laboratories that participated in this evaluation included Agrolabo (Scarmagno, Italy), ARTU Biologicals (Lelystad, The Netherlands), Univet Diagnostic Services (Barcelona, Spain), and Biovac (Beaucouzé, France). Stallergenes Greer Laboratories (Lenoir, NC) served as the prototype for evaluation of macELISA; the 2016 evaluations in this laboratory included results reported by three separate and independent operators. All serum samples, buffers, antigen-coated wells, calibrator solutions, and other assay components were aliquants of the respective lots of materials manufactured at Stallergenes Greer’s production facilities (Lenoir, North Carolina) and supplied as complete kits to the participating laboratories along with the exact instructions for completing the evaluations. Separate proficiency evaluations were completed in each laboratory from June 2016 through January 2017. Because the performance characteristics of macELISA in Stallergenes Greer’s laboratory have been well documented for use over an extended period, [11-13] all results observed in the other participating laboratories were compared directly with the results observed in Stallergenes Greer’s reference laboratory.
Calibrators
Grass pollen reactive calibrator solutions of predetermined reactivity in the macELISA were prepared as three-fold serial dilutions of a sera pool highly reactive to most pollen allergens. Replicates of each were evaluated in each assay run and served as a standard response curve for normalizing results observed with the various samples. All results were expressed as ELISA Absorbance Units (EAU) which are background-corrected observed responses expressed as milliabsorbance.
Buffers
The buffers used throughout have been previously described, [11-13] and included: a) well coating buffer: 0.05 M sodium carbonate bicarbonate buffer, pH 9.6; b) wash buffer: phosphate buffered saline (PBS), pH 7.4, containing 0.05% Tween 20, and 0.05% sodium azide; c) serum and reagent diluent buffer: PBS, pH 7.4, containing 1% fish gelatin, 0.05% Tween 20 and 0.05% sodium azide.
Allergen Panel
The allergen panel was a 24 allergen composite derived from the array of allergens that are included in the specific panels routinely evaluated in the various laboratories; the composite allergen panel consisted of 4 grasses, 6 weeds, 6 trees, 5 mites, and 3 fungi.
Preparation of Coated Wells
Micro well flat bottom strip assemblies (Immulon 4HBH, Thermo Electron Corporation, Waltham, MA) were used throughout and served as the solid phase for all ELISA evaluations. The twelve well strips were individually coated with the specified allergen extracts following a previously defined procedure [11-13]. Briefly, the individual extracts were diluted in bicarbonate buffer (pH 9.6) and 100 μL was added to each assigned well. Following overnight incubation at 4-8 oC, the wells were washed with PBS, blocked with 1% monoethanolamine (pH 7.5) then air dried and stored at 4-8 oC in Ziploc bags until used.
Serum Samples
Separate pollen and mite reactive serum pools or non-reactive sera pools were prepared from serum samples that had been previously evaluated for allergen specific IgE. The allergen specific reactivity of each sera pool ranged from nonreactive to multiple pollen or mite reactivity’s. These sera pools and admixtures of the pools were used to construct a specific group of samples that exhibited varying reactivity to the allergens included in the evaluation panel. Eighteen samples were included in the blinded evaluation conducted by each laboratory. In addition, two known pollen reactive control samples and one non-reactive control sample were also included; replicates of these identical samples were included as unknown blinded samples. Also included in the array of samples was a five tube three-fold serial dilution of a highly pollen reactive pool, diluted into non-reactive sera, which served to document the dose response evident within the assay.
A like, but different, set of sera samples that were included in the 2013 proficiency evaluation [13] were also evaluated in four of the participating laboratories using wells that had been coated in 2013 and appropriately stored at Stallergenes Greer. In addition to evaluating these samples using the current lot of anti-IgE-biotin, one technician in Stallergenes Greer reference laboratory also evaluated the same samples using an lot of anti-IgE biotin identical to the one used in the 2013 proficiency testing.
Sample Evaluations – macELISA
The specific IgE reactivity to the various allergens included in the proficiency panel evident in each of the serum pools was determined using the previously described direct bind macELISA protocol [11-13]. Briefly, 100 μL of appropriately diluted sample (1: 6) was added to duplicate wells that had previously been coated with the various specific panel defined allergens. Following an overnight incubation (14-18 hours) at 4-8 oC in a humidified chamber, the wells were washed (2 complete aspirate/wash cycles using PBS wash solution), then 100 μL of an appropriately diluted cocktail containing three biotinylated monoclonal anti-dog IgE second antibodies was added to each well. The wells were returned to the humidified chamber and incubation continued at room temperature (20-25 oC) for another 2 hours, and then they were washed (3 complete aspirate/wash cycles). Streptavidin-Alkaline Phosphatase Enzyme conjugate was added and incubation at room temperature continued for 1 hour. Following a final wash step (4 complete aspirate/wash cycles) 100 μL of p-nitrophenylphosphate substrate (pNPP, Moss Substrates, Pasadena, Maryland) was added to each well and incubation continued for precisely 1 hour. Substrate development was then stopped by adding 50 μL of 20 mM cysteine to each well. Specific IgE reactivity to the allergens was estimated by determining the absorbance of each well measured at 405 nM using an automated plate reader. All results were expressed as ELISA Absorbance Units (EAU) which are background corrected observed responses expressed as milli absorbance.
Statistics
A coefficient of variation was calculated as the ratio of standard deviation and means of the responses observed for the calibrator solutions within different runs in multiple laboratories. Pearson’s correlation statistic was used for inter-laboratory comparison among individual allergens.
Results
The assay variance (% CV) observed with the calibrator solutions in the different laboratories are presented in Table 1 and are representative of the assay reproducibility in the various laboratories. The average intra-assay % CV among positive calibrators (#1-4) was 4.6% (range = 1.6–11.5%); differences among laboratories or between assays and within assay runs were not detected. No substantial difference in results among various operators were revealed. The average inter-operator variance documented for Stallergenes Greer technicians was calculated to be 7.1% (range = 3.4-10.7%). The average inter-assay variance (% CV) observed in Stallergenes Greer’s laboratory with the positive calibrators from multiple runs over a one year period has been documented at 8.9% (range 7.1% -9.7%), and the inter-laboratory % CV among reactive calibrators also remained relatively constant (average 12.1%; range 11.2 – 13.4%).11-13 The results of the current evaluation are consistent with these published findings; the inter-assay variance among positive calibrators for all laboratories included in this evaluation was calculated to be 9.6 % (range = 6.6-11.2%). Similar to these previously published studies, the intra-assay variability was higher with negative calibrator #5 (average 7.1%; range 2.9 – 13.1%), and a similar increased intra-assay variability was evident with the background ODs (average 9.5%; range 5.9– 16.7%).
Table 1. Assay variance of macELISA calibrator solutions observed with different laboratory runs by multiple operators.
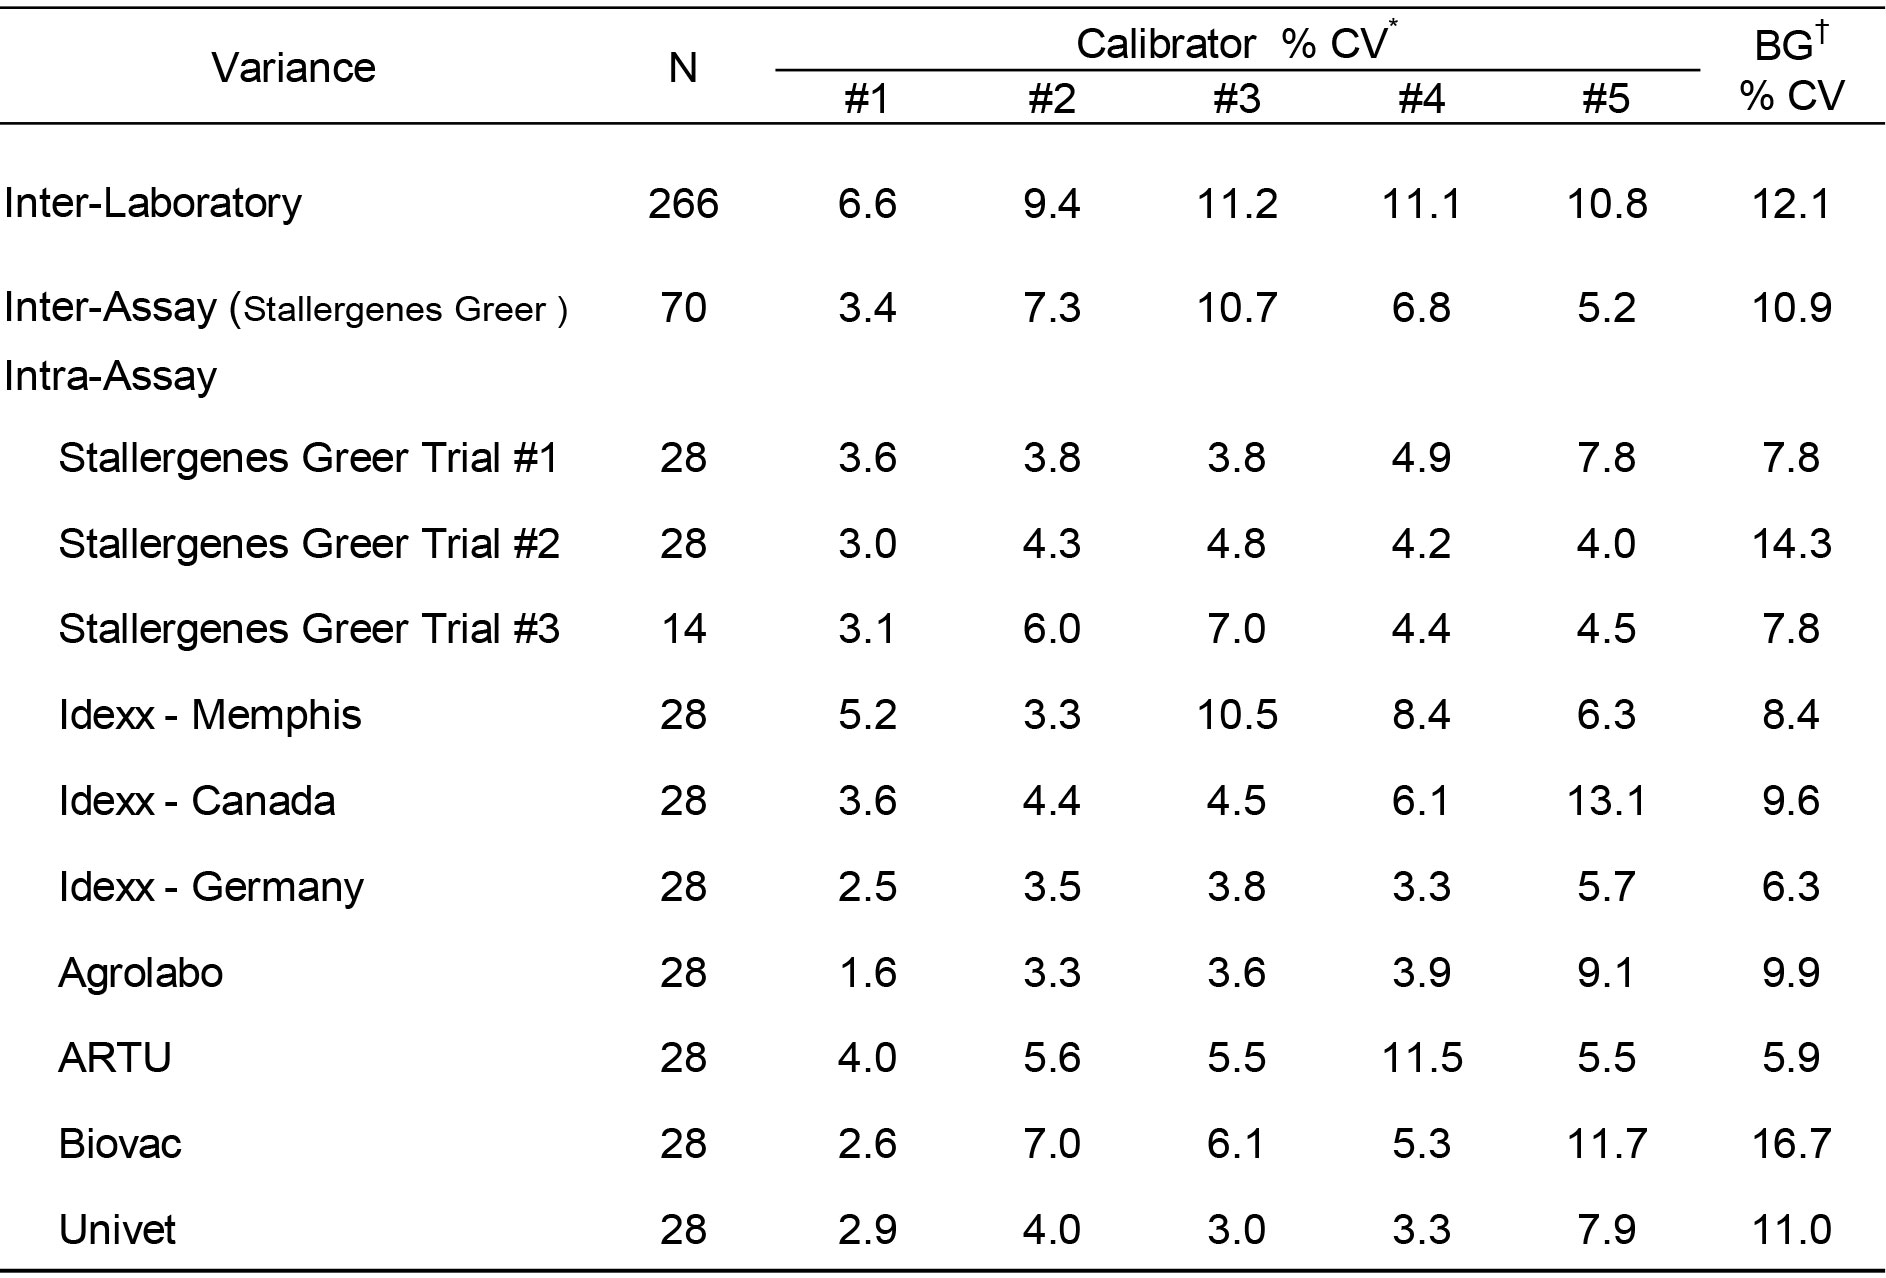
* Calibrator #1 is prepared as a dilution of a sera pool which is highly reactive to grass pollen allergens; calibrator #5 is a dilution of a negative sera pool. Calibrators #2 – #4 are prepared as a serial 3-fold dilution of calibrator #1.
† Background responses observed with diluent in place of serum sample.
The concordance of positive and negative results observed within and among laboratories for the individual allergens contained within the proficiency panel is presented in Table 2. Using predefined cut-off points of 150 EAU, 300 EAU, and 600 EAU results were classified as positive or negative. The average inter-assay inter-laboratory concordance of results for the mite allergens at the 150 EAU cutoff was 97.1% (range 93.3% – 100%). Similar concordance of results was evident among all laboratories for the pollen allergens. The average concordance for grasses, trees, and weeds was demonstrated to be 96.9% (range 93.3 – 98.6), 97.1% (range 94.8% – 99.0%), 97.4% (range 96.2% – 99.0%), respectively. The overall average inter-assay inter-laboratory concordance of results for individual allergen evaluations, including fungi, using the 150 EAU cutoffs was 97.1% (range 93.6% – 100%).
Table 2. Interassay / Interlaboratory Concordance Results in relation to EAU Cutoff all samples evaluated.
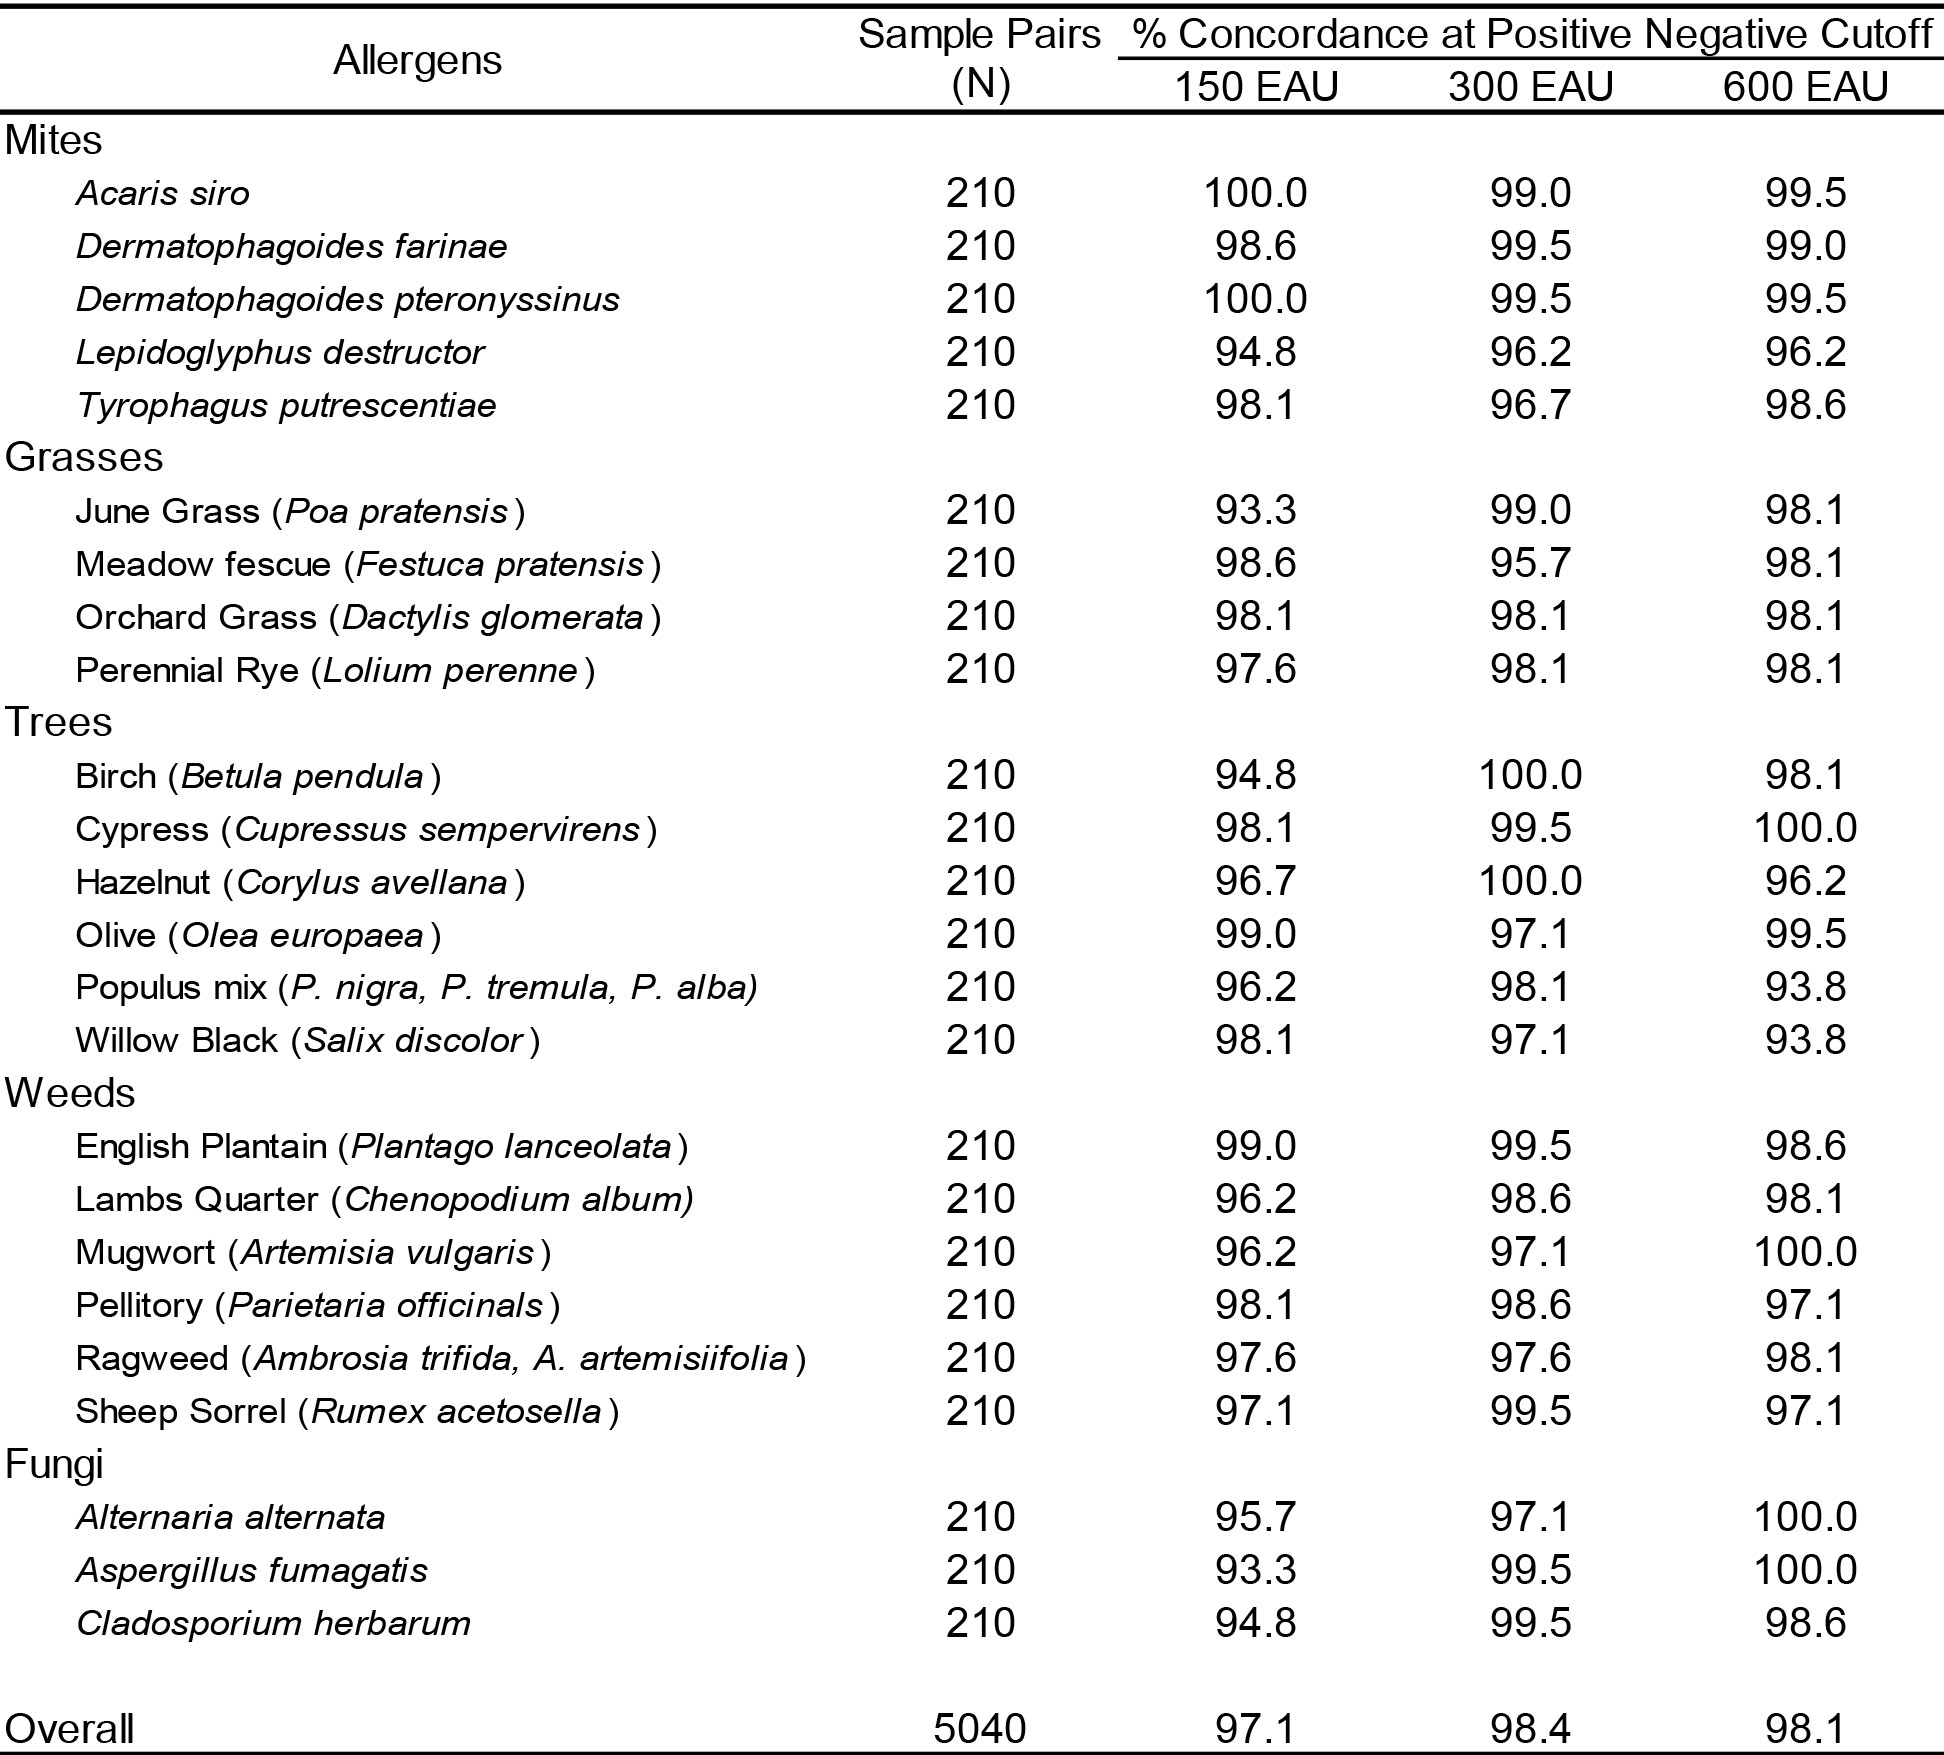
Increasing the positive-negative cutoff level to 300 EAU or 600 EAU only slightly increased the concordance of observed results. The overall average inter-assay inter-laboratory concordance of results at a cutoff of 300 EAU was 98.4% (range 96.2% – 100%) while the observed concordance at a cutoff of 600 EAU was 98.1% (range 93.8% – 100%).
To evaluate the strength of association with the magnitude of EAU results observed for each allergen among the different laboratories a Pearson’s correlation coefficient was determined for each laboratory pair. The results presented in Table 3 demonstrate that very high inter-laboratory correlation (r > 0.80; p < 0.001) is evident between the results observed in Stallergenes Greer’s laboratory and those observed in seven affiliate laboratories for all mites and pollen allergens. Similarly, there was high inter-laboratory correlation (r > 0.90; p < 0.001) between and among the various IDEXX and European laboratories (Table 4) for all allergens tested.
There is no compelling evidence that the level of allergen specific IgE correlates with severity of clinical disease [3-5]. However, an evaluation that purports to measure allergen specific IgE should have a reduction in signal that is directly proportional to the dilution factor of the test ligand [14]. For an evaluation of the dose response in this ELISA, a four tube three-fold serial dilution a reactive dog sera pool was prepared using a negative sera pool as diluent. Each of the dilutions was then evaluated by all of the participating laboratories as unknown independent samples. The sera pool was previously shown to be highly reactive to grass, weed, and tree pollen allergens, but it was not reactive to mites and fungi. Similar responses were yielded by all of the laboratories and the results observed within the various laboratories are encompassed by the acceptable variance limits [11-13] (± 20%) established for macELISA. Further, the magnitude of responses observed in each laboratory was reduced in direct proportion to dilution. Consequently, the dose responses for the individual allergens are presented as aggregate responses. The comparative dose response of macELISA results observed with differing dilutions is presented in Figure 1. The reaction profiles for grass allergens (A) appear to be parallel and quite similar in magnitude of response. Although the responses evident to differing tree (B) and weed (C) allergens are more variable in magnitude of response, the observed response in each laboratory was reduced in direct proportion to dilution. The positive response profiles evident with these allergens also appear to be parallel and, it becomes evident that the detectability of allergen specific IgE within this assay spans at least a 150-fold dilution range. Responses to mite (D) and fungal (E) allergens were lacking in the original sample. The responses of greatest magnitude with were evident with the grass pollen allergens, and these responses were reduced in direct proportion to dilution; the magnitude of responses ranged from near maximum to those that were indistinguishable from background responses. The response profiles for the grasses are not only parallel, but they also appear to be nearly identical. Whether or not these like responses result because of a similar level of co-sensitization or allergen epitope similarity combined with cross-reaction remains to be determined. Although the responses evident to tree and weed allergens are more variable in magnitude of response, the observed response in each laboratory was reduced in direct proportion to dilution. The positive response profiles evident with these allergens also appear to be consistent with responses that might be expected for ELISA, and, with appropriate dilution, the magnitude of response will reach extinction.
Table 3. Inter-laboratory correlation of macELISA results observed with individual allergens in Stallergenes Greer Laboratory and the results observed in the individual affiliate laboratories.
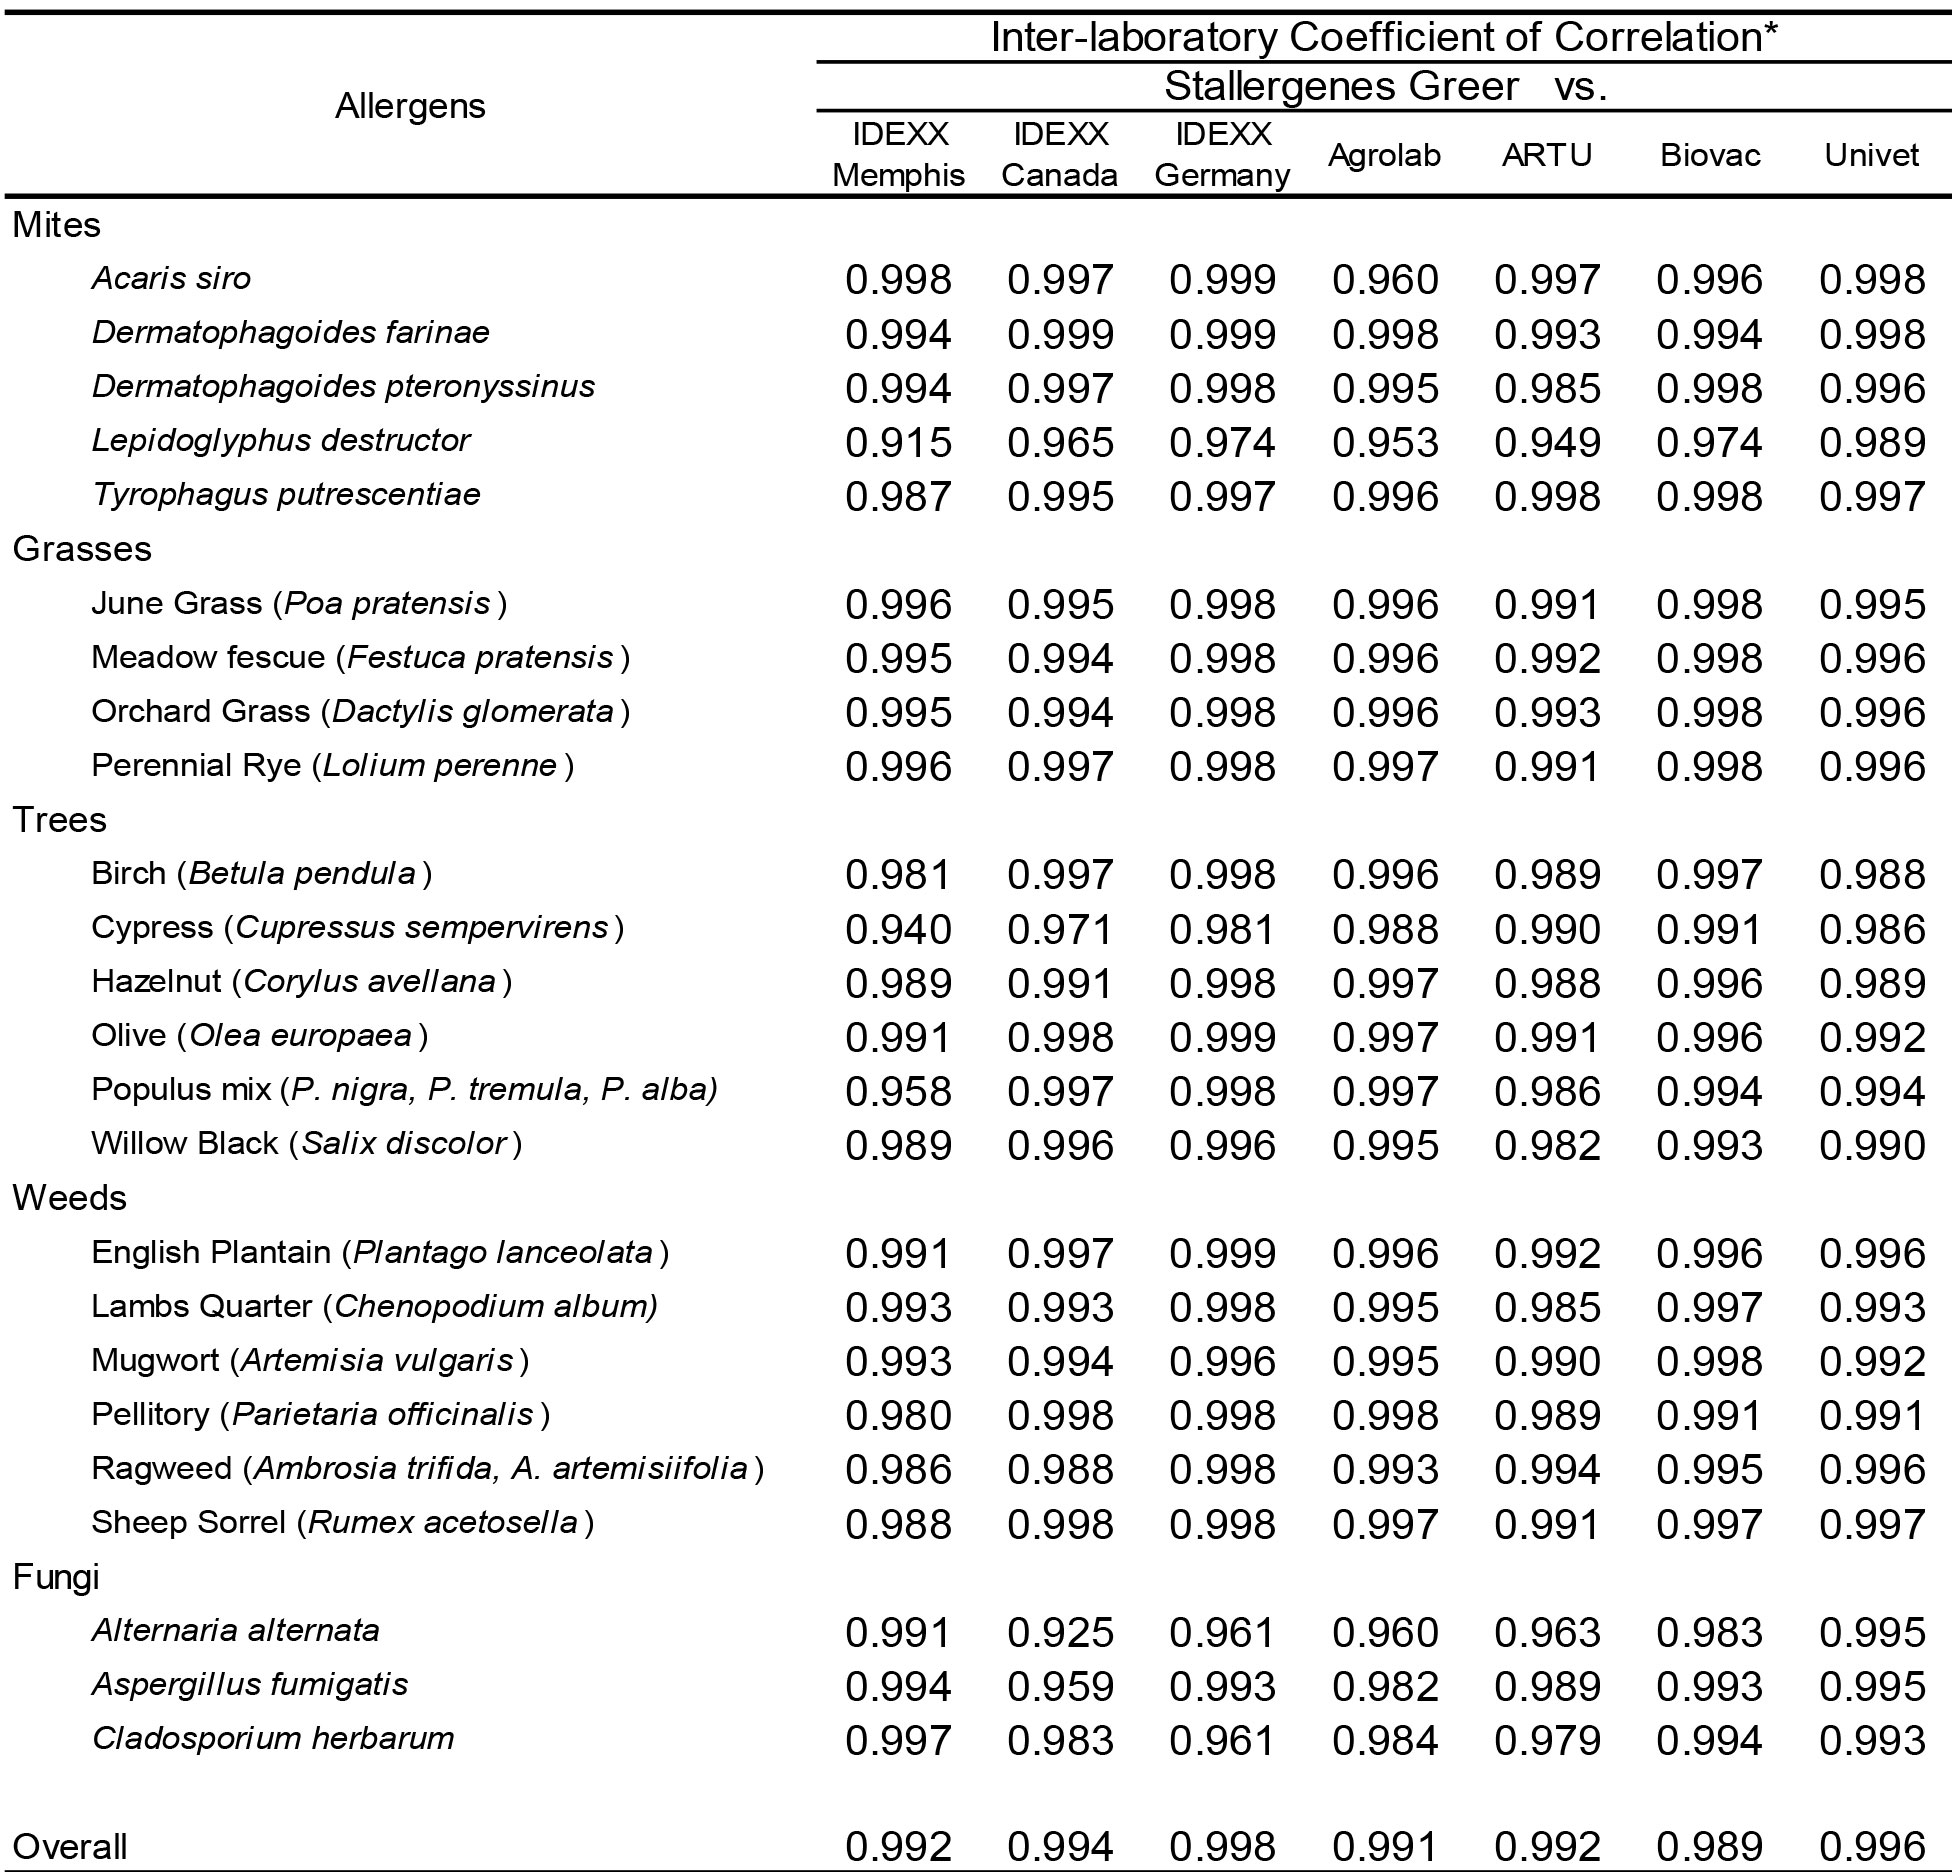
* Pearson Correlation Coefficient (r); Good Correlation (r > 0.8, p < 0.001)
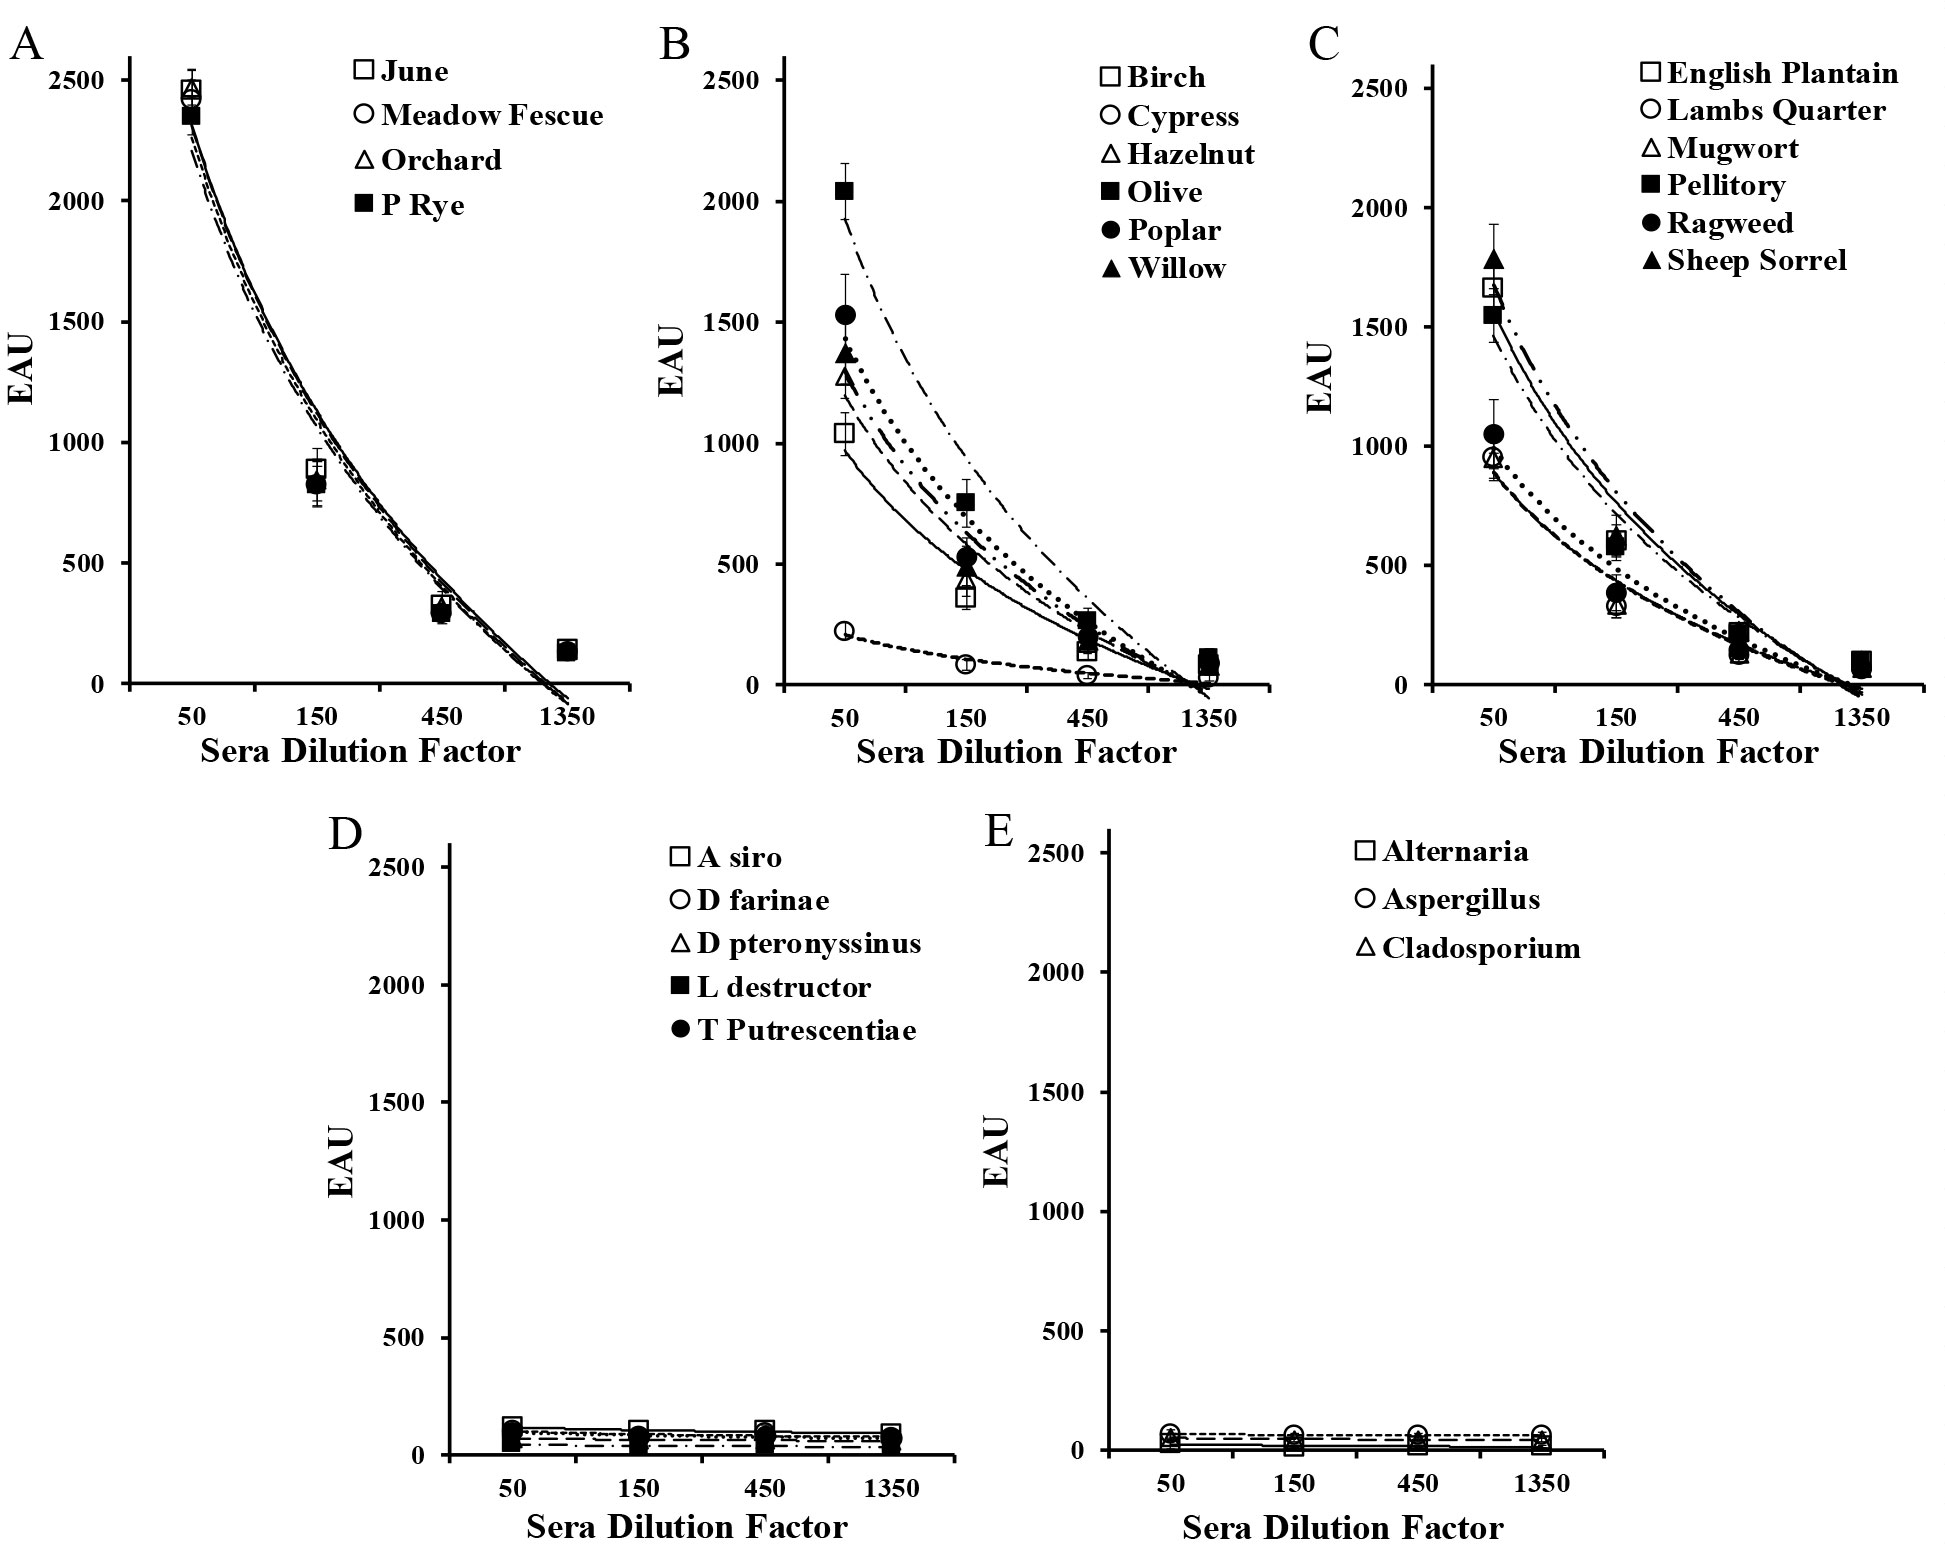
Figure 1. Dose response evident in macELISA with a serum pool reactive grass pollens (A), tree pollens (B), weed pollens (C), and negative to mites (D) and fungi (E).
Table 4. Inter-laboratory correlation of macELISA results observed among individual affiliate laboratories.
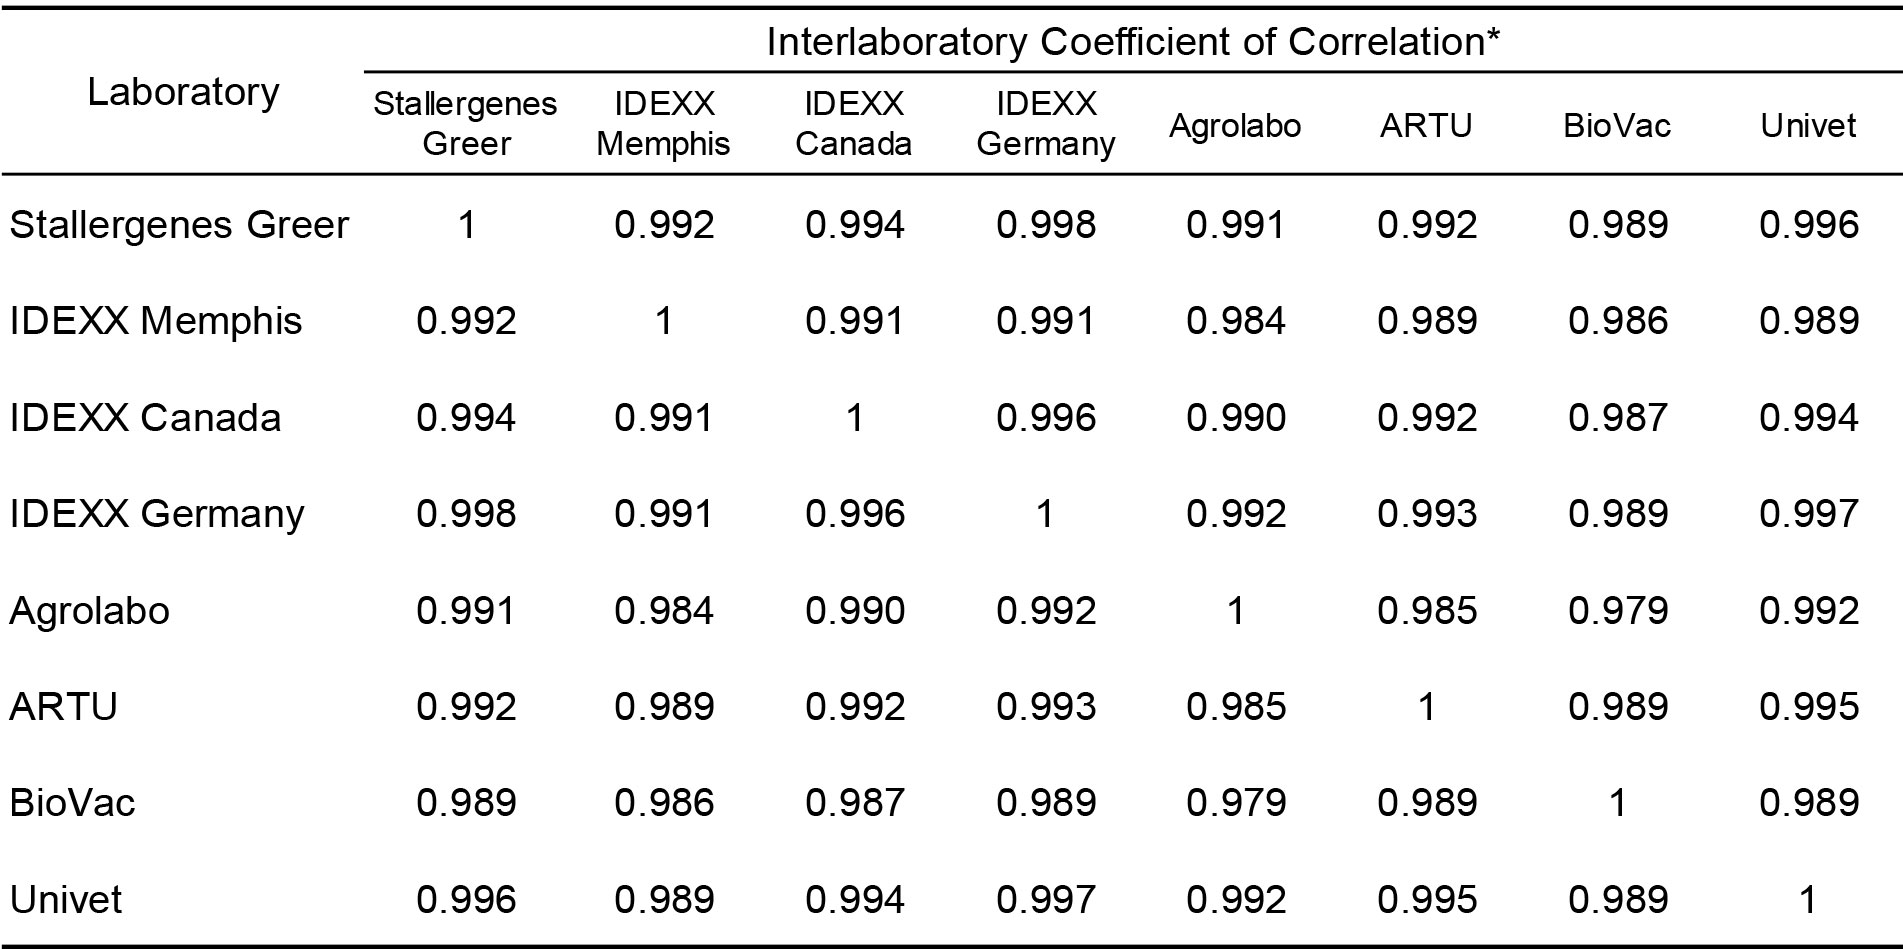
* Pearson Correlation Coefficient (r); Good Correlation (r > 0.8, p < 0.001)
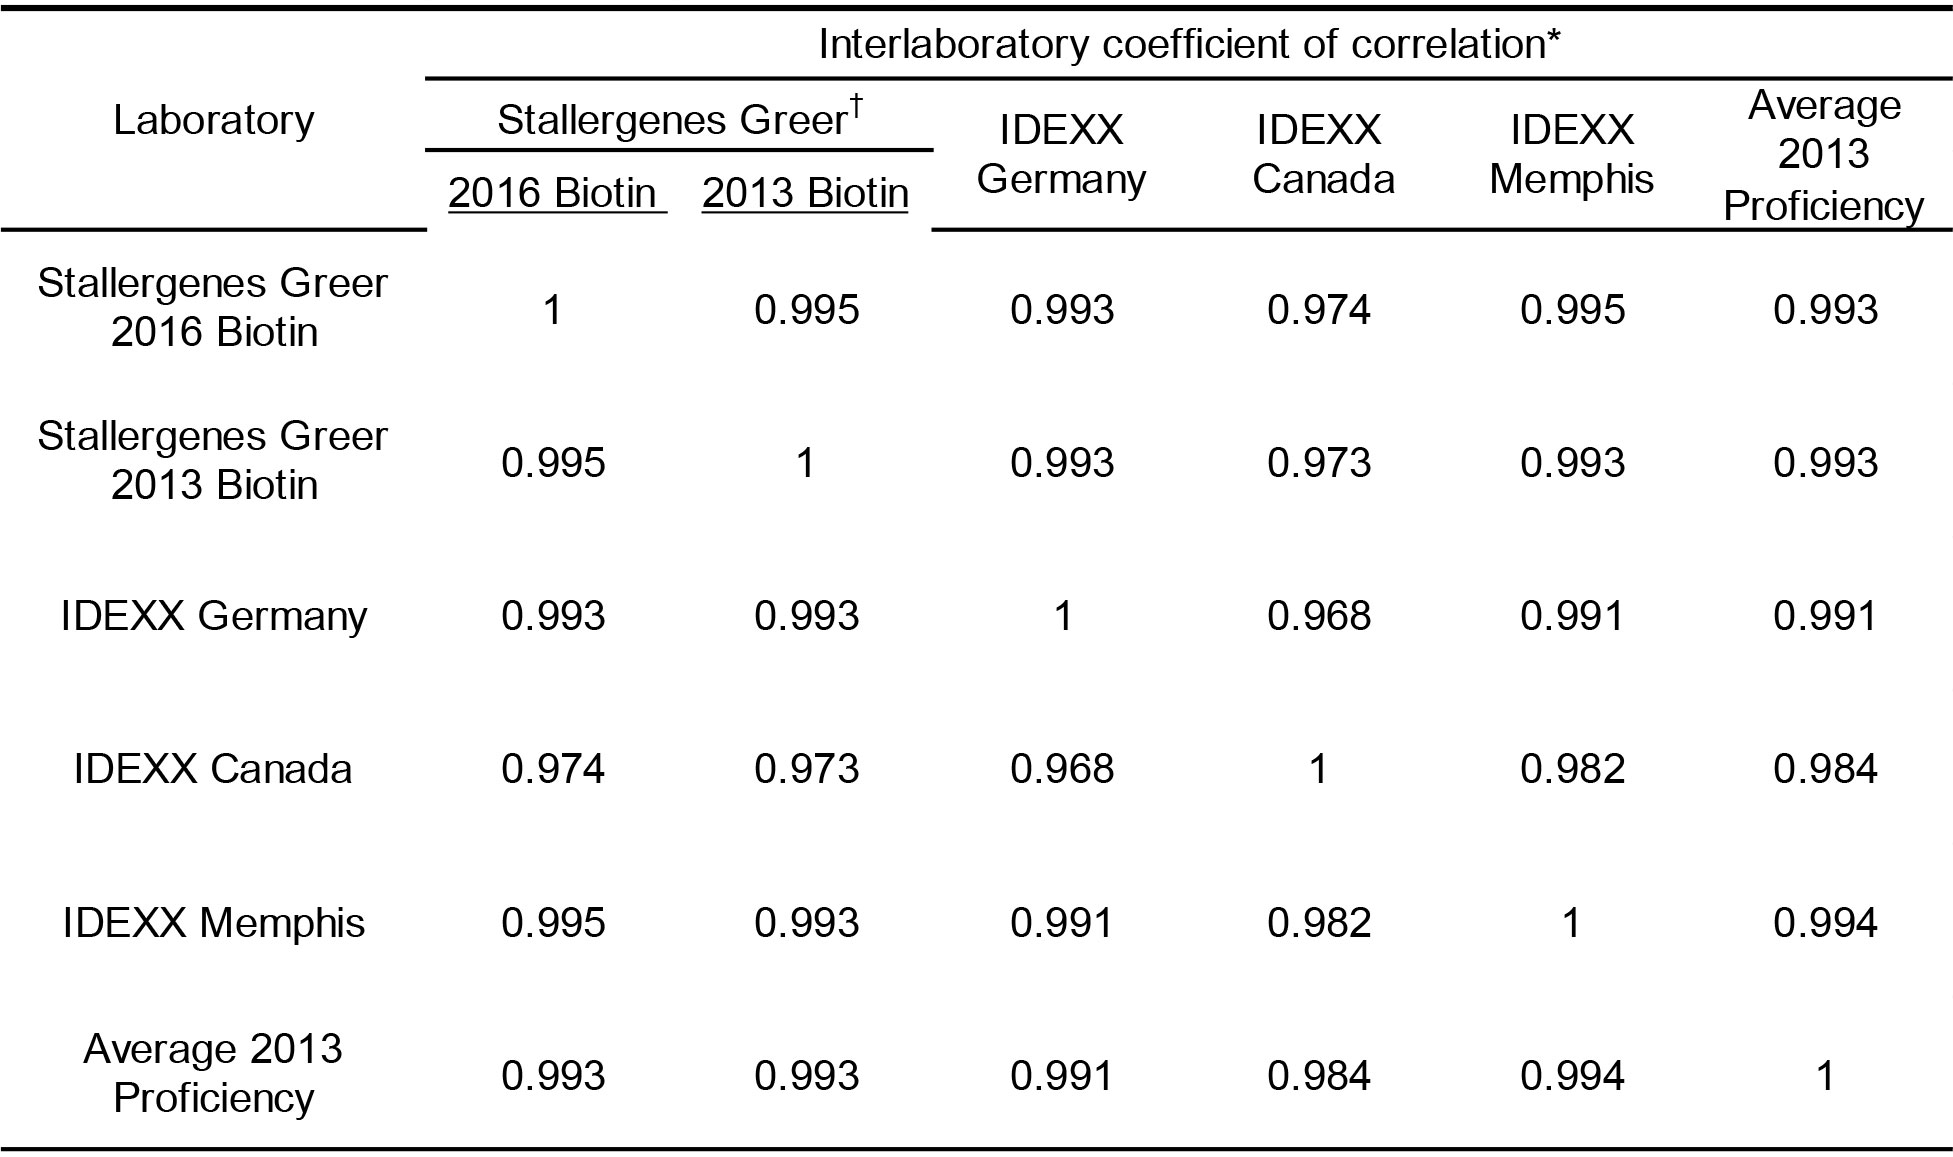
The final evaluations encompassed a reproducibility evaluation of sera samples in four selected laboratories that currently provide commercial services for detection of allergen specific IgE. The design of the evaluation was akin to the proficiency evaluation of laboratories completed in 2013 and included dog sera samples and coated wells that were from the same lots as those used in that proficiency evaluation [15]; other components used in the assay were derived from the most recent lot of reagents. It is noted that one Stallergenes Greer technician ran the samples not only with the current lot of anti-IgE-biotin, but with a lot of anti-IgE-biotin identical to that used in the original 2013 proficiency evaluations as well.
The results presented in Table 5 demonstrate that very high inter-laboratory correlation (r > 0.90; p < 0.001) is evident between the results observed in Stallergenes Greer’s laboratory and those observed in all IDEXX laboratories for all mites and pollen allergens. Similarly there was strong inter-laboratory correlation (r > 0.90; p < 0.001) between and among the various participating affiliate laboratories for all tested allergens (Table 6). However, the correlation (Pearson’s) of results observed with the fungal allergens within or between any of the testing laboratories was somewhat less profound. This difference in correlation of results is likely a consequence of the majority of results for the fungal allergens with this set of sera samples falling within the lower range of reactivity or within the negative range of the response curve (< 150 EAU). Because of the extensive variability known to exist in this range of reactions, the lack of extremely high correlation with the fungal allergens among laboratories is not surprising. Important to note is the observation that the all laboratories yielded results that are consistent with the results observed with the current use anti-IgE-biotin. Equally important, the results of the current evaluation yielded results in all laboratories that are indistinguishable from the overall results yielded in the proficiency evaluation of 10 different laboratories conducted in 2013 using the same sera samples and lot of allergen coated wells. These results not only demonstrate excellent reproducibility among laboratories, they also document/confirm long range stability of coated wells and anti-IgE-biotin reagent that have been shipped to various locations.
Table 5. Inter-laboratory correlation of macELISA results observed with individual allergens between Stallergenes Greer and the results observed in the individual affiliate laboratories.
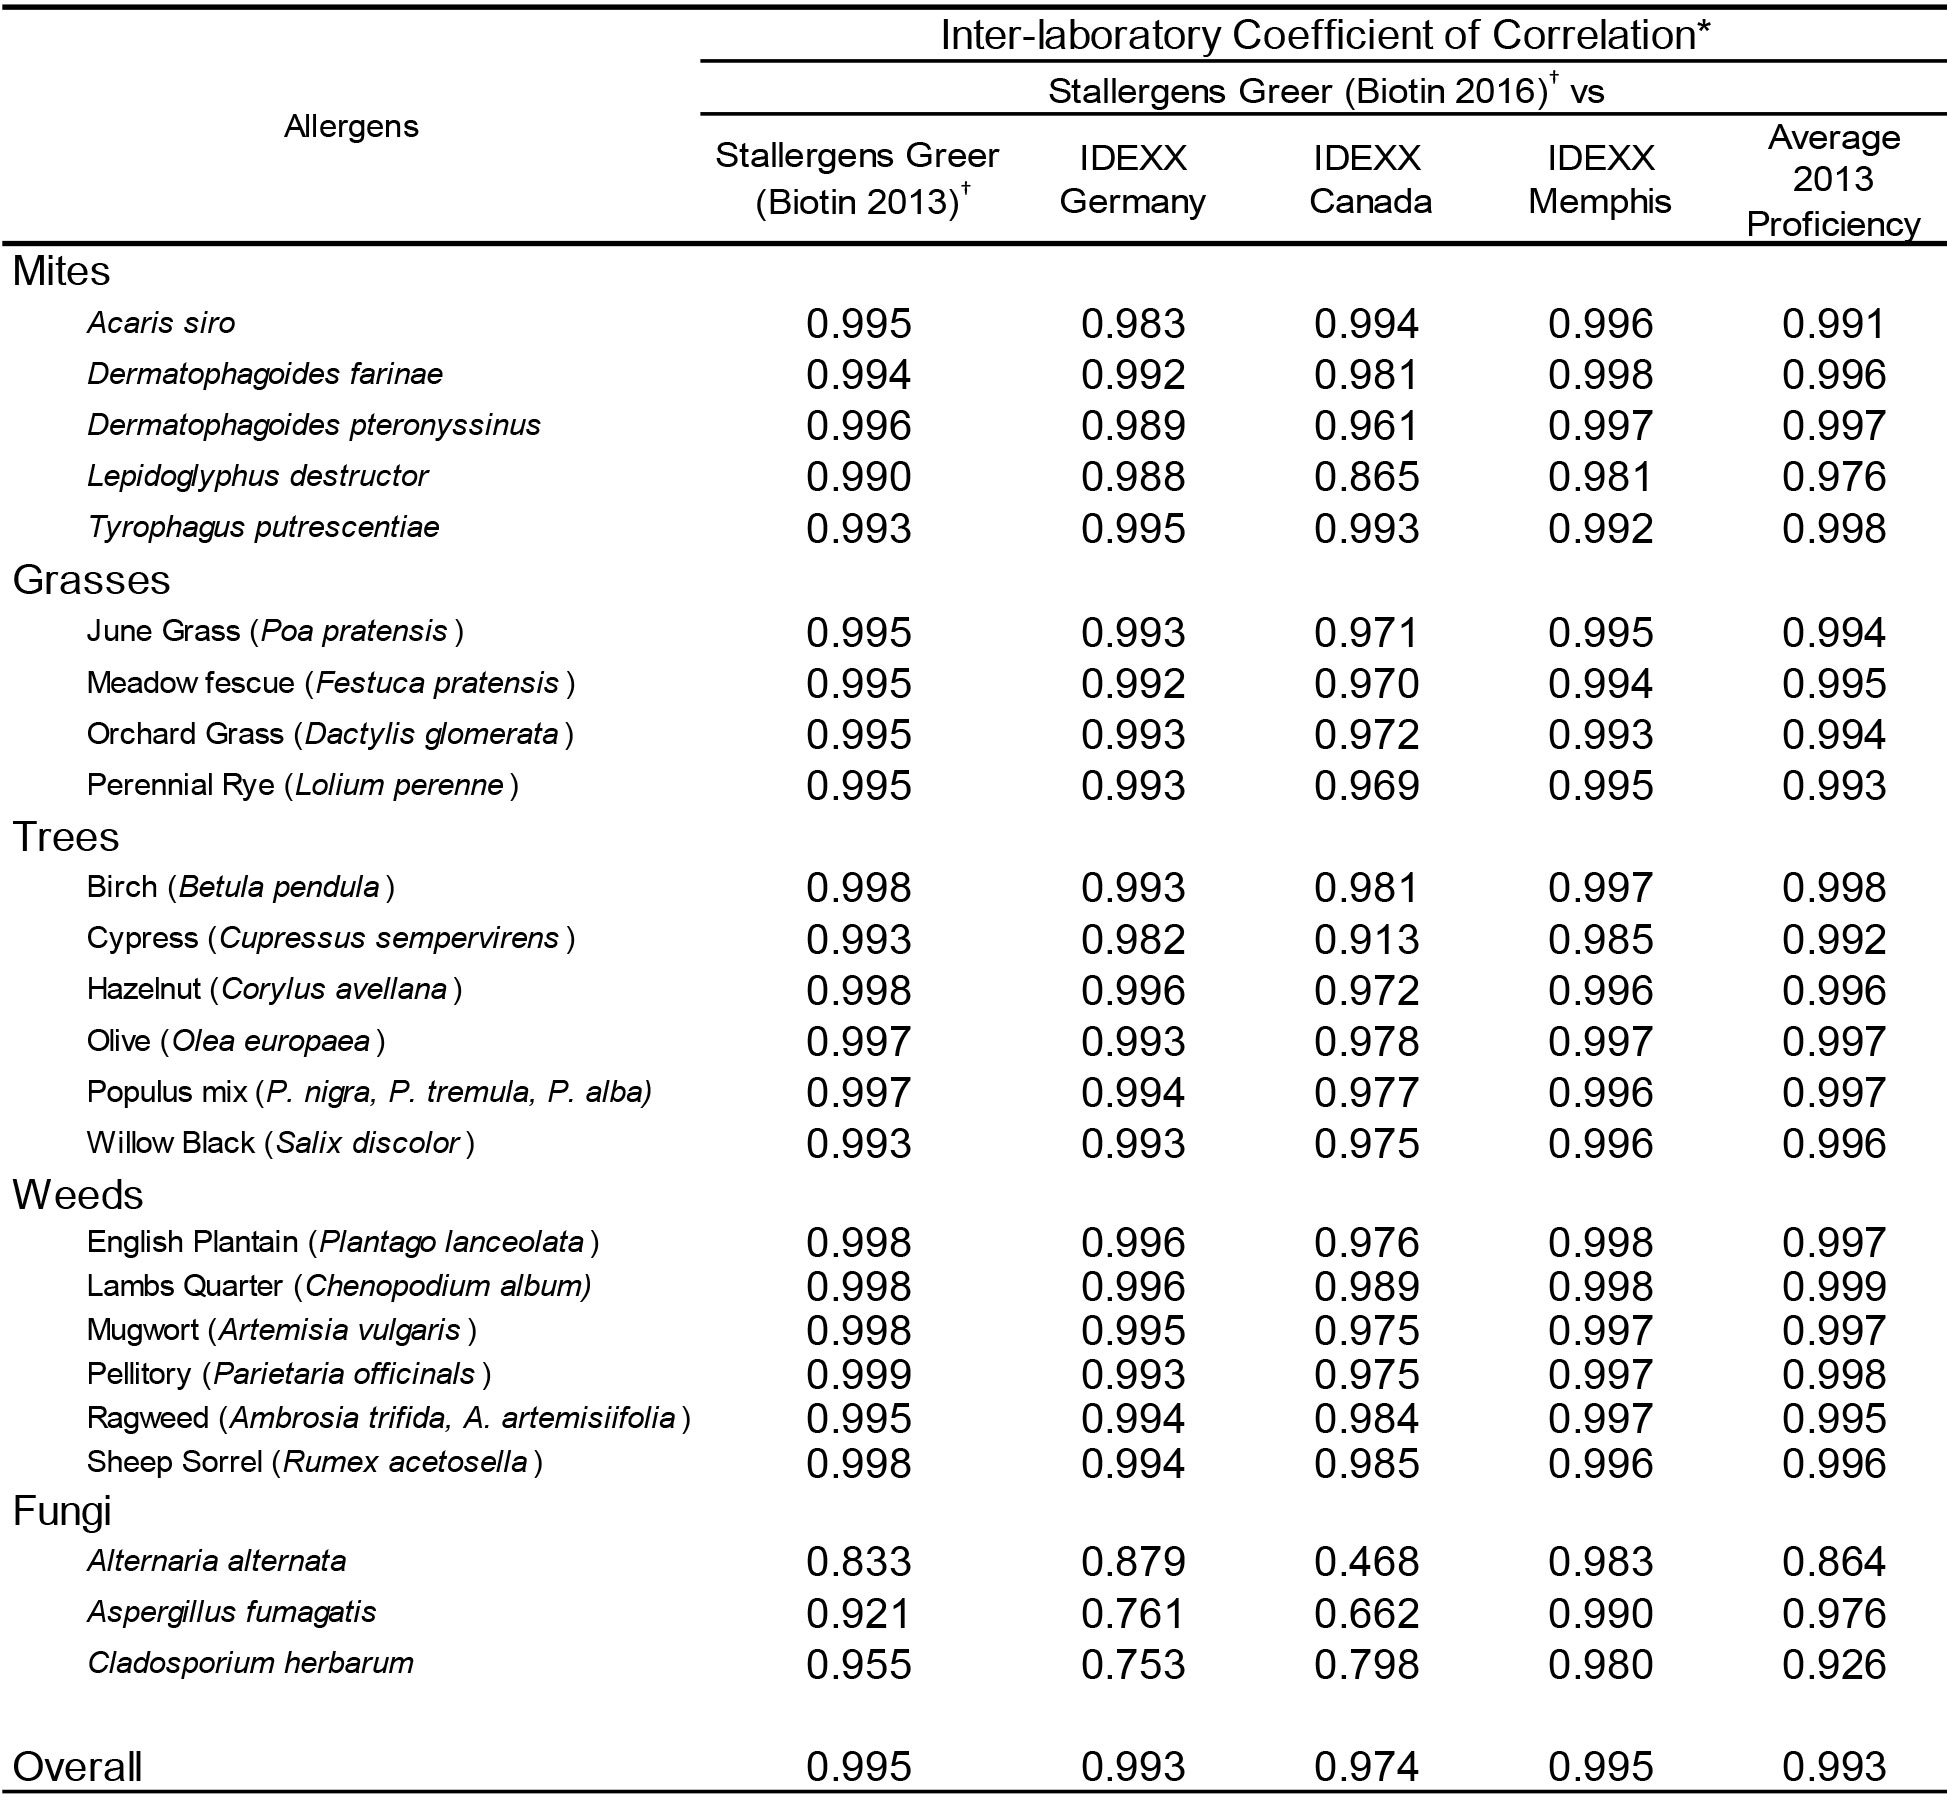
* Pearson Correlation Coefficient (r); Good Correlation (r > 0.9, p < 0.001)
† 2016 Biotin is current use lot of anti-IgE-biotin; 2013 Biotin is the same lot of anti-IgE-biotin that was used in the 2013 proficiency evaluation and stored at -20 °C.
Table 6. Inter-laboratory correlation of macELISA results observed among individual laboratories and between the 2016 proficiency evaluation and the proficiency evaluation completed in 2013.
* Pearson Correlation Coefficient (r); Good Correlation (r > 0.9, p < 0.001)
† 2016 Biotin is current use lot of anti-IgE-biotin; 2013 Biotin is the same lot of anti-IgE-biotin that was used in the 2013 proficiency evaluation and stored at -20 °C.
Discussion
The results of the present study demonstrate that the variability between and among the affiliate laboratories and technicians are indistinguishable from the results evident within and between runs completed in the laboratory of Stallergenes Greer. Although Stallergenes Greer developed and manufactures the assay components used in all laboratories, the results presented herein demonstrate that all laboratories and technicians are equally proficient in providing consistent results for all allergens tested. The intra-assay variance observed with the positive calibrators evident among the various runs within each of the laboratories remains relatively low and indistinguishable among the various laboratories. Likewise, the inter-assay variance within each laboratory remained relatively constant and the results from all laboratories were demonstrably similar and the CV of the positive responses was relatively constant across the entire range of reactivity tested. Consequently, the observed inter-laboratory CV was well within the acceptable variance limits (± 20%) established for this assay [11]. The variability of background and negative sera responses, in contrast, was substantially greater but indistinguishable among laboratories. The increased variability with the negative responses emphasizes the need to establish an appropriate and robust cutoff for each assay. For the macELISA, a cutoff of 150 EAU establishes 99% confidence for positive responses and has been recently confirmed [3].
The correlation of results observed with the fungal allergens within or between any of the testing laboratories was also substantial. These observations are in direct contrast to the correlation of results observed with fungal allergens during previous proficiency evaluations [11-13]. It has been suggested that the lack of correlation among fungi during the previous evaluations was likely a consequence of the majority of results for the fungal allergens falling within the lower range of reactivity or within the negative range of the response curve (< 150 EAU). The results of the current proficiency evaluation are supportive of this suggestion. Several of the samples included in the current evaluation were reactive (albeit low level) to the fungi included in the allergen panel. Consequently, the correlation of results among laboratories for the fungal allergens was substantially increased.
Consistent with previously observed dose response curves evident in macELISA, it becomes apparent that a three-fold dilution of serum results in an approximate two-fold reduction in signals generated. Thus, the relative amount of allergen specific IgE that might be detected at the cutoff level (150 EAU) will need to be increased three-fold to yield a response of 300 EAU and nine-fold to yield a response of 600 EAU; to generate a maximal signal (4000 EAU) will require nearly a 150-fold increase in allergen specific IgE. This being the case, it is unlikely that a highly reactive serum sample will be detected as non-reactive at a 1: 5 dilution. The variance evident in the low level range of responses dictates that true borderline positive samples might be identified as false negative responses and this tendency might compound the likelihood of false negative responses. However, a serum sample at a 1: 5 dilution makes detection of false positive results seem rather remote.
Although proficiency testing has a well-established role as both a laboratory improvement and an educational tool, there remains no regulatory required or industry-wide voluntary quality assurance program for serum allergen-specific IgE testing in companion animals that independently monitors performance of all laboratories and assay formats. Until such external and independent quality assurance programs for testing of serum allergen-specific IgE is undertaken, each manufacturer of such assays must accept the responsibility for continued evaluation of laboratories that routinely use their assays and reporting those results to the veterinary community. Information presented herein documents the continued commitment of Stallergenes Greer and its affiliate laboratories to this important endeavor.
Authors Contributions: Kenneth Lee contributed to the conception and design of the study; contributed to the acquisition, analysis, and interpretation of data; and drafted the manuscript. Karen Blankenship and Brennan McKinney manufactured all components used throughout the evaluation and contributed to acquisition of the data. Gerhard Kern, Elizabeth Roth, Janice Greenwood, Pilar Brazis, Laurent Drouet, Cecilia Tambone, and Dirk Teilenburg contributed to acquisition of the data. All authors gave final approval and agree to be accountable for all aspects of the work in ensuring that questions relating to the accuracy or integrity of any part of the work are appropriately investigated and resolved.
Declaration of conflicting interests: All authors from Stallergenes Greer are employees at Stallergenes Greer; other authors are employees of the affiliate laboratories.
Funding: Funding for this study was provided by Stallergenes Greer.
References
- DeBoer DJ, Hillier A (2001) The ACVD task force on canine atopic dermatitis (XV): fundamental concepts in clinical diagnosis. Vet Immunol Immunopathol 81: 271–76.
- DeBoer DJ, Hillier A (2001) The ACVD task force on canine atopic dermatitis (XVI): laboratory evaluation of dogs with atopic dermatitis with serum-based “allergy” tests. Vet Immunol Immunopathol 81: 277–87.
- Gorman NT, Halliwell, REW (1989) Atopic Diseases. In: Halliwell REW, Gorman NT. ed. Veterinary Clinical Immunology 232–52. WB Saunders, Philadelphia.
- Griffin CE, DeBoer DJ (2001) The ACVD task force on canine atopic dermatitis (XIV): clinical manifestation of canine atopic dermatitis. Vet Immunol Immunopathology 81: 255–69.
- Griffin CE, Hillier A (2001) The ACVD task force on canine atopic dermatitis (XXIV): allergen-specific immunotherapy. Vet Immunol Immunopathol 81: 363–383. [crossref]
- Hillier A, DeBoer DJ (2001) The ACVD task force on canine atopic dermatitis (XVII): intradermal testing. Vet Immunol Immunopathol 81: 289–304. [crossref]
- Olivry T, Sousa CA (2001) The ACVD task force on canine atopic dermatitis (XIX): general principles of therapy. Vet Immunol Immunopathol 81: 311–316. [crossref]
- Reedy LM, Miller WH, Willemse T (1999) Introduction to Allergy. In: Allergic Skin Diseases of Dogs and Cats. 2nd edition 1-24. W.B. Saunders, London.
- Reedy LM, Miller WH, and Willemse T (1999) Urticaria, Angiodema, and Atopy. In: Allergic Skin Diseases of Dogs and Cats. 2nd edition 25-49.WB Saunders, London.
- Thom N, Favrot C, Failing K, et al. (2010) Intra- and interlaboratory variability of allergen-specific IgE levels in atopic dogs in three different laboratories using the Fc-?? receptor testing. Vet Immunol Immunopathol 133: 183–189.
- Lee KW, Blankenship KD, McCurry ZM, Esch RE, DeBoer DJ, et al. (2009) Performance characteristics of a monoclonal antibody cocktail-based ELISA for detection of allergen-specific IgE in dogs and comparison with a high affinity IgE receptor-based ELISA. Vet Dermatol 20: 157–164. [crossref]
- Lee KW, Blankenship KD, McCurry ZM, et al. (2012) Reproducibility of a Monoclonal Antibody Cocktail Based ELISA for Detection of Allergen Specific IgE in Dogs: Proficiency Monitoring of macELISA in Six US and European Laboratories. Vet Immunol Immunopathol 148: 267–275.
- Lee KW, Blankenship K, McKinney B, Kern G, Buch J, et al. (2015) Proficiency monitoring of monoclonal antibody cocktail–based enzyme-linked immunosorbent assay for detection of allergen-specific immunoglobulin E in dogs. Journal of Veterinary Diagnostic Investigation 27: 461–469.
- Tijssen P (1993) Processing of data and reporting of results of enzyme immunoassays. In: Burdon, RH, van Knippenberg PH, editors. Practice and Theory of Enzyme Immunoassays 385–421 Elsevier, Amsterdam.