Archives

fig 1

Review of Diabetes Mellitus in Relation to Pancreatic Cancer

DOI: 10.31038/CMCRR.2021111

Abstract

Pancreatic cancer (PC) and diabetes mellitus (DM) represent major research involvement worldwide. In the last few years, several clinical studies have confirmed that DM progression has a key role in the development of PC. In this mini-review, we analyze the current epidemiological data, in addition to the basic structural and physiological properties of pancreatic cancer tissue, and the relationship of cellular mechanisms between DM and subtypes of PC. We discuss current findings, as well as offer perspectives on proteomics and biomarker research.

Keywords

Biomarker, Diabetes mellitus, Glycosylated biomarker, Pancreatic cancer, Pancreatic ductal adenocarcinoma, PDAC subtypes

Background

Global Epidemiology of Pancreatic Cancer

Today’s statistical studies implicate that PC is the fourth leading cause of death among all the cancers, and is even projected to become the second leading cause of death in the coming years [1]. For this highly aggressive and devastating malignancy it is known that pancreatic cancer’s incidence and mortality patterns differ among populations. Overall clinical data show 93% pancreatic cancers are exocrine adenocarcinoma with the remainder (7%) being pancreatic neuroendocrine tumors. Pancreatic ductal adenocarcinoma (PDAC) remains highly lethal with a 5-year survival rate of 8.2% in United States and Europe [1,2] (American Cancer Society; https://www.cancer.org). ASCO guidelines for the management of locally advanced pancreatic (LAPC) with an expected 5-year overall survival rate of less than 5% are more limited than for a potentially curable disease, and much more so for metastatic pancreatic cancer whose patients have less than 1-year median life expectancy with the 5-year overall survival rate of only 2% [3].

It is estimated that during 2020 in the United States, 57,600 adults (30,400 men and 27,200 women) will be diagnosed with PC, 3-7% of all cancers in the US population [4]. Whereas Europe and the European Union (40 total countries) comprise 9% of the world population, the region has a 25% share of the global cancer (burden) and thus provides key cancer planning programs (European Network of Cancer Registries, ENCR, www.encr.eu and United Nations, population division, World Population Prospects, https://esa.un.org/unpd/wpp/). In 2018, estimated incidence of new PC cases and deaths for both sexes is 3.4% of the population and the mortality rate is estimated as 6% for males, 7.4% for the females [5]. Interestingly, pancreatic cancer incidence is 6.95% whereas the mortality rate shows an increasing trend (6.28%) in China where it could be related to the socioeconomic development in addition to an increasing aging population [6,7]. These worldwide statistics point to an urgent need for an early stage pancreatic cancer detection to identify precursors that are destined to progress to malignancy.

What Are The Risk Factors and Causes?

Several risk factors, such as age, genetics, lifestyle and environmental factors are linked to pancreatic cancer progression [4,8]. Pancreatic cancer is seen as hereditary and the non-hereditary form, known as sporadic. The risk of pancreatic cancer is higher in persons with a family history of Peutz-Jeghers syndrome (MIM#175200), Lynch syndrome/hereditary non-polyposis colorectal cancer (HNPCC; MIM#120435), familial adenamotous polyposis-FAP (MIM #616415), familial atypical multiple mole melanoma syndrome (MIM#155600) which are the hereditary forms seen in 5 to 10% of all cases. Now it is recommended that all diagnoses of pancreatic cancer include germline testing that may indicate a hereditary predisposition to pancreatic cancer [9]. When we look at the non-hereditary or sporadic forms of pancreatic cancer; several risk factors are playing major roles in the pathogenesis. The main factors are identified as age (>75%), smoking (cigarettes, cigars, pipes and chewing tobacco; 20%), obesity (>10%), chronic pancreatitis (long term inflammation of the pancreas;1%), diabetes, gallstones, metabolic syndrome, red meat, and exposure to high energy radiation (X-rays, gamma rays) [8]. Most of the patients (80-85%) are diagnosed with locally advanced or metastatic disease but only, 15-20% are diagnosed in an early stage allowing them to undergo surgical resection [10].

To date, our lack of understanding of the cellular biology of the PDAC has prevented the development of truly effective therapies and clinically useful pathogenesis markers for early screening the disease [11]. Thus, of the risk factors, we all know that DM (MIM# 222100, 125853) is a key player in the progression of PC [8].

What is the Relationship between Diabetes Mellitus and Pancreatic Cancer?

Structure of the Pancreas

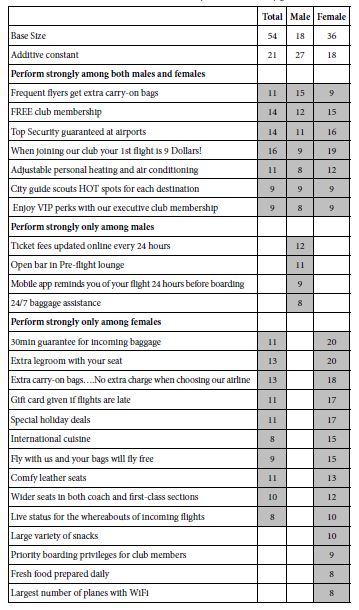
A well-known glandular organ, the pancreas is a pear-shaped gland located quite high up in the abdomen between the stomach and spine and is part of the digestive system. It lies across the body where the ribs meet at the bottom of the breastbone, just behind the stomach. It is about 6 inches (15 centimeters) long. In embryogenesis, the pancreas is derived from the embryonic foregut region of the epidermal germ layer. Its main structure consists of 3 parts: the wide end called the head; the thin end is the tail and the part in the middle is the body as seen in Figure 1. The main function is to maintain the homeostasis of the body by producing hormones that regulate blood glucose levels, as well as enzymes that function in digestion [12].

fig 1

Figure 1: Cellular progression model of PDAC.

The pancreas has 2 major components; the exocrine part is made up of ducts and small sacs called acini on the end of the ducts, which secrete enzymes that are released into the small intestine. The endocrine part is made up of cells, called the islets of Langerhans, which makes the most important hormone insulin secreted by the beta cells. Insulin is considered the main anabolic hormone of the body. Other beta cell secretagogues are glucagon, somatostatin, pancreatic polypeptide (PP), and vasoactive intestinal peptide (VIP) all which play important roles in regulating metabolism. We know that cancers arise from both exocrine and endocrine regions and are different and cause various symptoms.

Two types of pancreatic cancers (PC) are known. Exocrine tumors are the most common type and are known as adenocarcinoma. These tumors usually start in the ducts of the pancreas and are termed ductal adenocarcinoma (Pancreatic ductal adenocarcinoma, PDAC) which are more common today: it is projected that this pancreatic cancer type will be the second highest cause of cancer related deaths by 2030 in USA [3,12]. Much less commonly, if the tumor begins in the acini, it is known as acinar adenocarcinoma. An increasingly common diagnosis is seen as intraductal papillary mucinous neoplasm (IPMN). An IPMN is a tumor that grows within the ducts of the pancreas and makes a thick fluid called mucin. Much rarer types of exocrine pancreatic tumors include: acinar cell carcinoma, adeno-squamous carcinoma, colloid carcinoma, giant cell tumor, hepatoid carcinoma, mucinous cystic neoplasms, pancreato-blastoma, serous cystadenoma, signet ring cell carcinoma, solid and pseudopapillary tumors, squamous cell carcinoma, and finally, undifferentiated carcinoma [13]. The endocrine tumors are called pancreatic neuroendocrine tumors (PNETs) or islet cell tumors. They are much less common than exocrine tumors, making up about 7% of all pancreatic cancers. A pancreatic neuroendocrine tumor can be functioning or nonfunctioning, meaning a functioning tumor produces hormones [14]. The American Society of Clinical Oncology (ASCO) has issued a series of guidelines on the management of potentially curable, locally advanced unresectable, and metastatic pancreatic cancers [3].

Early genetic studies of pancreatic cancer have clearly stated that the activating K-ras mutations, inactivating mutations or deletions in the TP53, CDKN2A, and SMAD4 tumor suppressor genes lead to the progression of PDAC [15-17]. By the use of next generation sequencing techniques such as whole genome and deep-exome sequencing analyses, valuable comprehensive genomic data is collected. These advanced studies clarified for us the molecular and cellular heterogeneity based on the different transcriptional networks (gene expression profile) which are playing roles in the pathogenesis of PDAC [18]. Based on the defined transcriptomic gene programs, such as signaling pathways (K-ras, TGFβ, NOTCH) and cellular mechanisms (cell cycle, DNA repair, RNA processing) applied to a large cohort of patients’ data, four PDAC subtypes were identified. Thus, in 2018 Torres et al. stated that identification of the PDAC subtypes [Squamous type (31%), pancreatic progenitor type (19%), immunogenic type (29%) and aberrantly differentiated endocrine exocrine (ADEX type (21%)] will be helpful for personalized diagnosis and individualized treatment dealing with the molecular and cellular heterogeneity of PDAC [19,20]. Interestingly, only the ADEX subtype shows the endocrine and exocrine dysfunction which may be linked to DM and PC pathogenesis [15,18-20].

From the clinical perspective, in clinical suspicion of pancreatic cancer within the frame of ASCO guidelines, the general algorithm for the evaluation of a patient starts with the multidisciplinary review of various diagnostic imaging modalities, such as computed tomography (CT or CAT) scan, positron emission tomography (PET) scan or PET-CT scan, magnetic resonance imaging (MRI), transabdominal ultrasound, endoscopic ultrasound (EUS), endoscopic retrograde cholangiopancreatography (ERCP) and percutaneous transhepatic cholangiography (PTC) used with tissue biopsies in addition to blood testing. Applied biopsy and tissue testing which include fine needle aspiration (FNA) and core needle biopsy sampling from the pancreas, have importance to make the diagnosis. To this date, there is no reliable early diagnostic marker to detect the progression of pancreatic cancer [21-25].

Since 2016 ASCO experts have issued a series of recommendations for the management of pancreatic cancer tailored to the stage of the disease [3]. In general a system is used for the results from diagnostic tests, scans, and surgery to answer these questions: Stage 1A, 1B, 2, 3 and 4 mean the size of the cancer and whether it has spread (stages 1 to 4). The numbering system is termed TNM standing for ‘Tumor, Node, Metastases’ to indicate the stage of cancer [13]. In the classification of human PanIN (pancreatic intraepithelial neoplasia) progression from the normal duct has key morphological characteristics as well as accumulation of genetic mutations in identified nuclear genes, such as KRAS, CDKN2A, TP53, SMAD4 and BRCA2 [26]. Based on the histological features, progression to pancreatic adenocarcinoma (PDAC) is defined by invasion of tumor epithelial cells through the basement membrane. Schematic representation of normal exocrine pancreas cells, and transitioning of dysplastic PanIN and PDAC is shown in Figure 1.

The Pancreas and Insulin

“The pancreas makes insulin. Insulin keeps the level of sugar in the blood at a stable level. This means that the body cells get enough food, but not too much. The pancreas makes and releases more insulin if the level of sugar in the blood is high. If the level is too low, it releases less. You have diabetes if you don’t make enough insulin” [27]. This simple statement emphasizes the major impact of the pancreas in DM, consequence of the lack of pancreatic substance transported by the blood stream. This original discovery made by Oscar Minkowski in 1889, is the most important one in the history of diabetes, and a monument in medical research [27]. Diabetes Mellitus is presently classified into two main forms, type 1 (MIM#222100) and type 2 (MIM#125853) diabetes, however type 2 diabetes (T2D) is heterogenous. Autoantibodies against pancreatic islet B-cell antigens is present in type 1 diabetes which is diagnosed at young ages. Type 2 is more prevalent as 75-85% of patients are classified with this form. In addition to type 1 and 2 forms, pancreatic cancer-induced diabetes is another form and is classified as pancreatogenic type 3c diabetes mellitus (T3cDM) which accounts for <10% of all diabetes cases. The underlying physiopathology of T3c DM and PC is still poorly understood [28-30].

Clinical classification and molecular subtyping studies done in recent years have not yet been incorporated into a revision of diabetes classification. In 2018, Groop et al. in Lund University identified five clusters of DM patients with different characteristics and risks of complications in four separate populations (n=14755 in Sweden and Finland). Individuals more resistant to insulin (cluster 3) had significantly higher risk of diabetic kidney disease than individuals in clusters 4 and 5. Individuals in cluster 2, insulin deficient, have the higher risk of retinopathy. Based on this group classification, genetic associations Single Nucleotide Polymorphism Analysis (SNP analysis) in the clusters differed from those seen in traditional T2D [31]. It is strongly stated that, by the use of this clustering/classification system, patients can be identified at high risk of diabetic complications at diagnosis and information about the underlying mechanisms, will guide the choice of therapy [31,32]. More clinical data collected from other ethnicities in larger cohorts will help to make a better classification of diabetes subtypes, as it is a heterogenous metabolic disorder [33,34].

Based on the biological complexity of PC, a bidirectional relationship between DM and PC has been identified, since 2005 [35]. As stated earlier, many recent studies have concluded that DM is both a consequence, as well as, a cause for PC [36]. Overall, studies report that most patients with pancreatic cancer have hyperglycemia or diabetes. Similarly, patients with new-onset diabetes have an escalated risk of being diagnosed with pancreatic cancer. The connection between PC and DM has been explained by several translational, clinical and epidemiological studies. The largest original epidemiological studies showed clearly that new-onset hyperglycemia and DM are early signs of PC [28,30,35,36]. As PC is usually diagnosed at the late stage of the disease, given the overall 5 year survival rate is less than 5%, the duration of survival actually depends on the histological TNM grading of tumor and the resection ratio [29,37,38]. Based on time-risk relationship, progressive beta-cell failure in long-standing T2D is definitely a risk factor for PDAC [14,39].

Diabetes Mellitus and Pancreatic Cancer Association at the Cellular Level

In general, diabetes is known as a multifactorial/polygenic and deficient carbohydrate metabolism disease which is characterized by hyperglycemia due to the defect in insulin secretion or action, or both. Recent epidemiological studies, and meta-analyses examining the association between the diabetes mellitus and pancreatic cancer indicate that; there is a multidirectional relationship between T2D and PC. Long-standing diabetes is an increased risk factor (1.5 to 2 fold) for PC; and new-onset diabetes (type 3c) is a possible clinical marker of asymptomatic pancreatic cancer [30,35,36,40]. DM, being the most significant disorder of glucose metabolism and as DM is genetically heterogeneous, variants of more than 50 nuclear genes have been found for the genetic risk by genome-wide association studies [16,39]. From the clinical perspective, the main symptoms are polyuria, polydipsia, weight loss, polyphagia, and blurred vision [41].

Type 1 Diabetes (T1D) is the result of destruction of the beta cells that leads to insulin deficiency, whereas T2D is the defect in insulin secretion caused by insulin resistance in the cells that leads to insulin over secretion then to insulin deficiency. Other known diabetes types are associated with the nuclear gene defects of beta cells such as MODY (Maturity onset diabetes of the young; MIM#125853), MELAS (Mitochondrial encephalopathy, lactic acidosis, and stroke -like episodes; MIM#540000) and endocrinopathies [34].

To date, several characteristics are identified in genetically engineered mouse models and summarized below for the association of DM and PC. Overall possible mechanisms could be due to mechanical defects, mechanical obstruction and/or enlargement of pancreatic ducts [11,42]; glycogen synthesis defects which are caused by the post-insulin receptor defects and glycogen storage [42]; plasma glucagon levels and islet amyloid polypeptide [39,43]; presence of K-ras codon 12 mutations (p.G12D;p.G12V) [4,13]; prognostic factors as tumor sizes and molecular factors [13]; increased levels of Insulin Growth Factor 1 (IGF-1) and its receptor in promoting carcinogenesis [36,39,44]; activation of Transforming Growth Factor (TGF-β) signaling and depletion of β-cells in Langerhans islets [45,46]; hyperglycemia induced levels of hydrogen peroxide that up regulates manganese superoxide dismutase (SOD2) expression that activates ERK and p38MAPK pathways, NF-kP and AP-1 transcription factors [25,47] and hyperglycemia induced levels of glycation end products that increases inflammation and metastatic ability, increased cytokines and receptors like epidermal growth factor (EGF), epidermal growth factor receptor (EGFR), Glial cell line derived neutrophilic factor (GDNF) [36,46,48] are potentially involved mechanisms in the pathobiology of pancreatic cancer [13,15,38,46,49-51].

Based on all these pathobiological measurements of the subtypes of diabetes mellitus, it is likely that a combination of blood-based biomarkers in correlation with the clinical/pathologic characteristics of diabetic patients could be very useful in early cancer detection and further studies should be done. Today, no blood-based biomarker is currently validated to differentiate between T2D or other cancer associated DM. Therefore, only 4 potential biomolecules are used in clinical practice currently. These are, Vanin-1 (VNN1), Adrenomedullin, CA19-9, and CEA, the ‘analytes’ that are used in clinical studies, so far [10,11,36,50,52].

A novel cell surface molecule that is involved in the thymus homing of bone marrow cells, is Vanin-1 which functions as a member of the biotinidase branch of the nitrilase superfamily. It is a glycosylphosphatidylinositol (GPI)-anchored molecule. In 1996, Aurrand-Lions et al. reported the cDNA cloning and functional analysis of mouse vanin-1, afterwards in 1998, Galland et al. identified cDNAs encoding human vanin-1 (VNN1; vascular noninflammatory molecule-1), which is located on human gene 6q21-q24. It is suggested that vanin-1 regulates late adhesion steps of thymus homing under physiologic, noninflammatory conditions. Elevated vanin-1 expression and activity serve a biomarker for pancreatic cancer associated new-onset diabetes [52]. Recently, novel heteroaromatic compounds as inhibitors of vanin-1 are used for the treatment of cancer and inflammatory diseases [53].

Another used biomarker is Adrenomedullin (ADM) which is a hypotensive, multifunctional regulatory peptide. It is found in human pheochromocytoma, consists of 52 amino acids and shows slight homology with the calcitonin gene-related peptide which is located on chromosome 11p15.2. ADM gene (consists of 4 exons) is located on chromosome 11p15.4, and encodes for a preprohormone, which is post-translationally processed to generate 2 biologically active peptides: adrenomedullin and proadrenomedullin N-terminal 20 peptide (PAMP). The latter may serve as a hormone in circulation because it is found in blood in a considerable concentration. Most importantly, adrenomedullin exerts paracrine effects on pancreatic β cells impairing insulin secretion, causing glucose intolerance, and thus leads to β cell dysfunction [54]. Studies strongly support that ADM is highly expressed in pancreatic cancer and stimulates pancreatic cancer cells leading to increased tumor growth and metastasis. ADM would be a possible target for pancreatic cancer treatment [50].

Presently, CA19-9 is an established biomarker, and is a modified Lewis A glycan blood group antigen, a component of glycoproteins and mucins. It is a tetra-saccharide, usually attached to O-glycans on the surface of cells. It is currently used in monitoring patients for PDAC progression and/or after surgical resection [55-57]. However, because of differences in the antibody specificities or differences in the assay platforms, the CA19-9 detection results are inconsistent [58].

In addition to CA19-9, the carcinoembryonic antigen (CEA) (MIM#109770; NC_000019.10) is another well-known biomarker in many cancers. The CEA gene family belongs to the immunoglobulin superfamily and is located on chromosome 19q13.1-q13.2. It is a diverse set of secreted highly glycosylated glycoproteins. Members of the CEA family consist of a single N domain, with structural homology to the immunoglobulin variable domains, followed by a variable number of immunoglobulin constant-like A and/or B domains. Based on sequence similarity and functional characteristics, the CEA family has been subdivided into the CEA subgroup and the pregnancy-specific glycoprotein (PSG) subgroup. The order of these 9 CEA subgroup genes is CEACAM4, CEACAM7, CEACAM5, CEACAM6, CEACAM3, CEACAM1, CEACAMP2, CEACAM8 and CEACAM to telomere organization [59,60]. However, genes in the CEA and PSG subgroups have a similar gene structure and organization. Both have multiple cellular activities, including roles in the differentiation and arrangement of tissue three-dimensional structure, angiogenesis, apoptosis, tumor suppression, metastasis, and the modulation of innate and adaptive immune responses. Thus, due to its multiple transcript variants, CEA is one of the most clinically useful biomarkers in PDAC, so far [55].

Most of the published papers have shown that CA19-9 and CEA are the potential preferred glycans for monitoring the disease progression because of higher specificity/sensitivity for pancreatic cancer [48,58,61]. It is evident that aberrant glycosylation patterns of cell surface and secreted glycoproteins occur during malignant transformation and cancer progression as a “hallmark of cancer”. This enzymatic process produces glycosidic linkages of saccharides to other saccharides, lipids, or proteins which can affect the activity and localization of proteins/transmembrane proteins involved in cell-cell adhesion [48,61]. Recently, it has been noted that N-glycosylation profiles or the ‘N-glycome’ of the potential protein biomarkers or panels of biomarkers are emerging as potential therapeutic targets in the various types/subtypes of diabetes [62,63]. In light of this, we believe that more hyperglycemia induced levels of glycosylated protein biomarkers will be found and helpful to understand the association of subtype-diabetes with subtype-pancreatic cancer in future. This can be a tool for personalized medicine in the future, as well.

Conclusions

Although the relationship between diabetes mellitus and pancreatic cancer is an innovative and inspiring field of research, several clinical points warrant more clarification. At present, the relationship/association between PC and DM is not well established. The reason for this unsolved relationship might be the complex nature of both diseases, e.g., various types of Diabetes and subtypes of pancreatic cancers. However, due to the aggressive nature of PC and the lack of blood-based biomarkers, glycosylated molecules represent a promising tool to help in the development of prediction, monitoring and treating agents (therapeutics) to improve low survival rates. Based on N-glycome profiling, large scale clinical studies need to be explored in classified DM patients in correlation with subtyped PC patients. Taken together based on the epidemiological data reflecting the alarming increase in worldwide obesity, there is an urgent need for improved understanding of the molecular pathology that can be utilized to develop novel blood based biomarkers and new therapies for pancreatic cancer.

Abbreviations

PC: Pancreatic Cancer; DM: Diabetes Mellitus; PP: Pancreatic Polypeptide; VIP: Vasoactive Intestinal Peptide; PDAC: Pancreatic Ductal AdenoCarcinoma; IPMN: Intraductal Papillary Mucinous Neoplasm; PNET: Pancreatic NeuroEndocrine Tumors; ASCO: American Society of Clinical Oncology; ADEX: Aberrantly differentiated Endocrine Exocrine; CT, CAT: Computed Tomography; PET: Positron Emission Tomography; MRI: Magnetic Resonance Imaging; EUS: Endoscopic Ultrasound; ERCP: Endoscopic Retrograde Cholangiopancreatography; PTC: Percutaneous Transhepatic Cholangiography; FNA: Fine Needle Aspiration; PanIN: Pancreatic Intraepithelial Neoplasia; LAPC: Locally Advanced Pancreatic; HNPCC: Hereditary Non-polyposis Colorectal Cancer; FAP: Familial Adenamotous Polyposis; T1D: Type 1 Diabetes; T2D: Type 2 Diabetes; T3cDM: Type 3c Diabetes Mellitus; MODY: Maturity Onset Diabetes of the Young; MELAS: Mitochondrial Encephalopathy, Lactic Acidosis, and Stroke-like Episodes; IGF-1: Insulin Growth Factor 1; TGF–β: Transforming Growth Factor; SOD2: Superoxide Dismutase; EGF: Epidermal Growth Factor; EGFR: Epidermal Growth Factor receptor; GDNF: Glial Cell Line Derived Neutrophilic Factor; VNN1: Vanin-1, Vascular Noninflammatory molecule-1; GPI:Glycosylphosphatidylinositol; ADM: Adrenomedullin; PAMP: Proadrenomedullin; CEA: CarcinoEmbryonic Antigen.

Declarations

Author’s Contributions

Ozge Alper drafted and reviewed the manuscript. Saeyoung Nate Ahn reviewed the manuscript. Martha Knight reviewed and edited the manuscript. Ozgul M Alper wrote and reviewed the manuscript. All authors read and approved the final manuscript.

References

  1. Raimondi S, Maisonneuve P, Lowenfels AB (2009) Epidemiology of pancreatic cancer: an overview. Nat Rev Gastroenterol Hepatol 6: 699-708. [crossref]
  2. Siegel RL, Miller KD, Jemal A (2017) Cancer Statistics. CA Cancer J Clin 67: 7-30. [crossref]
  3. Khorana AA, Pamela B Mangu, Jordan Berlin, Anitra Engebretson, Theodore S Hong, et al. (2017) Potentially Curable Pancreatic Cancer: American Society of Clinical Oncology Clinical Practice Guideline Update. J Clin Oncol 35: 2324-2328. [crossref]
  4. Idachaba S, Oluwafemi Dada, Olalekan Abimbola, Olamide Olayinka, Akunnaya Uma, et al. (2019) A Review of Pancreatic Cancer: Epidemiology, Genetics, Screening, and Management. Open Access Maced J Med Sci 7: 663-671. [crossref]
  5. Ferlay J, Colombet M, Soerjomataram I, Dyba T, Randi G, et al. (2018) Cancer incidence and mortality patterns in Europe: Estimates for 40 countries and 25 major cancers in 2018. Eur J Cancer 103: 356-387. [crossref]
  6. Jia X, Peiling Du, Kusheng Wu, Zhenxi Xu, Jiaying Fang, et al. (2018) Pancreatic Cancer Mortality in China: Characteristics and Prediction. Pancreas 47: 233-237. [crossref]
  7. Zhao C, Feng Gao, Quwen Li, Qicai Liu, Xinhua Lin, et al. (2019) The Distributional Characteristic and Growing Trend of Pancreatic Cancer in China. Pancreas 48: 309-314. [crossref]
  8. McLaughlin S (1994) Pancreatic cancer and diabetes. Diabetes Educ 20: 20, 24, 26. [crossref]
  9. Klein AP, Kieran A Brune, Gloria M Petersen, Michael Goggins, Anne C Tersmette, et al. (2004) Prospective risk of pancreatic cancer in familial pancreatic cancer kindreds. Cancer Res 64: 2634-2638. [crossref]
  10. Guo Q, Muxing Kang, Bo Zhang, Ying Chen, et al. (2010) Elevated levels of CA 19-9 and CEA in pancreatic cancer-associated diabetes. J Cancer Res Clin Oncol 136: 1627-1631. [crossref]
  11. Zhang L, Sanagapalli S, Stoita A (2018) Challenges in diagnosis of pancreatic cancer. World J Gastroenterol 24: 2047-2060. [crossref]
  12. Roder PV, Bingbing Wu, Yixian Liu, Weiping Han, et al. (2016) Pancreatic regulation of glucose homeostasis. Exp Mol Med 48: e219. [crossref]
  13. Yachida S, Iacobuzio-Donahue CA (2009) The pathology and genetics of metastatic pancreatic cancer. Arch Pathol Lab Med 133: 413-422. [crossref]
  14. Vincent A, Joseph Herman, Rich Schulick, Ralph H Hruban, Michael Goggins, et al. (2011) Pancreatic cancer. Lancet 378: 607-620. [crossref]
  15. Aguirre AJ, Collisson EA (2017) Advances in the Genetics and Biology of Pancreatic Cancer. Cancer J 23: 315-320. [crossref]
  16. Giri B, Vrishketan Sethi, Vikas Dudeja, Sulagna Banerjee, Alan Livingstone, et al. (2017) Genetics of pancreatic cyst-cancer progression: standing on the shoulders of giants. Curr Opin Gastroenterol 33: 404-410. [crossref]
  17. Bhosale P, Veronica Cox, Silvana Faria, Sanaz Javadi, Chitra Viswanathan, et al. (2018) Genetics of pancreatic cancer and implications for therapy. Abdom Radiol (NY) 43: 404-414. [crossref]
  18. Bailey P, David K Chang, Katia Nones, Amber L Johns, Ann-Marie Patch, et al. (2016) Genomic analyses identify molecular subtypes of pancreatic cancer. Nature 531: 47-52. [crossref]
  19. Pishvaian MJ, Brody JR (2017) Therapeutic Implications of Molecular Subtyping for Pancreatic Cancer. Oncology (Williston Park) 31: 159-166, 168. [crossref]
  20. Torres C, Grippo PJ (2018) Pancreatic cancer subtypes: a roadmap for precision medicine. Ann Med 50: 277-287. [crossref]
  21. Kunovsky L, Pavla Tesarikova, Zdenek Kala, Radek Kroupa, Petr Kysela, et al. (2018) The Use of Biomarkers in Early Diagnostics of Pancreatic Cancer. Can J Gastroenterol Hepatol 2018: 5389820. [crossref]
  22. Jelski W, Mroczko B (2019) Biochemical diagnostics of pancreatic cancer – Present and future. Clin Chim Acta 498: 47-51. [crossref]
  23. Litman-Zawadzka A, Lukaszewicz-Zajac M, Mroczko B (2019) Novel potential biomarkers for pancreatic cancer – A systematic review. Adv Med Sci 64: 252-257. [crossref]
  24. Shen GQ, Essa M Aleassa, Matthew Walsh R, Gareth Morris-Stiff (2019) Next-Generation Sequencing in Pancreatic Cancer. Pancreas 48: 739-748. [crossref]
  25. Singhi AD, Eugene J Koay, Suresh T Chari, Anirban Maitra (2019) Early Detection of Pancreatic Cancer: Opportunities and Challenges. Gastroenterology 156: 2024-2040. [crossref]
  26. Hezel AF, Alec C Kimmelman, Ben Z Stanger, Nabeel Bardeesy, Ronald A Depinho, et al. (2006) Genetics and biology of pancreatic ductal adenocarcinoma. Genes Dev 20: 1218-1249. [crossref]
  27. Luft R (1989) Oskar Minkowski: discovery of the pancreatic origin of diabetes, 1889. Diabetologia 32: 399-401. [crossref]
  28. Pannala R, Ananda Basu, Gloria M Petersen, Suresh T Chari, et al. (2009) New-onset diabetes: a potential clue to the early diagnosis of pancreatic cancer. Lancet Oncol 10: 88-95. [crossref]
  29. Hart PA, Chari ST (2013) Diabetes mellitus and pancreatic cancer: why the association matters? Pancreas 42: 1207-1209. [crossref]
  30. Hart PA, Melena D Bellin, Dana K Andersen, David Bradley, Zobeida Cruz-Monserrate, et al. (2016) Type 3c (pancreatogenic) diabetes mellitus secondary to chronic pancreatitis and pancreatic cancer. Lancet Gastroenterol Hepatol 1: 226-237. [crossref]
  31. Ahlqvist E, Petter Storm, Annemari Käräjämäki, Mats Martinell, Mozhgan Dorkhan, et al. (2018) Novel subgroups of adult-onset diabetes and their association with outcomes: a data-driven cluster analysis of six variables. Lancet Diabetes Endocrinol 6: 361-369. [crossref]
  32. Zaharia OP, Pavel Bobrov, Klaus Strassburger, Kálmán Bódis, Yanislava Karusheva, et al. (2018) Metabolic Characteristics of Recently Diagnosed Adult-Onset Autoimmune Diabetes Mellitus. J Clin Endocrinol Metab 103: 429-437. [crossref]
  33. Lindholm E, Agardh E, Tuomi T, Groop L, Agardh CD (2001) Classifying diabetes according to the new WHO clinical stages. Eur J Epidemiol 17: 983-989. [crossref]
  34. Petersmann A, Dirk Müller-Wieland, Ulrich A Müller, Rüdiger Landgraf, Matthias Nauck, et al, (2019) Definition, Classification and Diagnosis of Diabetes Mellitus. Exp Clin Endocrinol Diabetes 127: S1-S7. [crossref]
  35. Chari ST, Cynthia L Leibson, Kari G Rabe, Jeanine Ransom, Mariza de Andrade, et al. (2005) Probability of pancreatic cancer following diabetes: a population-based study. Gastroenterology 129: 504-511. [crossref]
  36. Pizzato M, Federica Turati, Valentina Rosato, Carlo La Vecchia (2019) Exploring the link between diabetes and pancreatic cancer. Expert Rev Anticancer Ther 19: 681-687. [crossref]
  37. Lerch MM, Julia Mayerle, Ujjwal Mahajan, Matthias Sendler, Ulrich Weiss F, et al. (2016) Development of Pancreatic Cancer: Targets for Early Detection and Treatment. Dig Dis 34: 525-531. [crossref]
  38. Khadka R, Weijun Tian, Xin Hao, Rakshya Koirala (2018) Risk factor, early diagnosis and overall survival on outcome of association between pancreatic cancer and diabetes mellitus: Changes and advances, a review. Int J Surg 52: 342-346. [crossref]
  39. Andersen DK, Murray Korc, Gloria M Petersen, Guido Eibl, Donghui Li, et al. (2017) Diabetes, Pancreatogenic Diabetes, and Pancreatic Cancer. Diabetes 66: 1103-1110. [crossref]
  40. Wang F, Gupta S, Holly EA (2006) Diabetes mellitus and pancreatic cancer in a population-based case-control study in the San Francisco Bay Area, California. Cancer Epidemiol Biomarkers Prev 15: 1458-1463. [crossref]
  41. Mettu NB, Abbruzzese JL (2016) Clinical Insights Into the Biology and Treatment of Pancreatic Cancer. J Oncol Pract 12: 17-23. [crossref]
  42. Li J, Gang Cao, Qingyong Ma, Han Liu, Wei Li, et al. (2012) The bidirectional interation between pancreatic cancer and diabetes. World J Surg Oncol 10: 171. [crossref]
  43. Brand RE, Xian-Zhong Ding, Christine M Young, Thomas E Adrian (2002) The specificity of amylin for the diagnosis of pancreatic adenocarcinoma. Int J Gastrointest Cancer 31: 123-128. [crossref]
  44. Andersen DK (2013) Diabetes and cancer: placing the association in perspective. Curr Opin Endocrinol Diabetes Obes 20: 81-86. [crossref]
  45. Parajuli P, Thien Ly Nguyen, Céline Prunier, Mohammed S Razzaque, Keli Xu, et al. (2020) Pancreatic cancer triggers diabetes through TGF-beta-mediated selective depletion of islet beta-cells. Life Sci Alliance 3: e201900573. [crossref]
  46. Poston GJ, Gillespie J, Guillou PJ (1991) Biology of pancreatic cancer. Gut 32: 800-812. [crossref]
  47. Murtaugh LC (2014) Pathogenesis of pancreatic cancer: lessons from animal models. Toxicol Pathol 42: 217-228. [crossref]
  48. Munkley J (2019) The glycosylation landscape of pancreatic cancer. Oncol Lett 17: 2569-2575. [crossref]
  49. Hruban RH, Goggins M, Parsons J, Kern SE (2000) Progression model for pancreatic cancer. Clin Cancer Res 6: 2969-2972. [crossref]
  50. Aggarwal G, Vijaya Ramachandran, Naureen Javeed, Thiruvengadam Arumugam, Shamit Dutta, et al. (2012) Adrenomedullin is up-regulated in patients with pancreatic cancer and causes insulin resistance in beta cells and mice. Gastroenterology 143: 1510-1517 e1. [crossref]
  51. Eijgenraam P, Heinen MM, Verhage BAJ, Keulemans YC, Schouten LJ, et al. (2013) Diabetes type II, other medical conditions and pancreatic cancer risk: a prospective study in The Netherlands. Br J Cancer 109: 2924-2932. [crossref]
  52. Kang M, Wenjie Qin, Miranbieke Buya, Xin Dong, Wen Zheng, et al. (2016) VNN1, a potential biomarker for pancreatic cancer-associated new-onset diabetes, aggravates paraneoplastic islet dysfunction by increasing oxidative stress. Cancer Lett 373: 241-250. [crossref]
  53. Sabnis RW (2020) Novel Heteroaromatic Compounds as Vanin Inhibitors. ACS Med Chem Lett 11: 1674-1675. [crossref]
  54. Ramachandran V, Thiruvengadam Arumugam, Robert Langley, Rosa F Hwang, Pablo Vivas-Mejia, et al. (2009) The ADMR receptor mediates the effects of adrenomedullin on pancreatic cancer cells and on cells of the tumor microenvironment. PLoS One 4: e7502. [crossref]
  55. Ni XG, Bai XF, Mao YL, Shao YF, Wu JX, et al. (2005) The clinical value of serum CEA, CA19-9, and CA242 in the diagnosis and prognosis of pancreatic cancer. Eur J Surg Oncol 31: 164-169. [crossref]
  56. Ballehaninna UK, Chamberlain RS (2012) The clinical utility of serum CA 19-9 in the diagnosis, prognosis and management of pancreatic adenocarcinoma: An evidence based appraisal. J Gastrointest Oncol 3: 105-119. [crossref]
  57. Huang Z, Liu F (2014) Diagnostic value of serum carbohydrate antigen 19-9 in pancreatic cancer: a meta-analysis. Tumour Biol 35: 7459-7465. [crossref]
  58. O’Brien DP, Neomal S Sandanayake, Claire Jenkinson, Aleksandra Gentry-Maharaj, Sophia Apostolidou, et al. (2015) Serum CA19-9 is significantly upregulated up to 2 years before diagnosis with pancreatic cancer: implications for early disease detection. Clin Cancer Res 21: 622-631. [crossref]
  59. Brandriff BF, Gordon LA, Tynan KT, Olsen AS, Mohrenweiser HW, et al. (1992) Order and genomic distances among members of the carcinoembryonic antigen (CEA) gene family determined by fluorescence in situ hybridization. Genomics 12: 773-779. [crossref]
  60. Thompson J, Zimmermann W, Osthus-Bugat P, Schleussner C, Eades AM -Perner, et al. (1992) Long-range chromosomal mapping of the carcinoembryonic antigen (CEA) gene family cluster. Genomics 12: 761-772. [crossref]
  61. Munkley J, Elliott DJ (2016) Hallmarks of glycosylation in cancer. Oncotarget 7: 35478-35489. [crossref]
  62. Rudman N, Gornik O, Lauc G (2019) Altered N-glycosylation profiles as potential biomarkers and drug targets in diabetes. FEBS Lett 593: 1598-1615. [crossref]
  63. Carmicheal J, Asish Patel, Vipin Dalal, Pranita Atri, Amaninder S Dhaliwal, et al. (2020) Elevating pancreatic cystic lesion stratification: Current and future pancreatic cancer biomarker(s). Biochim Biophys Acta Rev Cancer 1873: 188318. [crossref]
fig 6

Conversion of IgM to IgG by Lysates of Burkitt’s Lymphoma Cells

DOI: 10.31038/TVI.2021111

Abstract

The immune response progresses by the dissociation of IgM to component IgG’s. What are the factors which guide the maturation? Cell lysates of Burkitt’s lymphoma cells (CRL-1647) strongly reduced IgM to smaller subunits, including those of IgG size with the antigenic identities of IgG. Sepharose column fractionation found them in size classes of 5 kDa to 20 kDa. Further identification of their components may give clues to therapeutic opportunities in the treatment of patients with hyperglobulinemias might result. Do patients lack the factors in 5 kDa to 20 kDa fractions or are their IgM’s deficient in receptors? Do B cells from normal subject contain such factors?

Introduction

The important landmark results of [1] showed that the IgM pentamer is an asymmetrical pentagon with an open groove that binds specific (AIM) protein. It contains one large gap. Other proteins could also bind in this way, perhaps leading to the evolution of single, ie. IgG, species. Here we examined the effects on IgM of protein and cell lysates of a leukemic cell line, CRL-1647. Lysates from 1.5 X l 08 cells were fractionated on Sepharose. The different size fractions were incubated with exogenous IgM to determine which ones could release immunopositive species, determined in Western blot analysis. IgG like proteins ~150 kDa and immunoreactive to IgG were released by fractions in the size range of 20 kDa to 5 kDa. When the fractions were incubated without exogenous IgM, IgG release was not found. Some IgG was found in the 150,000 MW size fraction with or without incubation, as expected, because the crude lysates contain endogeous IgG as well as IgM.

Mass spectroscopy analysis of the 20 kDa to 5 kDa fractions showed that they contained immunoproteins, as well as some proteins with catalytic activity, perhaps responsible for release of IgG from IgM. These experiments may provide clues to cell mechanisms responsible for the increased content of IgG found in Burkitt’s lymphoma cells after lucanthone and ionizing radiation treatment [2,3]. Incubation of exogenous or endogenous IgM with partially purified cell lysates released IgG immunopositive species. Presumably, proteases were responsible for the conversion of the IgM pentamers to IgG monomers, multimers, and fragments. Sepharose fractionation showed that active factor or factors in the conversion resided in 20 kDa to 5 kDa size classes. No detectable IgG was released when these fractions were incubated alone or without IgM. Small specific immunoglobulins were present in these Sepharose fractions, as determined by mass spectroscopy, but they are not known to be a factor in release of IgG. The factors described here might have relevance for certain hematological disorders, such as Waldenstrom’s macroglobulinemia. These patients have abundant serum IgM but little or no IgG. Is there a deficiency of factors such as those described here or are there IgM structural abnormalities in their IgM which render it refractory to normal factors?

Results

Experiments of Figures 1 and 2 showed that factors in lysates of CRL-1647 Burkitt’s lymphoma cells released IgG fragments, upon incubation with IgM. Purified IgM from a multiple myeloma patient or endogenous IgM from the Burkitt’s lymphoma cells served as substrates.

fig 1

Figure 1: Release of IgG reactive protein from exogenous substrate IgM was found in lanes 4-8. Enhancement of release by cell treatment with lucanthone (lanes 6 and 7) or radiation (lane 8) was not found, as with endogenous IgM (Ref #2) without further incubation. The released reactive species were not polydisperse, therefore, suggesting a specific attack on IgM.
Release of IgG fragments from exogenous human myeloma IgM by lysates of Burkitt’s lymphoma cells. Cell lysates were prepared from 3.5 X 10⁷ cells. Lysate contained 0.3 mg/ml in 1 ml final volume, followed by Western blot analysis, as in published Methods, appended. Twenty second exposure of the film.
Lane 1: No lysate. Lane 2: 5 µL of cell lysate incubated at 0°C for 50 minutes without exogenous IgM. Lane 3: 5 µL of cell lysate were incubated at 37°C for 50 minutes without exogenous IgM. Lanes 4 and 5: 5 µL of cell lysate incubated at 37°C for 50 minutes with 10 µL containing 0.45 µg of exogenous IgM. 10 µL of neutral loading buffer was added. Lanes 6 and 7: 5 µL from lucanthone treated cells were incubated at 37°C for 50 min. with 10 µL containing 0.45 µg of exogenous IgM, as above, before loading. Lane 8: 5 µL of cell lysate from cells taken 2 days after 10 Gy were incubated 50 min at 37°C with 0.45 µg of exogenous IgM. Lane 9: 0.45 µg of exogenous IgM in PBS (Fisher: myeloma monoclonal). Lane 10: 0.1 µg of IgG (Biolegend ultraleaf). Western blots were developed from a film exposed for 20 seconds (lanes-4-10). Endogenous IgM and IgG were only detectable after 10 minute exposures. Experiment was repeated twice.

fig 2

Figure 2: Release of IgG immuno positive species from endogenous IgM of Burkitt’s lymphoma cells CR2-1647 by lysate from those cells.
Cell lysates isolated from 1.5 X 10⁸ CRL-1647 cells were prepared in a final volume of 1 ml, as described in Methods. Exogenous IgM was not added to the lysate. The film was exposed for 4 minutes. The lysate protein content was 0.865 mg/ml.
IgG immunoreactive species were found in near the origins in lanes 2-7 and, as expected, in lanes 9 and 10. But released fractions were found; greater in lanes 5, 6, 7, containing 37°C incubated lysate material than in lanes 2,3,4, containing lysate material held at 0°C.
The faster anti IgG reactive material of lanes 5, 6, 7 were significantly more abundant than corresponding material in lanes 2,3,4 (p less than 0.029).
Lane 1: No cell lysate, mobility standards. Lanes 2, 3, 4: 0.2 µg/well of lysate incubated 1 hour at 0°C. Lanes 5, 6, 7: each received 0.32 µg/well of lysate incubated 1 hour at 37°C. Lane 8: no lysate added. Lane 9: 0.45 µg of exogenous human myeloma lgM. Lane 10: 0.1 µg of human IgG standard (Biolegend ultraleaf). One ml of lysate from 1.5 X 10⁸ CRL-1647 cells (not supplemented with IgM) contained:
Total protein: 865 µg.
IgM: 65 µg.
Faster IgG: 0.034 µg from lysate incubated 1 h at 0°C.
Faster IgG: 0.11 µg from lysate incubated 1 h at 37°C.
These values were determined from corresponding lanes of Western blot, as shown here and from other exposures of the Western blots not shown.
Results with lysates in these studies demonstrate their ability to release IgG reactive material from IgM. Interference from unknown sources in the lysates was encountered in many other experiments and in those of Figures 2. Column purification and fractionation was needed for characterization of the lysate fractions. Experiment was repeated twice.

Sepharose fractionation of the lysate showed that the release factors were mostly in 20 kDa to 5 kDa fractions (Figure 3). Some endogenous IgG was found in 250 to 110 kDa fractions and a high molecular weight fraction> 5000 kDa, contributed immunoglobulin specific protein, but were not studied further. The identity of release fractions B6 and B5 (20 kDa to 5 kDa) is to be the subject of further studies. So far, the immunoglobulin M-degrading enzyme of Streptococcus suis is the only known protease cleaving the IgM multimer specifically [4].

fig 3

Figure 3: Endogenous IgG was found in fraction B 10, a reference standard here. When incubated with IgM, fraction B6 was able to release IgG reactive species. Some IgG reactive material was associated with fraction A8, of unknown significance.
Gel filtration standards (BioRad) in a volume of 1 ml were injected into a Superose 6 Increase 10/300 GL (GE Life Sciences) in 50 mM Tris; pH 8.0, 0.1 M NaCl, 1 mM EDTA. The chromatogram was used to approximately calibrate the column for the analysis of Burkitt’s Lymphoma (CRL-1647) also injected in a volume of 1 ml.
The fractions in brackets correspond to the range of molecular weights that are within the range of our gel filtration markers.
Each well received 10 µL of Sepharose fraction and 10 µL of IgM. After incubation, 10 µl of loading buffer was added. The approximate molecular weight of protein in each fraction was calculated from the volume measurement at the beginning of each fraction. For example, fraction B- 11 contains proteins in the range of 250-500 kDa. IgG was found in fractions B 10.
FRACTION B6 contained factors or a factor which caused release of IgG, (reactive with anti IgG) when incubated with IgM. Without IgM no incubation of the fraction failed to release detectable IgG.
Endogenous IgG was found in fraction B 10, a reference standard here. When incubated with lgM, fraction B6 was able to release IgG reactive species. Some IgG reactive material was associated with fraction A8, of unknown significance.
Gel filtration standards (BioRad) in a volume of 1 ml were injected into a Superose 6 Increase 10/300 GL (GE Life Sciences) in 50 mM Tris; pH 8.0, 0.1 M NaCl, 1 mM EDTA. The chromatogram was used to approximately calibrate the column for the analysis of Burkitt’s Lymphoma (CRL-1647), also injected in a volume of 1 ml. A gel filtration separation was made of 1 mg of lysate of CRL-164 7 cells. Endogenous IgM and IgG are found in these lysates. Experiment was repeated twice.

The IgM pentamers appears to be an asymmetric pentagon with an open groove that binds the AIM protein, an apoptosis inhibitor of macrophage [5]. Other proteins may bind there and then digest IgM structures. IgG’s released by cell lysates in some experiments were between 150 kDa and 250 kDa (Figure 4). Presumably, some IgG protein monomers were released from the IgM pentamers with some remnant IgG proteins still attached to the monomers. Much immunopositive material from cell lysates migrated between the mobility of IgM and IgG. This may be due to incomplete digestion and release of IgG from pentamers, i.e. as fragments larger than IgG monomers. Self aggregation of 150 kDa IgG-like proteins might account for slower migration of considerable IgG immunopositive species. Self aggregation of the IgG standards also was found. The IgG standard in gels resembles the IgG species that was released from IgM (Figures 4-6).

fig 4

Figure 4: Sepharose fractionation of CRL 1647 lysates from a second harvest of CRL 1647 cells.
B5, B6, B7, released IgG reactive material, confirming results of Figure 2.
Release of IgG from exogenous IgM by Sepharose fractions, 4 to 20 kDa, from CRL 1647 lysate. Anti lgG antibody stained.
Lane 1: MW markers. Lanes 2, 3: 10 µL of Fraction B7 of Figure 4 incubated at 37°C with 0.45 µg of IgM. Lane 4,5: 10 µL of fraction B6 of Figure 4 incubated at 37°C with 0.45 µg of lgM. Lane 6, 7: 10 µL of fraction B5 of Figure 4 incubated at 37°C with 0.45 µg of lgM. Lane 8: No lysate. Lane 9: IgM. Lane 10: IgG (0.45 µg) 0.1 µg. Experiment was repeated three times.

fig 5

Figure 5: Western Blot.
B5, B6 did not release IgG reactive material when IgM was not included in the incubation.
Test of fractions incubated without IgM at 37°C 1 h. Refer to figure 3 for Sepharose fractions.
Anti IgG antibody stained.
Molecular weight markers: 10 µL fraction B11; 10 µL fraction B10; 10 µL fraction B9; 10 µL fraction B8; 10 µL fraction B7; 10 µL fraction B6; 10 µL fraction B5; 10 µL fraction B6; 10 µL fraction IgM 0.45 µg standard. Experiment was repeated twice.

fig 6

Figure 6: Digestion of IgM by another preparation of Sepharose fractions of CRL-1647 cell lysates. The Western blot was developed at 1/5 the sensitivity of the study in Figure 5.
Lane 1: IgM, undigested, 0.45 µg. Lane 2: IgM digested by Sepharose fraction B4 Lane 3: IgM digested by Sepharose fraction B5. Land 4: IgM digested by Sepharose fraction B6. Lane 5: IgM digested by Sepharose fraction B7. Lane 6: IgM digested by Sepharose fraction B8. Lane 7: IgM digested by Sepharose fraction B9. Lane 8: IgG digested by Sepharose fraction B 10. Lane 9: IgG standard 0.1 µg. Lane 10: MW standards (BioRad). 0.1 µg Standard IgG shown in lane 9 is polydisperse but most of it is seen when the other species are less evident. IgG migrated more slowly than expected. The 150 kDa and 250 kDa standards are faintly seen in lane 10. Inspection of lanes 3 and 4 suggests release of digestion products by Sephorose fractions 5 and 6 was greater than with other fractions. Lane 8 again indicates presence of IgG in Sepharose fraction B 10. Experiment was repeated twice.

We have identified the lysate digestion products of IgM as IgG by its immune relationship to IgG and its electrophoretic mobility (Figures 4 and 6). However, the amino acid composition of these species is needed for further definitive evaluation of them as IgG. Release of IgG immunopositive species after digestion of IgM with cell lysates exhibited in gels an array of polydisperse IgG positive entities. However, their mobility in the gels was similar to that observed with undigested IgG commercial standards in every study shown here. Their mobility, and that of the IgG standards were less than expected. Most of the IgG standard particles exhibited single mobility, as in lane 9 of Figure 6. The relevance of our findings of IgM sensitivity to certain 5 kD to 20 kD proteins should be explored, especially in patients with Waldenström’s macroglobulinemia [5]. Are these patients’ sera deficient?

Materials and Methods

Cells

CRL-1647 Burkitt human lymphoma cells (0 L) were purchased from American Type Culture Collection (ATCC), Manassas, VA 20108. They were grown in suspension at 37°C in Roswell Park Memorial Institute 1640 medium with 10% fetal bovine serum in 8% CO2 in a humidified atmosphere. The cell culture doubling time was 24 hours. Media and sera were from ATCC.

Cell Lysates

Cells were sedimented from phosphate buffered saline without Ca++ or Mg++, resuspended in lysis buffer with 10 µM Aprotinin and sonicated with 20 one-second strokes leaving 1-2% unbroken cells. Lysates of 107 to 108 cells that were clarified by centrifugation @ 15,500 g for 12 min contained approximately 1 µg/µl of protein. Lysis buffer: 0.lN NaCL, lmM EDTA, 0.05 M TRIS, pH 8.0 Aprotinin 10 µM.

Western Blots

For most experiments, 7 cm minigels, purchased from BioRad Laboratories, Los Angeles, CA were used. Buffer without SDS or methanol, containing 25 mM Tris, pH 8.3 and 192 mM glycine were used for gel electrophoresis and Western blot transfer. Human IgG l purified Ultraleaf Isotype l µg/ml CTRL was purchased from Biolegend 9727 Pacific Heights Blvd, San Diego, CA 92121. Human IgM 4.5 mg/ml was purchased from Fisher Thermofisher.com (product 31146). Horseradish peroxidase 0.4 mg/ml linked donkey anti human IgG was from Biolegend.

Sepharose Fractionation

Gel filtration standards (BioRad) in a volume of 1 ml were injected onto a Sepharose 6 Increase 10/300 GL (GE Lifesciences) in 50 mM Tris pH 8.0, 0.1 M NaCl, 1 mM EDTA. The chromatogram was used to approximately calibrate the column for analysis of Burkitt’s lymphoma lysate, also injected in a volume of 1 ml.

Mass Spectrometry Analysis

LC-ESI-MS/MS (liquid chromatography electrospray ionization mass spectrometry) analysis of the peptide digests was done by C18-Reversed Phase (RP) chromatography using an Ultimate 3000 RSLCnano System (ThermoScientific, USA) equipped with an Acclaim PepMap RSLC C18 column (2 µm, 100 Å, 75 µm x 15 cm, Thermo Scientific, USA). The UPLC was connected to a TriVersa NanoMate nanoelectrospray source (Advion, USA) and a linear ion trap LTQ-XL (ThermoScientific, USA) mass spectrometer with ESI source operated in the positive ionization mode. The MGF files generated from the raw LC-ESI-MS/MS data were searched by Mascot (version 2.5, Matrix Science, USA) against Swissprot AC database version 2016-05 (551,193 protein sequences) with the following search parameters: trypsin; two missed cleavages; peptide charges of +2 and +3; peptide tolerance of 2.5 Da; MS/MS tolerance of 0.8 Da; carbamidomethylation (Cys) for fixed modification; deamidation (Asn and Gin) and oxidation (Met) for variable modifications. A decoy database search was also performed to measure false discovery rate. The Mascot search results were validated by Scaffold version 4.1.1 (Proteome Software Inc., USA).

References

  1. Hiramoto E, Tsutsumi A, Suzuki R, Matsuoka S, Arai S, et al. The lgM pentamer is an asymmetric pantagon with an open groove that binds the AIM protein. Science Advances 4 eaau 1199.
  2. Bases R, Lekhraj R, Tang X, Huang JZ, Duan Z, et al. (2014) Enhanced content of IgG in Burkitt’s lymphoma cells after treatment with the topoisomerase II inhibitor, lucanthone. J Bioanal Biomed 9: 186-193.
  3. Bases R, Lekhraj R (2018) Ionizing Radiation and Lucanthone Enhance the IgG content of Burkitt’s lymphoma cells. J Bioanal Biomed 10: 105-107.
  4. Seele J, Beineke A, Hillermann LM, Jaschok B -Kentner, von Pauvel-Rammingen W, et al. (2015) The Immunoglobulin M-degrading enzyme of Streptococcus suis, ldessuis is involved in complement evasion. Veterinary Research 46: 45-59.
  5. Tedeschi A, Conticello kC, Rizzi R, Benevolo G, Laurenti kL, et al. (2019) Diagnostic framing of IgM monocolonal gammopathy: focus on Waldenström’s macroglobulinemia. Hematological Oncology 37: 117-128.
fig 1

Giant Multiloculated Left Ventricular Pseudoaneurysm

DOI: 10.31038/JCCP.2021412


A 85-year-old woman, with a previous history of pericarditis was admitted to the ED for dyspnoea with evident signs of congestive heart failure. The patient underwent two-dimensional transthoracic echocardiography that showed left ventricular ejection fraction of 40% with an akinetic postero-lateral wall. The postero-lateral wall shows a discontinuity of the myocardium at the apical segments with the evidence of a giant pseudoaneurysm (Ps): multiloculated in three different sac connected each other (Figure 1 panel A, online video 1).

The color-Doppler visualized at the neck of the Ps showed a systo-diastolic turbulent jet filling the multiloculated structure (Figure 1 panel B; online video 2). The apical 3-chamber view confirmed the large neck of the multiloculated Ps (Figure 2 panel A).

fig 1

Figure 1: A. 2D transthoracic echocardiography, apical 4-chamber view. LV=left ventricle; LA=left atrium; RV=right ventricle; Numbers 1 to 3 are the multiple locations of the pseudoaneurysm. B. Color-Doppler echocardiography shows the communication with the Ps sac.

The previous patient history of pericarditis could have play a role, saving from dramatic rupture a silent myocardial infarction and leading to creation of a multiloculated sac. This case presents some complications of an untreated sub-acute myocardial infarction as Ps and mitral regurgitation secondary to the tethering of the mitral posterior leaflet. (Figure 2 panel B).

fig 2

Figure 2: A. 2D transthoracic echocardiography, apical 3-chamber view. LV=left ventricle; LA=left atrium; Ao=aorta; Numbers to 3 are the multiple locations of the giant pseudoaneurysm. B. Color-Doppler echocardiography at apical 3-chamber view.

Considering the prohibitive surgical risk leading by age and co-morbidities after discussion at Heart Teem the patient was stabilized on optimal medical therapy and discharged. Untreated left ventricular Ps leads to loss of anterograde stroke volume and systemic cardioembolic events [1,2]. After myocardial infarction other common causes of Ps are: cardiac surgery, bacterial endocarditis and chest trauma [3].

Keywords

Acute myocardial infarction, Echocardiography, Left ventricular pseudoaneurysm

References

  1. Hung MJ, Wang CH, Cherng WJ (1998) Unruptured left ventricular pseudoaneurysm following myocardial infarction. Heart 80: 94-97. [crossref]
  2. Altinier A, Negri F, Belgrano M, Gianfranco Sinagra (2015) The eight-shaped heart: an incidental giant left ventricular pseudoaneurysm. Eur Heart J 36: 1488. [crossref]
  3. Frances C, Romero A, Grady D (1998) Left Ventricular Pseudoaneurysm. J Am Coll Cardiol 32: 557-561. [crossref]
CST 2018_117_F1

What is the Reason for Memory Deterioration during Aging?

DOI: 10.31038/ASMHS.2021517

Abstract

The fractional content of water soluble proteins in young and old rats’ brain has been studied. It has been established that the water soluble proteins in the brain of old rats are characterized by the excess of high molecular proteins, as compared to the proteins of young ones. We have supposed that the formation of high molecular proteins as a result of the aggregation of disulfide bonds of low molecular proteins should have been due to the determination of number of sulfhydryl groups. As a result of quantitative determination of sulfhydryl groups, the amount of disulfide bonds in the soluble proteins of the brain in old rats appeared to be 50-60% more, as compared to young rats. It turned out that the activity of NADP-H-dependent disulfide reductase enzyme was about 30-50% less. The impact of biologically active substances, which activate disulfide reductase on the activity of disulfide reductase and the elaboration of conditional avoidance reflex, was specially studied. It has been established that disulfide reductase activity in the various areas of old rats brain on average increases by 50-60-% and relatively the development of conditional avoidance reflexes and the memory is improved by 70%.

Keywords

Water soluble proteins, Sulfhydryl and disulfide groups, NADP-H-dependent enzyme

It has been established that young rats (4-7 months) for the correct decision of maze tests achieve a maximum criterion after the second test, while the old ones need (25-29 months) more tests, but still do not achieve a maximum criterion. As we have suggested these changes at the level of the brain proteins should have been due to the age of animals. For this purpose a quantitative distribution of water soluble proteins in the brain of young and old rats was studied according to molecular masses. It has been established that the soluble proteins of old rats were distinguished by the content of high molecular mass proteins. We have assumed that this should been have due to disulfide bonds of low molecular proteins, which, in our opinion, caused the aggregation of proteins and memory impairment. Based on the above-said, the number of sulfhydryl groups in the water soluble proteins of the brain in young and old rats was specially studied. After the homogenization of the cortex, white matter of the hemispheres, the cerebellum, the hippocampus and the medulla oblongata, the sulfhydryl groups in water extracts were determined by using the method on the device T-201 [1] developed by us and G. Ellman method [2]. The concentration of protein was measured by O. Lowry et al. method [3] (Table 1).

Table 1: Quantitative distribution of sulfhydryl and disulfhydryl groups in water soluble proteins in brain specific structures of young and old rats (10-6/100/mg protein).

Brain structures

Young rats

Old rats Young rats

-SH-

Old rats

-S-S-

The brain cortex

0.622

0.500 0.06

0.08

White matter

0.670

0.454 0.07

0.15

The cerebellum

0.680

0.526 0.06

0.12

Medulla oblongata

0.793

0.478 0.08

0.14

The hippocampus

0.543

0.352 0.05

0.12

Proceeding from the above-mentioned, we have got interested in the activity of NADP-H dependent disulfide reductase enzyme in the various brain areas of young and old rats [4-6]. The solution with the following content was used for the incubation: 0.5 ml buffer of Tris-HCl (pH 7.4, 0.5 ml DTNB (50 mM, 0.5 ml NADP-H (100 mM) and 0.5 ml; protein solution (1 mg/ml) [6]. As seen from the Table 2, the activity of HADP-H-dependent disulfide reductase is decreased about by 30-50% in the brain of old rats. Most researchers engaged in the study of reasons for the memory impairment attribute such changes in the functional activity of the brain to gene mutations and perhaps it is probable that the decrease in the activity of NADP-H-dependent disulfide reductase must be exactly the result of gene mutations at the level of nerve cells [7].

Table 2: The activity of NADP-H-dependent disulfide reductase of young and old rats in conventional units.

Brain structures

Young rats

Old rats

Cortex of hemispheres

0.125 ± 0.008

0.060 ± 0.003, <0.001

White matter

0.104 ± 0.013

0.058 ± 0.003, <0.003

The cerebellum

0.124 ± 0.009

0.064 ± 0.004 <0.001

Medulla oblongata

0.088 ± 0.004

0.062 ± 0.003, <0.01

The hippocampus

0.104 ± 0.005

0.087 ± 0.004, <0.01

Based on the above-mentioned, we started searching for the biologically active substances which activated the activity of disulfide reductase enzyme. The impact of the injection of biologically active substances into the ventricles of young and old rats’ brain on the activity of NADP-H-dependent disulfide reductase and the elaboration of conditional avoidance reflex was specially studied [8]. In the hemispheric cortex, the white matter, medulla oblongata and the hippocampus of the brain the number of sulfhydryl groups relatively increased by 30%, 29% and 37% only in old rats, as compared with the control, while under the influence of hydrocortisone the number of sulfhydryl groups increased by 45%. Relatively, the elaboration of conditional avoidance reflex and the memory was improved by 70% [6,8]. Based on the mentioned, we think that for the prevention it is desirable to take foods rich in amino acids containing sulfhydryl groups, cysteine and methionine: pork, salmon fillet, milk, cheese, chicken and turkey meat, sunflower, nuts, etc.

Noteworthy is the fact that in Nigeria, where the cases of Alzheimer’s disease are rare, the substances, inhibiting the activity of acetylcholinesterase in the vegetables have been discovered, at the affinity of which the activity of the enzyme is inhibited by the extract of Spondia mombin root bark – by 83.94%, the extract of Callophinophyllum inoophyllum root bark – by 58.52%, the extract of C. jagus leaves – by 74.25%, the extract of Combreteeum molle leaves and stem, relatively, by 90.42 and 88.13% [9]. It should also be mentioned that in conditions of memory impairment, the aged people were often offered to take the drugs, activating the cholinergic system. It is likely that at the expense of acetylcholinesterase activity inhibition, as a result of the accumulation of an exciting neurotransmitter – acetylcholine, the neurons and neuronal ensembles remain to be active for a long time and enhance the stabilization of memory engram. For the prevention it is necessary to activate the neurons and neuronal ensembles by reading, listening to classical music, playing chess, puzzle solution, learning foreign languages, physical trainings and active public activities [10]. Otherwise, while leaving neuronal ensembles in the state of hypokinesia for a long time a quantitative reduction of the number of synapses decreases, neuron death takes place and, as a result the memory is impaired [11].

Conclusion

Proceeding from the above data, one of the possibilities of memory improvement of aged people should be considered the recovery of disulfide bonds by means of those biologically active substances, by which the activation of NADP-H-dependent disulfhydreductase enzyme, the recovery of disulfide bonds excess and, in our opinion in the perspective, the memory improvement.

References

  1. Aleksidze N., Koshoridze N (1980) Determination of sulfhydryl groups by laboratory titrator T-201. Bull Experimental Biology and Medicine 89: 85-87.
  2. Ellman GL, Kcourtney YD, Andres V, Feather-Stone RM (1961) Rapid colorimetric determination of acetylcholinesterase activity. Biochem Pharmacol 7: 88-95. [crossref]
  3. Lowry OH, Rosenbrough NJ, Farr AL, Randall RJ (1951) Protein measurement with the Folin Phenol Reagent. J Biol Chem 193: 265- [crossref]
  4. Tietze T (1970) Arch Biochem Biophys 138: 112-114.
  5. Dringen R, Gutterer JM (2002) Glutathione reductase from bovine brain. Methods Enzymol 348: 281-288. [crossref]
  6. Aleksidze N, Koshoridze N (1984) Changes in disulfide reductase activity of rat brain at aging. Neirokhimia 3: 51-53 (in Russian).
  7. Aleman A (2018) Brain on pensions: what happens to the brain during aging? 450.
  8. Aleksidze N., Koshoridze N (1983) The impact of adrenaline and hydrocortisone on disulfide reductase activity of the brain. Neirokhimia 2: 199-204 (in Russian).
  9. Elufioye TO, Obuotor EM, Sennuga AT, Agbedahunsi JM, Adesanya SA (2010) Acetylcholinesterase and butyrylcholinesterase inhibitory activity of some selected Nigerian medicinal plants. Rev Bras Farmacogn 20: 45-50.
  10. Aleksidze N (2014) The basics of psychobiology. The Publishng House of Georgian National Academy of Sciences 223.
  11. Butz M, Ooyen A van (2013) A Simple rule for dendritic spine and axonal bouton formation can account for cortical reorganization after focal retinal lesions. PLoS Computational Biology 9: 1371-1380. [crossref]
Featured Image

Diabetic Foot Care in Patients with Mental Illness

DOI: 10.31038/ASMHS.2021515

Abstract

Foot disorder pathologies, caused by diabetes mellitus, result in diminishing the quality of life for patients and straining the economic fabric of both governmental institutions and private organizations. Patients afflicted with diabetes suffer from disabilities, which can in many cases lead to foot amputation and other various complications. Often, patients also suffer from chronic pain caused by diabetic foot neuropathy, which may make them unable to continue with their employment and have a negative effect on their daily lives. Patients with mental health disorders are adversely affected by diabetic foot pathologies due to their lack of timely follow-up and limited access to medical providers. The goal of this Practicum experience was to develop and deliver a PowerPoint presentation to provide clinical guidance and education to primary care clinicians who evaluate diabetic patients (many with mental health issues) who otherwise might not have an opportunity to be evaluated by a podiatrist in a timely manner. This author created the PowerPoint presentation based on the review of literature and the input from the committee members. The PowerPoint presentation on diabetic foot care was limited to the primary care clinical staff at the Queens County Medical Center in Queens, New York. The purpose of the practicum is for these clinicians to learn how to perform a comprehensive evaluation of the lower extremities in patients with diabetes, including awareness of risk factors prone to increasing risk of foot ulceration, screening for neurological foot deficits, analyzing treatment options for patients with diabetic foot maladies, andrevention strategies to prevent diabetic foot complications.

Keywords

Diabetic neuropathy, Diabetic foot care, Diabetic foot ulcer, Podiatry, Psychiatry and diabetes, Diabetes screening

Introduction

Nature of the Problem

Diabetes is a disorder, which can cause severe medical problems with the physiology of persons afflicted with it, and the silent nature of this malady can lead to medical disability in a manner where late intervention is futile. One of the greatest pathologies caused by diabetes is neuropathy in the peripheral lower limbs, which can cause not only physical injuries affecting mobility in patients but also issues with pain and poor healing, which can lead to chronic pain syndromes [1]. Diabetes occurs due to glucose not being properly regulated by either lack of insulin production by the pancreas or the inability of the body to use its own insulin in an effective manner. This process auses grave health consequences including lower-extremity amputations, a disease that is the seventh leading cause of death in the United States [2].

Patients, suffering from mental health problems, are especially harmed by diabetes as the lack of timely access to podiatric providers often leads to diabetic foot neuropathy. Neuropathy, which leads to loss of sensation in lower extremities of patients (due to the fact that these are longest nerves as they are involved in innervating all the way the bottom of the feet), can often cause ulcerations and foot sores, which are overlooked by these patients. The disorder of diabetic foot disease (DFD) is a combination of peripheral neuropathy and arterial disease, which often leads to an end result of foot ulceration and lack of appropriate management that can lead to lower extremity amputation complicated with an open wound infection or osteomyelitis [3]. Furthermore, this lack of foot malady awareness can cause these patients to not seek care for their feet and further compound these problems and, in many cases, lead to avoidable foot amputations. Additionally, these psychiatric patients face further barriers as they lack financial resources to see specialist clinicians promptly, are prone to increased risk by being on psychiatric medicines, which often increase their blood sugar levels, and lack proper housing and follow- up, which could enhance their medical care [4]. Proper screening, evaluation, and timely management and prevention of foot maladies in patients with diabetes have shown to significantly reduce the incidences of lower foot amputation and better health outcomes for diabetic patients [5].

Significance to Patients with Mental Illness

The provision of providing cutting-edge information to primary care practitioners, which includes screening, diagnosing, and treating psychiatric patients with diabetic fool maladies, facilitate the optimal goal of improving foot health care in this underserved population. The majority of mental health patients face challenges in seeing a podiatrist on a routine basis and thus, are at increased risk of diabetic foot pathologies due to the increased levels of hyperglycemia caused by psychiatric medications. The timely intervention of podiatric are provided by primary care clinicians will lead to positive health outcomes for patients afflicted with mental illness and improve their quality of life.

Review of Literature

Overview

The Centers for Disease Control and Prevention (CDC) defines diabetes as a disorder, which leads to increased blood glucose levels in the body (CDC, 2015). Diabetes occurs due to glucose not being properly regulated by either lack of insulin production by the pancreas or the inability of the body to use its own insulin in an effective manner. This process auses grave health consequences, including lower-extremity amputations, a disease that is the seventh leading cause of death in the United States (CDC, 2015). According to the CDC, approximately 29.3 million people in the United States (9.3% of the population) have diabetes with another 86 million people having a pre-diabetic condition (CDC, 2015). The incidence of diabetes mellitus is expected to increase from 382 million people in 2013 to 592 million by 2035 with the vast majority of cases present in developing countries, which will also see the greatest increase in the number of these cases [6]. It is ironic that as the world has developed exponentially in the fields of basic health care, disease and infection management, and improved diet for all in the last several decades, the elevated incidences of diabetes is a reminder of how overindulgence in this abundance of dietary choices and lack of exercise can lead to such a blood glucose malady [6].

Diabetic Neuropathy

DFD is a combination of peripheral neuropathy and arterial disease, which often leads to an end result of foot ulceration and the lack of appropriate management of DFD can lead to lower extremity amputations complicated with an open wound infection or osteomyelitis [3]. The World Health Organization (WHO) in conjunction with the International Diabetes Federation (IDF) have set a goal of reducing amputations related to diabetes complication by up to 50% by initiating a multipronged approach of increasing patient education about diabetes, forming a multidisciplinary team of various specialties involved with the patient, and timely patient monitoring, which has shown to decrease amputation rates from 49% to 85% [7]. Neuropathy leads to loss of sensation in the lower extremities of patients (due to the fact that the bottom of the feet are enervated by the longest nerves in the body) and can often cause ulcerations and foot sores, which are overlooked by these patients. Furthermore, this lack of foot malady awareness can cause these patients to not seek care for their feet and therefore further compound these problems; a tragic complication leading to avoidable foot amputations [3].

Central Nervous System Effects

Diabetes can cause significant damage to the organs of the central nervous system, primarily the brain. The increased levels of glucose present in the blood stream cross the blood-brain barrier leading to consequences, which include (a) encephalopathy due to problems metabolizing the increased glucose in the blood stream; (b) elevated risk of brain stroke due to elevated intracranial pressure as a result of chronic, uncontrolled diabetes; (c) potential of brain damage and white matter changes in the cerebral cortex due to the long term use of insulin and other hypoglycemic medications; (d) possibility of seizures due to elevated blood sugars decreasing the seizure threshold; and (e) potential of cognitive changes when hyperglycemia goes unchecked for long periods of time [8].

Peripheral Nervous System Effects

The effects of long-term elevated serum glucose levels have a deleterious effect on the nerves of the peripheral nervous system. The first effect, causing the most common nerve damage in diabetes mellitus, is called diabetic neuropathy, which impedes the sensation perceived by the sensory nerves as they relay messages to the brain [9]. Additionally, motor nerves are also affected as they slow down messages from the brain to move muscles in a timely manner affecting body reflexes to stimuli [10]. The second effect is autonomic neuropathy, which is a process whereby gastrointestinal functions such as digestion are affected by elevated blood sugar levels. Furthermore, autonomic involuntary functions such as blood pressure and heart pulse are often disrupted while also leading to sexual dysfunction (CDC, 2015). Another adverse effect is diabetic gastroparesis, which affects the passage of food through the stomach, as muscles in the colon do not interact in an effective manner, leading to multiple systemic medical complications [9]. Moreover, the process called focal diabetes-related neuropathy causes individual cranial nerves to transmit signals less effectively resulting in vision loss and hearing problems [9].

Diabetic Foot Effects

Epidemiology

There is an increased incidence of diabetes in the world, especially as the accessibility of medical care has improved [6]. The world population is living longer although enduring more diseases as people age with the latest estimate of 592 million people diagnosed with diabetes by 2035 [6]. Males, especially over the age of 60, are at the highest risk of developing DFD with the presence of foot ulceration a major indicator leading to risk of foot amputation, a lifetime risk of almost 25% prevalence in the general population [3]. The rate of foot ulceration increased by 700% in patients with diabetic neuropathy when compared with patients without diabetes and its associated conditions [3]. The National Institute of Diabetes and Digestive and Kidney Diseases (NIDDKD) estimated that about 60% to70% of the world population with diabetes suffers from neuropathy (age and disease duration causing increased risk) and the highest rates are among people with diabetes for over 25 years [11].

Etiology

The lack of knowledge regarding this disease, unable to see providers on time, lack of screening protocols, difficulty in managing blood sugar levels, and the limited follow-up options available for patients often led to this result of foot amputation [3]. The loss of sensation due to sensory nerves being initially unresponsive to light stimuli makes the patients unaware of any stressors affecting their lower extremities, which often results in foot injuries being unheeded. Gradually, this loss of sensory stimuli perception ascends into more proximal areas of both feet bilaterally, and by then, most of the damage has been done in terms of nerve neuropathy. Often, patient complaints gradually evolve from tingling sensations and shock-like lower extremity pain to abnormal hot and cold sensation to their feet; a process that eventually leads to foot cramping with anatomic changes like hammer toes, flat feet, and foot pressure ulcerations [3]. These anatomic results are directly from motor nerves being affected during the later phases of DFD after initial sensory foot deprivation. Another common malady leading to foot dysfunction includes autonomic changes in the feet, which can often manifest itself as dry skin, cracked skin changes, excessive foot sweating at times, and loss of deep tendon reflexes. The difficulty of blood to flow back from the veins in the feet against gravity leads to foot edema, which is another major risk factor of DFD [3].

Risk Factors

There are various risk factors which can make an individual prone to be diagnosed with diabetes mellitus relative to the general population. Family history plays a significant part in elevating a person’s chance of getting diabetes. The elevated risk can be as high as 2.3 to 5.5 times a person without a familial history of diabetes [12]. Multiple other risk factors include obesity, waist circumference, inactivity, and history of gestational diabetes. Additionally, American Indians, Hispanics, and Asians were noted to have elevated risk of being diagnosed with diabetes compared to the general population [10]. It was also noted that losing muscle mass, co-morbid medical conditions, and gaining weight due to inactivity also led to increased prevalence of diabetes in the older population [10]. High blood pressure, increased triglycerides, and elevated cholesterol levels also were noted to be risk factors in developing this illness [12].

Oral Medications

There are multiple medications used to mitigate the adverse effects of diabetes by attempting to keep blood sugar levels down with the goal being to prevent long term central and peripheral manifestations of this disease. The majority of these classes of drugs include metformin, sulfonylureas, thiazolidinediones, meglitinides, dipeptidyl peptidase inhibitors, and glucagon receptor agonists, which are used as monotherapy and in combination, to treat adults with type 2 diabetes [13]. There was an average of 1% decline in Hemoglobin A1c (an indicator of blood sugar levels over the last three months) with these prescribed medications and there was no difference between a single drug or a combination.

Lifestyle

Patients with diabetes must adhere to a lifestyle, which includes awareness of risk factors prone to increasing their risk of foot ulceration, be aware of self-screening for neurological foot deficits, speak to their clinicians proactively regarding treatment options for diabetic foot maladies, andrevention strategies to prevent diabetic foot complications [14]. Additionally, patients must be encouraged to ensure compliance with foot care protocols and adherence to follow-up recommendations and appointments [14].

Diagnosis

History

A prominent risk factor, which leads to adverse effects from diabetes is the asymptomatic nature of this illness in its early stage. Patients are often not aware of their hyperglycemic status until they start experiencing symptoms. Early detection of diabetes leading to initiation of diet and exercise regimens with possible utilization of oral hypoglycemics has positive outcomes for patients. The signs and symptoms of diabetes include: (a) lethargy, (b) chronic feelings of hunger, (c) excessive urination with corresponding feelings of being thirsty most of the time, (d) dry skin, and (e) blurred vision [15]. Patients with diabetes are also prone to yeast infections due elevated blood sugars providing a nutritional source for yeasts and due to their immunocompromised status. Nerve damage associated with neuropathy can cause long duration for injuries to heal while also causing numbness and tingling in extremities. It takes a combination of factors, such as the patient history, family history, clinical foot exam, and the utilization of diagnostic exams, to best screen the patient for severity of DFD [15].

It is imperative that focused questions need to be asked during the history taking portion of evaluation which would include (a) is the patient’s blood sugar monitored by the patient on an ongoing basis and is it well controlled; (b) are the medications taken by the patient for diabetes causing any adverse side effects including episodes of hypoglycemia; (c) has the patient been referred to podiatrists, ophthalmologists, nephrologists to evaluate and manage systemic issues caused by their diabetes; (d) has the patient been involved in their diet management by exercising and eating in a health manner; (e) has the patient kept up-to-date with their immunizations including annual flu vaccine shots; and (f) has the patient made aware of all foot complications caused by diabetes and has the patient been educated in foot care, including keeping the foot area dry, examining the foot area on a regular basis for any bruises or injuries and ensuring that their toe nails are trimmed regularly by a podiatrist [3].

Physical Exam

The physical exam component of the evaluation of a patient with diabetes must ensure that the patient’s body mass index (BMI) is maintained in the normal range while also ensuring that the patient maintains a consistent exercise regimen (NIDDKD, 2008). Vital signs must be monitored for hypertension and orthostatic blood pressure must be performed regularly to rule out signs of autonomic neuropathy [7]. Physical exam techniques must also evaluate the foot of the patient regularly for injuries and pulses must be palpated to monitor for adequate blood flow to the extremities [7]. A combination of deep tendon reflexes, sensory lower extremity exams, and vibration tests must be performed to evaluate patient for any metabolic foot maladies [3]. An ophthalmology exam must be performed to rule out neo-vascularization in the retinal region and flame hemorrhages which are often noted in diabetic patients with poor blood sugar control (NIDDKD, 2008). A thorough skin examination must be performed to screen for skin atrophy, dryness, yeast infections and discoloration of the skin, which if often noted in diabetic patients [4].

Lab Studies

There are multiple scales, which can be used to measure foot maladies, and they might utilize measures, such as capillary refill, pedal pulses, foot deep tendon reflexes, pathological Babinski reflexes, and pedal edema on rating scales [15]. Commonly used screening diagnostic methods, such as neuropathy symptoms scores, Semmes-Weinstein monofilament, vibration perception on the lower extremities from distal to proximal, nerve conduction studies, and even nerve biopsy, are valid tools in the arsenal for diabetic neuropathy foot screenings [15].

Treatment

The mainstay of treatment is a coordinated approach by the patients and their clinicians regarding prompt screening, initial diagnosis of diabetes and subsequent awareness of systemic foot manifestations, and monitoring levels of blood sugars, ensuring that the foot is free of any added physical stress by managing weight and reducing risk factors, such as smoking and alcohol use and appropriate follow up with referral specialists [3]. A combination of clinicians would include the primary care clinician to coordinate care and refer to specialists, dietician to monitor weight and recommend food choices, diabetes educator who might suggest special techniques to care for the foot [3]. Additionally, an endocrine specialist is needed to follow up on glycemic control and management of medications, a podiatrist to ensure that the foot is evaluated thoroughly and recommend and fit podiatric shoes for the patient if necessary, and family support to help ensure that the patient is able to follow through with all his or her medical commitments [3].

Primary Interventions

In case of an open ulcer, there would be certain recommended treatments, which are considered standard protocols to include (a) debridement of the wound to help remove any foreign bodies and ensure that the food is free of infection; (b) changing the pressure points of the foot by utilizing podiatric foot inserts and making special leg casts as necessary; and (c) treatment of any infection by using topical and/or oral antibiotic agents to reduce opportunities for any spread of infection, which could lead to cellulitis and gangrene if unchecked [3]. Wound dressings also play a key role in maximizing the role of antibiotics and reducing chances of infection in patients with diabetic foot ulcers [3]. Common wound dressing techniques include wet-to-dry saline dressings; dressings with infused topical antibiotics covering the wound; and polyurethane dressings, which help ensure that the moisture conditions are optimal for wound healing [3]. Increasingly, there is greater use of growth factors in the treatment of diabetic foot ulcers that help with angiogenesis and increased cellular production, which can lead to more vascularization of the site. Furthermore, the role of vacuum-assisted closure, which can help remove redundant moisture in the wound, exposes wounds to rich oxygenated air therapy, and stem therapy is being studied in the quest to manage and treat diabetic foot complications [3].

Complications

Another common complication of diabetic neuropathy is peripheral artery disease (PAD), which manifests itself in the lower extremities by chronic leg pain, difficulty with healing of foot wounds, change in foot temperature, and lack of foot pulses bilaterally [16]. Commonly used screening tools for PAD include measuring the ankle-brachial index, foot ultrasounds, and contrast angiography [16]. Although these tools continue to be prevalent and utilization of these techniques have increased over the last several years, there continues to be increased rates of diabetic foot amputations due to a lack of timely screening and access to providers [3].

Prevention

The vast number of patients with diabetes are not initially seen by a podiatrist but rather by their primary care providers, including allied health professionals (physician assistants), and preventive strategies, screening, and treatment of foot ulcers has shown to decrease lower foot amputation rates by 49% to 85 % (NIDDKD, 2008). Physician assistants (PAs) can play a crucial role in mitigating the amputations connected with poor foot hygiene in diabetics by ensuring that their diabetic patients are screened in an appropriate fashion during their initial visit with an emphasis on thorough foot screening and follow-up referral to a podiatrist if available in a timely fashion (NIDDKD, 2008).

Patient Education

The screening criteria for DFD must include initial awareness and identification that a patient is vulnerable for foot ulcerations due to the diagnosis of diabetes. The patient must be made aware that routine inspection of the foot on a daily basis (while in the shower for example) is essential to prevent damage to the foot, shedding light on the symptoms to look out for in DFD, such as temperature changes in the foot, tingling, and painful feet [15]. It is important that the patient wears protective shoes, which helps reduce stress on specific parts of the foot and reduces exposure of the foot to outside risk factors, leading to foot trauma and keeping an eye out for any calluses, hammertoes, or hardening of certain areas of the foot [15]. There also needs to be regular follow-up by patients with their clinicians, depending on the nature of their DFD, which might range from a yearly foot examination to seeing a clinician every couple of months if there is already an ulceration present [15].

Patients and their families must be educated about checking that the shoes they wear do not provide excessive stress to the feet, provide adequate cushioning in their daily walking shoes, check daily between their toes for ulcerations, wash and then thoroughly dry their feet daily before bed, and use precaution if utilizing tools to cut toenails [15]. Active self-care and awareness of diabetic manifestation in feet, especially being vigilant in the presence of foot lesions and ulcerations, leads to positive long-term health outcomes for patients with diabetes [14]. The recommendations for foot care, which showed a potential decrease of lower foot amputations by almost 85%, included (a) always walking with comfortable shoes and not barefoot, (b) trimming toenails and not using abrasive items on feet, and (c) routine foot exams by a trained foot clinician [14-22].

Topics Based on the Literature

This author reviewed multiple research studies regarding the field of diabetic foot problems and the associated screening, diagnosis, treatment, and prevention protocols. It was imperative that the information regarding how prevalent diabetes is was included in the literature review of the topic, while also emphasize the frequency in which amputations occur in diabetic patients who neglect foot care [3]. The review of literature, after briefly touching on the definition of diabetes and related causes, focused on diabetic foot disorders. It was emphasized in the practicum review that screening and early diagnosis of diabetes can play a crucial role in reducing the frequency and intensity of foot infections [2].

The overarching theme of the practicum topics incorporated in the review of literature focused on complications of diabetes on a systemic manner, which primarily focused on the foot in this report. The importance of early intervention, including treatment with medication and emphasis of patient education, was dwelt upon as a compelling factor in decreasing the incidence of diabetic foot maladies. The author also emphasized the importance of referring patients to follow-up care with specialists due to the nature of diabetic disease and provided information for the primary clinician to implement treatment protocols during this initial treatment phase [15]. Finally, the review of literature accentuated the fact that early prevention, screening, treatments, and robust patient education would empower patients to take decisive steps in their diabetic foot care leading to positive health outcomes.

Discussion

Diabetic foot disorders can play a prominent role in affecting mobility in patients afflicted with this disease, which can often result in chronic pain and limited healing in the lower extremities [1]. The lack of insulin production by the pancreas in diabetic patients often lead to foot amputations, and this process is the one of the leading causes of death in the United States [9]. A combination of factors including lack of proper screening, timely evaluation, appropriate management and limited patient education work in conjunction to exacerbate this condition leading to poor patient outcomes [5]. Moreover, patients with limited financial and social resources can suffer additional negative consequences of this disease compared to the regular population due to their socio-economic circumstances [3].

Patients with mental health disorders encounter additional challenges due to psychiatric medications increasing blood sugar levels which further exacerbate their diabetic condition while also negotiating lack of proper housing and follow-up medical care [4]. This author focused on the barriers, which economically deprived patients face regarding diabetic care and the opportunities available to overcome them. The limited access to specialist foot providers, such as podiatrists, made it imperative that primary care clinicians, who after are the first to evaluate patients for medical purposes be educated in initial screening and management of diabetic foot maladies [7]. This author developed a PowerPoint presentation which was delivered to a group of primary care clinicians at the Queens County Medical Center, located in Queens, New York, which is at the front line of delivering care to indigent and socially deprived populations. It was the goal of this presentation that these primary care clinicians would be educated to treat patients early enough in the progression of diabetic foot disorders that diabetic related foot amputations will be minimized; a process leading to improved quality of life for these patients [5].

Conclusion

Lower extremity amputations lead to a decreased quality of life issues for patients with associated economic challenges and mobility issues. Timely screening, management, patient education, and appropriate follow-up can lead to mitigating the effects of diabetes not only on foot related problems, but on the overall health of patients. Patient education in conjunction with primary care provider education can play a crucial role in minimizing the devastating effects of this disease and lead to better health outcomes for patients, and reducing the financial expenses in the long term to the United States health care budget.

Appropriate and timely management of diabetes with its associated morbidities can lead to positive health outcomes for patients. The devastating consequences of diabetic related foot amputations not only leads to a poorer quality of life for affected patients but has caused increased economic harm to the community. Provider education regarding early screening and treatment of diabetes, which will lead to appropriate referrals to specialists, can help all the stakeholders affected by this disease on a personal and professional level. Governmental agencies, private institutions, and insurance companies will certainly benefit economically if there are more resources expended in the early phases of screening and patient education of diabetic patients. Finally, patients afflicted with this disorder would be able to be productive members of society without suffering the consequences of long-term foot pain and diabetic amputations.

Recommendations

Exploration of the diabetic foot disorders presents an opportunity for front line primary care clinicians to be leaders in the quest to reduce diabetic foot related morbidities. This innovative process would help enhance both patient and provider satisfaction while also providing economic savings to these institutions, which otherwise would be burdened by diabetic foot-related expenses. Further research could encompass patients not only suffering from psychiatric disorders, but also (a) patients with alcohol and substance abuse disorders, (b) native American and inner city populations without access to timely medical care, and (c) disabled patients who are unable to seek professional help due to mobility issues. Additional funding grants by governmental organizations and private charities to explore opportunities to expand diabetic care would certainly enhance research into this important topic. Finally, recognition about diabetic foot disorders and its horrendous consequences on patients can help pique further interest in researchers to explore alternative opportunities to improve patient care and provide a valuable service to society.

References

  1. Lazzarini P, Gurr J, Rogers J, Schox A, Bergin S. (2012) Diabetes foot disease: The Cinderella of Australian diabetes management? Journal of Foot and Ankle Research 5: 24. [crossref]
  2. Centers for Disease Control and Prevention (2015, December 28) Basics about diabetes: What is diabetes? Retrieved from http://www.cdc.gov/diabetes/basics/diabetes.html.
  3. Amin N, Doupis J (2016) Diabetic foot disease: From the evaluation of the “foot at risk” to the novel diabetic ulcer treatment modalities. World Journal of Diabetes 7: 153-164.
  4. Hoffman K (2016, March 21) Managing lower extremity conditions in patients with mental illness. Podiatry Today 29.
  5. Hsu CR, Chang CC, Chen YT, Lin WN, Chen MY (2015) Organization of wound healing services: The impact on lowering the diabetes foot amputation rate in a ten-year review and the importance of early debridement. Diabetes Research and Clinical Practice 109: 77-84. [crossref]
  6. Guariguata L, Whiting DR, Hambletonc I, Beagleya J, Linnenkampa U, et al. (2014) Global estimates of diabetes prevalence for 2013 and projections for 2035. Diabetes Research and Clinical Practice, 103: 137-149. [crossref]
  7. Bakker K, Apelqvist J, Schaper NC, International Working Group on the Diabetic Foot Editorial Board (2012) Practical guidelines on the management and prevention of the diabetic foot 2011. Diabetes Metabolism Research and Review, 28: 225-231. [crossref]
  8. Prasad S, Sajja R, Naik P, Cucullo C (2014) Diabetes Mellitus and Blood-Brain Barrier Dysfunction: An Overview. Journal of Pharmacovigilance 02: 125. [crossref]
  9. Tesfaye S, Selvarajah D (2012) Advances in the epidemiology, pathogenesis and management of diabetic peripheral neuropathy. Diabetes/Metabolism Research and Reviews 28: 8-14. [crossref]
  10. The Mayo Clinic (2016, September 25) Diabetes-Risk Factors. Retrieved from http://www.mayoclinic.org/diseases-conditions/diabetes/basics/risk-factors/con-20033091
  11. National Institute of Diabetes and Digestive and Kidney Diseases. (2016, June 18) Diabetic neuropathies: The nerve damage of diabetes. Retrieved from http://www.niddk.nih.gov/health-information/health-topics/Diabetes/diabetic-neuropathies-nerve-damage-diabetes/Pages/diabetic-neuropathies-nerve-damage.aspx#what
  12. Chan JC, Malik V, Jia W, Kadowaki T, Yajnik CS, et al. (2009) Diabetes in Asia. The Journal of the American Medical Association 301: 2129.
  13. Bennett WL, Maruthur NM, Singh S, Segal JB, Wilson LM, et al. (2011) Comparative Effectiveness and Safety of Medications for Type 2 Diabetes: An Update Including New Drugs and 2-Drug Combinations. Annals of Internal Medicine 154: 602. [crossref]
  14. Bonner T, Foster M, Spears-Lanoix E (2016) Type 2 diabetes–related foot care knowledge and foot self-care practice interventions in the United States: A systematic review of the literature. Diabetic Foot & Ankle 7: [crossref]
  15. Lechleitner M, Abrahamian H, Francesconi C, Sturm W, Kohler G (2016) Diabetischer FuB. Wiener Klinische Wochenschrift 128: 80-84.
  16. Beaney A, Nunney I, Gooday C, Dhatariya K (2016) Factors determining the risk of diabetes foot amputations–A retrospective analysis of a tertiary diabetes foot care service. Diabetes Research and Clinical Practice 114: 69-74. [crossref]
  17. Bartsch RA, Cobern KM (2003) Effectiveness of PowerPoint presentations in lectures. Computers & Education 41: 77-86.
  18. Boghossian P (2006) Behaviorism, constructivism, and Socratic pedagogy. Educational Philosophy and Theory 38: 713-722.
  19. Castillo M (2010) Making a Point: Getting the Most Out of PowerPoint. American Journal of Neuroradiology 32: 217-219.
  20. (n.d.) In Merriam-Webster’s online dictionary (11th ed.) Retrieved from http://www.merriam-webster.com/medical/diabetes
  21. National Institute of Diabetes and Digestive and Kidney Diseases. (2016, June 18) Diabetic neuropathies: The nerve damage of diabetes. Retrieved from http://www.niddk.nih.gov/health-information/health-topics/Diabetes/diabetic-neuropathies-nerve-damage-diabetes/Pages/diabetic-neuropathies-nerve-damage.aspx#what
  22. Neuropathy (n.d.) In Merriam-Webster’s online dictionary (11th ed.) Retrieved from http://www.merriam-webster.com/medical/neuropathy

Intellectual Capital in the Post COVID-19

DOI: 10.31038/ASMHS.2021512

Abstract

Social Work studies about entrepreneurship warn a process of deliberate, planned and systematic rational choice which promote intellectual capital formation are predominant determinants. Specify a model for the study of trust dimensions: experiences, knowledge, capabilities, emotions, and abilities. Not experimental, documentary and retrospective study with a nonrandom selection of sources indexed repositories, considering the keywords and the publication period 2015-2020. A model with eight hypotheses three paths dependency relationships between nine variables put forward in the state of knowledge was specified.

Keywords

Heads of family, Social work, Entrepreneurship, Specific-19ation, Model

Introduction

The aim of this study is to specify a model for the study of social entrepreneurship in household heads [1]. From a review of the literature, the variables that allowed the systematization of the determinants of entrepreneurship paths are extracted [2].

The study is part of the Division of Humanities and Social Sciences, Social Work discipline, area of health promotion and sub-area of promotion of reproductive rights, parental rearing styles and management of household heads [3].

However, the project also has interference in economic and administrative sciences, as it will recover in the second phase the effect of cooperative entrepreneurship in Human Development with an emphasis on reproductive health, family upbringing and training of entrepreneurs [4].

Theory of Intellectual Capital

The principles that guide the rational choice lie in the tastes and preferences crystallizing objectives of the actors [5]. Therefore, before taking any decision binding preferences strategies, achieve collect information that will determine the election [6]. If individuals rather have an indeterminate number of tastes, objectives and goals, then your preference swill no longer depend on their capacity of choice and action [7]. Therefore, they act in a non-rational way [8].

The rational choice theory also warns that a decision is a result of an estimate of the costs and benefits of carrying out an effort regardless of their degree of significance [9]. This is a utilitarian dimension in which control of a situation from establishing a favorable balance of benefits versus costs will determine the election [10].

More specifically, the benefits and costs translate into a ratio of risk, effort and reward [11]. This means that a choice be rational when the risks and efforts are minimal provided that the rewards are greater [12].

In contrast, when the recognition of an effort and risk not up to expectations, then the choice has not been entirely rational and rather approaches an irrational dimension if the risks and efforts are increasing and intense with respect to the absence of rewards [13].

This is because the individual who tries is committed to the risks that will be activated by profit expectations [14].

Integrating each of the variables represents a series of paths in which the correlations explain each choice [15]. In short, the rational choice explained in general terms the process by which preferences are the determining factor by other factors which generate information or sense an atmosphere of certainty when deciding and act accordingly [16]. To the extent such information is available, accessible and actionable, then the rational choice will emerge as an option, but rather proliferates ambiguity, then a non – rational decision will be generated with irrational consequences [17].

However, when information is not available or is very abstract, rational choice is replaced by a tighter option to culture; values and norms of people with respect to a contingency which no known precedent some, but people always react the same way [18].

Studies of Intellectual Capital

If rational choice is brewing from preferences based on information available to determine tastes and objectives, the prospective attitude suggests that the absence of information creates uncertainty that determine risk aversion or waiver of certain gains and risk appetite when losses are imminent [19]. Thus, the utility, benefit or happiness crystallize into losses or gains, circumventing the process of rational choice and legitimizing an irrational choice [20].

Therefore, a prospective is more than a decision lies in attitude and expectation of risk or certainty to gains and losses in the immediate future. In that sense, a retrospective is an attitude that is the same relations but compared to last [21].

In short, the prospective attitude is a hinge between rational choice and reasoned action. Each of these theoretical and conceptual frameworks based its scope and limits from the availability of information, if the individual is able to assume an attitude, make a decision or take an action that corresponds to the available information and representation that you have it [22].

Specification a Model for Study of Intellectual Capital

Unlike the rational choice theory that focuses on the usefulness of the information available and the theory of prospective attitude that focuses its interest in the certainty of the information, the theory of reasoned action assumes that information, any it is, it is a general environment that will influence the behavior to the extent that information is transformed into rules. This is because the theory of reasoned action considers that all information is cognitively process [23].

Therefore, an overview of the environment, their demands and opportunities conducive categories of accessible and abundant availability of information that will influence a spendthrift behavior such as believing that jobs, wages and financial credits significantly increase [24]. On the contrary, if one considers that the context is rather recession and economic crisis, then austere styles, cooperative and innovative life will be adopted [25].

However, the theory of reasoned action, like the rational choice theory and the theory of prospective attitude, pose a general scenario incident on a specific behavior without considering the current situation and specifies decision maker [26].

Method

Documentary work was carried out with a selection of sources indexed to international repositories such as Scopus and WoS, considering the keywords of “specification” and “intellectual capital” in the period from 2015 to 2020

A search for summaries was carried out in order to subtract the indicators of intellectual capital, considering equation (1). Then, once the indicators of empathy, trust, commitment, entrepreneurship, productivity, competitiveness, innovation, satisfaction and happiness were selected, experts on the subject rated these indicators in order of importance, being 10 of greater importance and 0 of zero or no some importance Data were processed in the statistical analysis package for social sciences version 20.0:

formula 1

Percentages, contingencies and proportions were estimated to establish risk thresholds in decision-making regarding intellectual capital indicators.

Results

The trust indicator obtained the highest percentage (25%) followed by commitment (22%), empathy (17%), entrepreneurship (13%), satisfaction (9%), innovation (6%), productivity (4%), competitiveness (3%), happiness (1%). This means that decision-making is a function of the level of trust, although the instrument does not specify the type of trust that can be organizational, interpersonal, intra-personal or technological.

The contingency parameters suggest significant differences between the decisions made based on intrapersonal trust with respect to interpersonal [ϰ2 = 16,27 (16 df) p < ,05]. In other words, as an educational process, intellectual capital is focused on internal capacities, experiences, skills, knowledge and emotions rather than their outsourcing when socializing knowledge.

The proportions of probability suggest that the formative process of intellectual capital, centered on the intra-personal confidence of abilities [OR = 17,21(13,24 to 19,20)], skills [OR = 18,21 (14,35 to 20,21)], knowledge [OR = 15,43 (13,24 to 21,23)], experiences [OR = 18,20 (14,32 to 23,45)] and emotions [15,46 (10,21 to 22,31)], is at an allowable threshold of risk. It means then that the intervention of social work can be cemented in the formation of intellectual capital and its indicators of intra-personal confidence.

Discussion

The contribution of the present work to the state of the matter lies in the specification of a model for the study of intellectual capital, considering the dimensions of intra-personal confidence in which skills, emotions, experiences, abilities and knowledge, in the qualification of experts, were located in tolerable risk thresholds.

In relation to the literature where the intellectual captain is approached from non-formative organizational dimensions such as cooperation, tasks, goals, objectives or innovations, this paper suggests complementing these dimensions with intra-personal ones to establish differences between professional training and job training.

Future lines of research concerning the structural models of intellectual capital, human capital and social capital will allow establishing a predictive explanation of academic, professional and labor training.

Conclusion

Given that the information is not available or is processable actors requiring immediate planning of their actions, the determinants of the planned behavior are those in which information can be delimited and specified depending on a particular situation or to an event which is the subjective control from decision-making and the information available and actionable [18].

The theory of planned behavior finds that perceived control is a significant determinant of behavior in direct and indirect mode. To interact with subjective norms and attitudes generate an intention that is also assumed as a determinant of behavior [19].

However, it perceived control, as the norm and attitude, depend on a set of beliefs about information availability. In this sense, the specification of a model would include variables that anticipate the behavior, but not from the beliefs of availability of information, but from provisions to cooperate by actors that form an entrepreneurial project to develop their skills, not only of choice, deliberation or planning, but innovation [20].

References

  1. Andersen HC (1945) Kejsarens nya kläder, (The emperors new clothes, authors transl.) in H.C. Andersen och hans sagor, Bokförlaget Norden, Malmö. Band 172-178: 1.
  2. Bonoma TV, Clark BC (1988) Marketing Performance Assessment, Boston: Harvard.
  3. Bontis Nick (1998) Intellectual capital: an exploratory study that develops measures and models. Management Decision 36/2: 63-76.
  4. Booth, Rupert (1998) The measurement of intellectual capital. Management Accounting 26-28.
  5. Boudreau, John (1998) Strategic Human Resource Management Measures: Key Linkages to the People Vantage Model. Journal of Human Resource Costing & And Accounting 3: 21-40.
  6. Davenport TH, Prusak L (1998) Working Knowledge: How Organizations Manage What They.
  7. Dinesh, David, Palmer, Elaine (1998) Management by objectives and the Balanced Scorecard: Will Rome fall again? Management Decision 36/6: 363-369.
  8. Eccles Robert (1991) The performance measurement manifesto. Harvard Business Review 131-138.
  9. Edvinsson Leif, Malone, Michael S (1997) Intellectual capital – Realizing your company’s true value by finding its hidden roots. Harper Business, New York.
  10. Edvinsson Leif, Malone, Michael S (1998) Intellectual capital – The proven way to establish your company’s real value by measuring its hidden brainpower. Piatkus Publ. New York.
  11. Frankfort-Nachmias, Chava; Nachmias, David (1992) Research methods in the social sciences. St Martin’s Press. Kent.
  12. Gröjer, Jan-Erik; Johansson, Ulf (1996) Human resource costing and accounting. Joint Industrial Safety Council, Stockholm.
  13. Hemmer, Thomas (1996) On the design and choice of ‘modern’ management accounting measures. Journal of Management Accounting Research 8: 87-116.
  14. Hollis, Martin (1994) The philosophy of social science. Cambridge University Press.
  15. Johansson U, Mabon, H (1998) The personnel Economics Institute After Ten Years: What Has Been Achieved and Where Are We Going? Journal of Human Resource Costing & And Accounting 3: 65-76.
  16. Johnson H, Thomas Kaplan, Robert (1987) Relevance lost the rice and fall of management accounting, Harvard Business School Press, cop. Boston.
  17. Kaplan, Robert Norton, David (1992) The Balanced Scorecard – Measures that drive performance. Harvard Business Review 1: 71-79.
  18. Kaplan, Robert Norton, David (1996a) Using the balanced scorecard as a strategic management system. Harvard Business Review 75-86.
  19. Kaplan, Robert Norton, David (1996b) The balanced scorecard. Harvard Business School Press, Boston.
  20. Leininger, Madeleine (1994) Evaluation Criteria and Critique of Qualitative Research Studies, Critical Issues in Qualitative Research Methods edited by Morse, Janice, Thousands Oak, Calif. Sage.
  21. Liberatore Matthew, Monaham, Thomas Tymon, Walter (1997) Linking a balanced scorecard to company strategy. Corporate Controler, Winter 24-29.
  22. Mason, Jennifer (1996) Qualitative research. SAGE Publ. London.
  23. Meindl James, Stubbart, Charles Porac, Joseph (ed) (1996) Cognition within and between organizations. SAGE Publ. London.
  24. Miles Grant, Miles Raymond, Perrone Vincenzo, Edvinsson Leif (1998) Some conceptual and research barriers to the utilization of knowledge. California Management Review 40: 281-287.
  25. Olve, Nils-Göran, Roy, Jan Wetter, Magnus (1997) Balanced Scorecard isvensk praktik. Liber Ekonomi, Malmö.
  26. Roos Johan, Roos Göran, Edvinsson Leif, Dragonetti Nicola C (1997) Intellectual capital- Navigating in the new business landscape. MacMillan Press. London?


fig 1

A Therapeutic Equivalence of Two Formulations of the Fixed Combination of Benzydamine Hydrochloride and Cetylpyridinium Chloride in the Treatment of Sore Throat Associated with Upper Respiratory Tract Infection

DOI: 10.31038/JCRM.2021422

Abstract

Background: The combination of Cetylpyridinium chloride and Benzydamine hydrochloride (CPC/BH) has antiseptic, antimicrobial, anti-inflammatory and analgesic properties. We have investigated whether the fixed combination in the form of lozenges is therapeutically equivalent to the orosoluble tablet formulation in a randomized, parallel, partially double-blind, three-arm, placebo controlled clinical trial in patients with sore throat due to upper respiratory tract infection.

Methods: Clinical assessment was made within 3 hours after the initial single dose drug administration. Thereafter, subjects underwent the therapy according to the prescribed schedule for additional 4-7 days, primarily to assess the safety profile of CPC/BH. Multiple measurements using Visual Analogue Scale (VAS) were performed to assess sore throat pain intensity, while categorical Sore Throat Pain Relief Scale (STPRS) was used to assess sore throat pain relief within three hours after the initial dose administration. Tonsillopharyngitis Assessment Score was used to assess the resolution of upper respiratory tract infection after 4 and 7 days of therapy.

Results: Altogether 291 patients aged 39,6 ± 11,5 years with sore throat were randomly assigned to receive CPC/BH lozenges (118 patients), CPC/BH orosoluble tablets (116 patients) or placebo (57 patients). Both formulations were significantly more effective than placebo in reducing sore throat pain intensity at 1, 2 and 3 hours after the initial dose administration. The two formulations were found to be equivalent in terms of therapeutic efficacy at all three measurement points. Similarly, Total Pain Relief over the time interval of 15 minutes to 3 hours after the initial dose was greater in both formulations in comparison with placebo and no significant difference between the two formulations. Altogether 28,1% of patients in placebo group, 59,3% in CPC/BH lozenges group and 47,4% in CPC/BH orosoluble tablets group were considered therapy responders. Again, both treatments were significantly better than placebo with no significant difference between the two formulations. The mean time to onset of sore throat pain relief was significantly shorter in both formulations with comparison to placebo. At day 5 of treatment, the disease was completely resolved in 31,6% of subjects in the placebo group and in 53, 4% patients treated with both CPC/BH formulations (p=0,007). At day 8, the disease was resolved in 66,7%, 89,0% and 81,0% of patients in placebo, CPC/BH lozenges and CPC/BH orosoluble tablets groups, respectively. There was similar statistical significance between the groups as at day 5. Altogether, 10 therapy-related adverse events have been reported. There were all of mild intensity, none of them was serious and they were relatively evenly distributed between the treatment groups.

Conclusions: The therapeutic equivalence between the lozenges and orosoluble tablets formulation of CPC/BH was demonstrated in terms of sore throat pain intensity reduction, sore throat pain relief, percent of responders and time to the pain relief onset after the initial dose and in terms of the disease resolution after 4 and 7 days of treatment. Both formulations were superior to placebo. Both CPC/BH formulations have similar safety profile to placebo.

Introduction

Upper respiratory tract infections are one of the most common acute infectious diseases including acute pharyngitis. The latter is one of the commonest complaints at the general practitioner level of medical care, even so, most of the people with pharyngitis do not seek medical help [1,2]. Predominantly, pharyngitis or tonsillopharyngitis is caused by viral infection. In less than 20% of cases bacteria are involved [3]. Hence, the use of antibiotics for the treatment of acute pharyngitis is questionable and in many cases inappropriate [4,5].

Cetylpyridinium chloride (CPC) belongs to a family of quaternary ammonium bases. It exerts its antimicrobial effect through non-specific interaction at the bacterial cytoplasmic membrane [6]. CPC is a broad-spectrum antiseptic that has both a bactericidal and virucidal effects. In addition to its antiseptic effect, it also has emulsifying and detergent properties and helps to lubricate and soothe the painful area. It penetrates the least accessible places on the mucous membrane. This is an important factor in the treatment of mouth and throat infections [7]. Benzydamine hydrochloride (BH), a non-steroid anti-inflammatory drug (NSAID) has analgesic, anaesthetic, anti-inflammatory and antimicrobial properties. It is a weak inhibitor of the synthesis of prostaglandins but it has several properties, which may contribute to its anti-inflammatory activity [8]. Clinical studies with benzydamine used for management of inflammatory oropharyngeal conditions have demonstrated results, mainly exerted as a more rapid resolution of pain and dysphagia and reduction of inflammation [9,10].

Krka, d. d., Novo mesto has developed the fixed dose combination of 3 mg CPC and 1 mg BH in the form of lozenges. The therapeutic regimen is one lozenge four times daily, i.e. each 3 hours. The principal aim of our study was to investigate whether the CPC/BH lozenges are therapeutically equivalent to the reference marketed fixed combination dose of 3 mg CPC and 1 mg BH in the form of orosoluble tablets, which has the identical dose regimen, in patients with sore throat due to upper respiratory tract infection. The second aim was to demonstrate the superior effect of both CPC/BH formulations over placebo.

Patients and Methods

This was a randomized, parallel, partially double blind, three arm, placebo-controlled, equivalence, multicenter, international trial conducted at 11 clinical sites in Russian Federation and Slovenia. Due to issues with the dissolution time, the blind was only assured for the lozenges (i.e. placebo was in the form of lozenges). Even so, orosoluble tablets were not on the market in participating countries at the time of the study conduct so the patients could not have recognized the reference product.

In order to be enrolled, male or female patients, aged 18 to 65 years, should have had the onset of moderate to severe sore throat six days or less before the screening/enrolment visit. They had signs and symptoms of acute tonsillopharyngitis. They have signed written informed consent to participate in the trial. Among the non-inclusion criteria were streptococcal tonsillitis assessed with rapid antigen detection test in patients with severe pathology of changes in pharyngeal region, increased body temperature that needed antipyretic treatment (more than 38, 5 degrees Celsius), oropharyngeal lesions such as tumours, purulent necrotic process or aphtous ulcers, any evidence of mouth breathing or coughing which could compromise respiratory function and worsen sore throat and concomitant therapy that could bias the assessment of therapeutic efficacy and safety.

Patients have undergone two or three visits at the outpatient clinics. At the first visit, the initial single dose of study therapy has been administered and measurements of pain intensity and pain relief performed over three hours. Thereafter, patients continued with the usual therapeutic regimen for 4 or 7 days. There were two additional visits on day 5 and 8 of the study to assess safety and efficacy of the treatments. Patient whose condition has resolved after 4 days of therapy, concluded the therapy on day 5, while those with persisting signs and symptoms of the disease have been treated for another three days.

The key parameter of the assessment of efficacy endpoints was Sore Throat Pain Intensity (STPI). It was assessed by Visual Analog Scale (VAS) that ranges from zero (not sore) to 100 (very sore) in millimetres [11]. The measurement points (in minutes) at the initial visit were zero (baseline at the time of the therapy intake), 15, 30, 45, 60, 75, 90, 105, 120, 135, 150, 165, and 180.

Primary efficacy endpoint was a difference between the STPI at one hour after the administration of the initial dose and baseline STPI value while secondary endpoints included the difference in STPI between STPI at two hours and three hours, and baseline STPI value. Another secondary endpoint was percent of responders defined by the threshold STPI reduction at first, second and third hour after the therapy administration.

At each of the two following visits, a single STPI measurement has been made to yield the combined tertiary efficacy endpoint of percent of patients with the disease resolution.

Another parameter of efficacy assessment was sore throat pain relief (STPAR) measured at the initial visit by the categorical Sore Throat Pain Relief Scale (STPARS) containing seven categories of pain relief description [12]. The measurement points with STPARS were identical to VAS except the baseline measurement where no relief could has been assessed hence no assessment with STPARS was made. A secondary efficacy endpoint Total pain relief (TOTPAR) was defined as the area under the curve (AUC) in the time interval from 15 minutes to 180 minutes after the initial dose administration. At each of the two following visits, a single STPRS measurement has been made to yield the combined tertiary efficacy endpoint of percent of patients with the disease resolution.

Tonsillopharyngitis assessment score (TPAS) [11,13] has been assessed to evaluate objective signs of the condition, which served as the assessment for the inclusion criterion and for two tertiary efficacy endpoints. It consists of five features assessed by the investigator: body temperature, oropharyngeal colour, oropharyngeal enanthemas, cervical adenopathy and cervical adenitis. To assess the safety profile, an interview and physical inspection were used.

Statistically, this study has been based on equivalence design. The null hypothesis for the primary efficacy endpoint is non-equivalence between the two CPC/BH formulations, and the alternative hypothesis is equivalence defined by pre-defined equivalence margin (δ) of 13 millimetres of VAS score [14]. Assessment of the hypotheses was based on a two-sided 95% confidence interval for the treatment difference. It was to be concluded that the two formulations are equivalent if the lower and upper bounds of the 95% confidence interval for the treatment difference lie entirely within (–δ, δ) interval. In order to assure the assay sensitivity as an inherent part of the equivalence design, a superiority alternative hypothesis of both formulations against placebo was tested. In order to achieve the study power of 80% and type I error (α < 0.025), minimally 273 subjects should have finished the primary point assessment. Due to expected minimal effect of placebo, a balanced treatment allocation of 1:2:2 was used for placebo, and each of the formulations, respectively.

Results

Altogether 291 patients were enrolled and underwent the single dose efficacy assessment. The baseline characteristics are displayed in the Table 1.

Table 1: Baseline characteristics.

Placebo

N=57

CPC/BH

Orosoluble tablets

N=116

CPC/BH

Lozenges

N=118

Total

N=291

Age (years)

Mean (SD)

Min/max


39,9(10,80)

24/62


40,5(12,23)

19/65


38,5(11,07)

19/64


39,55 (11,49)

19/65

Gender (%)

Male

Female


35

65


36

64


26

74

32

68

Body temperature (oC)

mean (SD)

min/ max


37,49 (0,3)

36,7/38,3


37,49 (0,4)

36,6/38,4


37,49 (0,4)

36,4/38,4

37,49 (0,4)

36,4/38,4

TPA score-baseline

mean (SD)

median

min/ max


5,1 (0,9)

5,0

4/8


5,1(1,1)

5,0

4/9


5,2(0,9)

5,0

4/7

STPI (mm)

mean (SD)

min/ max


80,0(10,28)

64/100


78,2 (10,02)

52/100


77,6 (9,89)

60/100

78,3(10,02)

52/100

Out of 291 patients, 143 successfully completed the treatment at Visit 2 with no major protocol violation, while 143 concluded the treatment at visit 3. There were 5 drop-outs.

The mean difference between the two formulations in STPI at 1 hour (primary efficacy endpoint) has been 3,38 mm in favour of CPC/BH lozenges. The corresponding 95% CI were – 1,73 and 8,49 mm and were therefore entirely within the equivalence margin. The mean difference between CPC/BH orosoluble tablets and placebo has been 19,74 mm. The difference was statistically significant (p<0,001). Likewise, the mean difference between CPC/BH lozenges and placebo was statistically significant. It has been 23,11 mm (p<0,001). The two secondary efficacy endpoints-STPI difference at 2 hours and STPI difference at 3 hours have shown similar results and therefore corroborated the outcome with the primary efficacy endpoint. The primary and secondary efficacy endpoints denoting STPI difference at hours 1, 2 and 3 are shown in the Figure 1.

fig 1

Figure 1: STPI difference at hour 1, 2 and 3.

The STPAR score values over the time interval of 15-180 minutes, which represent the basis for the TOTPAR calculation, are shown in the Figure 2. The TOTPAR over the corresponding time interval has been significantly higher in the therapeutic groups who were administered the two CPC/BH formulations in comparison with placebo group. There were no significant differences between the two formulations.

fig 2

Figure 2: TSPAR score over the time interval of 15-180 minutes.

Altogether, 59.2 percent of patients who have taken CPC/BH lozenges and 47.7 percent of those who were treated with CPC/BH orosoluble tablets have responded adequately to the therapy. There were no significant difference between the two therapeutic groups, whereas both formulations were significantly better that placebo (Figure 3).

fig 3

Figure 3: Percent of responders after the initial dose therapy administration.

After 4 days of treatment, sore throat and signs of tonsillopharyngitis have resolved in 31,6% of patients in placebo group, and in both CPC/BH formulation groups in 53,4% of subjects. The difference between placebo and active treatments was significant (p= 0.007). After 7 days of treatment, the disease was resolved in 66,7%, 89,0% and 81,0% of patients in placebo, CPC/BH lozenges and CPC/BH orosoluble tablets groups, respectively. There was similar statistical significance between the groups as after 4 days of therapy.

There were altogether 10 drug-related adverse events reported. The overall incidence per treatment group was 3,51%, 4,31% and 2,54% for placebo, CPC/BH orosoluble tablets and CPC/BH lozenges, respectively. Due to a low number of drug-related adverse events, a comparative analysis was not performed.

The summary of drug-related adverse events is displayed in the Table 2. There were no patients who would be unable to finish the assessment due to clinically significant adverse events. There were no deaths or any other serious adverse events in this study.

Table 2: Drug related adverse events.

Treatment


Total

N=291

Placebo

N=57

Orosoluble

tablets

N=116

Lozenges

N=118


Gastrointestinal disorders

Diarrhoea

0

1(0,9%) 0

1(0,3%)

Dry mouth

0

0 2(1,7%)

2(0,7%)

Heartburn

0 0 1(0,9%)

1(0,3%)

Meteorism

1(1,8%)

0 0

1(0,3%)

Nausea

0

1(0,9%) 0

1(0,3%)

Numbness of tongue

0

1(0,9%) 0

1(0,3%)

Parageusia

0

1(0,9%) 0

1(0,3%)

Stomach pain

0

1(0,9%) 0

1(0,3%)

Total

1(1,8%)

5(4,3%) 3(2,5%)

9(3,1%)

Skin and subcutaneous tissue disorders Erythema facial

1(1,8%)

0 0

1(0,3%)

Total

1(1,8%)

0 0

1(0,3%)

Discussion and Conclusions

In this clinical trial, two formulations containing fixed combination of CPC 1 mg and BH 3 mg have been tested to establish the therapeutic equivalence of the two formulations with respect to efficacy and safety profile. The Orosoluble tablets have already been on the EU market at the time of the trial conduct contrary to lozenges pharmaceutical form of lozenges that was developed by Krka, d. d. Clinical data on the fixed combination have been rather scarce [15] including lack of placebo controlled studies. In order to assure essay sensitivity to established efficacy of the marketed pharmaceutical form, we had to include placebo arm to demonstrate the superiority of the reference drug [16].

As for the study methodology, all the key parameters of efficacy assessment including Sore throat pain intensity and Sore throat pain relief scales and Tonsillopharyngitis assessment score are well-established methods to assess efficacy in the setting of the claimed indication. They are corroborated with the research which has established their value as an assessment [11,17,18] as well as with studies of different medicinal products with similar indication profile [12,19].

The principal and decisive endpoint in the efficacy equivalence assessment in this trial was a single one. It represents the difference in pain intensity at the pre-determined time point as recommended by the EU Note on guidance on clinical trials of nociceptive pain.

The results of the comparison analysis, which included alternative hypothesis of equivalence, has demonstrated unequivocally that the two formulations are equivalent. The assay sensitivity has been assured by a clear-cut superiority of both active treatments over placebo in the primary efficacy endpoint analysis. The superiority of both CPC/BH formulations over the placebo in the pain intensity reduction persisted also after 2 and 3 hours as assessed by secondary efficacy endpoints. The secondary endpoint TOTPAR is an indicator of the pain control throughout the entire dosing interval. It is one of the main endpoints of sore throat pain model for the assessment of sore throat pain, which is commonly used in the comparative therapeutic intervention trials [17,20]. The percent of patients that respond adequately to the therapy is a very relevant endpoint in the trials that investigate the comparative effect between the two drugs and is proposed by the EU note on guidance as a primary efficacy endpoint of choice. The definition of the responder status is different throughout the studies. However, in most cases, the change in pain score that defines a clinically important difference for the individual patient is the most appropriate cut-off value [20,21]. Hence, we defined the equivalence margin (13 mm) of sore throat pain intensity difference at 1 hour, 2 hours and 3 hours after the initial dose as a cut-off point between the responder and non-responder status. In this respect, the responders maintain sustainable pain relief over the key points of the dosing interval.

As for the safety part, the number of drug-related adverse events was too low to justify a reasonable comparable analysis of the events. Low incidence was expected since both compounds are relatively safe, do not have a systemic effect in the recommended doses and have many years of safe use in their life cycle history. Furthermore, the incidence of individual drug-related adverse events was in majority of cases under 1% of the study population. Mostly, there were solitary cases of mild intensity. All of them abated by the end of the treatment. Lack of any severe or serious adverse events further corroborates the safety of both formulations and advocate their broad use in the supportive upper respiratory tract infections treatment setting.

In conclusion, this clinical trial has demonstrated that CPC/BH lozenges are therapeutically equivalent to CPC/BH orosoluble tablets in terms of sore throat treatment. The superior effect of both drugs persisted and was significantly better than placebo over the entire recommended dosing interval. These results were corroborated with the assessment of the percent of subjects who adequately responded to the therapy as well as with disease resolution after 4 and 7 days of treatment. Both drugs turned out to be relatively safe with the low incidence of adverse reactions and lack of severe or serious events.

References

  1. Bisino AL (2011) Acute pharyngitis. N Engl J Med 344: 205-211 [crossref]
  2. Hannaford PC, Simpson JA, Bisset AF, et al. (2005) The prevalence of ear, nose and throat problems in the community: results from a national cross-sectional postal survey in Scotland. Fam Pract 22: 227-233 [crossref]
  3. Addey D, Shephard A (2012) Incidence, causes, severity and treatment of throat discomfort: a four-region online questionnaire survey. BMC Ear Nose Throat Disord 12: 9 [crossref]
  4. Little PS, Wiliamson I, Warner G, et al. (1997) Open randomised trial of prescribing strategies in managing sore throat. BMJ 314: 722-727 [crossref]
  5. Butler CC, Rollnick S, Kinnersley P, et al. (1998) Reducing antibiotics for respiratory tract symptoms in primary care: consolidating ≫why≪ and considering ≫how≪. Br J Gen Pract 48: 1865-1870 [crossref]
  6. Merianos JJ (1991) Quaternary ammonium antimicrobial compounds. In: Block SS, ed. Disinfection, sterilisation and preservation. 4th ed. Philadelphia, London: Lea & Febiger 225-255
  7. Pitten FA, Kramer A (2001) Efficacy of cetylpyridinium chloride used as oropharyngeal antiseptic. Arzneimittelforschung 51: 588-595 [crossref]
  8. Quane PA, Graham GG, Ziegler JB (1998) Pharmacology of benzydamine. Inflammopharmacology. 6: 95-107 [crossref]
  9. Sardella A, Uglietti D, DemarosI F et al. (1999) Benzydamine hydrochloride oral rinses in management of burning mouth syndrome: A clinical trial. Oral Surg Oral Med Oral Pathol Oral Radiol Endod 88: 683-686 [crossref]
  10. Wethington JF (1985) Double-blind study of benzydamine hydrochloride, a new treatment for sore throat. ClinTher 7: 641-646 [crossref]
  11. Schachtel BP et al. (1984) Rating scales for analgesics in sore throat. Clin Pharmacol Ther 36: 151-156 [crossref]
  12. Schachtel BP et al. (2002) Demonstration of dose response of flurbiprofen lozenges with the sore throat pain model. Clin Pharmacol Ther 71:375-80 [crossref]
  13. Schachtel BP, Fillingim JM, Beiter DJ, Lane AC, Schwartz LA (1984) Subjective and objective features of sore throat. Arch Intern Med 144: 497-500 [crossref]
  14. Todd KH. Et al. (1996) Clinical significance of reported changes in pain severity. Ann Emerg Med 27: 485-489 [crossref]
  15. Herrera D, Santos S, Ferrús J et al. Efficacy of a 0.15% benzydamine hydrochloride and 0.05% cetylpyridinium chloride mouth rinse on 4‐day de novo plaque formation. J Clin Peridonto 32; 595-603 [crossref]
  16. CPMP/ICH/363/96. Note on guidance on statistical principles for clinical trials.. Available at: https://www.ema.europa .eu/en/documents/scientific-guideline/ich-e-9-statistical-principles-clinical-trials-step-5_en.pdf, (accessed March 8, 2021).
  17. Schachtel BP et al. (1988) Sore throat pain in the evaluation of mild analgesics. Clin Pharmacol Ther 44: 704-711 [crossref]
  18. Stahmer SA, Shofer FS, Marino A, Shepherd S, Abbuhl S (1998) Do quantitative changes in pain intensity correlate with pain relief and satisfaction. Acad Emerg Med. 5: 851-857
  19. Schachtel BP, Fillingim JM, Lane AC, Thoden WR, Baybutt RI (1991) Caffeine as an analgesic adjuvant. A double-blind study comparing aspirin with caffeine to aspirin and placebo in patients with sore throat. Arch Intern Med 151: 733-737 [crossref]
  20. Schachtel BP et al. (2007) Utility and Sensitivity of the Sore Throat Pain Model: Results of a Randomized Controlled Trial on the COX-2 Selective Inhibitor Valdecoxib. Journal of Clinical Pharmacology 47: 860-870 [crossref]
  21. Farrar JT, Berlin JA, Strom BL (2003) Clinically important changes in pain outcome measures: a validation study. J Pain Symptom Manag 25: 406-411 [crossref]

Health Care Provider’s Knowledge on Snakes and Snakebites – A Study in the Three Tongu Districts of the Volta Region, Ghana

Abstract

Objectives: According to the World Health Organization, out of the 5 million snakebites that occur annually, 2.7 million results in envenomation out of which between 81,000 and 139,000 leads to death. Since snakebite is more prevalent in developing countries, it is imperative that their healthcare professionals should be knowledgeable on snakes and snakebites to enable them provide the optimal management of snakebite. This study therefore assessed health professionals’ preparedness by way estimating their knowledge on snakes and snakebites three Tongu districts in Ghana.

Method: Using a de novo semi-structured questionnaire, data was collected from 186 health workers using a google form whose link was sent via WhatsApp platforms on their Android phones. Data was analyzed using Statistical Package for the Social Sciences (SPSS) Version 23. Results were presented in the form of tables and association between variables determined using the appropriate tools at a confidence interval of 95%.

Results: The study showed the respondents’ overall mean knowledge score on snakes was lower than their knowledge on snakebites [(8.31 ± 2.95/18 (46.2%)] vs. [13.78 ± 4.0/22 (62.6%)]. Respondents’ sex and a previous training on snakebite were significantly associated with their knowledge on snakes. Their knowledge on snakebites, was significant associated with type of health facility, professional grouping and training experience (p<0.05).

Conclusions: The knowledge of health workers in the Tongu districts in Ghana on snakes and snakebite was inadequate. Since previous in-service training was associated with respondents’ knowledge on snakes and snakebite, educational intervention is imperative, especially the nursing professionals who are frontline health workers.

Keywords

Knowledge, Healthcare providers, Snakes, Snakebites, Tongu districts

Introduction

According to the World Health Organization, (2010) when venomous snakes bite, it may not introduce venom into the tissue referred to as dry bite or non-venomous bite [1]. Dry bites may or may not be associated with local inflammation but do not present with systemic manifestations. Following a dry bite, the victim may present with presence of fang marks, local swelling, pain, redness and bleeding from the bite sites as well as reduced function of the affected body part resulting in anxiety [1]. The systemic effects produced after injection of large amount of venoms into the victim may cause haemotoxicity, neurotoxicity, nephrotoxicity, and cardiotoxicity.

In West Africa, most of the snakebites occur in the savanna regions with the saw-scaled or carpet viper (Echis ocellatus) being the snake most implicated in causing morbidity and mortality [2]. Other venomous snakes in the West African region include the spitting cobras (Naja nigricollis and N. katiensis), the puff adders (Bitis arietans) and (Dendroaspis spp) the manbas [1].

Although, the exact number of snakebites globally is not known, the WHO (2019a) estimated that about 5.4 million snake bites occur each year, resulting in 1.8 to 2.7 million cases of envenoming [3]. There are between 81 410 and 137 880 deaths and around three times as many amputations and other permanent disabilities each year. Most snake envenoming and fatalities occur in South Asia, Southeast Asia, and sub-Sahara Africa, with India reporting the most snakebite deaths of any country [4]. In sub-Saharan Africa, about a million people are estimated to be bitten by snake each year, with estimated 7000-20 000 deaths occurring with West Africa bearing an annual snakebite deaths of 3,557 to 5,450 [5]. Europe, Australia, and North America statistically have the lowest incidence of envenoming [5]. Many people who survive bites nevertheless suffer from permanent tissue damage caused by venom, leading to disability [6]. Despite the number of deaths caused by snakebite annually, it was until June, 2017 that the World Health Organization formally listed snakebite envenoming as a highest priority neglected tropical disease [7]. Worldwide, snakebites occur most frequently in the summer or dry seasons when snakes are active and humans are undertaking outdoors related activities such as agriculture [8].

Injuries, disabilities and deaths from snakebites are something that happens daily in most parts of the world particularly in the poorest communities. Knowledge in relation to the management of snakebite patients is therefore very important. If clinicians are unfamiliar with the different species of snakes and unable to distinguish between venomous and non-venomous snakes, as well as the characteristics of snakebites, it can be difficult to know how to respond appropriately in terms of management in the event of a bite. Therefore, it is important for healthcare providers especially those in rural environments to be well equipped in terms of knowledge on snakes and snakebites which is required for effective management of victims who get bitten by snakes hence the need for this study in three rurally situated Tongu districts of the Volta region of Ghana. Again, this study is important since a search on the internet found no publication on the level of knowledge of health care professionals on snakes and snake bites in Ghana although some studies were done in some African countries.

Methodology

Study Design

A descriptive cross-sectional design was used to conduct this study between May to July 2019 among health care providers comprising of medical doctors, pharmacists, pharmacy technicians, physician/medical assistants, nurses of various categories and midwives working in selected Community-Based Health Planning and Service (CHPS) compound, health centres and hospitals.

Study Location

The study was undertaken in selected health facilities across the three neighbouring districts in the Volta region of Ghana namely South Tongu, North Tongu and Central Tongu. The selected health facilities include the Sogakope district and Comboni hospitals, Kpotame, Dabala, and Adutor health centres, Sasekope and Agbakope CHPS compounds from the South Tongu district; the Battor Catholic hospital and Volo health centre in the North Tongu district; the Adidome hospital, Mafi-Kumase and Mafi Dove health centres in the Central Tongu district. The Tongu districts are located in the South eastern part of the Ghana and are mainly inhabited by people of the Ewe tribe speaking the Tongu dialect. The total population of these districts in the 2010 population census was 237, 138 with agriculture as the main occupation of the people [9].

Sample Size

The sample size for this study was calculated using the Cochran formula, formula 1

Where t = value for selected alpha level of 0.025 in each tail = 1.96, d = acceptable margin of error for proportion being estimated = 0.05, p is the estimated proportion of an attribute that is present in the population, which is considered as 0.5 and q is 1-p. The knowledge of health care providers about snakes, snakebites and the management of snakebites was estimated at 50%.

formula 2

Since 384 exceeds the 5% (537 x 0.05 = 26.9) of the eligible study population of 537 having excluded the 20 who took part in the piloting, there was the need to use the Cochran correction formula to get adjusted sample size formula 5

formula 3

Assuming a response rate of 90%, the actual sample size = formula 4 = 244

The total response received was 186 giving a response rate of 76.2% (186/244*100).

Sampling Technique

A total of 186 respondents across the three Tongu districts participated in the study. The selection of respondents for this study was done through the use of both census and convenience sampling techniques. Effort was made to take a census sample of all the pharmacists (5), physician/medical assistants (26), medical doctors (17), and pharmacy technicians (6) because of their small numbers in the selected health facilities. However, for the nurses and midwives who were about 483, convenience sampling technique was applied to select the respondents.

Collection Instrument and Technique

Data for the study was collected in the period between May and June, 2019 through the use of a self-administered semi-structured questionnaire designed using google form. Section one of the questionnaire consists of eight questions on sociodemographic characteristics of the respondents; section two, eighteen questions assessing the knowledge on snakes and section three, sixteen questions assessing the knowledge on snakebites. The questionnaire development was guided by the WHO (2010) publication on Guidelines for the prevention and clinical management of snakebites in Africa. The questionnaire was administered through the WhatsApp accounts of the respondents using the link https://forms.gle/iV5NtKzdjbg5LTSc9 which they submitted online after the completion of the form.

Data Analysis

Microsoft Excel spreadsheet was generated from the google form. The data was processed and cleaned after which analysis was done using Statistical Package for the Social Sciences (SPSS) Version 23. Descriptive data were presented as frequencies, percentages and means in tables. Association between variables was determined using a confidence interval of 95%. Significance was assumed when p<0.05.

Data Measurement

The level of knowledge of respondents on snakes and snakebite were assessed by scoring the answers provided by the respondents which are compared with literature sources. A score of 1 mark was awarded for any correctly answered question with options to choose from. Besides the wrong answer, an ‘I don’t know’ option also attracts no mark. For open-ended questions that requires the respondent to provide a specified number of answers, each correct answer scores 1 mark, hence the maximum total score for a question requiring three answers is 3. The total scores for the knowledge on snakes and snakebites of the respondents were 18 and 22 respectively.

Ethical Consideration

Permission was sought from the District Health Directorates, Medical Superintendents and the Administrators of the South Tongu, North Tongu and Central Tongu hospitals before the data was collected. Study tool used for the study was approved by the Ethic Committee of the School of Medicine and Health Sciences of the University for Development Studies. Consent was obtained once the respondents agree to take part in the study, completed the form and submitted it. The preamble on the questionnaire explained the purpose of the research and stating clearly that submitting the form after completion is indicative of giving consent. They were also assured of confidentiality of all the information they were to provide.

Results

Socio-Demographic Characteristics of Respondents

Table 1 shows the socio-demographic characteristics of respondents in this study. Majority, 95 (51.1%) were males, and were within the age group 30-39 years, 98 (52.7%). Most respondents, 87 (46.8%) were from the South Tongu district, followed by the North Tongu, 54 (29.0%) with Central Tongu having the least number of respondents, 45 (24.2%). For the number of years of practice, majority, 112 (60.2%) had served for less than five years with the least number, 3 (1.6%) working for more than ten years. Majority of respondents, 146 (78.5%) work at various hospitals, while those from health centres and CHPS zones were 25 (13.4%) and 15 (8.1%) respectively. Registered General Nurses, 80 (43.3%) formed the largest number of health professional group with the pharmacists, 4 (2.2%) being the least.

Table 1: Socio-demographic characteristics of respondents.

Variable Subgroup Frequency Percentage (%)
Sex Male 95 51.1
Female 91 48.9
Age (years) 20-29 81 43.5
30-39 98 52.7
>39 7 3.7
District South Tongu 87 46.8
Central Tongu 45 24.2
North Tongu 54 29.0
Number of years of practice (years) <5 112 60.2
5-10 71 38.2
>10 3 1.6
Level of health facility CHPS compounds 15 8.1
Health Centre 25 13.4
Hospital 146 78.5
Profession category Registered General Nurse 80 43.0
Enrolled/Community Nurse 37 26.3
Midwife 15 8.1
Medical Doctor 14 7.5
Pharmacy Technician 5 2.7
Pharmacist 4 2.2
Physician/Medical assistant 19 10.2

Knowledge of Respondents about Snakes

Table 2 shows knowledge of respondents on snakes. The top five best answered questions on the knowledge of respondents about snakes were; Snakes being reptiles (99.0%), Cobra being venomous (92.0%), not all snakes are venomous (85%), identification of Cobra (82.0%), Cobra being the snake that spit into the eyes of the perceived enemies and Puff adder being venomous (67.0%). Five questions about snakes which were most poorly scored were; Identification of Savanna egg eater (2.0%), identification of Boomslang (3.0%), identification of Africa beauty snake (4.0%), Savanna egg eater being nonvenomous (5.0%) and Africa beauty snake being partially venomous (10.0%). The overall average knowledge score of respondents about snakes was 8.31 ± 2.950/18 (46.2%).

Table 2: Knowledge of respondents on snakes.

Question Responses Mean knowledge score Percentage knowledge score
Correctness Frequency Percentage
What type of animals are snakes? (Reptiles) Incorrect 2 1.1 0.99 ± 0.103 99.0
Correct 184 98.9
All snakes are carnivorous, i.e. feed on other animals. (Yes) Incorrect 78 41.9 0.58 ± 0.495 58.1
Correct 108 58.1
All snakes are venomous, i.e. inject “toxins” or venom into a person after a bite? (No) Incorrect 28 15.1 0.85 ± 0.359 85.0
Correct 158 84.9
All snakes have fangs in front of their mouth. (No) Incorrect 86 46.2 0.54 ± 0.500 54.0
Correct 100 53.8
Snakes pick sounds using their ears? (No) Incorrect 133 71.5 0.28 ± 0.453 29.0
Correct 53 28.5
Name of snake that spits venom towards the eyes’ enemies? (Cobra) Incorrect 62 33.3 0.67 ± 0.473 67.0
Correct 124 66.7
Identify the snake A

{Boomslang/green tree snake)

Incorrect 181 97.3 0.03 ± 0.162 3.0
Correct 5 2.7
Is snake A venomous, partially venomous (V) or nonvenomous (NV)? (NV) Incorrect 94 50.5 0.49 ± 0.501 50.0
Correct 92 49.5
Identify snake B (Cobra)


Incorrect 34 18.3 0.82 ± 0.388 82.0
Correct 152 81.7
Is snake B venomous, partially venomous or nonvenomous? (V) Incorrect 15 8.1 0.92 ± 0.273 92.0
Correct 171 91.9
 Identify snake C (Python)


Incorrect 76 40.9 0.59 ± 0.493 59.0
Correct 110 59.1
Is snake C venomous, partially venomous or nonvenomous? (NV) Incorrect 114 61.3 0.39 ± 0.488 39.0
Correct 72 38.7
Identify snake D (Savanna egg eater) Incorrect 183 98.4 0.02 ± 0.126 2.0
Correct 3 1.6
Is snake D venomous, partially venomous or nonvenomous? (NV) Incorrect 176 94.6 0.05 ± 0.226 5.0
Correct 10 5.4
Identify snake E (Puff adder) Incorrect 133 71.5 0.28 ± 0.453 29.0
Correct 53 28.5
Is snake E venomous, partially venomous or nonvenomous? Incorrect 62 33.3 0.67 ± 0.473 67.0
Correct 124 66.7
Identify snake F (Africa beauty snake) Incorrect 178 95.7 0.04 ± 0.203 4.0
Correct 8 4.3
Is snake F venomous, partially venomous (PV) or nonvenomous? (PV) Incorrect 167 89.8 0.10 ± 0.304 10.0
Correct 19 10.2
Overall mean score 8.31 ± 2.950/18 46.2%

Correct answers are in parenthesis ( ) at the end of the question.

Association between Socio-Demographic Characteristics and Knowledge on Snakes

Table 3 shows association between socio-demographic characteristics and knowledge on snakes. For knowledge of respondents about snakes, males significantly scored better than females (9.04 vs. 7.55; p < 0.001). Respondents working at the lowest part of the health system, the CHPS compound obtained the best scores (9.27), followed by those in the health centres (9.24) while respondents in hospitals scores the least of 8.05 but the differences were not significant. Respondents from the Central Tongu district obtained the best mean score (9.04) followed by North Tongu (8.67) and South Tongu recorded the lowest (7.17) but the differences were not significant. There was no significant association between area of profession and knowledge on snakes but pharmacists had the highest mean score (10.25) and the Registered General Nurses (RGNs) had the lowest mean score (7.80). The prescribers and pharmacy groups had a better knowledge mean scores of 9.67 and 9.27 respectively while the nurses and the midwives group scored 8.01 but there were no significant differences. Respondents who had training on snakebite management significantly scored better than those who did not received training (9.93 vs. 7.60; p < 0.0001). Respondents with more than 10 years of practice scored better with mean score of 12.50, followed by respondents with < 5years (8.48) and 5-10 years (7.93) in that order but there were no significant differences.

Table 3: Association between socio-demographic characteristics and knowledge on snakes.

Variable Sub group Mean score ± standard deviation (SD) p-value
Sex Male 9.04 ± 2.982 < 0.001*
Female 7.55 ± 2.730
Level of health facility CHPS compound 9.27 ± 2.963 0.75
Health centre 9.24 ± 3.551
Hospital 8.05 ± 2.803
District of health facility South Tongu 7.71 ± 2.753 0.27
Central Tongu 9.04 ± 3.398
North Tongu 8.67 ± 2.706
Area of profession RGN 7.80 ± 2.528 0.35
Pharmacist 10.25 ± 4.924
Medical officer 9.64 ± 3.455
Physician assistant 9.00 ± 3.448
CHN/ENa 7.82 ± 2.855
Pharmacy technician 9.20 ± 3.114
Registered midwife 9.73 ± 2.890
Professional groups Nursing and midwifery group 8.01 ± 2.726 0.30
Prescriber group 9.67 ± 3.755
Pharmacy group 9.27 ± 3.412
Training No training 7.60 ± 2.600 <0.001*
Received training 9.93 ± 3.076
Number of years of practice <5 years 8.48 ± 2.825 0.060
5-10 years 7.93 ± 3.073
>10 years 12.50 ± 2.121

aCHN/EN – Community Health Nurse/Enrolled Nurse, * Statistically significant.

Knowledge of Respondents on Snakebite

The top five best answered questions on the knowledge of respondents about snakebite were; the local signs and symptoms of snakebite (93.0%), ways of preventing snakebite (84.0%), handling of a death snake not being safe enough (78.0%), signs and symptoms of snakebite being determined by the type of snake responsible for the bite (78.0%), the rainy season being the season with most snakebite incidence in Ghana (74.3%), The five most poorly scored questions on knowledge about snakebite were; percentage of snakebite (out of hundred percent) that may come from venomous snakes (1.1%), walking on a log of wood being the best thing to do to prevent snakebite when you come across a log of wood on your path in the forest (11.2%), number of times a venom will be injected into a victim out of hundred bites (13.4%), sleeping under mosquito nets preventing snakebites (32.1%) and the day being the most common time of snakebite (37.0%). The overall average knowledge score of the respondents on snakebite was 13.78 ± 4.000/22 (63%). Table 4 shows knowledge of respondents on snakebite.

Table 4: Knowledge of respondents on snakebite.

Question

Responses

Mean knowledge score ± SD Percentage knowledge score
Sub-group/

Correctness

Frequency Percentage
State 3 ways a person can prevent snake bitesa 0/3 3 1.6 2.53 ± 0.758 84.0
1/3 21 11.2
2/3 36 19.3
3/3 126 67.4
Handling a dead snake’s head is safe enough? (No) Incorrect 41 21.9 0.78 ± 0.416 78.0
Correct 145 77.5
Fang marks can always be seen or found on the victim after every snake bite? (No) Incorrect 57 30.5 0.69 ± 0.462 69.0
Correct 129 69.0
Can a person report at the hospital with symptoms of snake bite toxin injection without actually being bitten by a snake after he or she might have been pricked by an object he or she suspected to be a snake? (Yes) Incorrect 70 37.4 0.62 ± 0.486 62.0
Correct 116 62.0
Sleeping under mosquito nets can prevent snakebites. (Yes) Incorrect 126 67.4 0.32 ± 0.469 32.1
Correct 60 32.1
Do you think every time a venomous (“poisonous”) snake bites, it always injects venom (poison) into the victim? (No) Incorrect 93 49.7 0.50 ± 0.501 50.0
Correct 93 49.7
Which of the following is best used to determine if a person bitten by a snake had venom actually being injected into him or her by the snake?b Incorrect 64 34.2 0.66 ± 0.476 65.2
Correct 122 65.2
Signs and symptoms of snake bites are determined by the type of snake responsible for the bite. (Yes) Incorrect 41 21.9 0.78 ± 0.416 78.0
Correct 145 77.5
State 3 local symptoms and signs you will see on the part of the human body bitten by a snake.c 0/3 4 2.1 2.78 ± 0.612 93.0
1/3 7 3.7
2/3 14 7.5
3/3 161 86.1
State 3 general or systemic signs and symptoms that may be exhibited by a venomous snake bite victim.d 0/3 20 10.7 2.12 ± 1.030 71.0
1/3 28 15.0
2/3 47 25.1
3/3 91 48.7
Out of ONE HUNDRED (100) snake bites, what percent may come from venomous snakes? (30) Incorrect 184 98.4 0.01 ± 0.103 1.1
Correct 2 1.1
Out of ONE HUNDRED (100) bites by venomous snakes, how many times do you think venom will be injected into the victim? (50) Incorrect 161 86.1 0.13 ± 0.342 13.4
Correct 25 13.4
The signs and symptoms of snake bite depends on the amount of venom injected by the snake. (Yes) Incorrect 73 39.0 0.61 ± 0.490 60.4
Correct 113 60.4
What time of the day do you think snake bites are most common? (During the day) Incorrect 117 62.6 0.37 ± 0.484 37.0
Correct 69 36.9
Which season in Ghana is snake bites most common? (Rainy) Incorrect 47 25.1 0.75 ± 0.436 74.3
Correct 139 74.3
When you are walking in the forest or farm and you come across a log of wood across your path, what would be the best thing to do prevent being bitten possibly by a snake? e Incorrect 165 88.2 0.11 ± 0.317 11.2
Correct 21 11.2
Overall mean score 13.78 ± 4.000/22 (63%)

aKeep grass short or the ground clear around your house; Clear underneath low bushes to close to the house; Avoid keeping livestock in the house; Store food in rat- proof containers; Do not have tree branches touching your house; Use a light and proper shoe when walking at night; Clear heaps of rubbish from near your house. bSigns and symptoms. cPain, swelling, fang marks, blisters formation, swollen lymph nodes draining the site, local bruising and bleeding, redness of the site. dBleeding and clotting disorders, dizziness, blurred vision, and syncope which may occur as a result of hypotension after the bite, Transient paraesthesiae of the tongue and lips, heaviness of the eyelid, nausea and vomiting, bilateral ptosis, respiratory and generalized flaccid paralysis. eStep/walk on it. Correct answers are in parenthesis ( ) at the end of the question.

Association between Socio-Demographic Characteristics and Knowledge on Snakebite

Table 5 shows association between socio-demographic characteristics and knowledge on snakebite. Male respondents had a better means knowledge score on snakebites than their female counterparts (14.49 vs. 13.03) but the difference was not significant. Respondents from the CHPS compound significantly scored better than respondents from the health centres and hospitals (16.6 > 14.84 > 13.31; p < 0.03). Respondents from Central Tongu obtained the highest mean score, (14.36) on knowledge about snakebite, followed by North Tongu (14.28) and South Tongu scored the lowest (13.17) but the differences were not significant. Pharmacists and medical doctors significantly scored better than Physicians assistants (PAs), Pharmacist technicians, Community health nurses/Enrolled nurses (CHN/ENs) and Registered general nurses (RGNs) on knowledge on snakebite (p 15.09 > 13.35; p < 0.020). Respondents who had training on snakebite management significantly scored better than those who had not received training on snakebite management (15.60 vs. 12.98; p < 0.0001). There was no significant association between number of years of practice and knowledge on snakebite management. Respondents with more than 10 years of practice obtained the best mean score of 15.50, followed by < 5 years (14.13) and lastly 5-10 years (13.18) but the differences were not significant.

Table 5: Association between socio-demographic characteristics and knowledge on snakebite.

Characteristic Sub-group Mean Score + SD P-value
Sex Male 14.49 ± 3.670 0.12
Female 13.03 ± 4.210
Type of health facility CHPS compound 16.60 ± 4.290 0.03*
Health centre 14.84 ± 5.088
Hospital 13.31 ± 3.621
District of health facility South Tongu 13.17 ± 3.593 0.152
Central Tongu 14.36 ± 4.107
North Tongu 14.28 ± 4.444
Area of profession RGN 12.80 ± 3.107 0.023*
Pharmacist 16.50 ± 3.416
Medical officer 16.50 ± 2.739
Physician assistant 14.05 ± 3.908
CHN/EN 13.96 ± 4.528
Pharmacy technician 15.40 ± 6.693
Registered midwife 14.27 ± 5.325
Professional group Nursing and midwifery group 13.35 ± 3.921 0.020*
Prescribers 15.89 ± 5.207
Pharmacy group 15.09 ± 3.625
Training No training 12.98 ± 3.686 <0.001*
Received training 15.60 ± 4.118
Number of years of practice <5 years 14.13 ± 4.186 0.240
5-10 years 13.18 ± 3.386
>10 years 15.50 ± 2.121

*Statistically significant.

Discussion

The findings from the study showed that, majority, 95 (51.1%) of the respondents were males to similar studies in Nigeria and Cameroun but different from the study in Laos [10-12]. This could be because in Ghana, health care professional groups (medical doctors, pharmacists and pharmacy technicians, physician assistants) in exception of the nursing and midwifery profession are dominated by males although presently there are more males in the nursing profession than it used to be some years ago. Most of the respondents were within the age groups 30-39 years (52.7%)) and 20-29 years (43.3%). This age groups fall within the group considered to be the working age group (15 years and above) in Ghana by the Ghana Statistical Service (GSS) [9]. It is therefore not surprising that majority of health care professionals in the three districts are of a youthful age group. The result of the study also showed that the South Tongu district recorded the highest number of respondents, 87 (46.8%) in the study. This was because the South Tongu district has two main hospitals (the District hospital and Comboni hospital) and more health centres and CHPS compounds combined than the North and South Tongu districts. The results on the number of years of practice revealed that 112 (60.2%) of the respondents form the majority with less than five years of practice. This result corresponded with the findings of Michael et al. (2018) where 66.3% of the respondents were with < 10 years working experience. This could be due to the reason that most professionals who had served for more than five years had gone to further their studies as health professionals in Ghana are granted study leave after working for a period of 3 to 5 years. The study also revealed that majority, 146 (78.5%) worked at the hospitals while to 25 (13.4%) and 15 (8.1%) worked in the health centres and CHPS compound respectively. This is because the hospitals have larger number of health care professionals than the lower level health facilities. The nursing group (RGN: 43% and EN/CHN: 26.3%) formed the most common group of health workers in the study because of their dominance in terms of numbers in every health facility in Ghana. This result is in contrast with a similar study conducted in Lao People Democratic Republic (Lao PDR) and Cameroun where physicians formed the majority of the respondents [11,12]. The difference clearly could be the difference in the settings of the different studies and target groups involved in these studies.

The overall average knowledge score rated by the respondents on knowledge on snakes in the study was 46.2%. This score shows that the health care providers performed below average in the assessment of their knowledge about snakes. Health professionals were least knowledgeable about identity of various species of snakes. Similar study done in India [13] revealed that 65% of the respondents had poor information about snake identification. Similar studies in Lao, Nigeria and Cameroun also found health professional exhibiting poor knowledge on identification of snakes [10-12]. This means the health training schools in many countries do not have enough materials on snakes and snakebites and even after graduation, not many health authorities organize in-service training on snakes and snake bite management. This is of a great concern because, to be able to determine whether envenoming could occur or had occurred after a snakebite, the health care professionals need to identify the type of snake involved in the bite if brought along or upon description by victim or relatives. Knowing that the offending snake species is venomous, partially venomous or nonvenomous will guide the health care professional on how best to manage the condition and whether it will be necessary to administer anti-snake venom which is usually difficult to get in many countries. Despite the low overall level of knowledge, male health workers possess a significantly better knowledge on snakes than females. The difference in knowledge score between the sexes on snakes could possibly be because women generally fear snakes and would do everything to avoid issues concerning snakes [14]. The reason why health care providers working in the lowest part of the health system (CHPS zones and health centres) had better score on knowledge on snakes than those working in the higher level (hospitals) could be because since they work in more rural communities where snakes are more common, they will invariably be more familiar with snake species than those from the facilities located in the bigger towns where encounters with snakes are less common. The results of this study also showed that the prescribers (medical officers and physician assistants) and the pharmacy group (pharmacists and pharmacy technicians) had better knowledge on snakes than the nurses and midwives just as reported in the Cameroonian study [11]. These differences in knowledge between these groups of health care professionals could be because the prescribers and the pharmacy professionals may have had more training on snakebite management than the nurses and the midwives. Again, the prescribers also play important role in the management of snakebites while the pharmacy personnel supply the medications but the involvement of a nurse in the snakebite issues depended on his or her area of work. The study showed a high level of knowledge among the health care professionals on the local signs and symptoms (93.0%) and preventive measures (84.0) of snakebites. These results corroborated the findings in a similar study in Northern Nigeria where respondents scored 62.3% on clinical features of snakebite and 97.1% on preventive measures [10]. The reason that could account for the high level of knowledge among the health care professional on the local sign and symptoms of snakebite could be that most of them have severally seen victims of snakebite reporting to the health facility presenting with these signs and symptoms. The study also revealed that majority (74.3%) of the respondents knew that snake bites occur more often during the rainy season in Ghana. The high knowledge on the season with the most prevalence of snakebite may be because during the rainy season, the number of snake bite cases reporting to the health facilities increases as compared to the dry season. The overall average knowledge score of 63.0% on the knowledge about snakebite is an indication of some deficit in knowledge of health care professionals in the Tongu districts about snakebites. The overall knowledge score on snakebite is a little higher (63.0% vs. 52.9%) than what was recorded in the study conducted among physicians in Northern Nigeria [10]. A study in Cameroon also recorded poor knowledge on snake bites among health professionals [11]. This study therefore reveals a yawning gap between what our health care professionals should know and what they know about snakes and snake bites which will compromise their management of victims of snake bites. If health workers in rural environments where more snake bites will be reported seem to possess such low level of knowledge about consequences and management of effects of human snake conflict, then it can be extrapolated to mean than health practitioners in urban areas will be more deficient in snake bite management. This study however had some limitations worth noting. This study was conducted in only three out of about two hundred and sixty districts of Ghana so may not represent the situation across the country. Again, since convenience sampling was used in the selection of the nursing professionals, there may be some biases in their selection which can affect the generalization of the results of this study. Despite these limitations, the outcomes of this study being the first of its kind in Ghana, should cause health policy-makers to provide more in-service training on snakes and snake bites to all health workers so as to bridge the gap of knowledge deficit. Again, health training institutions should include snake bites issues in their academic curricula so that their trainees will be adequately equipped to help reduce morbidity and mortality associated with snake bites after graduation.

Conclusion

This study had shown some inadequacies in knowledge regarding snakes and snakebites among health care professional in the three Tongu districts of the Volta region of Ghana. Since in-service training was associated with respondents’ knowledge on snakes and snakebite, there is a clear need for improvement in knowledge about snakes and snakebites among health workers in the three Tongu districts and across the Ghana.

Acknowledgement

We wish to acknowledge the support of heads of health facilities where the data was collected for granting the permission for the study to be conducted in their health institutions. We also acknowledge the support given the team of researchers by health workers in the North, Central and South Tongu districts of the Volta region. The authors had no conflict of interest in this research since the study was funded by the researchers themselves.

References

    1. WHO Regional Office for Africa. Guidelines for the prevention and clinical management of snakebite in Africa: Mauritius. 2010. Retrieved April 15 2019 from
      http://afrolib.afro.who.int/documents/2010/En/Snakebite_guidelines.pdf.
    2. Habib AG. Public health aspects of snakebite care in West Africa: perspectives from Nigeria. Journal of Venomous Animals and Toxins including Tropical Diseases. 2013;19:1-4.
      https://doi.org/10.1371/journal.pntd.000671
    3. Prevalence of snakebite envenoming. 2019a. Retrieved June 5, 2019 from
      https://www.who.int/snakebites/epidemiology/en/
    4. Kasturiratne A, Wickremasinghe AR, de Silva N, Gunawardena NK, Pathmeswaran A, Premaratna R, Savioli L, Lalloo DG, de Silva HJ. The global burden of snakebite: a literature analysis and modelling based on regional estimates of envenoming and deaths. PLoS Med. 2008 Nov 4;5(11):e218.
    5. Snakebite envenoming. 2019b. Retrieved May 21, 2019 from
      https://www.who.int/snakebites/treatment/Diagnostic_tests_and_tools/en/
    6. Williams D, Gutiérrez JM, Harrison R, Warrell DA, White J, Winkel KD, Gopalakrishnakone P. The Global Snake Bite Initiative: an antidote for snake bite. The lancet. 2010 Jan 2;375(9708):89-91.
    7. Chippaux JP. Snakebite envenomation turns again into a neglected tropical disease! Journal of Venomous Animals and Toxins including Tropical Diseases. 2017 Dec;23(1):38.e218.
    8. Wingert WA, Chan L. Rattlesnake bites in southern California and rationale for recommended treatment. Western Journal of Medicine. 1988 Jan;148(1):37.
    9. Ghana Statistical Service.  Population and Housing Census Summary Results of Final. 2012. Retrieved July 17, 2019 from
      http://statsghana.gov.gh/gssmain/storage/img/marqueeupdater/Census2010_Summary_report_of_final_results.pdf
    10. Michael GC, Grema BA, Aliyu I, Alhaji MA, Lawal TO, Ibrahim H, Fikin AG, Gyaran FS, Kane KN, Thacher TD, Badamasi AK. Knowledge of venomous snakes, snakebite first aid, treatment, and prevention among clinicians in northern Nigeria: a cross-sectional multicentre study. Transactions of The Royal Society of Tropical Medicine and Hygiene. 2018 Feb 1;112(2):47-56.
    11. Taieb F, Dub T, Madec Y, Tondeur L, Chippaux JP, Lebreton M, Medang R, Foute FN, Tchoffo D, Potet J, Alcoba G. Knowledge, attitude and practices of snakebite management amongst health workers in Cameroon: Need for continuous training and capacity building. PLoS neglected tropical diseases. 2018 Oct 25;12(10):e0006716.
    12. Inthanomchanh V, Reyer JA, Blessmen J, Phrasisombath K, Yamamoto E, Hamajima N. Assessment of knowledge about snakebite management amongst healthcare providers in the provincial and two district hospitals in Savannakhet Province, Lao PDR. Nagoya journal of medical science. 2017 Aug;79(3):299.
    13. Pandve HT, Makan A, Kulkarni TA. Assessment of awareness regarding snakebites and its related issues among rural communities. SF J Pub Health. 2017;1(1).
    14. Rakison DH. Does women’s greater fear of snakes and spiders originate in infancy?. Evolution and Human Behavior. 2009 Nov 1;30(6):438-444.
fig 1

Airline Service Features: A Mind Genomics Cartography Incorporating Emotions

DOI: 10.31038/ASMHS.2021511

Abstract

Respondents evaluated unique sets of 48 different combinations of elements (so-called vignettes), describing airline services, first rating interest, and second, selecting the emotion closest to their feel, from a list of five feelings/emotions. The test stimuli comprised mixtures of elements, features of the airline’s service, combined according to an experimental design. Each of 54 respondents evaluated a unique set of vignettes arrayed to ensure that the ratings could be analyzed by OLS (ordinary least-squares) regression. Two mind-sets emerged, MS1 being travel process and MS2 being fun and entertainment. The individual elements were linked to the emotions as well, providing a nuanced view of the elements beyond the ability to drive interest in the airline. The paper ends by introducing the PVI, personal viewpoint identifier, to assign a new person to a mind-set, providing a prescription of the specific words to say to the respondent to break through the everyday clutter, and excite interest in the offering.

Introduction

The world of travel and leisure collapsed during the 2020 Covid-19 pandemic [1-3]. Earlier in the decade, as travel was surging, the issues emerged about just ‘what’ the customer wanted in what was becoming a highly competitive environment. The period from 2009 to 2019 saw the emergence of the world from a financial debacle, the melt-down of 2008. Companies began to compete on what they could offer the customer. The emergence of e-commerce, and -shopping for travel changed the balance of knowledge, making the travel agent less important. Customers could use the Internet with programs like Kayak, Orbitz, and so forth to discover and piece together prices, amenities, schedules, etc. [4,5].

Within this world of information and increased customer demand, as well as direct to consumer, issues began to emerge about what features are important to acquire and satisfy customers [6]. In addition, however, interest in consumer requests was accompanied by a growing understanding that emotions play a role in decision making as well [7]. The question emerged about how to link elements to emotions as well, providing two pieces of information; how the element drives decisions, and how the element drives emotions, respectively In papers published by author Moskowitz and colleagues, introduced an approach using experimental design to design test stimuli, and a method to assess liking responses to these test stimuli, and especially determine the acceptance of the the underlying individual phrases, elements, the building blocks of the vignettes [8,9].

The study reported here presents one of the early studies in the use of the emerging psychological science of Mind Genomics to understand how people think about the features of travel, both in terms of motivation to act, and in terms of the linkage of emotion to the specific element. The ingoing assumption was that through the approach of Mind Genomics, explained below, it would be possible to do a simple study to understand the mental ‘valence’ of ideas in the mind of the consumer.

Understanding the Mind of the Consumer through Systematics (Mind Genomics)

Mind genomics is an emerging science with heritage from psychology, consumer research, statistics, and anthropology [10]. The objective of a Mind Genomics study is to understand how people make decisions about the everyday aspects of their lives. Mind Genomics works at the level of the granular, at the simplest levels of experience, which we might call ‘bottom-up’. This means that the information is specific, g expressed in the language of the person who is doing the experiencing, rather than in a summarizing, detail-sparse, high level language that might be used for a professional report.

The study reported here represents one of the earliest mindset cartographies, defined operationally as small studies which take a snapshot of an experience or a situation, with relatively few people. The objective of cartography is to map out the area, rather than confirm/falsify a hypothesis in the way Karl Popper and his associates might do so [11]. Mind Genomics reveal patterns which suggest a hypothesis, rather statistically test a hypothesis. The reason for that seemingly bold statement is that the conventional ways scientist to test hypothesis involve focusing the study, minimizing the noise so that the ‘signal’ can come through. Mind Genomics works in the opposite way, inserting ‘noise’ by testing the stimulus in y different ways, akin to the MRI (magnetic resonance image). It is the set of patterns generated by the MRI, and recombined, which lets the signal come through clearly.

Applying Mind Genomics to the Customer-facing Aspects of an Air Flight

We illustrate how Mind Genomics reveals the responses to an ordinary situation of the 21st century, specifically what people want as amenities on an airline. As the case study unfolds, we will see how Mind Genomics deals with what is interesting at a cognitive, interpretation level, and then at an emotional level, viz., the emotions selected by the respondent while reading a vignette.

The objective of the study was to identify the features of a flight as might offered by an airline seeking to burnish its image. Among the many offers that an airline could provide, in the language of the airline, how does Mind Genomics reveal the importance of the different offers, identify the emotions which relate or link to those offers, and uncover new mind-sets, groups of people showing different, even radically different responses to the same stimuli?

The process follows a series of steps, which we now explicate, showing the step, the data, and the conclusions emerging from each step.

Step 1: Select the Topic, Ask 6 Questions Relevant to the Topic, and for Each Question Provide 6 Answers

The original study was done in 2012. At that time, the primary design was the so-called ‘6×6’, or six questions, each with six answers, and a unique set of 48 combinations or vignettes for each respondent. The reason for the larger design can be traced to the early years of internet-based research. The respondents were recruited from a panel (Open Venue, Inc.,) located in Toronto Canada, but servicing the United States. Respondents at the time were not yet ‘oversampled’ by having every internet transaction followed by a short survey for satisfaction, or so it seems today.

During the first 15 years of these past two decades, it was possible to get consumer respondents to participate in interviews on the web lasting 15 to 20 minutes each. The dropout rate was low, around 33%, and the cost was modest. One benefit of the early introduction of Mind Genomics into internet-based research was the possibility of larger, longer studies, the current 6×6 design, and two rating questions. Today, with the shortening of attention span, with the various media and social media competing for attention, it is no longer possible to do the types of studies reported here. The studies can be of the same type, but significantly shorter. The new approach comprises 4 questions and four answers to each question and is known by the phrases ‘4×4’ or ‘four by four’.

Table 1 shows the 36 elements, arranged by question, and then the six answers (elements) to each question. It is important to keep in mind that the selection of elements need not be perfect. Most researchers are accustomed to thinking a great deal about the choice of elements. Some of that thinking comes from the fact that the researcher fails to perceive research as an iterative process and assumes that the research of this type is always final, conclusive. When the researcher realizes that one can do these early-stage cartographies quickly, inexpensively, and iteratively, the attitude changes from ‘getting the right elements for the not-to-be repeated study’ to ‘getting into the field, getting a feel of what ‘works’, and the iterating a few more times during the next day or two.’

Table 1: The six questions and the six answers to each question.

Question A: What are travel perks?
A1 Fly with us and your bags will fly free
A2 Extra carry-on bags….No extra charge when choosing our airline
A3 Special monthly offers
A4  Enjoy VIP perks with our executive club membership
A5 Frequent flyers of our airline get frequent flyer miles
A6 Special holiday deals
Question B: What are personal travel conditions?
B1 Comfy leather seats
B2 Extra legroom with your seat
B3 Wider seats in both coach and first-class sections
B4 Enjoy peaceful privacy with unlimited luxury in first-class
B5 Adjustable personal heating and air conditioning
B6 Private area for nursing infants
Question 3: How do you make travel easier/more fun?
C1 Ticket fees updated online every 24 hours
C2 Unlimited in-flight shopping with payment options available
C3 Book flights through our NEW mobile app
C4 City guide scouts HOT SPOTS for each destination
C5 Largest number of planes with WiFi
C6 Book car rental and hotel reservations all from one website
Question D: What type of club facilities do you offer?
D1 Club members gain access to private lounge in terminals
D2 FREE club membership
D3 Open bar in Pre-flight lounge
D4 Priority boarding privileges for club members
D5 When joining our club your 1st flight is 9 Dollars!
D6 Frequent flyers get extra carry-on bags
Question E: What type of food do you feature?
E1 Fresh food prepared daily
E2 Affordable meals
E3 Large variety of snacks
E4 Baby Formula available on menu for nursing mothers
E5 International cuisine
E6 Meals prepared to your preference
Question F: How do you relieve the schedule & baggage related anxieties?
F1 Mobile app reminds you of your flight 24 hours before boarding
F2 Gift card given if flights are late
F3 24/7 baggage assistance
F4 Live status for the whereabouts of incoming flights
F5 30min guarantee for incoming baggage
F6 Top Security guaranteed at airports

Step 2: Create Combinations of Answers (Vignettes), Present Them to the Respondent in Sets of 2-4 Answers, the Set Evaluated as a Single Offering

The underlying experimental design creates 48 unique combinations for each person. 36 of those combinations comprising four answers (elements), and 12 of those 48 combinations comprising three answers. No vignette can ever comprise two answers from one question to avoid combinations which could be mutually contradictory. The combinations are dictated by a single basic underlying design. The design is permuted so that the mathematical structure is the same, but the specific combinations differ for each respondent. The beauty of the design permutation strategy is that we know ahead of time that each respondent will have evaluated the precisely correct combinations to create an individual level model for that person. In the world of statistics, Mind Genomics uses a within-subjects design, which can be analyzed down to the level of a single respondent, that respondent level analysis becoming relevant for clustering the respondents into mind-sets.

The fact that each respondent evaluates a full experimental design makes Mind Genomics metaphorically akin to the MRI (magnetic resonance imaging). The MRI tool takes different snapshots of an underlying tissue, 2-dimensional, but puts them together afterwards by a computer program. The result is a three- dimensional represent Obtained by combining many-2 dimensional representations. The same holds for the Mind Genomics approach. We get a better understanding of the nature of responses to a situation by having many snapshots or many respondents looking at different combinations of the same topic. Rather than worrying about being correct in our initial choice of the stimuli to test, we create a pathway requiring absolutely no knowledge, although it does require that the researcher to identify phrases to use.

Before leaving this underlying experimental design, it is worth reinforcing the state above regarding Karl Popper’s view of the need to work with hypotheses. Mind Genomics differs from the conventional science which is interested in falsifying or confirming a hypothesis. To falsify with confidence, one would like to make the measures as free of variability as possible. In such a case, the strategy is to test the same stimuli many times to suppress by variability by averaging. Mind Genomics prescribes measuring the entire space, even with noise, letting the pattern emerge out of the seeming noise. Mind Genomics suppress the noise by averaging the underlying patterns, so that the noise drops out. The happy result is that Mind Genomics experiments (viz., studies, surveys) cover a great deal of the ‘design space,’ and reveal inherent patterns in a clear way. The underlying ‘story’ is easy to discern.

Step 3: Present the Test Stimuli, Vignettes, and Get Ratings

Figure 1 shows an example of four steps in the process, these steps manifesting themselves in screen during the Mind Genomics experiment. The four steps are shown as a single slide.

fig 1

Figure 1: Example of the respondent experience, who sees instructions, a vignette and two ratings scales, use the airline, and select an emotion.

The top portion of Figure 1 shows the orientation/instructions. The instructions say as little as possible about the topic. The goal is to have the elements convey the information because it will be the reactions to the elements which make all the difference.

The second section of Figure 1 shows a four-element vignette, viz., and a vignette comprising four answers.

The third section of Figure 1 shows the first rating scale; ‘use this airline’ (expected action)

The fourth section of Figure 1 shows the second rating scale, ‘select an emotion.’

Often critics complain that it is impossible for a person to make a judgment unless the vignettes are complete. Experience over the last 35 years with Mind Genomics shows this criticism to be invalid, although there is some need for instruction. People have no problem once the vignette is put into context with a few relevant pieces of information. A vignette having only one piece of information is hard to evaluate. An example is a vignette presenting only the brand name, or a price or a benefit. There is no sense of a ‘something’ being evaluated. By the time we get to two and certainly three elements things become a lot easier. The ‘something’ emerges, although the something is simply a set of ideas strung together without connectives. Nonetheless, respondents very rarely say that they have a difficulty answering the questions when there are several elements in the same vignette.

A great deal of the criticism of Mind Genomics comes from individuals who are looking at the process as a long, tortuous process. Most of the people who complain are either academics or marketers. The typical run-of-the-mill person has no problem going through 48 of these vignettes, when the vignettes are properly presented. The respondent is instructed to rate the vignette, doing so by ‘intuition’ and ‘gut feel’. It is here that respondents occasionally begin by trying to be consistent, but since these vignettes come and go so quickly, a typical respondent simply stops trying to be consistent, goes into almost an automatic state, and responds honestly to the combinations. The respondent cannot game the system. That is exactly what is desired, in an honest evaluation. The mind genomics approach forces the respondent to be honest because no human being could follow this combination rapidly enough when the combinations come once a every 8-12 seconds each, in an unrelenting fashion. This evaluation time suffices for the respondent to read the vignette, or at least glance at the vignette, and assign two ratings.

After the respondent completed the evaluation of the 48 vignettes, they completed a second questionnaire, comprising a self-description, in terms of who they are, what they do, and what they think about traveling and airlines. The respondents also were asked to list one feature that they feel to be most important.

For Mind Genomics studies, the best practice is to work with a professional company which specializes in getting respondents to participate on these online studies, whether the studies are called surveys, experiments, or some other label. The respondents may not be totally representative of the entire population, but they are as close as one is going to get to a representative population of the ultimate consumer or relevant party. Efforts to get free panelists may work in some rare situations, but over the past two decades it has become the norm to use panel providers, who incentive the panelists to participate in these studies. In this way the data come in quickly, at relatively low cost.

Step 4: Prepare the Data for Analysis by Transforming the Rating to Create New Variables

The 9-point Likert Scale may be used in the way it is, but it will be far more relevant to create a new binary scale for question #1 (use the airline), and five new binary scales for question #2 (select the emotion from a set of five).

The rationale for creating a binary scale is the effort needed to understand and then to explain the meaning of each scale point on a 9-point scale. Managers make yes/no decision, and prefer black and white answers, or at least black and white measures (viz., not use the airline vs. use the airline). When the 9-point scale is transformed to a binary scale, no/yes, it becomes easier for the manager to understand and use the data. Managers can understand yes in know quite easily. It does not take a lot of effort to explain the results. There is of course a loss of granularity, but that is to be expected and welcomed because it also reduces the confusion in interpreting the results.

The first transformation is the binary transformation using scale #1, the 9-point rating scale. By convention, viz., long term processes in consumer research, the scale is divided between 6 and 7. Ratings of 6 and below are assigned the value 0. Ratings of 7 and above are assigned the rating 100.

The second transformation is done using scale #2, the emotion. Each of the five emotions becomes its own scale. When the emotion is selected (and the other four not selected), the newly created variable corresponding to the selected variable is assigned the value 100. The other four newly created variables, viz., those not selected, are assigned the value 0. It should be kept in mind that this second ‘scale’, viz., select the emotion, is not a rating scale in the way we think of scales, but rather the lowest form of measurement, called the nominal scale by psychophysicist SS Stevens [12]. The five scale points, 1,2,3,4, and 5, do not have any metric value. They are simply placeholders to tell us what was selected.

The two transformations j prepare the data for OLS (ordinary least squares) regression analysis, which link the transformed ratings to the presence/absence of elements.

One final note is in order. OLS regression requires variation in the dependent variable, viz., variation in the transformed rating. This variation can be vanishingly small, but it must be in the data to prevent the regression analysis from ‘crashing.’ A prophylactic measure adds a random number around 10-5 to each newly transformed variable, a low number which does not material affect the OLS regression but prevents the OLS regression program from ‘crashing.’

Step 5: Create an Equation for Each Person, and Cluster People Based on the Pattern of Their Coefficients

The underlying experimental design enables the researcher to relate the presence/absence of the 36 elements to the responses, even at the level of the individual. This so-called ‘within-subjects design’ allows the estimation of the following equation at the level of each respondent, even though each respondent evaluated a unique set of 48 vignettes or combinations:

Binary Response Variable = k0 + k1(A1) + k2(A2) … k36(F6).

The foregoing equation uses the transformed variable from question #1, which had been transformed from a 9-point Likert Scale [13] to a binary scale (see Step 4 above).

Each respondent generates a vector of 37 numbers, an additive constant and 36 coefficients, one coefficient for each of the 36 elements. We ignore the additive constant, focusing just on the 36 coefficients. These coefficients show how the respondent weights the information to drive the judgment of ‘use.’

Through the statistical methods known as cluster analysis [14], we divide the respondents into two and then three groups, based upon the pattern of coefficients. In this case, with a small base size of 54 respondent we isolate two large clusters that were interpretable (MS1 and MS2), and a small cluster of 4 respondents that could not be interpreted. We thus selected a three-cluster solution, but do not pay attention to the third cluster, or third group (MS3). Note that the terms MS1, MS2, and MS3 are short-hand versions for the phrase mind-set, whose meaning will become clear.

At this point it is important to note that the entire clustering operation except for rejecting clusters or naming them is a purely mathematical operation, based upon creating groups of objects (respondents) showing mathematically ‘similar patterns.’ There is no attempt to name the mind-sets. Up to now everything is ‘objective,’ at least in the mathematical sense.

Step 6: Create an Equation for All Respondents, for Total, for Mind-sets, and for Genders

Step 5 showed the equation, estimated by OLS regression. The equation comprises both an additive constant (k0), and 36 individual coefficients.

Binary Response Variable = k0 + k1(A1) + k2(A2) … k36(F6).

Table 2 shows the parameters of the equations, first estimated for all vignettes evaluated by the total panel, and then estimated for all vignettes evaluated by respondents assigned to MS1, and then respondents assigned to MS2. Table 2 shows only the positive coefficients. To show all coefficients (viz., 36 for each subgroup) overwhelms the reader, and prevents patterns from emerging clearly. Neither zero coefficient nor negative coefficients teach us as much as do the positive coefficients.

Table 2: Performance of the strong performing elements by Total Panel and by the two larger mind-sets.

table 2

The parameters are interpreted as follows:

Additive constant – This is the parameter k0. The additive constant is the expect proportion of responses of value 7, 8, or 9 in the absence of elements. By design, all vignettes comprised three or four elements, so no vignettes ever comprised zero elements. The additive constant can be estimated, however, and represents the ‘baseline’ interest in using the airline, in the absence of any additional information. A simile is a statue. The additive constant is the base of the statue.

The elements, in turn, are the additive or subtractive values. We do not show the negative coefficients, which would subtract from the additive constant. We do show the positive coefficients because they are the more important for understanding the nature of the respondent’s thinking.

Table 2 shows a low additive constant, values 21-22, meaning that in the absence of elements (a theoretical situation, as noted above), we expected only one in five ratings to be ‘use the airline.’ It will be the elements, especially those with high coefficients, which drive the choice. These are the elements which ‘perform strongly.’ The operational definition of ‘perform strongly’ is a coefficient of +8 or higher, corresponding to a ‘t’ statistic of about 2 or higher, and a probably of randomness of 0.05 or lower. These cut-off points are obtained by an analysis of variance of the regression model data from the total panel. The strong performing elements are shown as shaded cells.

The strong elements for each mind-set tell the story, whether travel efficiency (MS1) or travel as fun and adventure (MS2). The names for the mind-sets are the major contribution in the interpretation. The creation of the elements requires critical thinking. The mind-sets themselves, however, emerge without any input from the researcher, other than being named.

The elements in Table 2 sorted by strongest to weakest, first by those elements which perform strongly among both mind-sets, then those elements which perform strongly among Mind-Set 1 (valuing travel efficiency (business travelers)), and then those elements which perform strongly among Mind-Set 2 (valuing travel as fun (leisure travelers)).

The data suggest strong performing elements, some performing well in both mind-sets. Two elements should not surprise, one dealing with price, the other with comfort:

When joining out club your 1st flight is 9 Dollars!

Extra legroom with your seat

One element has virtually no appeal at all

Baby Formula available on menu for nursing mothers

It is important to emphasize at this point that what seems obvious, namely the two different groups of respondents appear to emerge seamlessly, is in fact not so obvious at all. Consider, for example, another way to divide the respondents, viz., by gender. Table 3 shows radical differences between genders in their responses to the elements. The genders differ in terms of the elements which score highly. Yet, there is no clear story which summarizes the differences between the genders regarding the elements which perform strongly.

Table 3: Performance of the elements by Total Panel and by gender.

table 3

Step 7: Link Emotions to Elements

Question #2 required the respondent to select a single emotion/feeling to describe how the respondent felt after reading vignette. As described above, we can link the elements to each emotion/feeling by creating five new variables, as well as two summary variables (positive, negative)

The ordinary least-squares equation fits the same type of equation as we have seen above, without, however, the additive constant. In these analyses, coefficients of 10 or higher, are operationally considered to be strong.

We get a sense of the linkages for the Total Panel from Table 4. The Summary linkages suggest five strong linkages with positive emotions (comfortable, confident, and curious):

Table 4: Linkage of elements with emotions. Data from the Total Panel. Strong linkages of 10 or higher are shown in by the shaded cells.

table 4

When joining our club your 1st flight is 9 Dollars!

Extra carry-on bags….No extra charge when choosing our airline

Wider seats in both coach and first-class sections

Extra legroom with your seat

Comfy leather seats.

The summary also suggests five strong linkages to negative feelings/emotions (anxious, indifferent)

Private area for nursing infants

Baby Formula available on menu for nursing mothers

Book flights through our NEW mobile app

Mobile app reminds you of your flight 24 hours before boarding

Unlimited in-flight shopping with payment options available

It is important to recognize the potential power of linking elements to emotions. Knowing the linkage of an element with an emotion gives a sense of why the element performs the way it does and may increase the ability to fine tune the message to eliminate the negative feeling/emotion.

Step 8: Generalize the Results by Assigning a NEW PERSON to One of the Two Mind-sets

The data presented here provides an in-depth look at responses to offerings of amenities by airlines. The effort to create the study is relatively small; a day or even less should suffice to pick the topic, discuss the questions, select the answers, and run the study on the internet with 100-200 respondents. The newer versions, with four questions and four elements are even faster. The time for running the experiment is also short; 17-20 minutes for a panel or group of 50-100 people, who can run the study on the internet. Finally, the data analysis is automatic, with the researching getting the report within 1-2 minutes after the study is completed.

The issue is not the study, but rather the generalizability of the results, and the use of the data, both for knowledge-building and for direct marketing. Studies using 50-100 respondents can be set up and executed quickly, especially within the ‘new’ framework of 4×4, viz., four questions, each with four answers. The templated approach (www.BimiLeap.com) makes that effort simple. Yet, at the end of the single Mind Genomics experiment or iterated set of experiments, there is still the need to ‘use’ the data to solve real-world issues, perhaps involving hundreds, thousands, or even millions of people. How then can the researcher generalize the results?

A great deal of ‘foundational research’ regarding attitudes works from the top down, identifying general patterns of responses, so-called personas, which are akin to the mind-sets, but usually for a broader topic area, such as travel in general [15,16]. The objective of the research is to assign a new person to one of these general personas, and then attempt to offer that ‘persona’ (and thus the individual) the appropriate message. The effort is cumbersome, expensive, open to a great deal of interpretation. All too often the effort ends up with the researcher and the marketer ‘guessing’ what to communicate to and what to offer to each persona, viz., each overarching general ‘mind-set.’ The personas may be clear as general descriptions, but the descent from the general to the particular remains a stumbling block. That is, knowing the ‘general’ does not automatically mean knowing ‘the particular in this instance.’

Mind Genomics approaches the problem in a different fashion. Mind Genomics works at the granular level, from the bottom up, remaining in the granular. Here, the granular comprises the relevant, limited aspects of travel, represented by 36 different, concrete ideas, ideas which can be instantiated in specific actions. The emergent mind-sets are quite different from each other. Time after time, these mind-sets emerge as the key to both to better understand the customer, and to better put that understanding into action.

The focus on granularity has led to a simple, virtually algorithmic approach which assigns new people to the appropriate mind-set. The data from the mind-sets (Table 2) prescribe the appropriate messages. During the past several years, authors Gere and Moskowitz have developed the PVI, the personal viewpoint identifier. The PVI comprises a set of six specific statements, taken from the set of statements shown in Table 2. The statements are those which best differentiate among two or three mind-sets, when artificial and disturbing ‘noise’ or random variability in inserted into the data table, in a so-called Monte Carlo simulation [17]. The PVI works by creating six questions (six elements from the study), each rated on a two-point scale. The pattern of responses to the six questions generates the information need to assign a person to one of the two (or three) emergent mind-sets, discovered through the Mind Genomics experiment.

The PVI set-up is templated and uses the Mind Genomics output. Table 5 shows the set-up section for the PVI. Not shown are the inputs for the three optional questions about why the PVI respondent travels, and the full set of data from which the PVI will created the algorithm to assign the respondent to a mind-set.

Table 5: The first part of the set-up for the PVI template.

  Question Text Mindset1 Mindset2 Mindset3
  Air1-2021      
1 Mind Set Name MS1 Organized MS2 Fun  
2 Mind Set Feedback Look at flight to be organized, safe, efficient Look at flight as fun and adventure  
3 Mindset Page Possible Links Possible Links  
4 Mindset Video Possible Links Possible Links  
5 Question to be asked in the PVI (High Anchor) Seriously consider the airline (Low Anchor) Not a good enough offer  

Table 5 shows the five initial steps requiring judgment. This information is not automatically provided by the PVI algorithm.

1. The first step requires the researcher to provide the names for the mind-sets.

2. The second step requires the researcher to provide feedback to the respondent who fills out the PVI, with the feedback sent in an email, as well as placed into a database. Respondents are not only interested in the mind-set to which they belong, but want to know about their mind-set, and the other mind-sets.

3. The third step, an optional one, allows the researcher to drive the respondent to a landing page, based upon the mind-set to which the respondent has just been assigned.

4. The fourth step, also optional, optional one, allows the researcher to drive the respondent to a video, based upon the mind-set to which the respondent has just been assigned. Either the respondent is guided to a landing page, to a video, or neither.

5. The fifth step shows the two questions to be used when the respondent rates each of the six elements in the PVI.

Figure 2 shows the actual PVI created for this study from the viewpoint of what the respondent receives to complete. The PVI link is shown below, and is current as of Spring, 2021.

fig 2

Figure 2: The PVI screen as the respondent see it.

https://www.pvi360.com/TypingToolPage.aspx?projectid=1271&userid=2018

The PVI begins with a short orientation about the project, and then requests the respondent to answer several background questions, such as age, gender, etc.

The second part of the PVI comprises three questions about the respondent as a flier (viz., frequency, reason for flight, passenger class).

The third part of the PVI presents six questions, and the two answers. The order of these six questions varies from respondent to respondent. The pattern of answers assigns a respondent to one of the two mind-sets.

The respondent who participates in the PVI questionnaire devotes approximately 60-90 seconds to the study. The objective is to identify WHO the respondent is, WHAT the respondent thinks or does, and then the mind-set to which the respondent BELONGS. This knowledge can be used to understand what to offer to the person through a designated landing page or video ‘fine-tuned’ to the mind-set, or to understand the mind-sets of people in different populations regarding the topic. It is important to keep in mind that once the mind-set is determined, the data can be used to select the precise words to use in advertising, or for research.

The feedback emerging from the study might well be incorporated into the landing page or video, to which the newly ‘mind-typed’ respondent is directed as part of the search process. The prospect, no longer a respondent in the PVI, would be led to one of the two different landing pages or videos, constructed according to Figures 3 or 4, respectively.

Discussion and Conclusions

fig 3

Figure 3: The structure of information for the landing page or video: Mind-Set 1: Business Travelers.

fig 4

Figure 4: The structure of information for the landing page or video: Mind-Set 2: Leisure Travelers.

As presented here, the Mind Genomics method provides a fast, easy to use, inexpensive  knowledge creation and knowledge deployment system. The worldview of Mind Genomics differs from the worldview of applied research in that the data can be archived and directly integrated in a bigger database. The coefficients have ratio-scale properties (a 20 is twice as much as a 10), the coefficients are scale-independent since they come from a binary transform, and the coefficients can be stored for comparison across years, topics, and even disciplines. In a sense, the coefficients comprise the basis of a ‘wiki of the mind’.

The important thing to keep in mind is that the data are cognitively rich, and self-evident. That is, there is no tortuous experiment to tease out the way ‘nature works.’ The patterns emerge quite simply. The patterns which emerge are either meaningful or not meaningful. Mind Genomics simply restructures parts of everyday life, giving the information a numerical value based upon the linkage with either a rating question, or an emotion. Instead of those questions, the questions can deal with price, with occasion, and so forth, in which case the results emerging from the cartography would provide the foundation for a ‘cognitive economics,’ or ‘cognitive anthropology.’ Finally, the ability to mind-type many people on many mind-sets provides a unique opportunity to create a true ‘wiki of the mind’, linked with actual people, so that one may understand more fully how the ‘mind type’ manifests itself in the behavior of the everyday.

Acknowledgment

Attila Gere thanks the support of the Premium Postdoctoral Researcher Program of the Hungarian Academy of Sciences.

The authors wish to thank the late Steven Onufrey, Ms. Janna Kaminsky, and Prof. Martin Braun of Queens College for their help on this project, in Mathematics 101, Queens College of the City University of New York.

References

  1. Neuburger L, Egger R (2020) Travel risk perception and travel behaviour during the COVID-19 pandemic 2020: a case study of the DACH region. Current Issues in Tourism 1-14.
  2. Nicola M, Alsafi Z, Sohrabi C, Kerwan A, Al-Jabir A et al. (2020) The socio-economic implications of the coronavirus pandemic (COVID-19): A review. International Journal of Surgery 78: 185-193.
  3. Wilson ME, Chen LH (2020) Re-starting travel in the era of COVID-19: preparing anew. Journal of Travel Medicine 27: 108.
  4. Choi K, Wang Y, Sparks B (2019) Travel app users’ continued use intentions: it’sa matter of value and trust. Journal of Travel & Tourism Marketing 36: 131-143.
  5. Lu J, Mao Z, Wang M, Hu L (2015) Goodbye maps, hello apps? Exploring the influential determinants of travel app adoption. Current issues in Tourism 18: 1059-1079.
  6. Cheyne J, Downes M, Legg S (2006) Travel agent vs internet: What influences travel consumer choices? Journal of Vacation Marketing 12: 41-57.
  7. Andrade EB, Ariely D (2009) The enduring impact of transient emotions on decision making. Organizational Behavior and Human Decision Processes 109: 1-8.
  8. Levin LA, Langer KM, Clark DG, Colquhoun TA, Callaway JL et al. (2012) Using mind genomics® to identify essential elements of a flower product. Horticultural Science 47: 1658-1665.
  9. Moskowitz H, Silcher M, Beckley J, Minkus-McKenna D, Mascuch T (2005) Sensory benefits, emotions and usage patterns for olives: using Internet-based conjoint analysis and segmentation to understand patterns of response. Food Quality and Preference 16: 369-382.
  10. Moskowitz HR (2012) ‘Mind genomics’: The experimental, inductive science of the ordinary, and its application to aspects of food and feeding. Physiology & Behavior 107: 606-613. [crossref]
  11. Wilkinson M (2013) Testing the null hypothesis: The forgotten legacy of Karl Popper? Journal of Sports Sciences 31: 919-920. [crossref]
  12. Baker BO, Hardyck CD, Petrinovich LF (1966) Weak measurements vs. strong statistics: An empirical critique of SS stevens’ proscriptions NN statistics. Educational and Psychological Measurement 26: 291-309.
  13. Joshi A, Kale S, Chandel S, Pal DK (2015) Likert scale: Explored and explained. Current Journal of Applied Science and Technology 396-403.
  14. Dubes, Richard, Anil K. Jain (1980) Clustering methodologies in exploratory data analysis. Advances in Computers 19: 113-228.
  15. Brower M (2017) Claritas (formerly Nielsen) Segmentation and Market Solutions. The Charleston Advisor 18: 15-20.
  16. Zhang Y, Mohammadian A (2006) An Exploratory Analysis of the Household Travel Behavior and Lifestyle Choices. Applications of Advanced Technology in Transportation 665-670.
  17. Rubinstein RY, Kroese DP (2016) Simulation and the Monte Carlo method. John Wiley & Sons 10.

Is the Rational Design of Viral Vaccines a Realistic Enterprise?

DOI: 10.31038/JCRM.2021421

Abstract

The development of molecular biology in the 20th century fostered the expectation that biology could be reduced to chemistry and this blurred the distinction between the chemical nature of antigen-antibody binding and the biological nature and capacity of the immune system to elicit the formation of neutralizing antibodies able to protect against viral pathogens. Belief in the rational design of viral vaccines is problematic because the complex notions of human rationality and of design are rarely described or defined accurately, which leads investigators to overestimate their capacity to solve inverse problems. Vaccinologists are often confronted with such problems which consist for instance in identifying what were the multiple biological causes in the past that give rise to a wanted beneficial result in the future, such as the absence of deleterious HIV infection in human elite controllers. In addition to the impossibility of investigating past immunological events by doing scientific experiments in the future, the common failure of rational vaccine design is also due to the fact that vaccinology is essentially an empirical science that needs to rely on the results of immunogenicity trials that must necessarily be based on trial-and-error experimentation rather than on bounded rationality.

Review

A scientific procedure is said to be rational if it is based on reason and accepted scientific theory and successful rational vaccine design in virology usually implies that researchers are expected to be able to predict the outcome of an immunization process aimed at inducing the production of neutralizing antibodies (Abs) that abolish the infectivity of a viral pathogen. The concept of structure-based vaccine design is derived from rational drug design which relies on knowledge of the 3D structure of a biologically active target molecule in order to discover candidate molecules that will bind with high activity and selectivity to the target and abolish its biological activity [1]. Such computer-assisted strategies based on structural bioinformatics and molecular docking are usually considered to be superior to the empirical screening and trial-and error approaches commonly used in the past [2,3] although they mostly failed when they were applied to the rational design of viral vaccines. The reason for this is that vaccinologists mostly tried to improve the antigenic binding capacity of their candidate viral immunogens instead of investigating whether superior immunogens could be designed that would be able to generate protective Abs in vaccinees [4-7]. Improving immunogenicity would have required an investigation of the numerous factors, extrinsic to chemical epitope-paratope recognition, that control the biological capacity of human immune systems for eliciting the induction of protective antibodies which depend on the Ab gene repertoire and antigen processing ability of the host, the specificity of helper and suppressive immune cells and various other immunoregulatory mechanisms. Even when a vaccine has been “designed” on the basis of computer-based predictions, there is in fact no guarantee that it will necessarily be able to induce protective Abs if it has not been tested empirically in the human biological context in which it is expected to be effective. The remarkable development of molecular biology in the 20th century did foster the expectation that all biological phenomena may eventually be understood by reducing biology to chemistry and such reductionist thinking did blur the distinction between the chemical nature of antigen-antibody binding and the biological nature of the capacity of immune systems to elicit the production of neutralizing Abs. The structure-based reverse vaccinology (SBRV) approach introduced by Burton [8] was based on a confusion between antigenicity and immunogenicity which led many vaccinologists to expect that if a structurally defined HIV epitope was able to bind strongly to a broadly neutralizing monoclonal Ab, this epitope would also be able to induce similar neutralizing Abs in a vaccinated human host [9]. However, all Abs are both polyspecific (i.e. they always contain a variety of different paratopes) as well as heterospecific (i.e. they are able to react more strongly with other antigens than with the one that was used in the immunization process that elicited the Ab); these properties explain why the antigenic and immunogenic properties of proteins are often located in different regions of the molecule which is the reason why immunogenicity is not necessarily accompanied by an antigenic reactivity of the immunogenic epitope that would allow it to bind to the induced Ab [10]. Many vaccinologists are not aware that most problems they need to solve are so-called inverse problems. Solving inverse problems consists in proposing a theory that is able to explain the multiple past causes that produced an observed beneficial effect, for instance the absence of deleterious HIV infection in elite controllers [11]. An inverse problem thus starts with a result and requires that the investigator must try to imagine what are the multiple causes that could have produced it. Since scientific experimentation cannot investigate past events, it is necessary to develop a theoretical model of HIV immunity that could account for what has been observed and then to demonstrate that what the model predicts actually does occur. Since the human immune system is extremely complex and consists of numerous subsystems that are currently only poorly understood, it has been impossible to solve the numerous inverse problems posed by each subsystem and to develop plausible models that could be tested experimentally. In the absence of testable hypotheses, the only alternative was to rely on trial-and-error investigations which are the classical tools that have been used by vaccine developers in the past. These consist in selecting plausible vaccine candidates as well as appropriate vaccine formulations, schedules, adjuvants and routes of administration and testing these empirically since there was no knowledge of how the immune system induces the formation of neutralizing rather than non-neutralizing Abs.

Burton and Topol [12] have argued that since HIV infection elicits in patients broadly neutralizing Abs that recognize many HIV strains, it should in principle be possible to design an HIV vaccine, although they acknowledged that investigators would have to know how the immune system is able to induce neutralizing antibodies! This self-evident truth regarding the consequences of our ignorance of the mechanism of neutralizing Ab induction is of course one of the main reasons why the rational design of an HIV vaccine did not succeed although many other reasons for this failure have been well documented [7,13]. Burton and Topol [12] nevertheless stated that a rationally designed HIV vaccine may perhaps only be a decade away. They also suggested that rational vaccine design could be successfully applied to a virus like SARS-CoV-2 and that a pan-virus vaccine able to protect against more severe and antigenically distinct coronavirus variants that could appear during any epidemic, may in future be obtained by rational design, even before such variants had emerged or had caused considerable damage. They envisaged that this could be achieved by investing hundreds of millions of $ for stockpiling enormous quantities of vaccines for future use although they did not clarify which rational design strategies would make it possible to produce effective vaccines against new viruses of unknown pathogenicity.

In fact, rational vaccine design is actually problematic for two reasons that are linked to the concepts of both rationality and of design. The economist and Nobel laureate Herbert Simon introduced the notion of “bounded rationality” to explain the intrinsic limitations of human cognition and rationality that are due to the many unavoidable constraints that always limit the ability of humans to achieve a complete analysis of complex systems [14]. Such limitations exist because our information is always insufficient or inaccurate, we have limited time and resources for investigating the countless numbers of interacting components in any complex biological or immunological system and we cannot reach entirely rational decisions that would require a complete knowledge of all the relevant parameters. Instead of guaranteeing that a correct solution to complex problems can be reached, bounded rationality inevitably forces us to make tentative decisions that always remain uncertain.

Physicists and chemists used to believe that the universe was ruled by mathematical laws that would make it possible to predict the future behavior of a system if one had an intimate knowledge of all its initial conditions. However, in spite of our enormous modern computational power, we were actually unable the predict the 2008 world financial crisis and we also fail to be able to make long-term weather predictions. Chaos theory has reconciled us with the reality that extremely small differences in the initial conditions of a dynamic biological complex system prevents us from making accurate predictions about its future state [15,16].

The concept of design which implies the deliberate and intentional conceiving of an artificial, novel object or process by an intelligent being is equally ambiguous.

Adepts of so-called “intelligent design” for instance argue that a mythical, intelligent deity is responsible for having designed all living forms on our planet according to a preconceived plan and they do not accept that evolution took place through the filter and pressure of Darwinian natural selection. The design metaphor is also equally inappropriate for explaining the evolution of living organisms on earth as it is for describing the activity of scientists when they try to achieve a particular intentional goal in the form of a discovery or invention since their intentional design activities in most cases are not successful [6]. Intentional successful design remains as mysterious as the indispensable contributions of human imagination, intuition and talent that are needed for producing artistic as well as scientific creations and success is not obtained by simply following the numerous steps of a design procedure as if they were the obvious rules of a conceptual recipe book.

The popular paradigms of rational design and reductionism led many HIV vaccinologists to assume that the detailed structural knowledge of HIV spikes would allow them to design complementary binding antigens capable of inducing neutralizing Abs by vaccination [7]. This strategy failed because it was not appreciated that the structures observed in HIV complexes of spikes bound to Abs resulted from a process of mutually induced fit between the two partners and did not correspond to the structures present in the free, mobile and frequently disordered partners before they had interacted. For instance, the HIV-1 p17 matrix protein possesses an intrinsic protein disorder of 70% that reverberates across the viral membrane and produces a shell disorder that prevents the HIV immunogens used as vaccine from inducing a protective immune response [13,17]. It is well-known that although segmental mobility in proteins does enhance the binding capacity of epitopes and paratopes, extreme disorder in a protein antigen on the other hand can prevent antigen recognition and vaccine effectiveness [18].

The common failure of rational vaccine design is in line with the well-known fact that vaccinology is essentially an empirical science that relies more on trial-and-error experimentation than on available fundamental scientific knowledge of immunological phenomena. As emphasized by Hacking [19] in his book Representing and Intervening, we need to interfere with the material world (for instance immune systems) in order to obtain knowledge about it and our understanding increases when we are able to intervene successfully in it, for instance by achieving protective immunity by immunization. An understanding of the immune system is thus achieved because of a prior successful intervention and effective vaccines have often been obtained empirically in the past even before their mode of action had been elucidated. During the last ten years innumerable unsuccessful attempts have tried to identify which series of successive HIV immunogens should be used in a vaccine in order to mimic the Ab maturation pathway that is required for eliciting neutralizing protective Abs [20,21].

Since we know very little about which features of human immune systems regulate the production of protective antibodies, it seems evident that empirical vaccination trials will remain a prerequisite for developing effective vaccines against HIV and many other viral pathogens.

References

  1. Kuntz ID (1992) Structure-based strategies for drug design and discovery. Science 257: 1078-1082. [crossref]
  2. Amzel LM (1998) Structure-based drug design. Curr Opin Biotechnol 9: 366-369. [crossref]
  3. Bramwell VW, Perrie Y (2005) The rational design of vaccines. Drug Discov Tod 10: 1527-1534. [crossref]
  4. Douek DC, Kwong PD, Nabel GJ (2006) The rational design of an AIDS vaccine. Cell 124: 677-681.
  5. Walker LM, Burton DR (2010) Rational antibody-based HIV-1 vaccine design: Current approaches and future directions. Curr Opin Immunol 22: 358-366. [crossref]
  6. Van Regenmortel MHV (2016) Structure-based reverse vaccinology failed in the case of HIV because it disregarded accepted immunological theory. Int J Mol Sci 17: 1591-1625. [crossref]
  7. Van Regenmortel MHV (2019) HIV/AIDS: Immunochemistry, Reductionism and Vaccine Design: A Review of 20 Years of Research. Springer Nature Switzerland AG 364.
  8. Burton DR (2002) Antibodies, viruses and vaccines. Nat Rev Immunol 2: 706-713. [crossref]
  9. Van Regenmortel MHV (2012) Basic research in HIV vaccinology is hampered by reductionist thinking. Front. Immunol 3: 194. [crossref]
  10. Van Regenmortel MHV (2014) Specificity, polyspecificity, and heterospecificity of antibody-antigen recognition. J Mol Recognit 27: 627-639. [crossref]
  11. Van Regenmortel MHV (2018) Viral species, viral genomes and HIV vaccine design: is the rational design of biological complexity a utopia? Arch Virol 163: 2047-2054. [crossref]
  12. Burton DR, Topol EJ (2021) Variant -proof vaccines – Invest now for the next pandemic. Nature 590: 386-388.
  13. Van Regenmortel MHV (2020) What does it mean to develop an HIV vaccine by rational design? Arch Virol 166: 27-33.
  14. Simon H (1996) The Sciences of the Artificial. 3rd ed. Cambridge, MA: MIT
  15. Du Sautoy M (2016) What we Cannot Know. Harper Collins Publishers 36-73
  16. Green S (2015) Can biological complexity be reverse engineered? Stud Hist Philos Biol Biomed Sci 53: 73-83. [crossref]
  17. Goh GK, Dunker AK, Foster JA, Uversky VN (2019) HIV vaccine mystery and viral shell disorder. Biomolecules 9(5):178. [crossref]
  18. Uversky VN, Van Regenmortel MHV (2020) Mobility and disorder in antibody and antigen binding sites do not prevent immunochemical recognition. Crit Rev Biochem and Mol Biol
  19. Hacking, I (1983) Representing and Intervening. Cambridge University Press: Princeton, NJ, USA 1-304.
  20. Van Regenmortel MHV (2018) Development of a preventive HIV vaccine requires solving inverse problems which is unattainable by rational vaccine design. Front Immunol 8 :2009 [crossref]
  21. Uversky VN (2021) On the irrationality of rational design of an HIV vaccine in light of protein disorder. Arch Virol, [crossref]