Archives

fig 1

Evaluation of Bone Regeneration Efficacy in a Rabbit Model of Femoral Condyles Defect by Polyphenols-Containing Bone Filler

DOI: 10.31038/JDMR.2020334

Abstract

The purpose of this study was to evaluate the local biological effects and bone regeneration efficacy of a polyphenols-enriched ceramic bone filler. To this end, a test article (NBR_Purple) a biphasic phosphate ceramic plus polyphenols from grape pomace and the same material without polypohenols (NBR_White), were implanted in the medial condyle of the femur bone of rabbits for 56 days. A control article of clinical use (Ostim ®), was implanted as the first control condition. There was a second control by performing the same defect at the same location but without any implanted material (void condition). Histological examination at the end of the test period shows statistically significant improvement of bone regeneration by the polyphenol-enriched material over the same material without polyphenols, supporting literature data on the involvement of polyphenol molecules in bone regeneration pathways.

Keywords

Bone filler, Polyphenols, In vivo test, Osteointegration, Histology

Introduction

Replacement of bone loss or reconstruction of bone defect is still a clinical challenge. Different type of bone substitutes are used in clinical practice for treating bone defect caused by trauma, osteoporosis or dental pathology such as periodontitis [1,2]. The mode of action of the biomaterials available on the market mainly relies on mechanical support and is thus limited to providing a functional scaffold for cell adhesion. Synthetic bone fillers, mostly based on calcium phosphate materials, have been widely used due to their good reproducibility, biocompatibility, non-immunogenicity, and also because they offer the opportunity of advanced material engineering [3,4]. Hydroxyapatite (HA) and β-tricalcium phosphate (β-TCP) are widely used in bone tissue engineering as bone filler particles [5,6].

Polyphenols are chemical compounds synthetized by plants, widely diffused in the vegetable kingdom. They exert a defense action. Grape is among fruits which contain high quantity of polyphenols, in particular red grape [7,8]. The involvement of different classes of polyphenols in molecular pathways that can involve the regeneration of bone tissue is widely studied [9-13]. A role for polyphenols in the local control of inflammatory diseases leading to bone loss, such as periodontitis or osteoporosis, has been discussed in the literature [14-23]. Coupling of polyphenols to ceramic bone fillers could spawn a new generation of materials for bone regeneration, endowed with mechanical support and biological stimulation properties. In this work we describe the in vivo outcomes of a calcium phosphate bone filler containing polyphenols from red grape pomace, implanted for 56 days in the medial condyle of the femur bone of rabbits, showing that the presence of polyphenols enhances bone regeneration properties of the biomaterial.

Materials

All chemicals were analytical-reagent grade and were purchased from Sigma-Aldrich. Red grape pomace was purchased from a local winery producer (Croatina grape from ALEMAT, Penango, AT, Italy). Ultra-pure (MilliQ) water was used for the preparation of aqueous solutions. Commercially available bone filler Ostim ® has been purchased on the market.

NBR_White

HA was used for enhancing the mechanical strength of scaffold, whereas β-TCP for its degradability; they were mixed in a percentage of 50 wt.%, respectively, to reach an optimum compromise between the two properties. The ceramic scaffolds were prepared by mixing HA and β-TCP powders (47 wt.%) with a binding agent (poly (vinyl alcohol), 3 wt.%), and ultrapure water (50 wt.%) to obtain a ceramic slurry. Dolapix CE 64 was added as a dispersing agent (1 wt.% of the solid load). The polyurethane (PU) sponge impregnation method was used to obtain a macroporous ceramic scaffold [24,25]. A commercial PU sponge slab (45 ppi) of 200 x 200 x 10 mm3 was soaked into the ceramic slurry for 90 s, followed by compression along the transverse plane (40 kPa) and left at room temperature for 5 min before repeating the cycle. Impregnation/compression cycles were repeated for 3 times. The ceramic-coated PU sponge was left to dry overnight at 37°C and sintered in a furnace at 1100°C for 12 h in air (heating rate 5°C/min), in order to obtain a porous HA/βTCP slab of 200 x 200 x 10 mm3 (a volumetric retention of 24 % was calculated). The obtained porous slab was grinded by a jaw crusher (BB 50, Retsch) and sieved in order to obtain a 300 μm – 1000 μm porous grained granulate (ceramic granulate, CG). To make the material injectable, the obtained particles were mixed with a 0.5 % v/v solution of Collagen from porcine source in a rate of 90:10 granulate:collagen solution.

Preparation of Polyphenols Rich Pomace Extract

Croatina grape pomace was received in dry form from the producer and stored at -20°C under vacuum until the beginning of the extraction process. In order to make them suitable for the extraction process, grape pomace were first washed with acidified water, dried in a circulating-air oven (37°C ± 5°C) and grinded in a bladed mill (GM 200, Retsch). The milled grape pomace (300 g) were extracted in 2000 mL of 50:50 acetone:water (v/v) by using an automatic extractor (TIMATIC Micro C). The extraction cycle is fully automatic and alternates a dynamic phase, performed at a programmed pressure, and a static phase in which a forced percolation is generated, which, thanks to the programmable recirculation, ensures a continuous flow of solvent to the interior of the plant matrix thus avoiding over-saturation. Next, the extracted solution was concentrated under reduced pressure in a rotavap and maintained in fridge between 2-4°C. Full characterization of the polyphenols enriched extracts is provided in reference [26]. As reported in the just quoted paper, main identified components include gallic acid (9.42 µg/ml), caffeic acid (1.59 µg/ml), cumaric acid (0.21 µg/ml), quercetin (2.06 µg/ml), rutin (0.19 µg/ml), malvidin-3-glucoside (37.2 µg/ml). This deeply purple-stained croatina grape pomace extract shows a total anthocyanin content of 446.7 µg/ml [26].

NBR_Purple

NBR_Purple was produced by soaking the ceramic granulate with the Polyphenols rich pomace extract in a percentage of 40 % and 60 % respectively, followed by a 24 h of evaporation process which allows the ceramic granulate to be enriched with the polyphenol molecules (Pph). Then, the ceramic granulate functionalized with polyphenols were mixed with 0.5 % v/v collagen solution from porcine source, in the ratio 90:10, to make the material injectable.

Study Design

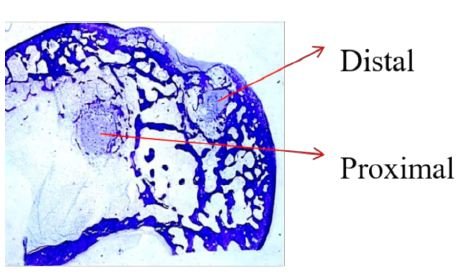
Review and approval by the Ethical Committee of the Universidad Politécnica de Valencia were obtained prior to conduct of the study. For each rabbit, one defect measuring approximately 2 mm x 5 mm deep was created in each medial condyle at a distal position of the femur. A second defect measuring approximately 2 mm x 10 mm deep was created in each medial condyle at a proximal location of the femur (Figure 1). For that reason, each animal had four defect sites, two on each medial condyle. Three different materials and a void were implanted on each animal. The response of NBR_Purple material (test article) was compared to NBR_White (control article), Ostim® and void. Ostim® is a synthetic nanocrystalline HA bone graft, containing about 65% water and 35 % nanostructured HA particles. Evaluations were conducted at 56 days.

fig 1

Figure 1: Proximal and distal locations of bone defects at the medial condyle of rabbit femur.

This study had two end-goals:

    1. Evaluation of local biological effects after implantation based on the requirements of ISO 10993-6:2007 (Annex E) [27].
    2. Performance study by the analysis of % area occupied by trabecular bone.

Distribution of materials in distal and proximal sites at the right and left femoral condyle are reported in Table 1.

Table 1: Distribution of materials in distal and proximal sites.

Right condyle

Left condyle

Animal #

Cage # Distal Proximal Distal

Proximal

481 2 NBR_Purple NBR_White Ostim

Void

482

3 Void NBR_Purple NBR_White

Ostim

483

4 Ostim Void NBR_Purple NBR_White
484 5 NBR_White Ostim Void

NBR_Purple

486

7 Void NBR_Purple NBR_White Ostim
487 8 Ostim Void NBR_Purple

NBR_White

488

9 NBR_White Ostim Void NBR_Purple
489 10 NBR_Purple NBR_White Ostim

Void

Animal Test System

Eight New Zealand White rabbit were used for the study. Characteristics Of the animals are reported in Table 2. The rabbit is widely used for evaluation articles intended for clinical implantation. The medial condyle of the femur provides a cancellous bone site, which will mimic the bone sites of clinical use. The rabbit is a small common laboratory species with bones of sufficient size to provide meaningful data and it is accepted by ISO 10993-6:2007 as experimental animal [27]. Any response to the implanted article can be graded and compared to that of a control article.

Table 2: Test system characteristics.

Species Rabbit (Oryctolagus cuniculus)
Breed New Zealand White
Source ISOQUIMEN
Sex Female
Body Weight Range 3.6 kg to 4.0 kg at implantation
Age Approximately 20 weeks at implantation
Other conditions Nulliparous, skeletally mature
Acclimatation period 2 weeks at IBV animal facilities
Number of animals Eight
Identification method Ear tag and cage card

The rabbits were weighed. Pre-anaesthetic and anaesthetic procedures are described in Table 3. The analgesic protocol is described in Table 4. Each rabbit received an intramuscular injection of the antibiotic enrofloxacin at 10 mg/kg. After the anaesthetic had taken effect, rabbits were clipped free of fur over the lateral and medial aspects of the rear legs from the wing of the illium to the tarsus. The surgical sites were painted with povidone iodine and draped.

Table 3: Pre-anaesthetic and anaesthetic procedures.

Phase

Product Via Dosis [mg/kg]

Concentration [mg/mL]

Pre-anaesthesia

Xylazine Clorhydrate

IM 3.12

20

Pre-anaesthesia

Ketamine Clorhydrate

IM 17.5

100

Anaesthesia-Induction

Propofol

IV 3

1%

Anaesthesia-maintenance

Propofol

IV 21 mg/kg/h

1%

Table 4: Analgesic procedure.

Phase

Product

Via Dosis [mg/kg] Concentration [mg/mL]

Frequency

Pre-surgical

Butorphanol tartrate

IM 0.4 10

Once

Post-surgical immediate

Fluxin meqlumine

SC 1 50

Once

Post-surgical immediate

Butorphanol tartrate

IM 0.4 10

Once

Post-surgical deferred

Butorphanol tartrate

IM 0.4 10

3 days after surgery

Implantation Procedure

The surgical site was draped, using sterile technique, the medial aspect of the distal epiphysis of the femur over the medial condyle was exposed through a routine surgical approach. Following exposure of the bone, an initial first pilot hole was created, using a drill with an approximate 1 mm bit, centred between the distal border of the epiphysis and the insertion of the medial head of gastrocnemial muscle. Using a power drill with an approximate 2 mm drill bit, the hole was enlarged to approximately 2 mm in diameter. This distal defect had an approximate depth of 5 mm, which it was controlled with a depth gauge placed in the drill. The material was implanted following the distribution shown in Table 1. A second defect (proximal site) was created in a similar way approximately 2-3 mm away from the first implantation site. In this proximal site, the implanted material follows the distribution shown in Table 1. The proximal defect had an approximate depth of 10 mm. The articles were placed in the bone defect to fill the void and remain flush with the cortical surface. The fascia and subcuticular layer were closed with 4-0 absorbable suture and the skin was closed with an intradermal suture technique. The day of implantation was designated as Day 0. A similar procedure was followed to create the other two bone defects on the contralateral medial condyle. The materials were implanted following the distribution shown in Table 1. Two materials on each medial condyle and four materials per animal were implanted.

Each rabbit was moved to a recovery area and was monitored for recovery from anaesthetic. Once sternal recumbency was achieved, each rabbit was returned to its cage. Analgesic protocol is shown in Table 4.

Rabbit were observed daily for general health, especially at the incision site. Body weights were recorded for all animals prior to implantation, and weekly thereafter and prior to termination.

Terminal Procedures

At 56 days after implantation, the eight rabbits were euthanized. Rabbits were weighed and each rabbit was euthanized with an intravenous injection of sodium pentobarbital-based euthanasia solution. The bone implant sites and adjacent muscle tissue were examined macroscopically and the observations were recorded. Any adverse observations at the implant sites were described. Each femur was dissected free and removed. Femurs were cut as appropriate to allow the fixative (ethanol 70%) to penetrate the bone tissue for proper fixation.

Histological Procedures

Histological procedures based on undecalcified bone samples embedded in PMMA to be cut with rotary microtome are published elsewhere [28]. The defect sites with implants in place were removed by making transverse cuts through the bone proximal and distal to each implant site, taking care not to disturb the sites themselves. Each bone section was labelled to indicate its original location. From 4 to 7 slides for each block was prepared as a transverse section of the bone through the diameter of the defect and stained with toluidine blue at pH 3.5. The identity (animal number, left/right) of each bone section was maintained during processing. Each slide shows a transverse section of the medial condyle with both implantation sites (Figure 1).

The slides related to NBR_Purple and NBR_White were provided to a pathologist for the evaluation of local biological effects after implantation following the criteria described in Annex E of ISO 10993-6:2007 [27]. Six fields (400x magnification) were analysed for each of the slides, totalizing between 24 and 42 fields for the defects analysed of each independent specimen. The histological evaluation was done following standardized procedures of our laboratory. The quantification of the biological effects has been done following the instructions of the ISO 10993-6:2007 standard. In this study 16 different specimens corresponding to an epiphyseal section from both the left and right extremities of rabbit femur have been included. The specimens were toluidine blue‐stained.

Evaluation of Local Biological Effects

Microscopic analysis revealed two areas of interest in each of the specimens included one closer to the medullary canal (proximal region) and the other one localized further from that (distal region). In the bone defects, the testing biomaterials have been implanted. In some cases the defects were left empty to serve as control. The cavities have a spheroid shape and the diameter ranges from 1.10 to 4.28 mm. In the surgical entry, a thickening of fibrotic dense connective tissue could be observed, which in some cases presented biomaterial fragments, probably due to the surgical procedure. In these cases connective organized structures associated with these fragments could be observed. This connective tissue is characterized by fibroblasts and macrophages accumulation as well as by an increased vascularization.

NBR_Purple Material

NBR_Purple material was implanted in 8 specimens, 4 of them corresponding to right and 4 to left condyles. In 4 specimens the implant area is located in the proximal region, while in the other 4 in the distal region. Between 7 and 4 slides of each specimen were included in this study.

NBR_White Material

This biomaterial was implanted in 8 specimens, 4 corresponding to right and 4 to left condyles. In 4 specimens the biomaterial was implanted in the proximal region and in the other 4 in the distal region. 4‐6 slides for each of the specimens were included in this study. Quantitative analysis was performed at 400 x magnification in 6 representative fields of each of the slides included in the study.

Performance Study

Digital pictures were obtained with a video camera (Sony, Exwave HAD) attached to a macroscope (Wild, M420) with a resolution of 97.5 pixel/µm at 7.8 x magnification. The squared region of interest was defined as centred at the middle point of the implant and with a 4-mm side, which it is twice the size of the bone defect diameter. Image processing techniques based on mathematical morphology was implemented in programming macros to specifically threshold the trabecular bone to calculate % area occupied by this tissue [29,30] (ImageJ, 1.49d, Rasband, W.S., U. S. National Institutes of Health, Bethesda, Maryland, USA, http://imagej.nih.gov/ij/, 1997-2014). Five slides of every condyles (left and right) including all materials (NBR_Purple, NBR_White, Ostim, void) were studied.

Statistical Analysis

Statistical analysis of the % area occupied by trabecular bone was conducted. To perform means comparison the method employed is one-way analysis of means (not assuming equal variances) and the pairwise comparisons between materials using t tests with pooled standard deviations (R, version 2.15.1, The R Foundation for Statistical Computing). Statistical analysis of bone regeneration within the defect is presented as box plot. The box represent the 25 and 75 percentiles and the horizontal line in the box represents median value. Lines outside the box represent minimum and maximum values [31]. Average value is represented as a blue point.

Results

Macroscopic Observation

All animals gained weight over the course of the study. Eschar and skin lesions associated with the incision lines were observed for most incisions. These skin lesions were considered a common occurrence associated with surgery at this site in rabbits and did not represent any adverse reaction to the tested biomaterials (Table 5). In the weeks following the surgery, incision sites in all animals were perfectly closed and furs cover the waxed area. Only animal 481 on day 1 showed an opened end that needed a second suture following the standard suture procedure. In this case, skin wound evolution was also good. An antiseptic was applied to the sites to prevent any possible infection and all sites healed without further complications.

Table 5: Macroscopic observation.

Animal number

Left leg

Right leg

481 Implant site and muscle were macroscopically normal Implant site and muscle were macroscopically normal
482 Implant site and muscle were macroscopically normal Implant site and muscle were macroscopically normal
483 Implant site and muscle were macroscopically normal Implant site and muscle were macroscopically normal
484 Implant site and muscle were macroscopically normal Implant site and muscle were macroscopically normal
486 Implant site and muscle were macroscopically normal Implant site and muscle were macroscopically normal
487 Implant site and muscle were macroscopically normal Implant site and muscle were macroscopically normal
488 Implant site and muscle were macroscopically normal Implant site and muscle were macroscopically normal
489 Implant site and muscle were macroscopically normal Implant site and muscle were macroscopically normal

Microscopic Evaluation

Evaluation of Local Effects After Implantation

Osteointegration efficacy was evaluated implanting NBR_Purple material in the medial condyle of the femur bone of rabbits for 56 days. NBR_Purple was compared with a NBR_White bone filler, without polyphenols extract, and a commercial bone filler Ostim ®. At 56 days of implantation, a non-irritant response (index=0.0) was seen with the test (NBR_Purple) as compared to the control bone filler (NBR_White) following the comparison procedure proposed by Annex E, ISO 10993-6.

In Figure 2 are reported the percentage of area occupied by trabecular bone after 56 days of implantation, for NBR_Purple, NBR_White, Void and Ostim material, at distal site. NBR_Purple and Ostim showed the best results (42.9 ± 10.6 and 40.7 ± 5.9, respectively) followed by NBR_White (32.0 ± 9.2) and Void (28.3 ± 8.1). For NBR_Purple, there were significant differences with NBR_White and Void and there were no significant differences between NBR_Purple and Ostim (Tables 6 and 7).

fig 2

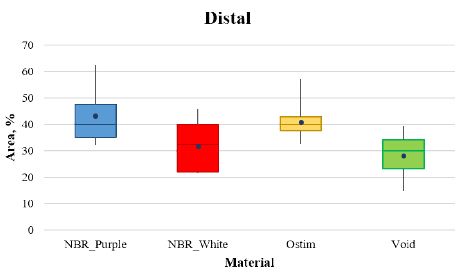
Figure 2: Box and whiskers plot of the four articles analysed at the distal site.

Table 6: Statistics descriptive at distal site.

Distal

Statistic Description

Material

Valid N

Minimum Maximum Mean

St. Dev.

NBR_Purple

22

32.11 62.48 42.92

10.65

Ostim

21

32.3 57.22 40.67

5.95

NBR_White

21

21.41 45.91 32.04

9.19

Void

20

14.47 39.51 28.28

8.15

Table 7: Pairwise comparison at distal site using t test with pooled standard deviation.

NBR_Purple

NBR_White

Ostim

NBR_White

< 0.001

Ostim

0.39773

0.00187

Void

< 0.001

0.16914

< 0.001

Figure 3 shows the percentage of area occupied by trabecular bone at proximal site, Ostim showed the best results (25.7 ± 10.6) followed by NBR_Purple (20.3 ± 10.1) and NBR_White (12.9 ± 2.2). Tables 8 and 9 report the statistical analysis among the bone filler.

fig 3

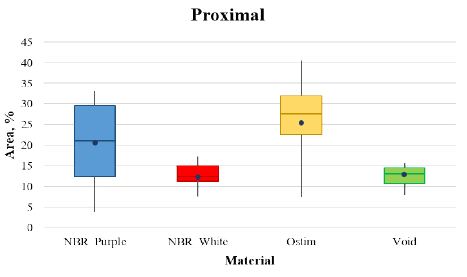
Figure 3: Box and whiskers plot of the four articles analysed at the proximal site.

Table 8: Statistics descriptive at proximal site.

Proximal

Statistic Description

Material

Valid N

Minimum Maximum Mean

St. Dev.

NBR_Purple

20

3.63 33.13 20.26

10.11

Ostim

21

7.35 40.52 25.73

10.62

NBR_White

20

7.43 17.40 12.92

2.88

Void

21

7.75 15.71 11.96

2.16

Table 9: Pairwise comparison at proximal site using t test with pooled standard deviation.

NBR_Purple

NBR_White

Ostim

NBR_White

0.00294

Ostim

0.02309

< 0.001

Void

< 0.001

0.68414

< 0.001

In all cases, higher value of area occupied by trabecular bone are observed at distal site by comparison with proximal site. This observation could be due as it is an area with more density of trabecular bone. Besides, proximal zone is very close to the beginning of the medullary canal and the dispersion of the material in this canal could be more frequent than expected.

Figure 4 reported the histological images for the specimens’ number 487I, NBR_Purple bone filler. An area of 3.20 mm of diameter with several new-formed spongy bone tissue could be observed. This tissue contained small and isolates biomaterial deposits. In some locations, fatty tissue and macrophages could be observed. Several bone-forming and bone-resorption cells could be observed (Figure 4A-4C).

fig 4

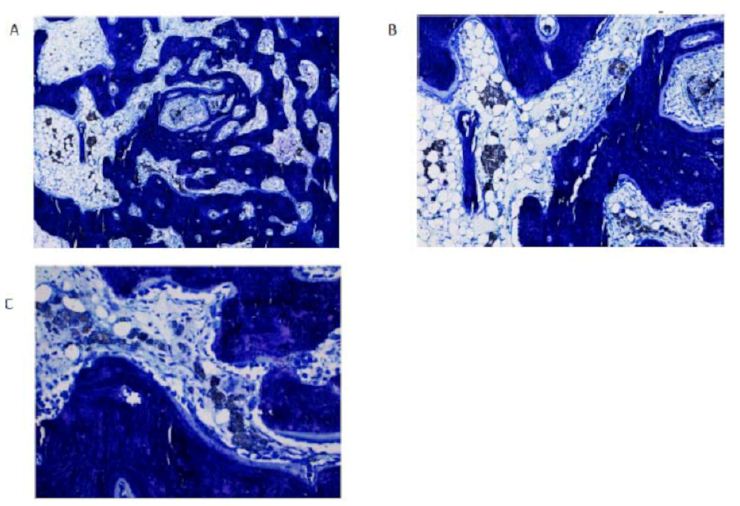
Figure 4: Histological section of NBR_Purple implanted in sample 487I.

The same sample, 487I, is represented in Figure 5 for NBR_White. Histological images of this sample presented a 3.40 mm diameter spheroid area with small biomaterial deposit surrounded by fatty tissue, which presented in some locations a moderate inflammatory infiltrate along with venous sinuses.

fig 5

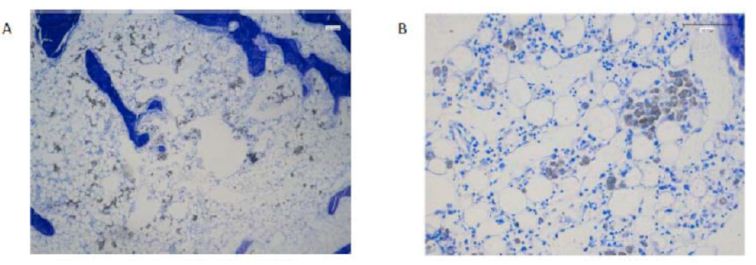
Figure 5: Histological section of NBR_White implantend in sample 487I.

Discussion

Polyphenols are attracting more and more attention in the field of bone regeneration thanks to their anti-oxidant and anti-inflammatory properties [15,32,33]. In particular, in the field of oral health, clinical evidence has shown that flavanoids have beneficial effect on periodontitis [17-19,34], an oral inflammatory disease of polymicrobial origin that causes the disruption of gingival connective tissue and the alveolar bone supporting the teeth. Commercially available bone filler materials work through a simple scaffolding effect, providing osteoconduction. The new approach involving the biomolecular modification of biomaterials aims at enhancing the host tissue response through biologically active molecules delivered from the device or linked to the device surface [35-38]. In this broad scenario, the use of polyphenols from different source is widely investigated [32,39-45]. Grape pomace is an interesting source of polyphenols, and polyphenols-rich pomace extract are of particular interest due to the heterogeneity of the mixture, which makes these extract extremely interesting, since it contains a large number of polyphenols classes. Potentially beneficial effects of polyphenols have been reported in various study. For example, cell biology and in vivo rodent model studies [34,46,47] have demonstrated that flavanoids regulated the inflammatory response in periodontal components, and preserve effects on periodontal ligaments and alveolar bone tissues [48]. Another class of polyphenols, proanthocyanidins, has been shown both in vitro and in vivo to have a protective effect against oxidative stress and periodontitis [15,49]. The role of polyphenols in molecular signalling mechanisms behind bone anabolism has been recently reviewed [50] and potentials of polyphenols in bone-implant devices have been described [51].

Based on existing literature evidences, in the present work, a polyphenols-rich pomace extract combined to a biphasic phosphate ceramic bone filler was tested in vivo and compared to the same material without polyphenols and a couple of other controls. The study demonstrates in vivo that the presence of polyphenols enhances the osteointegration of the calcium phosphate bone filler. The results show that there is an higher value of the area occupied by trabecular bone after 56 days by the bone filler with polyphenols (NBR_Purple) and the bone filler without polyphenols (NBR_White). These results, support the several studies that have investigated the ability of polyphenols to improve and maintain bone health, showing clear positive effects on bone regeneration.

Conclusion

The study here reported demonstrates that at 56 days after implantation at distal and proximal sites in rabbit femoral condyles, the polyphenols-enriched bone filler NBR_Purple shows higher value of trabecular bone regeneration than those of the same material without polyphenols NBR_White. Assuming that the trabecular bone regeneration in an empty defect (Void condition) could be considered as physiological trabecular bone regeneration after a bone defect creation, NBR_Purple showed a 1.5 times regeneration enhancement at distal site and 2.1 times regeneration enhancement at proximal site. Present in vivo data support the role of polyphenols molecules in the stimulation of bone regeneration mechanisms.

References

    1. Figueiredo M, Henriques J, Martins G, Guerra F, Judas F, et al. (2010) Physicochemical characterization of biomaterials commonly used in dentistry as bone substitutes – Comparison with human bone. J Biomed Mater Res – Part B Appl Biomater 2: 409-419. [crossref]
    2. Iviglia G, Kargozar S, Baino F (2019) Biomaterials, current strategies, and novel nano-technological approaches for periodontal regeneration. J Funct Biomater 1: 3. [crossref]
    3. Tadic D (2004) A thorough physicochemical characterisation of 14 calcium phosphate-based bone substitution materials in comparison to natural bone. Biomaterials 6: 987-994. [crossref]s
    4. Samavedi S, Whittington AR, Goldstein AS (2013) Calcium phosphate ceramics in bone tissue engineering: A review of properties and their influence on cell behavior. Acta Biomater 9: 8037-8045. [crossref]
    5. Iviglia G, Morra M, Cassinelli C, Torre E, Rodriguez Y, et al. (2018) New collagen-coated calcium phosphate synthetic bone filler (Synergoss®): A comparative surface analysis. Int J Appl Ceram Technol 4: 910-920.
    6. Zhang L, Hanagata N, Maeda M, Minowa T, Ikoma T, et al. (2009) Porous hydroxyapatite and biphasic calcium phosphate ceramics promote ectopic osteoblast differentiation from mesenchymal stem cells. Sci Technol Adv Mater 2: 025003.
    7. Cantos E, Espín JC, Tomás-Barberán FA (2002) Varietal differences among the polyphenol profiles of seven table grape cultivars studied by LC-DAD-MS-MS. J Agric Food Chem 20: 5691-5696. [crossref]
    8. Rothwell J, Pérez-Jiménez J, Neveu V, A M-R, N M, et al. (2013) Phenol-Explorer 3.0: a major update of the Phenol-Explorer database to incorporate data on the effects of food processing on polyphenol content. Database 2013: 070. [crossref]
    9. Yamaguchi M, Ma ZJ (2001) Effect of Polyphenols on Calcium Content and Alkaline Phosphatase Activity in Rat Femoral Tissues in Vitro. Biol Pharm Bull 12: 1437-1439. [crossref]
    10. Hämäläinen M, Nieminen R, Vuorela P, Heinonen M, Moilanen E (2007) Anti-inflammatory effects of flavonoids: Genistein, kaempferol, quercetin, and daidzein inhibit STAT-1 and NF-κB activations, whereas flavone, isorhamnetin, naringenin, and pelargonidin inhibit only NF-κB activation along with their inhibitory effect on iNOS expression and NO production in activated macrophages. Mediators Inflamm 2007: 45673. [crossref]
    11. Yamaguchi M, Arbiser JL, Weitzmann MN (2011) Honokiol stimulates osteoblastogenesis by suppressing NF-κB activation. Int J Mol Med 6: 1049-1053. [crossref]
    12. Prouillet C, Mazière JC, Mazière C, Wattel A, Brazier M, et al. (2004) Stimulatory effect of naturally occurring flavonols quercetin and kaempferol on alkaline phosphatase activity in MG-63 human osteoblasts through ERK and estrogen receptor pathway. Biochem Pharmacol 7: 1307-1313. [crossref]
    13. Miyake M, Arai N, Ushio S, Iwaki K, Ikeda M, et al. (2003) Promoting Effect of Kaempferol on the Differentiation and Mineralization of Murine Pre-osteoblastic Cell Line MC3T3-E1. Biosci Biotechnol Biochem 6: 1199-1205. [crossref]
    14. Govindaraj J, Emmadi P, Puvanakrishnan R (2010) In vitro studies on inhibitory effect of proanthocyanidins in modulation of neutrophils and macrophages. Indian J Biochem Biophys 3: 141-147.
    15. Govindaraj J, Emmadi P, Deepalakshmi, Rajaram V, Prakash G, et al. (2010) Protective effect of proanthocyanidins on endotoxin induced experimental periodontitis in rats. Indian J Exp Biol 2: 133-142. [crossref]
    16. Govindaraj J, Emmadi P, Puvanakrishnan R (2011) Therapeutic effects of proanthocyanidins on the pathogenesis of periodontitis–an overview. Indian J Exp Biol 2: 83-93. [crossref]
    17. Palaska I, Papathanasiou E, Theoharides TC (2013) Use of polyphenols in periodontal inflammation. Eur J Pharmacol 720: 77-83. [crossref]
    18. Leena Sankari S, Aravindha Babu N, Rani V, Priyadharsini C, Masthan KMK (2014) Flavonoids-Clinical effects and applications in dentistry: A review. J Pharm Bioallied Sci 1: 26-29.
    19. Bunte K, Hensel A, Beikler T (2019) Polyphenols in the prevention and treatment of periodontal disease: A systematic review of in vivo, ex vivo and in vitro studies. Fitoterapia: 30-39. [crossref]
    20. Shen C-L, Wang P, Guerrieri J, Yeh JK, Wang J-S (2008) Protective effect of green tea polyphenols on bone loss in middle-aged female rats. Osteoporos Int 7: 979-990. [crossref]
    21. Lee JH, Jin H, Shim HE, Kim HN, Ha H, et al. (2010) Epigallocatechin-3-gallate inhibits osteoclastogenesis by down-regulating c-Fos expression and suppressing the nuclear factor-kappaB signal. Mol Pharmacol 1: 17-25. [crossref]
    22. Nakamura H, Ukai T, Yoshimura A, Kozuka Y, Yoshioka H, et al. (2010) Green tea catechin inhibits lipopolysaccharide-induced bone resorption in vivo. J Periodontal Res 1: 23-30. [crossref]
    23. Gómez-Florit M, Monjo M, Ramis JM (2014) Identification of quercitrin as potential therapeutic agent for periodontal applications. J Periodontol 7: 966-974. [crossref]
    24. Vitale-Brovarone C, Baino F, Verné E (2009) High strength bioactive glass-ceramic scaffolds for bone regeneration. J Mater Sci Mater Med 2: 643-653. [crossref]
    25. Vitale-Brovarone C, Verné E, Robiglio L, Appendino P, Bassi F, et al. (2007) Development of glass-ceramic scaffolds for bone tissue engineering: characterisation, proliferation of human osteoblasts and nodule formation. Acta Biomater 2: 199-208. [crossref]
    26. Torre E, Iviglia G, Cassinelli C, Morra M, Russo N (2020) Polyphenols from grape pomace induce osteogenic differentiation in mesenchymal stem cells. Int J Mol Med 6: 1721-1734. [crossref]
    27. ISO/EN10993-6 (2007) Biological evaluation of medical devices – Part 6: Tests for local effects after implantation. Int Organ Stand.
    28. Peris Serra J, Prat Pastor J, Comín Clavijo M, Dejoz R, Roger I, et al. (1993) Técnica histológica para la inclusión en metilmetacrilato de muestras óseas no descalcificadas. Rev española cirugía Osteoartic 166: 231-238.
    29. Huber FX, Berger I, McArthur N, Huber C, Kock HP, et al. (2008) Evaluation of a novel nanocrystalline hydroxyapatite paste and a solid hydroxyapatite ceramic for the treatment of critical size bone defects (CSD) in rabbits. J Mater Sci Mater Med 1: 33-38. [crossref]
    30. Huber FX, McArthur N, Heimann L, Dingeldein E, Cavey H, et al. (2009) Evaluation of a novel nanocrystalline hydroxyapatite paste Ostim in comparison to Alpha-BSM – more bone ingrowth inside the implanted material with Ostim compared to Alpha BSM. BMC Musculoskelet Disord 10: 164. [crossref]
    31. Luo T, Wu C, Zhang Y (2012) The in vivo osteogenesis of Mg or Zr-modified silicate-based bioceramic spheres. J Biomed Mater Res – Part A 9: 2269-2277. [crossref]
    32. Córdoba A, Satué M, Gómez-Florit M, Hierro-Oliva M, Petzold C, et al. (2015) Flavonoid-modified surfaces: Multifunctional bioactive biomaterials with osteopromotive, anti-inflammatory, and anti-fibrotic potential. Adv Healthc Mater 4: 540-549. [crossref]
    33. Torre E (2017) Molecular signaling mechanisms behind polyphenol-induced bone anabolism. Phytochem Rev 6: 1183-1226. [crossref]
    34. Özden FO, Sakallioğlu EE, Sakallioğlu U, Ayas B, Erişgin Z (2017) Effects of grape seed extract on periodontal disease: An experimental study in rats. J Appl Oral Sci 2: 121-129. [crossref]
    35. Morra M (2007) Biomolecular modification of implant surfaces. Expert Rev Med Devices 3: 361-72. [crossref]
    36. Brett E, Flacco J, Blackshear C, Longaker MT, Wan DC (2017) Biomimetics of Bone Implants: The Regenerative Road. Biores Open Access 1: 1-6.
    37. Morra M, Cassinelli C, Torre E, Iviglia G (2018) Permanent wettability of a novel, nanoengineered, clinically available, hyaluronan-coated dental implant. Clin Exp Dent Res 5: 196-205.
    38. Bryers JD, Giachelli CM, Ratner BD (2012) Engineering biomaterials to integrate and heal: The biocompatibility paradigm shifts. Biotechnol Bioeng 8: 1898-1911. [crossref]
    39. Zhang X, Ferraris S, Prenesti E, Verné E (2013) Surface functionalization of bioactive glasses with natural molecules of biological significance, part II: Grafting of polyphenols extracted from grape skin. Appl Surf Sci : 341-348.
    40. Gomez-Florit M, Pacha-Olivenza MA, Fernández-Calderón MC, Córdoba A, González-Martín ML, et al. (2016) Quercitrin-nanocoated titanium surfaces favour gingival cells against oral bacteria. Sci Rep 1: 22444.
    41. Gómez-Florit M, Monjo M, Ramis JM (2015) Quercitrin for periodontal regeneration: effects on human gingival fibroblasts and mesenchymal stem cells. Sci Rep 5: 16593. [crossref]
    42. Cazzola M, Corazzari I, Prenesti E, Bertone E, Vernè E, et al. (2016) Bioactive glass coupling with natural polyphenols: Surface modification, bioactivity and anti-oxidant ability. Appl Surf Sci : 237-248.
    43. Cazzola M, Vernè E, Cochis A, Sorrentino R, Azzimonti B, et al. (2017) Bioactive glasses functionalized with polyphenols: in vitro interactions with healthy and cancerous osteoblast cells. J Mater Sci 15: 9211-9223.
    44. Cazzola M, Ferraris S, Boschetto F, Rondinella A, Marin E, et al. (2018) Green tea polyphenols coupled with a bioactive titanium alloy surface: In vitro characterization of osteoinductive behavior through a KUSA A1 cell study. Int J Mol Sci 8: 2255. [crossref]
    45. Tsuchiya S, Sugimoto K, Kamio H, Okabe K, Kuroda K, et al. (2018) Kaempferol-immobilized titanium dioxide promotes formation of new bone: Effects of loading methods on bone marrow stromal cell differentiation in vivo and in vitro. Int J Nanomedicine 13: 1665-1676. [crossref]
    46. Gennaro G, Claudino M, Cestari TM, Ceolin D, Germino P, et al. (2015) Green tea modulates cytokine expression in the periodontium and attenuates alveolar bone resorption in type 1 diabetic rats. PLoS One 8: 0134784. [crossref]
    47. Tominari T, Matsumoto C, Watanabe K, Hirata M, Grundler FMW, et al. (2015) Epigallocatechin gallate (EGCG) suppresses lipopolysaccharide-induced inflammatory bone resorption, and protects against alveolar bone loss in mice. FEBS Open Bio 5: 522-527. [crossref]
    48. Fernández-Rojas B, Gutiérrez-Venegas G (2018) Flavonoids exert multiple periodontic benefits including anti-inflammatory, periodontal ligament-supporting, and alveolar bone-preserving effects. Life Sci 209: 435-454. [crossref]
    49. Houde V, Grenier D, Chandad F (2006) Protective effects of grape seed proanthocyanidins against oxidative stress induced by lipopolysaccharides of periodontopathogens. J Periodontol 8: 1371-1379. [crossref]
    50. Torre E (2017) Molecular signaling mechanisms behind polyphenol-induced bone anabolism. Phytochem Rev 6: 1183-1226. [crossref]
    51. Torre E, Iviglia G, Cassinelli C, Morra M (2018) Potentials of polyphenols in bone-implant devices. In: Janica Wong, ed. Polyphenols. IntechOpen 2018.
fig 1

Proficiency Monitoring of Allergen-Specific IgE macELISA – 2020

DOI: 10.31038/IJVB.2020432

Abstract

The purpose of this study was to evaluate the reproducibility of results yielded using a macELISA for detection of allergen specific IgE in dogs and cats when run by nine different individuals in seven separate affiliated laboratories. Samples of 24 different sera samples were independently evaluated in each laboratory by differing operators in a single blinded fashion. For evaluations completed by multiple operators, the average inter-operator variance was calculated to be 3.5% (range = 2.0-4.8%). The average intra-assay variance among reactive assay calibrators in all laboratories was 4.1% (range = 0.8-7.1%). The overall inter-assay inter-laboratory variance evident with reactive calibrators was consistent among laboratories and averaged 9.8% (range 7.5-10.5%). All laboratories yielded similar profiles and magnitudes of responses for replicate unknown samples; dose response profiles observed in each of the laboratories were indistinguishable. Correlation of EAU observed for individual allergens between and among all laboratories was strong (r > 0.90, p < 0.001). Collectively, the results demonstrated that ELISA for measuring allergen specific IgE is reproducible, and documents that consistency of results can be achieved not only in an individual laboratory, but among different operators and between laboratories using the same ELISA.

Keywords

IgE, ELISA, Proficiency, Atopy, Allergy, Immunotherapy, Cross-reactive carbohydrate

Introduction

Since the monoclonal based enzyme linked immunoassay (macELISA) for detection of allergen specific IgE in dogs and cats manufactured by Stallergenes Greer was first characterized [1], it has been adopted for use in multiple diagnostic service laboratories. To ensure inter-laboratory standardization and establishment of quality control measures that ensure the uniformity, consistency, and reproducibility of results among laboratories that perform the assays are maintained, Stallergenes Greer has instituted a proficiency monitoring program, to be completed on an annual basis, for laboratories that routinely run the macELISA. This program is designed to evaluate the proficiency of laboratories in completing the assay and ensures that individual operators yield consistent and reproducible results. The inaugural proficiency evaluations, initiated in 2009 [1] and repeated in 2010 [2], in six different laboratories documents that inter-laboratory standardization and quality control measures in the veterinary arena were on the immediate forefront and that uniformity, consistency, and reproducibility of results between laboratories is achievable. The reproducibility of results among different laboratories documented in the subsequent proficiency evaluations completed in 2013 [3], 2016 [4], 2018 [5], and 2019 [6] confirm that consistent and reproducible results using this assay have been evident for more than a decade. Importantly, the 2019 proficiency evaluation was the first documentation of the assay reproducibility since the characterization of the incidence of IgE antibodies that are specific for cross reactive carbohydrates determinants (CCD) evident in serum derived from dogs and cats and adopting a cross-reactive carbohydrate inhibitor in the sample diluent [6,7]. The results presented herein summarize the comparative results observed in the affiliate laboratories for the most recent proficiency evaluations, which also included the CCD inhibitor, that were completed in September 2020.

Materials and Methods

All serum samples, buffers, coated wells, calibrator solutions, and other assay components were aliquants of the respective lots of materials manufactured at Stallergenes Greer’s production facilities (located in Lenoir, NC, USA) and supplied as complete kits to the participating laboratories along with the exact instructions for completing the evaluations.

Participating Laboratories

Seven independent Veterinary Reference Laboratories (VRLs) participated in the 2020 proficiency evaluation of macELISA. Participating laboratories included three separate IDEXX laboratories located in Memphis, Tennessee, Kornwestheim, Germany, and Markham, Ontario Canada. Other affiliated European laboratories that participated in this evaluation included Agrolabo (Scarmagno, Italy), Laboratories LETI (Barcelona, Spain), and Ceva Biovac (Beaucouzé, France). Stallergenes Greer Laboratories (Lenoir, NC) served as the prototype for evaluation of macELISA; the 2020 evaluations included results reported by three separate and independent operators. Because the performance characteristics of macELISA in Stallergenes Greer’s VRL have been well documented for use over an extended period [1-6] all results observed in the other participating laboratories were compared directly with the results observed in Stallergenes Greer’s reference laboratory.

Serum Samples

Separate pollen and mite reactive sera pools as well as non-reactive sera pools were prepared from cat and dog serum samples that previously had been evaluated using the macELISA for detection of allergen-specific IgE in dogs and cats. The allergen-specific reactivity of each sera pool ranged from nonreactive to multiple pollen or mite reactivity’s. These sera pools and admixtures of the pools were used to construct a specific group of samples that exhibited varying reactivity to the allergens included in the evaluation panel. Twenty-one samples were included in the blinded evaluation conducted by each laboratory. Two known pollen reactive control samples and one non-reactive control sample were also included; replicates of these identical samples were included as unknown blinded samples. Also included in the array of samples was a five tube three-fold serial dilution of a highly pollen-reactive pool, diluted into non-reactive sera, which served to document the dose response evident within the assay. Samples evaluated included in the 2020 were replicate samples of those evaluated in the 2019 proficiency evaluation [6]. All samples were stored at -20°C for the interim between testing.

Calibrators

Mite reactive calibrator solutions of predetermined reactivity in the macELISA were prepared as three-fold serial dilutions of a sera pool highly reactive to Dermatophagoides farinae, Acarus siro, and Tyrophagus putrescentiae. Replicates of each were evaluated in each assay run and served as a standard response curve for normalizing results observed with the various samples. All results were expressed as ELISA Absorbance Units (EAU) which are background-corrected observed responses expressed as milli absorbance.

Buffers

The buffers used throughout have been previously described [1-7] and included: a) well coating buffer: 0.05 M sodium carbonate bicarbonate buffer, pH 9.6; b) wash buffer: phosphate buffered saline (PBS), pH 7.4, containing 0.05% Tween 20, and 0.05% sodium azide; c) reagent diluent buffer: PBS, pH 7.4, containing 1% fish gelatin, 0.05% Tween 20 and 0.05% sodium azide. The buffer used for dilution of serum samples was identical to the reagent diluent buffer, but it has been supplemented (2.5 mG/mL) with a cross-reactive carbohydrate inhibitor derived from the carbohydrate components present in bromelain (BROM-CCD) [7]. BROM-CCD was prepared in house and remains a proprietary product of Stallergenes Greer (Lenoir, NC, USA).

Allergen Panel

The allergen panel was a 24 allergen composite derived from the array of allergens that are included in the specific panels routinely evaluated in the various laboratories; the composite allergen panel consisted of 4 grasses, 6 weeds, 6 trees, 5 mites, and 3 fungi. The protocol for coating and storage of wells has been previously described [1-7].

Sample Evaluations – macELISA

The operational characteristics and procedures for the macELISAs have been previously described [1-6]. Following incubation of allergen coated wells with an appropriately diluted serum sample, allergen-specific IgE is detected using a secondary antibody mixture of biotinylated monoclonal anti-IgE antibodies, streptavidin alkaline phosphatase as the enzyme conjugate, and p-nitrophenylphosphate (pNPP) as substrate reagent. Specific IgE reactivity to the allergens is then estimated by determining the absorbance of each well measured at 405 nM using an automated plate reader. All results are expressed as ELISA Absorbance Units (EAU), which are background-corrected observed responses expressed as milli absorbance [1].

Statistics

A coefficient of variation was calculated as the ratio of standard deviation and means of the responses observed for the calibrator solutions within different runs in multiple laboratories. Pearson’s correlation statistic was used for inter-laboratory comparison among individual allergens. Statistical analyses were conducted using EXCEL (2016; Microsoft; Redmond, WA, USA).

Results

The assay variance (% CV) observed with the calibrator solutions in the different laboratories are presented in Table 1 and are representative of the assay reproducibility in the various laboratories. The average intra-assay % CV among positive calibrators (#1-4) was 4.1% (range = 0.8-7.1%); differences among laboratories or between assays and within assay runs were not detected. No substantial difference in results among various operators were revealed. The average inter-operator variance documented for Stallergenes Greer technicians was calculated to be 3.5% (range = 2.0-4.8%). The average inter-assay variance (% CV) observed in Stallergenes Greer’s laboratory with the positive calibrators from multiple runs over a one year period has been documented at 8.9% (range 7.1% -9.7%), and the inter-laboratory % CV among reactive calibrators also remained relatively constant (average 12.1%; range 11.2-13.4%). The results of the current evaluation (Table 1) are consistent with these unpublished findings [1-7]; the inter-assay variance among positive calibrators for all laboratories included in this evaluation was calculated to be 7.2% (range = 4.1-8.7%). Similar to previously published studies [1-7], the intra-assay variability was higher with negative calibrator #5 (average 6.2%; range 1.0-15.8%), and a similar increased intra-assay variability was evident with the background ODs (average 9.1%; range 2.6-24.6%). A negative response is classified as anything with an EAU below 150 [1]. Any analysis of results below this threshold, especially when looking at %CV and relative differences, should be done so cautiously.

Table 1: Calculated variance of macELISA calibrator solutions observed with different laboratory runs by multiple operators during the 2019 Proficiency evaluation.

table 1

*Calibrator #1 is prepared as a dilution of a sera pool which is highly reactive to mite allergens; Calibrators #2 – #5 are prepared as a serial 3-fold dilution of calibrator #1.

Background responses observed with diluent in place of serum sample.

To evaluate the strength of association with the magnitude of EAU results observed for each allergen among the different laboratories a Pearson’s correlation coefficient was determined (Microsoft Excel 2016) for each laboratory pair. Because the macELISA is designed to yield comparable responses in dog and cat samples, comparison of results among affiliate laboratories included both cat and dog samples as a single population of sera samples [5-7]. These results (Table 2) demonstrate that very high inter-laboratory correlation (r > 0.90; p < 0.001) is evident between the results observed in Stallergenes Greer’s laboratory and those observed in six affiliate laboratories for all mites and pollen allergens. The correlation (Pearson’s) of results observed with the fungal allergens within or between any of the testing laboratories was also substantial. However, the majority of results for the fungal allergens fell within the lower range of reactivity or within the negative range of the response curve (<150 EAU). Consequently, the correlation of results among laboratories for the fungal allergens was somewhat less than the correlation evident with the mite and pollen allergens. The overall correlation of results observed in the various laboratories are summarized in Table 3; a very strong correlation (r > 0.90, p < 0.001) was demonstrated between and among the results of the participating laboratories.

Table 2: Inter-laboratory correlation of macELISA results observed with individual allergens in Stallergenes Greer Laboratory and the results observed in the individual affiliate laboratories.

table 2

*Pearson Correlation Coefficient (r); Good Correlation (r > 0.8, p<0.001).

Table 3: Inter-laboratory correlation of macELISA results observed among individual affiliate laboratories.

table 3

*Pearson Correlation Coefficient (r); Good Correlation (r > 0.8, p<0.001).

For an evaluation of the dose response in this ELISA, a five tube three-fold serial dilution a reactive dog sera pool was prepared using a negative sera pool as diluent. Each of the dilutions was then evaluated by all of the participating laboratories as unknown independent samples. Similar responses were yielded by all of the laboratories and the results observed within the various laboratories are encompassed by the acceptable variance limits [1-3] (±20%) established for macELISA. Further, the magnitude of responses observed in each laboratory was reduced in direct proportion to dilution. Consequently, the dose responses for the individual allergens are presented as aggregate responses. The results presented in Figure 1 confirm the sera pool was highly reactive to grass, weed, and tree pollen allergens, but it was not reactive to mites and fungi. To be expected, the magnitude of responses observed in each laboratory was reduced in direct proportion to dilution. Results from the final tube in the dilution scheme yielded results that were indistinguishable from negative responses, indicating a dilution extinction of detectable response.

fig 1

Figure 1: Dose response evident in macELISA with a pollen reactive serum pool.

The current evaluations were the second proficiency determination that was completed using a sample diluent that incorporated an inhibitor of cross reactive carbohydrate determinant (CCD) reactivity that might be evident in the serum sample. Further, the serum samples evaluated in this proficiency evaluation were replicate samples of the proficiency evaluation completed in 2019 [6] that had been stored frozen for the interim between evaluations. The correlation (Pearson) of results yielded in each of the participating laboratories with the individual allergens in the 2019 proficiency evaluation and those yielded in the current study is presented in Table 4. Overall, a very strong correlation (r > 0.90; p < 0.001) of the magnitude of responses was demonstrable for all allergens evaluated and all laboratories that participated in the evaluation.

Discussion

Consistent with previous proficiency evaluations of laboratories that routinely run the monoclonal antibody cocktail based enzyme linked immunoassay (macELISA) manufactured by Stallergenes Greer [1-6] the results of the present study demonstrate that the intra-assay variance observed with the positive calibrators evident among the various runs within each of the laboratories remains relatively low and indistinguishable among the various laboratories. Likewise, the inter-assay variance within each laboratory remained relatively constant and the results from all laboratories are demonstrably similar and the CV of the positive responses was relatively constant across the entire range of reactivity tested. The results demonstrate that the variability between and among the affiliate laboratories and technicians are indistinguishable from the results evident within and between runs completed in the laboratory of Stallergenes Greer. Thus, any and all laboratories and technicians included in the study are equally proficient in providing consistent results for all allergens tested and the results are well within the acceptable variance limits (±20%) established for this assay and reflects the robustness of the assay [1].

For more than a decade we have documented the reproducibility and robust character of the macELISA and demonstrated that comparable reproducibility of results can be achieved for a panel of identical sera samples when evaluated across multiple years [1-6]. However, it has recently been shown that incorporation of a CCD inhibitor is critical for reduction of false positive reactions that occur due to the binding of certain IgE to these carbohydrate groups that are common among pollen allergens [7-13]. To address these potential increases in signal due to CCD specific IgE antibodies evident in some sera samples, an inhibitor of the IgE antibodies has been incorporated as an essential component in macELISA [7]. In the 2019 proficiency evaluation we documented that inclusion of BROM-CCD inhibitor in our serum diluent [6] does not affect the intra-assay or inter-assay variance of the test and the results present herein confirm this observation. Further, the results presented in Table 4 demonstrate that responses of similar magnitude to the individual allergens in the panel were yielded in both of the 2019 and 2020 proficiency evaluations. These results document an excellent overall correlation (r > 0.90; p < 0.001) of results that were observed in the participating laboratories in each of the two proficiency evaluation periods; the correlation of responses to the individual allergens included in panel was also very strong. Inherently, the results of this comparative evaluation not only demonstrate excellent reproducibility of the assay in multiple laboratories over time, the data also document the stability of allergen specific IgE in serum samples stored frozen for at least one year.

Table 4: Correlation of macELISA results among individual affiliate laboratories observed during 2019 and 2020 proficiency evaluations.

table 4

*Pearson Correlation Coefficient (r); Good Correlation (r > 0.8, p<0.001).

There is no compelling evidence that the level of allergen specific IgE correlates with severity of clinical disease [14-17]. However, an evaluation that purports to measure allergen specific IgE should have a reduction in signal that is directly proportional to the dilution factor of the test ligand [18]. Similar responses were yielded by all of the laboratories for the samples that comprised the dose response and the results observed within the various laboratories are encompassed by the acceptable variance limits (±20%) established for macELISA [1-3]. Further, the magnitude of responses observed in each laboratory was reduced in direct proportion to dilution. Consequently, the dose responses for the individual allergens are presented as aggregate responses (Figure 1). The responses of greatest magnitude were evident with the grass pollen allergens, and these responses were reduced in direct proportion to dilution; the magnitude of responses ranged from near maximum to those that were indistinguishable from background responses. The reaction profiles for grass allergens also appear to be parallel and quite similar in magnitude of response. Whether or not these like responses result because of a similar level of co-sensitization or allergen epitope similarity combined with cross-reaction remains to be determined. Although the responses evident to differing tree and weed allergens are more variable in magnitude of response, the observed response in each laboratory was reduced in direct proportion to dilution. The positive response profiles evident with these allergens also appear to be parallel and, it becomes evident that the detectability of allergen specific IgE within this assay spans at least a 150-fold dilution range. Responses to mite and fungal allergens were lacking in the original sample.

We have demonstrated a continued reliability and reproducibility of our macELISA with the open publication of our proficiency testing procedures and results [1-6]. We encourage other groups to determine and document similar findings; however, we emphasize the importance of identifying results below the cutoff of 150 EAU merely as non-reactive and consequently negative responses. The reproducibility of the assay for these responses need to be defined only as negative and their numerical values become meaningless; comparison of EAU values are meaningful for reactive samples only (EAU > 150). Because the magnitude of specific responses is dependent on the concentration of allergen-specific IgE that can span a wide range, a better means of comparison of repeat results for individual samples in an assay of this sort is to evaluate the correlation (perhaps Pearson statistic) of results that might exist.

The lack of a regulatory mandated quality assurance program for serum allergen specific IgE testing in companion animals, that independently monitors performance of all laboratories and assay formats, prompts Stallergenes Greer to accept the responsibility for continued evaluation of laboratories that routinely use the company’s assays. Information presented herein documents the continued commitment of Stallergenes Greer and its affiliate laboratories to providing a stream of information relating these results to the veterinary community.

Funding

Funding for this study was provided by Stallergenes Greer.

References

  1. Lee KW, Blankenship KD, McCurry ZM, Esch RE, Douglas J DeBoer, et al. (2009) Performance characteristics of a monoclonal antibody cocktail-based ELISA for detection of allergen-specific IgE in dogs and comparison with a high affinity IgE receptor-based ELISA. Vet Dermatol 20: 157-164. [crossref]
  2. Lee KW, Blankenship KD, McCurry ZM, Kern G, Rick Ruffner, et al. (2012) Reproducibility of a Monoclonal Antibody Cocktail Based ELISA for Detection of Allergen Specific IgE in Dogs: Proficiency Monitoring of macELISA in Six US and European Laboratories. Vet Immunol Immunopathol 148: 267-275. [crossref]
  3. Lee KW, Blankenship K, Kinney Mc B, Kern G, Jesse Buch, et al. (2015) Proficiency monitoring of monoclonal antibody cocktail–based enzyme-linked immunosorbent assay for detection of allergen-specific immunoglobulin E in dogs. Journal of Veterinary Diagnostic Investigation. 27: 461-469. [crossref]
  4. Lee K, Blankenship K, Kinney Mc B, Kern G, et al. (2017) Continued Proficiency Monitoring of Monoclonal Antibody Cocktail-Based Enzyme-Linked Immunosorbent Assay for Detection of Allergen Specific Immunoglobulin E in Dogs – 2016. Integr J Vet Biosci 1: 1-10.
  5. Lee K, Blankenship K, Kinney Mc B, Kern G, et al. (2018) Proficiency Monitoring of Allergen Specific IgE macELISA ̶ 2018. Integr J Vet Biosci 2: 1-6.
  6. Enck K, Lee K, Blankenship K, McKinney B, et al. (2019) Proficiency Monitoring of Allergen-Specific IgE macELISA – 2019. Integr J Vet Biosci 3: 1-6.
  7. Lee KW, Blankenship KD, McKinney BH, Morris DO (2020) Detection and Inhibition of IgE for cross-reactive carbohydrate determinants evident in an enzyme linked immunosorbent assay for detection of allergen specific IgE in the serum of dogs and cats. Vet Dermatol.
  8. Altmann F (2016) Coping with cross-reactive carbohydrate determinants in allergy diagnosis. Allergo J Int 25: 98-105.
  9. Holzweber F, Svehla E, Fellner W, Dali T, Stubler S, et al. (2013) Inhibition of IgE binding to cross-reactive carbohydrate determinants enhances diagnostic selectivity. Allergy 68: 1269-1277. [crossref]
  10. Yokoi H, Yoshitake H, Matsumoto Y, Kawada M, et al. (2017) Involvement of cross-reactive carbohydrate determinants-specific IgE in pollen allergy testing. Asia Pac Allergy 7: 29-36.
  11. Kaulfürst-Soboll H, Mertens M, Brehler R, von Schaewen A (2011) Reduction of cross-reactive carbohydrate determinants in plant foodstuff: elucidation of clinical relevance and implications for allergy diagnosis. PLoS One 6: 17800. [crossref]
  12. Ito K, Morishita M, Ohshima M, Sakamoto T, et al. 2005 Cross-reactive carbohydrate determinant contributes to the false positive IgE antibody to peanut. Allergol Int 54: 387-392.
  13. Mari A, Iacovacci P, Afferni C, Barletta B, et al. (1999) Specific IgE to cross-reactive carbohydrate determinants strongly affect the in vitro diagnosis of allergic diseases. J Allergy Clin Immunol 103: 1005-1011. [crossref]
  14. DeBoer DJ, Hillier A (2001) The ACVD task force on canine atopic dermatitis (XVI): laboratory evaluation of dogs with atopic dermatitis with serum-based “allergy” tests. Vet Immunol Immunopathol 81: 277-287. [crossref]
  15. Gorman NT, Halliwell, REW (1989) Atopic Diseases. In: Halliwell REW, Gorman NT. Veterinary Clinical Immunology 232-252.
  16. Griffin CE, DeBoer DJ (2001) The ACVD task force on canine atopic dermatitis (XIV): clinical manifestation of canine atopic dermatitis. Vet Immunol Immunopathology 81: 255-269. [crossref]
  17. Griffin CE, Hillier A (2001) The ACVD task force on canine atopic dermatitis (XXIV): allergen-specific immunotherapy. Vet Immunol Immunopathol 81: 363-383. [crossref]
  18. Tijssen P. (1993) Processing of data and reporting of results of enzyme immunoassays. In: Burdon, RH, van Knippenberg PH, editors. Practice and Theory of Enzyme Immunoassays 385-421.

Complexity of Denture Plaque Biofilms

DOI: 10.31038/JDMR.2020342

Abstract

Background: This article provides an overview of denture plaque as both a microbiota community and a biofilm. The most promising strategies to ascertain the differences between biofilms formed by commensal populations and those related to increased pathogenesis and persistent infections are discussed.

This literature review covers the microbial communities colonizing dentures and their relationship to oral health. Supported by in vivo and in vitro studies, we highlight emerging–targeting strategies for physical and mechanical therapies intended to limit biofilm formation. Nevertheless, many challenges to eradicating mature biofilms are discussed.

Conclusions: Oral biofilms in the denture wearer can be controlled with daily hygiene but cannot be totally eradicated. To prevent the pathogenesis of denture biofilm, the biomass on the denture surface and the bioburden in the oral cavity must be reduced focusing on not only the inhibition of putative pathogens, but also interference with environmental factors that drive selection and enrichment.

Clinical implications: An effective oral hygiene regimen targeting dentures, saliva planktonic cells, mucosa, and the remaining teeth, whether or not they are affected by periodontal diseases, is necessary to control biofilm, particularly in the presence of many general diseases.

Keywords

Bacteria, Candida, Dental plaque biofilm, Microbiome, Denture management

Introduction

Insertion in the oral cavity of a removable denture bathed in saliva is an ideal environment for dynamic biofilm development [1,2]. In these conditions the planktonic microbiota exposed to stress and flow can quickly create favorable conditions for denture biofilm growth. This is defined as a community of bacteria attached to the denture surface and surrounded by an extracellular matrix produced by the bacteria themselves. This matrix is composed of different elements such as exopolysaccharides, proteins or DNA. Under the denture, the combination of soft tissue and hard surfaces provides a favorable environment within the oral cavity for microbial colonization. During use, the denture is subjected to many factors such as composition and flow of saliva, food, temperature fluctuations, masticatory forces and appliance loading. These parameters are challenging from the clinical point of view. Under healthy conditions, these denture plaques are tolerated by patients. But in 7-60% of patients denture plaque is associated with stomatitis [3]. Denture stomatitis (DS) is considered as a polymicrobial biofilm-mediated oral disease. Clinically DS refers to erythema and edema of the soft palate and tissues of the oral cavity that are in close contact with the denture surface.

Mature natural and denture teeth biofilms have similar total numbers of bacteria but different proportions of species [4]. Furthermore, the bacterial communities residing on the teeth and dentures of a single person are similar to each other independently of the surface material, and therefore denture health could impact the maintenance of the remaining teeth and vice-versa [5].

Although denture plaque cannot be totally eradicated, it can be controlled solely by oral hygiene measures that include a daily regimen of brushing the mucosa and denture, completed by rinsing with an antimicrobial mouthrinse [6]. This effective oral hygiene regimen can help control denture plaque biofilm and is a practical approach to the prevention of denture stomatitis and in addition accrues benefits in certain systemic diseases [7].

Biofilm Formation in Oral Environments

The oral microbiota includes a wide range of microorganisms, representing the three domains of life: Archea, Virus, Bacteria and Eukarya, providing numerous opportunities for physical and chemical interactions between different species and kingdoms [8-10]. Oral environments present a constant and transient micro flora whose quantitative and qualitative composition depends on many factors such as individual factors related to general conditions such as still birth, nutrition composition and consistency, and general diseases. However, locally other parameters are involved such as oral hygiene, tooth extraction, sampling times during the day, oral health status, prosthesis restorations, dental and periodontal diseases and dental treatment [11,12]. On the other hand, the apparent discrepancies between recent findings and previous 16S rRNA gene-based sequencing studies can stem from other parameters, ranging from geographical differences between patient populations to sample collection, sequencing (choice of 16S rRNA target region, the sequencing platform used, available read length and sequencing depth), or DNA extraction and PCR protocols [13].

Within the oral cavity, microorganisms are often found as part of highly organized microbial communities termed biofilms. Multispecies in biofilms, form complex microbial communities while maintaining their own autonomy and covering the different surfaces according to different micro environments such as teeth, saliva (108 microbes per milliliter), tongue, gingiva and other epithelial surfaces of the oral mucosae [14]. Some denture surfaces can carry up to 1011 organisms per gram in wet weight of plaque. Within this ecosystem, each species will produce metabolic intermediates, signaling molecules and toxins that will accumulate and impact the physiology of other members of the community [15].

During the early stages of biofilm formation, it is known that planktonic bacteria attach directly to the surfaces of the oral cavity or indirectly bind to other bacterial cells that have already colonized [16,17]. Other planktonic cells such as Candida spp possess a wide arsenal of glycoproteins located at the exterior side of the cell wall, many of which play a decisive role in these steps. In vivo, Candida spp. are members of mixed biofilms and subject to various antagonistic and synergistic interactions [18].

Consequently, Candida biofilm, even in the limited oral niche such as on dentures, decreases bacterial diversity and then changes the composition of the oral microbiota [19].

Composition of Denture-associated Biofilm

Available data conservatively estimate that at least ten fold more bacteria than yeasts colonize the surface of dentures. The prosthetic base acts as a support for the oral microbiota at the epithelial surface and is externally in contact with the planktonic flora. With time some organisms can penetrate inside the resin [20,21]. The palatal and mandibular covering mucosa, alternatively in contact with the removable prosthesis during the day and then released during the night, presents a particular ecosystem. In these conditions, the complexity of denture-associated biofilm increases, with the contact between the biotic layer of epithelial cells and the abiotic denture base (metallic or plastic biomaterials). These two dynamic biofilms coexist momentarily for many hours every day and are separate during the night, following the recommendations regarding the wearing of removable prostheses. Risk factors underlying stomatitis of the dental prosthesis must also be identified and treated: some prostheses need to be redone (inadequate prosthesis, unstable), certain diseases can interfere with wearing the removable prosthesis (general pathologies, diabetes, immunocompromised patients, cholesterol, lung and digestive diseases, cancers) and taking medication that can disrupt salivary secretion [7].

Recent and former investigations of the microbiome have examined the microbial communities colonizing dentures and their relationship to oral health [4,5,22]. Denture-associated biofilms have been considered a reservoir for infectious disease agents [23]. In these conditions, the relations between oral microbial infections and numerous systemic disease conditions are should be reconsidered [24].

In many studies, Candida was not limited to denture stomatitis samples [25,26]. Candida occur as two different phenotypes, i.e., the planktonic form (free cells) or the sessile form (biofilms). The sessile phenotype involves the development of a group of strains on a polymeric matrix, which confers protection against the host immune response and prevents diffusion of antimicrobial drugs. Therefore, infections caused by Candida biofilms remain difficult to diagnose and treat [27]. The genus Candida as hyphae or pseudohyphae is associated with the proliferation and development of biofilms [28]. The virulence of C. albicans has been closely linked to the hyphae-forming ability [29-32].

In denture wearers, the interactions that lead to an increased pathogenicity of fungi and bacteria are particularly intriguing [33,34]. The study of mixed C. albicans-bacterial biofilms, although only beginning, has already revealed unanticipated synergies that further complicate the treatment of biofilms in the clinic.

Denture Biofilm Management

Oral bacteria were long considered as individual cells, not being capable of complex behaviors. Today this simplistic vision of bacterial life has evolved and we know that bacteria are able to communicate with each other (Quorum Sensing) and live in association. Denture biofilm management has become increasingly important since awareness has arisen of their involvement in many public health issues. In fact, dentures give bacteria increased resistance to physical forces, antibiotic treatments and even the host immune system. This multifactorial resistance is due in particular to the presence of the extracellular matrix of biofilms, which contain structural proteins and enzymes that allow the formation and maintenance of these “microbe cities”. However, today the mechanisms that govern the secretion of substrates composing this matrix are unknown.

In these conditions, prevention via maintenance of a normal health-associated ecosystem is key for denture wearers. Recently new inquiries have influenced the upkeep of the denture.

Firstly, the numbers of bacteria colonizing the dentures of healthy subjects was significantly less than the numbers colonizing the dentures of stomatitis. These concern the proportions and frequency of isolation of Mutans streptococci; lactobacilli, bifidobacteria and yeasts were significantly greater in subjects with denture stomatitis [35].

Second, a recent study using the 16S rRNA gene sequencing data suggested a new approach considering the apparent strong mutual influence of bacteria colonizing dentures and teeth in the same individual (species/phylotypes). The health and integrity of the remaining teeth could be important factor in the mucosal health of denture wearers beyond their role in anchoring restorations and maintaining bone integrity. Similarly, the denture-associated oral mucosal health status could play a critical role in conserving the remaining teeth [5].

Third, an interesting finding was the detection of periodontal pathogens, Aggregatibacter actinomycetemcomitans and Porphyromonas gingivalis, on the tongue of edentulous subjects, as these species were thought to disappear after removal of all natural teeth [36,37]. Under these conditions the cleaning of the tongue becomes necessary to eliminate these pathogens.

Fourth, while overlap exists, different natural surfaces within the oral cavity are colonized by distinct communities. The recent technology to identify the oral microbiome can detects new information. In vivo, earlier studies have demonstrated that protein adsorption to surfaces and bacterial adherence are mostly determined by the surface roughness rather than by other material with specific physicochemical properties) [38,39]. Shi et al.’s findings give additional information and assume that individual-specific factors can be more dominant determinants of the oral bacterial biofilm community composition than surface [5]. Many parameters support these arguments: an important host factor involving saliva can display substantial variability between individuals [40] and provides important adhesion proteins for bacterial attachment [38]. It assumes that individual-patient factors could be stronger determinants of bacterial biofilm community composition than different surfaces and emphasizes that grouping and pooling of samples from different people can influence the outcome of analysis.

Fifth, previous studies analyzing the bacteria colonizing dentures in health and disease (denture stomatitis) are not conclusive. Similar to these results, a recent sequencing study [26] and older culture-based approaches [20] found no difference in the apparent microbial composition between healthy and stomatitis patients and noted only that the amount of plaque buildup is significantly greater in stomatitis patients. Hence the need to fight daily against the accumulation of microbial plaque.

Sixth, there is widespread use of recently developed new therapies to prevent, disrupt and otherwise render harmless the peculiar ability of C. albicans to form biofilms on almost any surface in the mouth. Commercially available probiotics (AccufloraR and CulturelleR) that contain Lactobacillus species associated with mechanistic cleaning interfere with the in vitro ability of C. albicans to form biofilm on dentures [41]. Through the phenomena of co-aggregation, the lactobacilli may secrete an adequate mass and be able to maintain a hostile micro-environment around Candida species with high concentrations of products such as acids, H2O2, bacteriocins, and thereby possibly inhibit the pathogens’ growth. Daily use of probiotic lozenges may reduce the prevalence of high oral Candida counts in frail elderly nursing homes residents [42]. Recently a probiotic, the bacterium Lactobacillus reuteri (DSM 17938 and ATCC PTA 5289) against six oral Candida species (C. albicans, C. glabrata, C. krusei, C. tropicalis, C. dubliniensis and C. parapsilosis) were tested in vitro for their ability to co-aggregate and inhibit the growth of the yeasts. The lactobacilli almost completely inhibited the growth of C. Albicans and C. parapsilosis, but did not affect C. krusei, the latter can resist from the acids produced by the lactobacilli [33].

Another domain of research is examining nanoparticles. The effect of zirconia nanoparticles added to cold-cured acrylic resin on C. albicans adhesion has been evaluated. Zirconium oxide nanoparticles possess antifungal properties on C. albicans and Aspergillus niger and could be used for prevention of DS [43,44]. Another interesting finding in vivo is the efficacy of methylene blue-mediated photodynamic inactivation on the oral mucosa and prostheses of patients with DS, against C. albicans [45].

For all this progress, the treatment is based the ecological plaque hypothesis, which states that disease prevention should not only focus on the inhibition of putative pathogens, but also on interference with the environmental factors that drive selection and enrichment these microbiota, as reported by Marsh [46].

The key characteristics of denture biofilm that could be targets for pathogen management include its behavior as an adhesive mass with viscoelastic properties. The placement of the biofilm obeys different sequences that can condition the maintenance of the prosthesis.

In the first stage, the pathogen management process consists of regular meticulous brushing of the prosthesis every day to reduce the pathogenic burden [47].

The second phase of antimicrobial therapy, including the use of mouthwashes, is intended to impede the passage of stage I (adhesion) biofilm to stage II biofilm by applying them at key intervals to combat attachment and maturation of the biofilm [48].

Many chemotherapeutic products and interventions recommended are effective against planktonic oral bacteria, but unfortunately live intact biofilms are able to persist even after treatment with many products such as sodium hypochlorite [49]. In vitro studies show that MoWs containing chlorhexidine digluconate or cetylperyridinium chloride may be favorable for oral health in terms of microbial balance [50]. However, these data must be confirmed by comparative in-depth in vivo studies.

In the presence of prosthetic stomatitis and after detection in culture of colonization by Candida, the use of Amphotericin B is considered the “gold standard” of antifungal therapy but is toxic because there is no selectivity between fungal and mammalian cells [51]. However, fungal biofilms that mature on denture material become resistant to antifungals [52].

In conclusion, four recommendations concerning the use of a removable prosthesis, written and verbal, are addressed to patients. 1) Daily brushing of the prosthesis. 2) Daily immersion of the prosthesis in an antiseptic liquid. 3) Refrain from wearing your prosthesis at night. 4) When you get up in the morning, rinse your mouth and its prosthesis well before reintroducing it in the mouth.

References

  1. Nikawa H, Hamada T, Yamamoto T (1998) Denture plaque – past and recent concerns. J Dent 26: 299- [crossref]
  2. Hao Y, Huang X, Zhou X, Li M, Ren B, et al. (2018) Influence of Dental Prosthesis and Restorative Materials Interface on Oral Biofilms. Int J Mol Sci 19: 3157. [crossref]
  3. Gendreau L, Loewy ZG (2011) Epidemiology and Etiology of Denture Stomatitis. J Prosthodont 20: 251-2 [crossref]
  4. Teles FR, Teles RP, Sachdeo A, Uzel NG, Song XQ, Torresyap G, et al. (2012) Comparison of Microbial Changes in Early Redeveloping Biofilms on Natural Teeth and Dentures. J Periodontol 83: 1139-11 [crossref]
  5. Shi B, Wu T, McLean J, Edlund A, Young Y, et al. (2016) The Denture-Associated Oral Microbiome in Health and Stomatitis. Imperiale MJ, éditeur. mSphere 1: 00215-216. [crossref]
  6. Ercalik-Yalcinkaya S, Ozcan M (2014) Association between Oral Mucosal Lesions and Hygiene Habits in a Population of Removable Prosthesis Wearers. J Prosthodont Off J Am Coll Prosthodont
  7. Senpuku H, Sogame A, Inoshita E, Tsuha Y, Miyazaki H, et al. (2003) Systemic diseases in association with microbial species in oral biofilm from elderly requiring care. Gerontology 49: 301-30 [crossref]
  8. Marloes Lof, Marleen Janus, Bastiaan Krom (2017) Metabolic Interactions between Bacteria and Fungi in Commensal Oral Biofilms. J Fungi 3: 40.
  9. Avila M, Ojcius DM, Yilmaz Ö (2009) The Oral Microbiota: Living with a Permanent Guest. DNA Cell Biol 28: 405-4 [crossref]
  10. Chevalier M, Ranque S, Prêcheur I (2018) Oral fungal-bacterial biofilm models in vitro: a review. Med Mycol 56: 653-6 [crossref]
  11. Marsh PD, Do T, Beighton D, Devine DA (2016) Influence of saliva on the oral microbiota. Periodontol 2000 70: 80- [crossref]
  12. Marsh PD (2005) Dental plaque: biological significance of a biofilm and community life-style. J Clin Periodontol 32: 7- [crossref]
  13. Zheng W, Tsompana M, Ruscitto A, Sharma A, Genco R, et al. (2015) An accurate and efficient experimental approach for characterization of the complex oral microbiota. Microbiome 3: 48. [crossref]
  14. Zarco MF, Vess TJ, Ginsburg GS (2012) The oral microbiome in health and disease and the potential impact on personalized dental medicine. Oral Dis 18: 109-1 [crossref]
  15. Jakubovics NS (2015) Intermicrobial Interactions as a Driver for Community Composition and Stratification of Oral Biofilms. J Mol Biol 427: 3662-36 [crossref]
  16. Hojo K, Nagaoka S, Ohshima T, Maeda N (2009) Bacterial Interactions in Dental Biofilm Development. J Dent Res 88: 982-9 [crossref]
  17. ten Cate JM, Klis FM, Pereira-Cenci T, Crielaard W, de Groot PWJ (2009) Molecular and cellular mechanisms that lead to Candida biofilm formation. J Dent Res 88: 105-1 [crossref]
  18. ten Cate JM, Klis FM, Pereira-Cenci T, Crielaard W, de Groot PWJ (2009) Molecular and cellular mechanisms that lead to Candida biofilm formation. J Dent Res 88: 105-1 [crossref]
  19. Lyon JP, da Costa SC, Totti VMG, Munhoz MFV, de Resende MA (2006) Predisposing conditions for Candida spp. carriage in the oral cavity of denture wearers and individuals with natural teeth. Can J Microbiol 52: 462-467. [crossref]
  20. Theilade E, Budtz-Jørgensen E, Theilade J (1983) Predominant cultivable microflora of plaque on removable dentures in patients with healthy oral mucosa. Arch Oral Biol 28: 675-6 [crossref]
  21. Latib YO, Owen CP, Patel M (2018) Viability of Candida albicans in Denture Base Resin After Disinfection: A Preliminary Study. Int J Prosthodont 31: 436-43 [crossref]
  22. Campos MS, Marchini L, Bernardes La.S, Paulino LC, Nobrega FG (2008) Biofilm microbial communities of denture stomatitis. Oral Microbiol Immunol 23: 419-4 [crossref]
  23. Gendron R, Grenier D, Maheu-Robert L (2000) The oral cavity as a reservoir of bacterial pathogens for focal infections. Microbes Infect 2: 897- [crossref]
  24. Le Bars P, Sébastien Matamoros, Fabienne Jordana, Emmanuel Montassier, Françoise Le Vacon, et al. (2017) The oral cavity microbiota: between health, oral disease and cancers of the aerodigestive tract. Can J Microbiol 63: 475-492. [crossref]
  25. Koopmans ASF, Kippuw N, de Graaff J (1988) Bacterial Involvement in Denture-induced Stomatitis. J Dent Res 67: 1246-12 [crossref]
  26. O’Donnell LE, Robertson D, Nile CJ, Cross LJ, Riggio M, et al. (2015) The Oral Microbiome of Denture Wearers Is Influenced by Levels of Natural Dentition. PLOS ONE 10: 0137717. [crossref]
  27. Gusberti FA, Gada TG, Lang NP, Geering AH (1985) Cultivable microflora of plaque from full denture bases and adjacent palatal mucosa. J Biol Buccale 13: 227-2 [crossref]
  28. Altarawneh S, Bencharit S, Mendoza L, Curran A, Barrow D, et al. (2013) Clinical and Histological Findings of Denture Stomatitis as Related to Intraoral Colonization Patterns of Candida albicans , Salivary Flow, and Dry Mouth: Role of C. albicans in Saliva, Mucosal and Denture Surfaces in DS. J Prosthodont 22: 13- [crossref]
  29. Mitchell KF, Zarnowski R, Sanchez H, Edward JA, Reinicke EL, Nett JE, et al. (2015) Community participation in biofilm matrix assembly and function. Proc Natl Acad Sci 112: 4092-409 [crossref]
  30. Mayer FL, Wilson D, Hube B (2013) Candida albicans pathogenicity mechanisms. Virulence 4: 119-1 [crossref]
  31. Tsang PW-K, Bandara HMHN, Fong W-P (2012) Purpurin Suppresses Candida albicans Biofilm Formation and Hyphal Development. PLoS ONE 7: 50866.
  32. Vylkova S, Lorenz MC (2014) Modulation of Phagosomal pH by Candida albicans Promotes Hyphal Morphogenesis and Requires Stp2p, a Regulator of Amino Acid Transport. Krysan DJ, éditeur. PLoS Pathog 10: 1003995. [crossref]
  33. Jørgensen MR, Kragelund C, Jensen PØ, Keller MK, Twetman S (2017) Probiotic Lactobacillus reuteri has antifungal effects on oral Candida species in vitro. J Oral Microbiol 9: 1274582. [crossref]
  34. Bor B, Cen L, Agnello M, Shi W, He X (2016) Morphological and physiological changes induced by contact-dependent interaction between Candida albicans and Fusobacterium nucleatum. Sci Rep 6: 27956. [crossref]
  35. Mantzourani M, Gilbert SC, Fenlon M, Beighton D (2010) Non‐oral bifidobacteria and the aciduric microbiota of the denture plaque biofilm. Mol Oral Microbiol 25:190-19 [crossref]
  36. Sachdeo A, Haffajee AD, Socransky SS (2008) Biofilms in the edentulous oral cavity. J Prosthodont Off J Am Coll Prosthodont 17: 348-356. [crossref]
  37. Fernandes CB, Aquino DR, Franco GC, Cortelli SC, Costa FO, et al. (2010) Do elderly edentulous patients with a history of periodontitis harbor periodontal pathogens? Clin Oral Implants Res 21: 618-623. [crossref]
  38. Teughels W, Van Assche N, Sliepen I, Quirynen M (2006) Effect of material characteristics and/or surface topography on biofilm development. Clin Oral Implants Res 17: 68- [crossref]
  39. Ionescu AC, Brambilla E, Azzola F, Ottobelli M, Pellegrini G, et al. (2019) Laser microtextured titanium implant surfaces reduce in vitro and in situ oral biofilm formation. PLoS ONE 13: 0202262. [crossref]
  40. Altarawneh S, Bencharit S, Mendoza L, Curran A, Barrow D, et al. (2013) Clinical and histological findings of denture stomatitis as related to intraoral colonization patterns of Candida albicans, salivary flow, and dry mouth. J Prosthodont Off J Am Coll Prosthodont 22: 13 22. [crossref]
  41. Ujaoney S, Chandra J, Faddoul F, Chane M, Wang J, et al. (2014) In Vitro Effect of Over-the-Counter Probiotics on the Ability of Candida Albicans to Form Biofilm on Denture Strips. J Dent Hyg JDH Am Dent Hyg Assoc 88: 183-189. [crossref]
  42. Kraft-Bodi E, Jørgensen MR, Keller MK, Kragelund C, Twetman S (2015) Effect of Probiotic Bacteria on Oral Candida in Frail Elderly. J Dent Res 94: 181-186. [crossref]
  43. Gad M, Al-Thobity AM, Shahin S, Alsaqer B, Ali A (2017) Inhibitory effect of zirconium oxide nanoparticles on Candida albicans adhesion to repaired polymethyl methacrylate denture bases and interim removable prostheses: a new approach for denture stomatitis prevention. Int J Nanomedicine 12: 5409-54 [crossref]
  44. Dos Santos Ramos MA, Da Silva P, Spósito L, De Toledo L, Bonifácio B, et al. (2018) Nanotechnology-based drug delivery systems for control of microbial biofilms: a review. Int J Nanomedicine. févr;Volume 13: 1179-1 [crossref]
  45. de Senna AM, Vieira MMF, Machado-de-Sena RM, Bertolin AO, Núñez SC, et al. (2018) Photodynamic inactivation of Candida ssp. on denture stomatitis. A clinical trial involving palatal mucosa and prosthesis disinfection. Photodiagnosis Photodyn Ther 22: 212-21 [crossref]
  46. Marsh PD, Zaura E (2017) Dental biofilm: ecological interactions in health and disease. J Clin Periodontol 44: 12-22. [crossref]
  47. Ramage G, O’Donnell L, Sherry L, Culshaw S, Bagg J, Czesnikiewicz-Guzik M, et al. (2019) Impact of frequency of denture cleaning on microbial and clinical parameters – a bench to chairside approach. J Oral Microbiol Janv 11: 1538437. [crossref]
  48. Koo H, Allan RN, Howlin RP, Stoodley P, Hall-Stoodley L (2017) Targeting microbial biofilms: current and prospective therapeutic strategies. Nat Rev Microbiol 15: 740-755. [crossref]
  49. A, Sarembe S, Pizzey RL, Axe AS, Bradshaw DJ (2016) Material compatibility and antimicrobial activity of consumer products commonly used to clean dentures. J Prosthet Dent 115: 189-198. [crossref]
  50. Ardizzoni A, Pericolini E, Paulone S, Orsi CF, Castagnoli A, et al. (2018) In vitro effects of commercial mouthwashes on several virulence traits of Candida albicans, viridans streptococci and Enterococcus faecalis colonizingthe oral cavity. PLoS ONE 13: 0207262 [crossref]
  51. Pierce CG, Lopez-Ribot JL (2013) Candidiasis drug discovery and development: new approaches targeting virulence for discovering and identifying new drugs. Expert Opin Drug Discov 8: 1117-1126. [crossref]
  52. Hawser SP, Douglas LJ (1995) Resistance of Candida albicans biofilms to antifungal agents in vitro. Antimicrob Agents Chemother 39: 2128-2131. [crossref]
fig 1

Computerised Dynamic Occlusal Study with T-Scan III System in Patients Treated with Stabilisation Splint

DOI: 10.31038/JDMR.2020341

Abstract

Stabilisation splints (S.S.) are one of the most commonly used tools in the treatment of temporomandibular disorders (TMD), bruxism or both.

The T Scan III computerised occlusal analysis technique accurately displays the sequence of occlusal contacts in closing and excursion movements and allows for the quantification of occlusion and disclusion times and the distribution of percentages of occlusal forces in the arch.

This study aims to assess the changes that occur in occlusion after the installation of a stabilisation splint.

A sample of 42 patients who attended the UCM Temporomandibular Disorders and Orofacial Pain Specialist Clinic was selected. These were diagnosed with TMD, myofascial pain and or sleep bruxism and treated with stabilisation splints (S.S.).

Records were taken in maximum intercuspation, right and left laterality, and in protrusion before and after installation of the stabilisation splint.

After the installation of the stabilisation splint, there was a decrease in occlusion and disclusion times. This difference was statistically significant in occlusion times at maximum intercuspation and disclusion movements of right and left laterality and protrusion.

As for the percentage of force, the right and left dental arch tend to be balanced after the installation of an S.S. The same is true between the premolar and molar sectors.

In conclusion, stabilisation splints produce significant changes in occlusion when analysing disclusion times in right, left laterality and protrusion movement. Stabilisation splints tend to balance occlusion forces between the premolar and molar sectors and between the two dental arches.

Keywords

T scan III system, Stabilisation splints (SS), Temporomandibular disorder (TMD)/bruxism

Introduction

TMDs are a subgroup of craniofacial pain problems involving the temporomandibular joint (TMJ), masticatory muscles and musculoskeletal structures of the head and neck. Symptoms related to TMDs predominate in young adults and women, with a ratio of females to males of up to 4:1, according to some studies [1].

Bruxism is a common disorder characterized by involuntary squeezing or grinding of the teeth, due to repetitive activity of the chewing muscles. Prevalence ranges from 8 to 31% [2].

Bruxism, as a whole, correlates positively with the presence of TMD pain [3]. Its role, however, in the aetiology of pain in TMDs is relatively unknown. Awake bruxism and sleep bruxism have been observed to have a different association with pain in TMDs [4]. Observational studies by Rossetti 2008 showed that awake bruxism is a greater risk factor for developing myofascial pain in TMDs than sleep bruxism [5] Conversely, Blanco Aguillera et al. and Fernandes et al. found that the pain in TMDs was associated with the sleep bruxism [6].

There are many studies on different aspects of TMDs, bruxism and myofascial pain. Few, however, have objectively evaluated the changes a stabilising splint produces in occlusion to facilitate good orthopaedic stability. In this sense, computerised systems that allow dentists to record these changes dynamically have been available to them for years.

Maness developed the T-Scan system for computer occlusal analysis in 1987, which performs real-time measurements of occlusal force percentages using an intraoral sensor.

Digital occlusal analysis (T-Scan III, Version 8, Tekscan, Inc. S. Boston, MA, USA) provides measurable variations in occlusion time and force percentages, accurately showing the occlusal contact sequence in closing and excursion movements [7]. This T-Scan system detects whether an occlusal force in one tooth, within a set of opposite dental contacts, is greater than, equal to, or less than the occlusal forces that occur in other teeth. It provides, with great precision, the force of occlusal contacts by providing qualitative and quantitative data.

The T-Scan is also a dynamic record, in which mouth closure is recorded in real-time from the initial contact to the maximum intercuspation (MIP) and also the excursion movements initiated from the MIP [7,8].

A complete occlusal analysis with T-Scan can detect abnormalities in the centring and intensity of occlusal forces, showing functional asymmetry that can be related to muscle dysfunction.

Physiological occlusion of maximum orthopaedic stability, which is the desired objective with an occlusal splint, must include several characteristics, such as; 1. There must be simultaneous bilateral contacts during mandibular closure in maximum intercuspation; 2. There must be disclusion of all back teeth during excursion mandibular movements; and 3. There should be no premature contact when the jaw is closed in a stable musculoskeletal position.

Until the development of T-Scan technology, recording of occlusion and disclusion sequence had not been possible, and therefore its times could not be accurately measured. Instead, clinicians had other methods for determining simultaneous contacts, such as observing the distribution and size of joint paper marks along the dental arches with the teeth in contact or listening to the sound of tooth contact and subsequent disclusion. The T-Scan I was the first device capable of measuring occlusal contact time in fractions of 0.01 seconds [9].

This study is designed to answer the following question: To what extent do stabilisation splints optimise occlusal forces and redistribute them in the dentition of patients with any or all of the following conditions; TMD, bruxism, myofascial pain?

Records obtained with the T-Scan III Computer Occlusal Analysis System have been objectively and dynamically analysed and evaluated in patients with TMD or bruxism or both, both in maximum intercuspation, right/left laterality, and protrusive motion, before and after inserting a stabilisation splint.

Material and Method

This study is a cross-sectional analysis of records with and without a splint, in which the medical history and computerised occlusal analysis of an individual patient before and after the installation of a stabilisation splint are evaluated.

A sample of 42 patients who attended our faculty’s Temporomandibular Disorders and Orofacial Pain Specialist Clinic was selected. These were diagnosed with one, various or all of the following; temporomandibular muscle disorders, myofascial pain, sleep bruxism. They, therefore, required treatment with stabilisation splints.

The selection method was by a non-probabilistic sampling of consecutive cases seeking maximum randomness. A previous study was conducted to determine the mean sample size, taking into account epidemiological studies estimating that approximately 5% of the population suffers from TMDs. It was determined that 37.24 records were required to be within acceptable margins of error and confidence level. A 95% confidence level was assumed.

Subjects over the age of 18 of both sexes, suffering from either or; muscular TMD, night bruxism, and ‘grinding’ patients, were included. All were informed about the purpose of the study and signed the informed consent. This study was supported by the Ethical Committee for Clinical Research of the San Carlos Clinical Hospital. ANNEX.

A specific and detailed medical history of TMD was made, following DC/TMD [10] criteria, and a Paesani questionnaire was filled out to detect bruxism [11]. Once the splint had been made and tested, the T-Scan III records were taken, first without the splint and then after placement in the patient’s mouth.

The computerised occlusal analysis technique, T-Scan (T-Scan III for Windows, Tekscan Inc., South Boston, MA), allows the clinician to quantitatively evaluate occlusal contacts and record occlusion during continuous jaw movement [12].

Each patient’s personal data is entered; the graph for each patient’s upper dental arch will thus be customised. The mesiodistal diameter of the central incisive allows us to extrapolate this diameter to all the teeth of the arch. Four records will be taken in maximum intercuspation, right laterality, left laterality and one last recording in protrusion. All these records are taken prior to the installation of the splint and are registered again with the splint installed.

The program processes the data and displays the charts in 3D or 2D (Figure 1).

fig 1

Figure 1: Below is the “Force vs. Time” graph. This graph illustrates the change in occlusal force percentages over time, both in the middle of the left arch (green line) and in the middle of the right arch (red line). The horizontal axis of the Force vs. Time graph indicates the elapsed time, while the vertical axis indicates the change in the percentage of occlusal forces on both sides of the dental arch. The total force of the combined left and right arch halves is shown in the Force vs. Time graph in the black line.

In the 3D graphics, registered contacts are displayed as different colour and height columns that quantify the intensity of the forces generated in the occlusion.

The 2D graphics show the halves of the right and left arch, which are outlined in green for the left side and red for the right, they also show the percentages of force of each dental arch, and by sector (Figure 2).

fig 2

Figure 2: Force vs. Time Graph

A: Represents the start of occlusal contact.

B: Displays when all teeth go into intercuspation during closing.

A.B.: Time elapsed between initial tooth contact and maximum intercuspation. This is represented as occlusion time (O.T.) and should ideally be below 0.2 s;

B.C.: Is the time elapsed when teeth begin intercuspation during closing.

C: Represents the beginning of disclusion.

CD: Represents disclusion time (DT). During the tour, the D.T. should be less than 0.4 s; Longer D.T. indicates more occlusal surface friction contacts during the excursion (180) (181) (182) (183).

Fuerza Máxima Total=Total maximum forcé.

The occlusion time is defined as the duration from the initial contact of the tooth until it reaches the maximum intercuspation, which ideally should be less than 0.2 seconds. Longer times indicate greater interference and premature contacts during closing.

The subsequent disclusion time (D.T.) was first described by Kerstein and Wright as the required elapsed time for all posterior molar and premolar teeth to separate bilaterally from each other during a single excursion movement made in one direction (right, left or protrusive). Excursion recordings using the T-Scan III are used to measure the duration of the subsequent disclusion time and the existence of friction on the posterior occlusal surface during excursion movements [13].

The data were processed with the statistical programme SPSS Statistics 22. 0 (IBM, Armonk, NY, USA). The comparison between the occlusion and disclusion times that occur before and after the installation of a stabilisation splint and the percentages of bite force was performed by the t Student sample test for repeated measurements. The Wilcoxon or Mann-Whitney U tests were used when the assumption of normality was not met (Figures 3 and 4).

fig 3

Figure 3: Occlusion and disclusion times that occur after the installation of a stabilisation splint.

Con/sin férula=With/without splint

O.T Oclusión/Disoclusión=T. Occlusion/Disclusion

LDT=RLT (Right Laterality Time).

LIZT=LLT (Left Laterality Time)

PTT=PT (Protrusion Time).

fig 4

Figure 4: Porcentage de fuerza de mordida en máxima intercuspidación – sin férula/con férula

Percentage of bite forcé in maximum intercuspation – without splint/ with splint.

Porcentage lado derecho/izquierdo de la arcada sin férula/con férula

Percentage right/left side of the dental arch without splint/with splint.

Porcentage sector anterior/posterior de la arcada sin férula/con férula

Percentage anterior/posterior sector of the dental arch without splint/with splint.

Results

The reproducibility of the study was analysed using the interclass correlation coefficient and sensitivity of T-Scan III. Although statistical significance was not found in all records, a pattern was observed in all of them.

The results in terms of the occlusion time at maximum intercuspation, recorded before and after the installation of the stabilisation splint, were an average value of 0.18″ and the occlusion time after the installation of the splint decreased to 0.14″, this difference was statistically significant, p < 0.05.

The Wilcoxon test was used to assess the results of disclusion times at maximum intercuspation. Records without splints have an average value of 0.26″. There are no significant differences between the two records.

Disclusion time analysis in right laterality showed statistical significance. The average of the records without splints was 1.07″, well above the 0.40″ admitted as normal and the splint records showed a decrease in disclusion time to 0.54″.

Upon analysis of the disclusion time in the left laterality movement, a statistically significant difference is observed. We note that the disclusion time decreases from 0.98″ to an average of 0.57″ in records taken with stabilisation splints.

When analysing the moving protrusion records, we observe that the average disclusion times before installing the splint is 0.90″ and that this time decreases with the splint to 0.64″. This data has statistical significance (Table 1).

Table 1: Occlusion and disclusion times that occur after the installation of a stabilisation splint.

Variables

Average C.I. at 95% Mdn SD

p

Dependent Independent

L.L.

U.L.

Occlusion time at maximum intercuspation Without splint

0.18

0.16 0.21 0.17 0.07

<0.001 (t)

With splint

0.14

0.12 0.15 0.14

0.05

Disclusion time at maximum intercuspation Without splint

0.26

0.20 0.31 0.18 0.18

0.554

With splint

0.22

0.19 0.25 0.20

0.11

Right laterality occlusion time Without splint

0.19

0.16 0.23 0.19 0.11

0.044

With splint

0.16

0.14 0.18 0.17

0.06

Right laterality disclusion time Without splint

1.07

0.93 1.20 1.08 0.43

<0.001

With splint

0.54

0.48 0.61 0.43

0.22

Left laterality occlusion time Without splint

0.17

0.15 0.20 0.17 0.08

0.043

With splint

0.15

0.13 0.16 0.15

0.05

Left laterality disclusion time Without splint

0.98

0.87 1.09 0.94 0.35

<0.001

With splint

0.57

0.49 0.64 0.49

0.24

Occlusion time in protrusion Without splint

0.21

0.18 0.24 0.20 0.10

0.067

With splint

0.18

0.16 0.20 0.19

0.06

Disclusion time in protrusion Without splint

0.90

0.79 1.01 0.91 0.36

<0.001 (t)

With splint

0.64

0.55 0.73 0.62

0.28

Wilcoxon signed-rank test; t, Student´s T-Test (paired samples); C.I, Confidence interval; L.L., lower limit; U.L., upper limit; S.D., standard deviation, Mdn, median. Sample Size 42 patients.

Record as a percentage of forces that occur in each dental arch, right and left. The Student’s T-Test was used for statistical analysis for repeated samples. It is observed that at maximum intercuspation, the average percentage for the right dental arch recorded without stabilisation splint was 53.25% and for the left, it was 46.76%. With the stabilisation splint, the average values were 51.22% for the right dental arch and 48.80% for the left. It is noted that in stabilisation splint registers, there is a tendency to balance between the two dental arches (Table 2).

Table 2: Percentages of forces that occur in the right and left dental arches before and after the installation of a stabilisation splint.

Variables

Average

C. I. at 95% Mdn

SD

p

Dependent Independent

L.L.

U.L.

Percentage right side of the dental arch Without splint

53.25

49.22 57.27 53.60 12.91

0.067

Percentage left side of the arcade

46.76

42.74 50.78 46.40

12.91

Percentage right side of the dental arch With splint

51.22

48.62 53.81 50.95 8.32

0.400

Percentage left side of the dental arch

48.80

46.19 51.41 49.05

8.37

Wilcoxon signed-rank test; t, Student´s T-Test (paired samples); C.I., Confidence interval; L.L., lower limit; U.L., upper limit; S.D., standard deviation; Mdn, median.

Record as a Percentage of Forces Produced in the Premolar and Molar Sector

For statistical analysis, the Student’s T-test for repeated samples and the Wilcoxon signed-range test were used. The average value of registers taken without stabilisation splints for the premolar sector was 40.27% and for the posterior molar sector of 60.09%. When registers are taken with the splint, the average was 52.26% in the premolar sector and 47.71% in the posterior molar sector. It is noted that records taken with stabilisation splints tend to balance both sectors (Table 3).

Table 3: Comparison of forces produced in the anterior and posterior sector before and after the installation of the stabilisation splint.

Variables

Average

C.I. al 95% Mdn SD

p*

Dependent Independent

L. L.

U.L.

Anterior sector percentage (premolars) Without splint

40.27

34.27 46.27 38.65 19.26

0.002

Posterior sector percentage (molars)

60.09

54.25 65.93 61.35

18.75

Anterior sector percentage (premolars) With splint

52.26

47.97 56.55 53.70 13.75

0.149

Posterior sector percentages (molars)

47.71

43.42 51.99 46.00

13.76

*Wilcoxon signed-rank test; C.I, Confidence interval; L.L., lower limit; U.L., upper limit; S.D., standard deviation; Mdn, median.

Analysis of the results without stabilisation splint reveals there is a higher percentage of force at the molar than at the premolar level. With the splint, however, there is a change in the ratio of the force percentages, so that the loads are advanced, increasing the percentage of force at the premolar level, so much so that the values are inverted.

Discussion

At the start of this study, the reproducibility and sensitivity of the T-Scan system have been considered, using the interclass correlation coefficient. While no statistical significance was found in all records, a pattern is observed.

Several studies have assessed the ability of the T-Scan III system to detect the number and location of occlusal contacts and conclude that its operation is correct, particularly when used in conjunction with traditional methods [14,15].

Throckmorton [14] and Cerna [15] studied the validity and reliability of T-Scan III sensors under laboratory conditions, noting that reliability was high when used in consecutive measurements. Silva (2014) confirmed the high reliability of the sensor in consecutive measurements, as in our study [16].

Kerstein [17] related the size of the marks and the occlusal force with strips of articulating paper, he considered that reliability was only 21% and that to increase it, higher forces were needed [17]. Koos [9] assessed the accuracy and reproducibility of the T-Scan III to calculate the normal distribution of relative force in the dental arch and found that the difference between measurements and actual values were less than 2%. The method can, therefore, be considered sufficiently accurate and reliable [9].

Kerstein et al. have considered that, according to the available evidence, the computerised occlusal analysis system is the only occlusal indicator that displays the ability to quantify the force and time of occlusion in real-time from initial MIP contact to disclusion. The accuracy of displaying occlusal contacts makes this system a better occlusal indicator than other available conventional non-digital materials. Recordings of T-Scan’s occlusal analysis, if successful, can provide an objective view of the occlusion and its discrepancies. Subsequent publications have reported that T-Scan III shows good reproducibility of surface measurements and register of relative forces [18]. It is, therefore, endorsed as a good method of study, and even more so for this study, in which repeated measurements were made, with and without a splint.

The T-Scan III system is useful for calibrating occlusal contacts. Occlusal contact between the teeth is considered to exist when the interocclusal distance between the occlusion areas is less than 50 μm; while contacts close to occlusion occur when the distance is between 50 and 350 μm

For proper function, occlusal contacts must be synchronised with the stomatognathic system [19].

A wide variety of occlusal analysers have been used to record occlusal relationships between dental arches. In dental practice, the role of articulating paper has been the most commonly used diagnostic tool to identify the points of contact between the teeth of both arches. Paper can easily highlight or mark contact, but it cannot accurately quantify its intensity or measure the magnitude of the occlusal forces generated. It is the size of the marked area on the articulating paper that is used as an indicator of the occlusal load intensity [20].

Authors such as Saad, Weiner and Ehrenberg, Millstein, consider the interpretation of paper marks to be subjective and therefore inaccurate since similar occlusal loads correspond to marks of different intensity. The T-SCAN III computerised occlusal analysis system largely avoids subjectivity in the interpretation of the articular role [21,22].

T-Scan III occlusal analysis technology, while not being able to measure absolute bite force, does provide occlusal force times and variability, which can be quantified from the first point of contact to MIP when the subject bites on the occlusal sensor. The sensor thickness is 100 μm (0.1 mm), which is compressed up to 60 μm under the occlusion force. Due to the high compression capacity of the sensor, it provides bilateral contact during jaw movement.

The T Scan system allows accurate assessment of occlusion and disclusion times. The occlusion time, which runs from the first contact during closing to full intercuspation (Koos, 2010), is mostly conditioned by dental morphology. Furthermore, the canines and first premolars play a crucial role in leading teeth to contact [9].

The posterior disclusion time (D.T.) was defined by Kerstein and Wright as the elapsed time for all molar and premolar posterior teeth to separate from each other during a single excursive movement performed in one direction; right, left, or protrusive.

Several studies have shown that with treatments that minimise disclusion time to less than 0.5 s per excursion, it is possible to reduce pain and dysfunctional muscle symptoms quickly, both in frequency and intensity. This improvement was maintained during the observation time of the studies [13].

In this study, it has been confirmed in records taken with stabilisation splints in right/left laterality and protrusion movement that disclusion times decrease, and pain also decreased in most subjects.

In our study, patients showed decreased pain on the VAS scale when evaluated one month after the installation of the stabilisation splint.

Kerstein (2016) also related disclusion time to symptomatology, proving that a reduction of fewer than 0.4 seconds per excursion is effective in reducing symptoms of myofascial pain [23].

Modifying an occlusal scheme by shortening disclusion time can be achieved through the occlusal adjustment process known as Immediate Complete Anterior Guidance Development (ICAGD). In the study that developed this method, significant reductions in myofascial pain muscle symptoms were found, which began even after the first day of treatment. When comparing the right and left excursive disclusion times of 100 pre- and post-treatment patients with ICAGD, several conclusions were reached. First, that time of disclusion in excursive movements, if prolonged can result in symptoms of myofascial pain. Reducing disclusion times in left and right laterality movements below 0.4 seconds per excursion decreases symptoms of myofascial pain. When patients with myofascial pain are treated using the ICAGD technique, which uses T-Scan III computerised occlusal analysis to measure the correctness of the outcome of ICAGD treatment, symptomatology will improve rapidly.

Thus, treatment based on reducing disclusion time by applying the ICAGD method is a new therapeutic possibility for patients with dysfunction and myofascial pain. After the installation of the stabilisation splint, disclusion times are shortened, creating a new occlusal scheme, and establishing new guides for excursive movements [24].

It has been shown that the longer the back teeth are in occlusion during a jaw excursion, the greater the friction that occurs. This leads to temporal and masseter muscle hyperactivity, contributing to the occlusal pain and muscle symptomatology of TMDs. High disclusion times of more than 1.39 seconds significantly increase contractile muscle activity [25]. When these disclusion times are reduced, below 0.5 seconds, (<0.5″) contractility is significantly reduced, reaching values close to those of the resting state. It has been observed that with a coronoplasty, disclusion time can be shortened by 0.5 seconds per excursion.

In our study, coinciding with these observations, disclusion times decreased considerably in the different excursive movements with the splint.

Finally, the T-Scan system provides data relevant to the assessment of the distribution of force percentages in the different sectors of the dental arches. Misirlioglu et al. have suggested that T-Scan is a successful diagnostic device for detecting premature contacts and excessive occlusal forces [26].

T-SCAN III analyses the order of occlusal contacts while simultaneously measuring the percentage changes in the force of those same contacts, from the moment the teeth begin to make occlusal contact to central occlusion intercuspation. It shows abnormal forces that lead to trauma or pain in each tooth in the dental arch. This helps to balance forces on both sides of dentition [27].

Kerstein RB et al. consider the T-SCAN III system to be a highly accurate technique for studying and analysing occlusal relationships.

KERSTEIN et al., by synchronising computerised occlusal system data with electromyography, observed that it was possible to detect muscle dysfunction through the centre of force patterns and timing of disclusion. They also determined that the T-Scan III system can provide an accurate and definitive diagnosis of occlusal force balance and chewing muscle function for the clinician and is a comprehensive educational tool for the patient undergoing occlusal balance procedures [28,29].

Treatment with stabilisation splints is most commonly indicated for any of the following; TMDs, bruxism, and myofascial pain.

Scientific and health organisations in the United States; the National Institutes of Health-National Oral Health Information Clearing House (NIH-NOHIC), the American Academy of Oral Pain (AAOP), the American Association Of Oral and Maxillofacial Surgeons and the American Academy of Craniofacial Pain (AACFP), recommend short-term stabilisation splint therapy without occlusal changes as a treatment for TMD (Clark and Minakuchi, 2006).

Montgomery considers the T-Scan III system an element of routine analysis of occlusal physiology and its relationship to adjacent oral musculature. He concludes that T-Scan III is a precise method that, in a computerised manner, records occlusal contacts, generating a dynamic video that allows identification of the percentage of occlusal force per tooth, dental arch and quadrant. This procedure enables occlusal adjustment to be performed with greater precision, allowing functionally balanced restorative treatments, facilitating muscle activity and balancing periodontal support [30].

Ferrario et al. compare electromyography records in patients with and without stabilisation splints and find a significant decrease in the activity of the masseter and temporal muscles in the records of maximum intercuspation with the splint. They also observe a greater balance between both right and left sides, and an increase in masseter muscle activity compared to the anterior temporal muscles [31].

Thus, the results of this T-scan III study show that the installation of a stabilisation splint promotes balance in the distribution of forces. The splint tends towards symmetry between both sides of the dental arch, which is also confirmed by electromyography. On the other hand, the loads are redistributed, increasing the percentages of occlusal force over the premolar zone, relative to the rear area of molars. These results in an increase in masseter muscle activity compared to the previous temporal one, favouring balance in the joint activity of the muscles.

In conclusion, we can establish that the disclusion times in the excursive movements of left/right and protrusive laterality are reduced after the installation of the stabilisation splint. It is also observed that the distribution of forces between the two dental arches tend to be balanced after the installation of the splint. As for the percentages of forces at the anterior (premolar) and posterior level (molars), it is observed that there is a very clear difference, so the percentages of force between the two sectors tend to be balanced.

Given the results of this study, it can be said that the T-Scan III system provides useful information for the adjustment of the stabilisation splint in each patient, looking for guides with disclusion times of less than 0.4 seconds and a balance in the distribution of force percentages, providing orthopedic stability to the chewing apparatus.

References

  1. Dworkin SF, Burgess JA (1987) Orofacial pain of psychogenic origin: current concepts and classification. J Am Dent Assoc 115: 565-571. [crossref]
  2. Manfredini D, Winocur E, Guarda-Nardini L, Paesani D, Lobbezoo F (2013) Epidemiology of bruxism in adults: a systematic review of the literature. J Orofac Pain 27: 99-110. [crossref]
  3. Manfredini D, Lobbezoo F (2010) Relationship between bruxism and temporomandibular disorders: a systematic review of literature from 1998 to 2008. Oral Surg Oral Med Oral Pathol Oral Radiol Endodontol 109: 26-50. [crossref]
  4. Svensson P, Jadidi F, Arima T (2008) Relationships between craniofacial pain and bruxism. J Oral Rehabil 35: 524-547. [crossref]
  5. Rossetti LMN, de Araujo CDRP, Rossetti PHO, Conti PCR (2008) Association between rhythmic masticatory muscle activity during sleep and masticatory myofascial pain: a polysomnographic study. J Orofac Pain 22: 190-200. [crossref]
  6. Blanco Aguilera A, Gonzalez Lopez L, Blanco Aguilera E, De la Hoz Aizpurua JL, Rodriguez Torronteras A, et al. (2014) Relationship between self-reported sleep bruxism and pain in patients with temporomandibular disorders. J Oral Rehabil 41: 564-572. [crossref]
  7. Afrashtehfar KI, Qadeer S (2016) Computerized occlusal analysis as an alternative occlusal indicator. Cranio 34: 52-57. [crossref]
  8. Kerstein, RB (2001) Current applications of computerized occlusal analysis in dental medicine. Gen Dent 49: 521-30. [crossref]
  9. Koos B, Godt A, Schille C, Goz G (2010) Precision of an instrumentation-based method of analyzing occlusion and its resulting distribution of forces in the dental arch. J Orofac Orthop 71: 403-410. [crossref]
  10. Guías DC/TMD. Sschiffman, Ohrbach, Truelove, Oook, Anderson, Goulet et al. (2014).
  11. Paesani D (2010) Bruxism: Theory and practice. Reino Unido: Quintessence Publishing.
  12. Haralur SB (2013) Digital evaluation of functional occlusion parameters and their association with temporomandibular disorders. J Clin Diagn Res 7: 1772-1775. [crossref]
  13. Berger AL, Szalewski B, Szkutnik A, Michał Ginszt (2016) Correlation between generalized joint laxity and symptoms of temporomandibular disorders]. 40: 248-251. [crossref]
  14. Throckmorton GS, Rasmussen J, Caloss R (2009) Calibration of T-Scan sensors for recording bite forces in denture patients. J Oral Rehabil 36: 636-643. [crossref]
  15. Cerna M, Ferreira R, Zaror C, Navarro P, Sandoval P (2009) Validity and reliability of the T-Scan III for measuring force under laboratory conditions. J Oral Rehabil 42: 544-551. [crossref]
  16. da Silva M, Caramelo F, Ramalho J, Gomes P (2014) In vitro study on the sensibility and reproducibility of the new T-Scan III HD system. Rev Port Estomatol Cir Maxilofac 55: 14-22.
  17. Kerstein RB (2008) Articulating paper mark misconceptions and computerized occlusal analysis technology. Dent Implantol Update 19: 41-46. [crossref]
  18. Cohen-Levy J (2015) Orthodontic T-Scan applications. In: Kerstein RB, editor. Handbook of research: computerized occlusal analysis technology applications in dental medicine. 2: 523-561.
  19. Owens S, Buschang PH, Throckmorton GS, Palmer L, English J (2002) Masticatory performance and areas of occlusal contact and near contact in subjects with normal occlusion and malocclusion. Am J Orthod Dentofacial Orthop 121: 602-609. [crossref]
  20. Carey JP, Craig M, Kerstein RB, Radke J (2007) Determining a relationship between applied occlusal load and articulating paper mark area.Open Dent J 1:1-7. [crossref]
  21. Saad MN, Weiner, Ehrenberg D, et al. (2008) Effects of load and indicator type upon occlusal contact markings. J Biomed Mater Res B Appl Biomater 85: 18-22. [crossref]
  22. Millstein P, Maya A (2001) An evaluation of occlusal contact marking indicators. A descriptive quantitative method. J Am Dent Assoc 132: 1280-1286. [crossref]
  23. Kerstein, RB, Radke J (2006) The effect of disclusion time reduction on maximal clench muscle activity levels. Cranio 24: 156-165. [crossref]
  24. Thumati P, Thumati R.P (2016) The effect of disocclusion time‑reduction therapy to treat chronic myofascial pain: A single-group interventional study with 3 year follow‑up of 100 cases. The Journal of Indian Prosthodontic Society 16: 234-241. [crossref]
  25. Kerstein, RB (1995) Treatment of myofascial pain dysfunction syndrome with occlusal therapy to reduce lengthy disclusion time – a recall evaluation. Cranio 13: 105-115. [crossref]
  26. Misirlioglu M, Nalcaci R, Baran I, Adisen MZ, Yilmaz S (2014) A possible association of idiopathic osteosclerosis with excessive occlusal forces. Quintessence Int 45: 251-258. [crossref]
  27. Afrashtehfar KI, Qadeer S (2016) Computerized occlusal analysis as an alternative occlusal indicator. Cranio 34: 52-57. [crossref]
  28. Kerstein, RB (2004) Combining technologies: a computerized occlusal analysis system synchronized with a computerized electromyography system. Cranio 22: 96-109. [crossref]
  29. Kerstein RB, Radke J (2012) Masseter and temporalis excursive hyperactivity decreased by measured anterior guidance development. Cranio 30: 243-254. [crossref]
  30. Montgomery MW (2011) T-Scan dental force analysis for dental examination. Dent Today 18: 46.6.
  31. Ferrairo V, Sforza C, Tartaglia M (2002) Immediate effect of stabilization splint on masticatory muscle activity, in temporomandibular disorder patients. J Oral Rahabil 29: 810-815. [crossref]

Disease, Duration and Death

Abstract

Life has always been threaten by diseases, calamities, catastrophes leading to death caused by various known or unknown, animate or inanimate objects in human’s relatively medium life span. Ever since the documentation of the human history, it is well known that man loved their body and prefer to live in accordance with their wishes. When rationale judgment became prominent after the experiences and observations of life and death events, they started searching remedies such as medicine. This is how medicine evolved since our early civilization. With the development of reason, logic, observation, experimentation and practical application, we learned tremendous ways of saving body, brain and behavior. However, as time passes human environment changes unpredictably leading to change in human behavior and attitude towards objects/materials and living beings. It is not only a matter of physical, biological or cosmic change but also behavior of everything that brought unprecedented events such as unexpected war, epidemic, catastrophes etc. leading to death [1,2]. Measurement of several physical parameters of human and universal bodies has become routine but various functions/characters in relation to time has yet to measure fully. This is the point we fall short to save humans promptly resulting high number of unexpected loss of life such as in COVID-19 pandemic. Among 1554960 covid-19 infected population in more than 209 countries, territories and two conveyances 5.9% died, and among the deaths more than 80% occurring in just 10 countries (USA, Spain, Italy, Germany, France, China, Iran, UK, Belgium, Netherlands) of the world in the last three months duration [2].

Disease is an abnormal architecture/anatomy, function, condition of the body and mind in a specific duration. Many times and circumstances death occurs due to unprecedented cause, behavior or ignorance. Therefore, it is essential to know the unknown environment and diverse nature and behavior of human beings to diagnose epidemicity of the disease. Despite vast scientific discoveries and new achievement, there is a big hole in the measurement of core human behavior and intelligence. Human body, intelligence and behavior plays a great role in the defense mechanism as well as association in the causation, development, cessation of disease in specific duration in specific place/s. So far we are devoid of the precise knowledge on the creation of covid-19 however many scientists have been trying to explore the mystery of the occurrences, nature and impact on the human population of the globe [3].

The duration or natural course of illness or diseases is important in the management of cases, carrier as well as prevention of complications and death [4]. Alert researchers identify the key factors of the disease when there is sudden rise of cases of similar features in a short period. Ignorance about the nature of pathogen and ignorance of the general population about the disease leads to higher number of deaths in a very short duration. Lack of alertness in changing behavior and environment of the disease in the population further complicates its management and increases the number of deaths. The challenge of the new disease, ignorance on the part of environment and human behavior help to expand disease dimensions in terms of time, place and person.

Opportunities such as chance, experience, observation and experimentation lead to discovery and development of medicine and care system that can make our life easier, comfortable and lengthier. This is the beauty of medical discipline, research and practice in human population. A dynamic patience where a body and brain searches a remedy continuously in response to disease is probably the best stimulus to initiate new knowledge, skills, practice to cure patient and prevent death. Lack of precise knowledge of duration and the nature of the disease is biggest obstacles in managing covid-19 at present and many more diseases that are possible in the future. Following the spread of disease and management of the patient (source) meticulously in global environment, recording the evidences and continuous sharing among the fellow researchers and responsible individuals are the most important aspects of pandemic control.

Alertness, continuous searches, dynamic patience can help humans to increase its capacity to deal with covid-19 pandemic. Change in seasonality in different geographical regions may affect duration of the diseases and distribution of death in humans. This demands thinking globally and acting globally.

Keywords

Covid-19, Death, Disease, Duration, Pandemic

References

  1. Riedel S (2004) Biological warfare and bioterrorism: a historical review. BUMCProceedings17: 400-406. [crossref]
  2. Covid-19 Coronavirus Pandemic, Worldometer. Accessed on April 09, 2020, 16:30 GMT.
  3. Zhou P, Yang X, Wang X, Hu B, Zhang L, et al. (2020) A pneumonia outbreak associated with a new coronavirus of probable bat origin. Nature579: 270-273. [crossref]
  4. Rothan HA,ByrareddySN (2020) The epidemiology and pathogenesis of coronavirus disease (COVID-19) outbreak. Journal of Autoimmunity109: 102433. [crossref]

We Should Forget about COVID-19 Vaccine: MMR is the Viable Safe Remedy

DOI: 10.31038/SRR.2020315

Introduction

A lot of hope hangs on the SARS-COV-2 vaccine. This new virus has raked up unimaginable deaths in a short period of time (over 900,000). Although this is not in the same scale as pandemic Spanish flu of 1918 (50,000,000 within 2 years), it has outflanked SARS COV (774 deaths) and MERS-COV (858 deaths). And SARS-COV-2 is still in action worldwide. There are various groups working worldwide to develop a vaccine. The world has never developed an effective vaccine for the flu. Typically, vulnerable adults are immunized every year, perhaps because of the large variety of these flu viruses. The best known vaccines are the Measles, Mumps and Rubella (MMR) which have been around since 1971, and their effectiveness and safety are established. However, few people know that it took more than 20 years to show that the best known safe vaccines can be relied upon.

A COVID-19 vaccine needs to have three features. Firstly, the COVID-19 vaccine must be effective. This means that it can stimulate the immune system to make IgG antibodies, the immunity soldiers of the body. Hopefully, these IgG antibodies must last forever to amount to immunity. This might require one or more vaccinations as in MMR. At the moment, there is a slight concern that these COVID-19 IgG antibodies do not have longevity that can amount to immunity. Secondly, the COVID-19 vaccine must be safe in the short-term and thirdly, safety in the long-term. If it is not trialed in the long term, how can we be reassured that the individuals looking for protection from the severe outcomes of COVID-9 infection will not suddenly go ‘blind’ 10-15 years afterwards, for example? It is not an anecdote that it took 21 years to declare Measles vaccine safe.

What are the natural possibilities for the prevention of serious SARS CoV-2 outcomes?

  1. That SARS CoV-2 will behave like SARS CoV and burn itself out within 1 year.
  2. That SARS CoV-2 will behave like MERS-CoV and burn itself out within 2 years.
  3. The protection of COVID-19 vaccine.
  4. Mass immunization with Measles, Mumps and Rubella.

Proposals

We should stop dreaming and waiting for SARS-CoV-2 vaccine because of safety issues. Notwithstanding disruptions in current trials, the foremost vaccine from Oxford, UK has been suspended twice for short term safety problems. These problems will affect other vaccines on volunteers. And the people of the world would despair because the world expects a ‘vaccine’ soon to sort it all. We propose that the world should look at an available plausible alternative of mass immunization with MMR for the following reasons principally based on the medical concept of cross-immunity:

1. Scientific Basis

There is a scientific link between MMR and COVID-19. Kodzius et al. [1] proposed that MMR vaccination may be able to protect children from COVID-19 because of their discovery of a sequence similarity of the 30 amino acid residues between glycoproteins of SARS-COV-2, Measles and Rubella viruses. They followed this hypothesis along the lines that the antibodies produced in children due to the MMR vaccine could recognize some protein parts (epitopes) on the SARS-CoV-2 spike proteins”. They theorised that these antibodies, particularly in the epithelial layer of respiratory airways, block binding and entry of the virus into the cells”.

Kodzius et al. were inspired by the immunological principle based on the antibody cross-reaction recognizing antigens in two different microbes. They looked for homology sequence in SARS-CoV-2 and the viruses that commonly are prevented by vaccination during childhood. It was discovered that 30 amino acid residues share similarities between the Spike (S) glycoprotein of the SARS-CoV-2 virus and the fusion glycoprotein of Measles virus as well as with the envelope glycoprotein of the Rubella virus. These initial findings have been supported by other epidemiological studies [2], including proposals for a plausible explanation in cross-immunity protection [3].

2. Epidemiological Evidence

There are corroborating epidemiological evidence. Belgium has one of the highest rates of COVID-19 deaths worldwide. This has now been linked to the absence of Measles, Mumps, and Rubella (MMR) immunization in Belgium in the 1980 and 1990 [4]. Similar to countries like Nigeria with massive attacks of Measles and widespread adoption of the MMR vaccine since 1971 and which now show very low level relative rates of COVID-19 mortality rates (5/million population) [5].

3. Recent Mass Immunizations against Measles

The other group of countries with the lowest rates of COVID-19 deaths are those that have been involved with mass immunizations with MMR because of recent epidemics of Measles, example in Samoa 0/million population, Singapore 4.7/million population, Madagascar 6.8/million population and Hong Kong 11.4/million population as of early 2020 [6].

This proposal for mass immunization has immediate advantages worldwide because it has been spread by the WHO to the remotest parts of the world. More importantly, it is very safe. World Health [7] maintains that evidence continues to add up demonstrating that the commonly available MMR vaccine could be the key to stopping the COVID-19 pandemic quickly, allowing much of the world to get back to business as usual within months. There is no doubt that the MMR vaccine is safe and that mass immunization with the MMR vaccine is feasible even as progress continues on developing a specific SARS-Cov-2 vaccine.

References

  1. Sidiq KR, Sabir DK, Ali SM, Kodzius R (2020) Does early childhood vaccination protect against COVID-19? Mol Biosci.
  2. Escriou N, Callendret B, Lorin V, Combredet C, Marianneau C, et al., (2014) Protection from SARS coronavirus conferred by live Measles vaccine expressing the spike glycoprotein. Virology 452-453.
  3. Young A, Neumann B, Mendez RF, Reyahi A, Joannides A, et al., (2020) Homologous protein domains in SARS-CoV-2 and Measles, Mumps and Rubella viruses: Preliminary evidence that MMR vaccine might provide protection against COVID-19.
  4. Gold JE, Tilley LE, Baumgartl WH (2020) MMR vaccine appears to confer strong protection from covid-19: few deaths from sars-cov-2 in highly vaccinated populations. Rubella Component of MMR Vaccine may Prevent Death or Severe Disease.
  5. Corona Virus Deaths in Nigeria.
  6. wordometer.com
  7. World Health, 11/5/2020.
fig 1

How Long Does the IgG Protection of COVID-19 Last? Three Case Reports

DOI: 10.31038/SRR.2020314

Introduction

It is assumed that the presence of Anti-SARS CoV-2 IgG antibodies will show some contact with COVID-19 virus perhaps after a few weeks. However, it is not yet decided as for other viral infections like Measles, Mumps and Rubella whether the presence IgG has a lot of meaning, like the presence of immunity. We report on three cases which might shed some light on this. We were interested mainly on the relationship between positive IgG antibody SARS CoV-2 results and future SARS CoV-2 immunity. Would a positive Anti-SARS CoV-2 mean immunity for this new disease? The expectation is that if Anti-SARS CoV-2 IgG antibodies last forever after detection or vaccination, like Measles, Mumps or Rubella IgG, they will provide immunity.

Case 1

A 26 year old man developed indistinct symptoms of sore throat for 3 days after visiting his grandparents in March 2020. His grandmother died in March 2020 from COVID-19 infection. His grandfather was Anti-SARS CoV-2 IgG positive. This gentleman had two Measles, Mumps and Rubella vaccinations as a child. In April 2020, he tested positive for contact with SARS-CoV-2 IgG. However a repeat test 8 weeks later showed a negative IgG Anti-SARS CoV-2 IgG.

Case 2

A 50 year old woman had indistinct symptoms. She tested positive with Anti-SARS-CoV-2 IgG. A repeat test, 5 weeks later to assist her daughter take the test was again positive. A subsequent test after 13 weeks was negative for Anti-SARS CoV-2 IgG.

Case 3

An 82-year old man, grandfather of Case 1 developed indistinct symptoms of sore throat for 3 days. His wife died in March 2020 from COVID-19 infection when his Anti-SARS CoV-2 IgG was positive. A repeat test 20 weeks later showed that his Anti-SARS CoV-2 IgG was negative.

Literature Review

Unlike Measles, Mumps and Rubella, where a combination of clinical infection and vaccinations can provide life-long immunity, it has not been confirmed that clinical or Anti-SARS CoV-2 IgG provides life-long immunity. In fact, this is not considered to be likely from knowledge of SARS-CoV which expired itself after 1 year and MERS CoV which expired itself after 2 years. A positive test result shows you may have antibodies from an infection with the virus that causes COVID-19 illness, or possibly from infection with a related virus from the same family of viruses (called Coronavirus), such as one that causes the common cold.

We do not know yet if having antibodies to the virus that causes COVID-19 can protect someone from getting infected again or, if they do, how long this protection might last. You might test positive for antibodies even if you never had symptoms of COVID-19. This can happen if you had an infection without symptoms (also called an asymptomatic infection) (Figure 1).

fig 1

Figure 1: Family tree of case 1.

Discussion

Our three cases demonstrate that Anti-SARS COV-2 IgG antibodies did not persist at 8 weeks, 13 weeks and 20 weeks respectively when the positivity of Anti-SARS COV-2 IgG antibodies was challenged for various reasons. This suggests that the immunity associated with IgG antibodies in other viral infections may not be immediately present even in the short term. This opens the door for repeated infections. This might also limit the value of a COVID-19 vaccine. It might direct us to more than one vaccination if SARS Cov-2 lasts longer than SARS CoV and MERS CoV.

The concept of sero-conversion is not new and might explain the events we have noticed with positive to negative results, with positive results reverting to negative results. What the potential of persistent infections and serious outcomes holds in future depends firstly on the behavior of the virus. If SARS CoV-2 dies out like SARS CoV and MERS CoV, then this problem will self-limit? If not, what other options do we have? One potential option is the COVID-19 vaccine. The third option is based on mass Measles, Mumps and Rubella (MMR) immunization. There is a logical rationale based on the similarity of COVID-19 proteins and Measles viruses [1,2] and similarly with Rubella virus [3]. Onwude and Sokunbi have submitted that Mass immunization with MMR vaccine is a potential option [Submitted to Lancet 10/9/2020].

References

  1. Sidiq KR, Sabir DK, Ali SM, Kodzius R (2020) Does Early Childhood Vaccination Protect Against COVID-19? Mol Biosci.
  2. Escriou N, Callendret B, Lorin V, Combredet C, Marianneau C, et al. (2014) Protection from SARS coronavirus conferred by live Measles vaccine expressing the spike glycoprotein. Virology 452-453. [crossref]
  3. Young A, Neumann B, Mendez RF, Reyahi A, Joannides A, et al. (2020) Homologous protein domains in SARS-CoV-2 and Measles, Mumps and Rubella viruses: preliminary evidence that MMR vaccine might provide protection against COVID-19.
fig 1

Linearity in Transmission of COVID-19 Infections: A Study of Families Undergoing IgG Antibody Tests

DOI: 10.31038/SRR.2020313

Introduction

Most people accept that COVID-19 is very infectious which is why in the United Kingdom, it is recommended and accepted that individuals who have been in contact with those with proven clinical COVID-19 should isolate for 14 days. Similarly this is the basis of the quarantine rule-if an individual has been in contact with a proven clinical case travelling into the UK. It is assumed that the clinical infection will have shown by 14 days. This also assumes that infectivity is linear after close and significant contact, at least for 30 minutes.

However, measles has always been one of the most contagious diseases. In fact, to quantify this infectivity, if 100 susceptible people are in a room with someone who is infected, 90 of them are likely to become ill with measles. Further, if someone who has not had measles enters an elevator or other small space up to two hours after an infected person has left, they can still “catch” measles. There is no doubt that the COVID-19 virus affects children and adults. Unusually, the level of infectivity does not directly correlate with clinical symptoms, as an explanation for asymptomatic individuals. It is now generally accepted that infected individuals may be asymptomatic.

Some risk factors have been observed with COVID-19 deaths. These include much older age, diabetes mellitus, immune disorders, renal diseases, cancer, BAME individuals and even asthma. However an association, for example between diabetes and COVID-19 deaths does not mean that diabetes has a plausible way of exposing COVID-19 patients to COVID-19 deaths. In epidemiological parlance, association does not mean cause. The observations between the current risk factors and COVID-19 deaths are very tenuous because of the implausibility, except for much older age. It is a clinical curiosity that some individuals who have had classical clinical manifestations who do not need to attend a hospital might not show any evidence of IgG awareness subsequently. However, there are currently no reports of IgG antibody status in clinically proven cases.

SARS-CoV-2 infection is a major killer of adults, particularly older adults. So far it has killed 190,000 American adults and over 41,586 United Kingdom adults, and many more worldwide. So far there have only been 6 childhood deaths under the age of 16 years. What is so special about SARS-COV-2 infection that excessively affects the mortality of much older adults but does not seem to proportionately affect the mortality of children? This is a legitimate clinical curiosity. This Corona SARS-COV-2 virus, in the same class as Measles, Rubella, Polio and Mumps is a child’s virus but has not caused the havoc of measles, in childhood deaths. It is now widely accepted that SARS-CoV-2 infection does not cause massive mortality in children.

To assess the infectivity of SARS-COV-2, this investigative study sought to assess the infectivity potential between close family relations of those who have come in contact with COVID-19 virus using IgG assessments within members of families living together.

Hypothesis

SARS-V-2 infection is assumed to be very infectious. If so, we expect a high infection rate, identified with Anti-SARS CoV- 2 IgG antibodies. We explored this through family trees of IgG tests. The ultimate outcome is to assess whether members of a family living together will get the infection from symptomatic or even from asymptomatic relatives.

Methods

We explored the results of Anti-SARS CoV-2 IgG antibodies in families to assess the likelihood of multiple members of a family having a positive Anti-SARS CoV-2 IgG antibodies. A linear relationship of infectivity is defined for our purposes as positive results between family members living together. The assumption is that if COVID-19 is as highly infectious and transmitted with causal contact, say on a flight or contact within a household, various members of a family will demonstrate evidence of contact through positive Anti-SARS CoV-2 IgG antibodies (Figure 1).

fig 1

Figure 1: Clinical and IgG status.

Results

In Table 1, we present the results of the assessment of linear relationships between family members based on IgG results of contact with COVID-19. Of the 39 reported families, there were 11 linear relationships (28% infection rate) where more than one member of a family have both shown IgG evidence of contact with SARS CoV-2 or COVID-19 infection. In Table 2, we summarise that 11/39 (28%) families showed more than one person in a family with positive IgG antibodies. In 28/39 families (72%) there was no evidence of linearity. The odds of linearity was similar for both groups [Odds Ratio = 1].

Table 1: Report of IgG Status in Families who wished to be tested for contact with SARS-Covid 2 IgG Antibodies.

Family

Grandmother Grandfather Mother Father Son 1 Son 2 Daughter 1 Daughter 2

Comment

1 Died of Covid-19 IgG positive IgG Negative IgG positive IgG positive n/a ?? IgG Negative

Not linear

2

n/a n/a IgG Negative IgG positive IgG positive IgG Negative IgG Negative n/a Not linear

3

n/a n/a IgG positive IgG Negative n/a n/a IgG Negative n/a

Not linear

4 n/a n/a IgG positive IgG positive n/a n/a IgG positive n/a

Linear

5

n/a n/a IgG positive IgG Negative IgG positive n/a IgG Negative n/a Not linear
6 n/a n/a IgG positive IgG positive n/a n/a IgG positive IgG positive

Linear

7

n/a n/a IgG positive IgG positive IgG positive n/a n/a n/a Linear
8 n/a n/a IgG positive IgG positive IgG positive IgG positive n/a n/a

Linear

9

n/a n/a IgG Negative IgG Negative IgG Negative IgG positive IgG Negative n/a Not linear
10 n/a n/a IgG positive IgG Negative IgG Negative n/a IgG positive IgG positive

Not linear

11

n/a n/a IgG positive IgG positive n/a n/a IgG Negative IgG positive Not linear, Nanny IgG negative
12 n/a n/a IgG Negative IgG Negative IgG Negative n/a IgG positive n/a

Not linear

13

n/a n/a IgG positive IgG Negative n/a n/a n/a n/a Not linear
14 n/a n/a IgG Negative IgG Negative IgG positive n/a n/a n/a

Not linear

15

n/a n/a IgG positive IgG positive n/a n/a n/a n/a Linear
16 n/a n/a IgG Negative IgG positive n/a n/a n/a n/a

Not linear

17

n/a n/a IgG Negative IgG positive n/a n/a n/a n/a Not linear
18 n/a n/a IgG Negative IgG positive n/a n/a n/a n/a

Not linear

19

n/a n/a IgG positive IgG Negative IgG positive n/a IgG positive n/a Not linear
20 n/a n/a IgG Negative IgG positive n/a n/a n/a n/a

Not linear

21

n/a n/a IgG positive IgG positive n/a n/a n/a n/a Linear
22 n/a n/a IgG positive IgG positive n/a n/a n/a n/a

Linear

23

n/a n/a IgG positive Died of Covid n/a n/a IgG positive n/a Linear
24 n/a n/a IgG positive

IgG Negative

n/a n/a n/a n/a n/a

Not linear

25

n/a n/a IgG Negative IgG positive n/a n/a n/a n/a Not linear
26 n/a n/a IgG Positive n/a n/a n/a IgG Negtive n/a

Not linear

27

n/a n/a IgG Negative IgG positive n/a n/a n/a n/a Not linear
28 n/a n/a IgG Negative IgG positive IgG Positive IgG Negative IgG Negative n/a

Not linear

29

n/a n/a IgG Negative n/a n/a IgG Positive n/a n/a Not linear
30 n/a n/a IgG positive IgG positive n/a n/a n/a n/a

Linear

31

n/a n/a n/a IgG positive IgG positive n/a IgG Negative n/a Not Linear
32 n/a n/a IgG Negative IgG positive n/a n/a n/a n/a

Not linear

33

n/a n/a IgG positive IgG positive n/a n/a IgG positive n/a Linear
34 n/a n/a IgG positive IgG positive n/a n/a IgG positive n/a

Linear

35

n/a n/a IgG Negative IgG positive IgG Negative n/a IgG Negative n/a Not linear
36 n/a n/a IgG Negative IgG positive n/a n/a n/a n/a

Not linear

37

n/a n/a IgG Negative IgG Negative IgG positive IgG positive n/a n/a Not linear
38 n/a n/a IgG positive IgG positive IgG Negative n/a n/a n/a

Not linear

39

n/a n/a IgG positive n/a n/a n/a IgG Negative n/a

Not linear

Note: n/a not applicable.

Table 2: Statistical summary of linear relationships.

Proportions

Linearity Non-Linearity

Odds Ratio

11/39 (28%)

28/39 (72%)

1

Conclusion

In this family tree study, 28% of families showed evidence of a potential linear transfer of infection of COVID-19 to others in their household. Based on our definition of linearity, there is no significant evidence to suppose that prior contact with COVID-19 of a member of the family translates to a high linear infection in close contacts (Odds Ratio = 1.0). This is the first study that casts doubt on the assumed degree of infectivity of COVID-19. It is certainly not in the category of measles. There is one possible explanation, that IgG antibodies do not measure casual contact in this situation. It is also possible that IgG positive antibodies can sero-convert to IgG negative antibodies within short period of time. Certainly this was suggested in Wuhan [1] where people who had definite contact with clinical relatives with clinical COVID-19 patients yet they showed no serological evidence of contact with COVID-19.

References

  1. Lu X, Zhang L, Du H (2020) For the Chinese pediatric novel coronavirus study team. N Engl J Med 382: 17.
fig 2

Sea and Ocean Generated Coral Made Nonreactive Dinner Sets for Creating Feel Good and Wellness

DOI: 10.31038/AFS.2020224

Abstract

Food prepared for keeping feel good and wellness, thus ready for dining has ions which get quickly one to one neutralized or undesirably charged. Hence, use of non-reactive vessel for keeping prepared and ready for dining has to be kept in non-ionic non-reactive vessels is scientifically advisable for deriving full benefits of nutrition contained in meal prepared for breakfast, lunch and dinner. This research brings a new insight of food and health and use of non-reactive vessels, which will find scientific justification for vessels and discarding use of vessels made from different metals, particularly, most popular now prevalent a day’s steel. The new non-reactive vessel is coral based in India. This emphasizes a justification of harnessing vast sea and marine areas for deriving coral form it with plentiful employment and market. The inland water bodies store long time deposited clays and silt which will find its new use in creating low cost such non-reactive vessels affordable by different groups of gentry and households. Thus, vast spread of ocean and marines can be explored for production and harnessing of coral for creating nonreactive vessels and generating employment and business. New innovative use of marine biology will get to benefiting all gentry and save pressure on earth. This research establishes that earth can sustain in creating still large opportunity for application of various innovative technologies.

Keywords

Food and nutrition, Feel good and wellness, Non-reactive vessels, Coral made dining vessels and dinner sets and sea and marine aquaculture

Introduction

After food is made ready it is prepared for eating by planning for serving in vessels, plate and bowls etc which take some time in completing family dining. In the storage time some vitamins Vit C, Vit D, E and K known not to get reduced in cooking will get ionically neutralised or changed, hence food quality gets impaired [1-5] Therefore, such vessels should be non-reactive to eliminate last minute loss in nutrition. Many potteries have been fabricating such vessels, but their use gets set back of social stigma of poverty. These days steel based utensils have taken stock of share on dining part as a result of non-breakable feature and ease of washing. There has been lack of scientific attention on this fact that almost 10-20% of such ionic vitamins get lost or neutralized. The discrepancy in the vitamins cause hell of problems created to salt balance in the body maintaining homeostatic. These small shortfalls are not cared due to lack of scientific vision and people run after organic food. This is very reminding fact that even plants take their nutrition in ionic form so where is need of taking stand of organic food. In the earlier chapters organic seed spices were describe which can foster the taste of salt balance and micronutrients.

Materials and Method

Earth and Ocean

The planet Earth is a planet of oceans [6]. The total area of the Earth is approximately 510 million square kilometers and the oceans cover about 71 percent of the Earth’s surface, which is about 360 million square kilometers. There are a total of 5 oceans, and they are the Arctic, Pacific, Atlantic, Indian, and the Antarctic Ocean. Out of these five, there are three major oceans, the Atlantic, Pacific, and the Indian Ocean. They account for 90 percent of the area covered by oceans. The Pacific Ocean is the largest of oceans, its area is 181 million square kilometers, which covers nearly a third of the Earth’s surface. The Atlantic Ocean is the second largest, covering 94 million square kilometers, and the Indian Ocean is the third largest, covering about 74 million square kilometers. The oceans’ tremendous presence causes it to have a huge effect on the planet and our civilization. It is greatly responsible for the climate of the Earth. It regulates air temperature and supplies moisture for rainfall. The ocean also provides us with food, energy, minerals, and a cheap method of transportation. Without the oceans, the Earth wouldn’t be able to sustain life. The marine life have their preferred zone of habitation. The corals intensively grow in the oceans zones having slow waves and still water low depths and solar lights. The harnessing of costal sea such zone will bet revamped that will provide new material, product and employment and business which different from the marine fishery and shrimp harnessing. Thus development will make livelihood easy for people ling in the coastal areas.

Nutrient Particularly Vitamins Which is Lost can be Saved to Create Health and Wellness

Table 1 contains the ailment with development of vitamin deficiency lead to development of sickness of different degree of severeness. As such it may appear a simple fact but one can imagine its adverse or bad effect when one gets sick. Therefore, when it is known to happen, one is out to take all necessary precautions. This fulfils the legendary saying that prevention is better than cure. In exercising such prevention this book provides basic information, which should be adopted right from the time from when one comes to know.. The last columns of Table 1 provides long list. As an example a cursory review of the deficiency of vitamins leads to development of cancers of varying types, which is highly fatal and its treatments become unaffordable under many house hold and economic situations. This example serves that use of non-reactive vessels be made, particularly plate used for breakfast, lunch and dinner. It is necessary to keep in mind that milk is to be eaten and not be drink in its liquid form. Hence, use of nonreactive plate is highly scientifically advisable. In time when science was not known it would have been subject of awkward talks. But, now time has come, as created by this study that non-reactive vessels should be adopted for eating the meal of any event in all situation. When it comes to any feast of large gathering, it had been only plant leaf made unformed plates, viz. banana leaves and any wide leaf. This is evident that this situation has changed world over. This needs change for entire globe. The reduction in loss of vitamins will reduce such losses in provitamins and at the same time reduction in incidences of sufferings due to disease. Any one suffering will feel good and have some ease in difficult life (Table 1).

Table 1: Recommended daily dietary supplement of Vitamin adopted after Gupta [1].

Vitamins

Units of measurement Men Pregnant and lactating women Ionic Change

Ailments affecting health

  Mandatory
Vitamin A μ 5000 5000 +ve Immune functions, precarious lesions, (esophageal dysplasia, oral leukoplakia), cancer (breast)
Vitamin D μ 400 Osteoporosis, blood pressure
Vitamin E μ 30 30 +ve Cataracts, Immune fractions, (Children, elderly) Cancer (lung, all)
Vitamin C μ 60 60 +ve Cardiovascular (mortality, platelet functions) Cataracts, Iron absorptionsCardiovascular (high density lipo proteins, cholesterol, blood pressure, Peridontal disease, cold (symptoms).
Folic acid mg 0.4 0.8 -ve Immune function elderly, Birth defects,(neural tube defects, cleft lip/cleft) Precarious condition (Cervical dysplasia, bronchial sinuous meta plasia in smokers)
Thiamine mg 1.5 1.7  These vitamins get lost in pasteurization. Deficiency in such vitamins cause skeletal and mental disorders.
Riboflavin mg 1.7 2.0
Niacin mg 20.0 20.0
Vitamin B6 mg 2.00 2.50
Vitamin B12 μg 6.0 8.0
Optional
Vitamin D μ 400 Osteoporosis, blood pressure
Biotin μg 0.300 Not known Not clear
Pantothenic acid mg -ve 10.0 -ve Similar to Vit C

The vitamins get reduced by ionic change caused by metallic vessels. Reductions in vitamins have already occurred during cooking. Hence, any further, reduction is highly undesirable, which had not caught attention of public, in general. Although food has been getting eaten after six months of age onward one has not imagined that in one’s life time how much total vitamins have got lost. The losses in such vitamins have been giving way to different ailments and discomforts and rise in medical bills. There have been many ailments which have been given undue genetic cause. This is a tragedy of knowledge gap, hence people remained susceptible to suffer from diseases. Therefore, when scientific wisdom has come up it is highly justifiable to use non-reactive vessel for dining and derive good effects in terms of feel good and wellness.

Collection of Necessary Information in Preparation of the Manuscript

This author has been writing research on food and nutrition since 2014. He has brought several innovations on linking sea and marine for harvesting organic nitrogen, organic phosphoruss and has been contuing his endeavours towards bringing feel good and wellness. He has combined his research in the form of a book [5]. He again innovated his scientific attention on finding way how to save loss of vitamins which cause lot of ailments. In this new aspect of creating nonreactive vessel was devised. Thus scientific effort has culminated in this innovative article.

Results

Liability of Loss of Vitamins from Foods

There are various stages where vitamins get lost [1]. The vitamins soluble in water, particularly vitamins B complex, vit C and folic acid etc get de- ionized (Table 1). Among several diseases cancer is caused in one form or the other when there is vitamin deficiencies. Hence, saving in such vitamins will create lot of meaning of good health and wellness.

Essential Types of Non-Reactive Vessels

There have been lack of awareness of knowledge on the loss of vitamins, hence consideration on selection of vessels specially for keeping cooked meal and dining had not been selected on the bases of avoidance. The consideration of ease of cleaning, non-breakable and longevity of its rough uses have been the main consideration. The ailments due to loss in vitamins had not come up in imagination then. Now stage has been coming when such vitamin losses can be easily avoided where feel good and wellness is getting priority. Therefore, use of non-reactive vessels and dining set will be picking up with time. In this direction some non-reactive vessels had been brought in use, but it had no scientific backing. As now scientific backing is very strong and demanding saving loss of vitamins. The saving in loss of vitamins when its kept ready for dining, during dining as well as, when cooked meal is kept for next meal, lot of saving can be acquired. It is difficult to show physically the saving, but feel good, wellness and freedom from diseases will become index for gauging impact of such saving from the vitamin losses. These good developments will eliminate the many mis believes on ailments and disorders in physical and mental health. Reports already exist that one of every seventh person suffers from the mental disorders, implicating discrepancy of vitamin thiamin (B1) [1,4,7] Indian Council of Medical Research reported that one of every seven Indians are affected by mental disorders. Ladies in particular suffer mental bad effects due to food and nutritional discrepancy.

The Non-Reactive Vessels and Dining Sets

Coral Based Vessels

Most useable common vessels are eating bowls, and plates. It will not be out of context that even spoons should be also made from non-reactive vessel. Some innovative vessels are being prepared from agricultural residue. Some ideal non-reactive vessels are included here to exemplify the facts brought out here.

Clay Material Based Manufactured Crockry

Different sets of ideal non-reactive low cost vessels useable for dining (Figures 1a and 1b).

fig 1A

Figure 1a: Different sets of ideal non reactive coral vessels useable for dining.

fig 1b

Figure 1b: Different sets of ideal non reactive low cost vessels useable for dining.

Social Implications and Fostering Elimination of Neutralization Adverse Effect by Giving Gift of Non-Reactive Vessels

Once beginning is made with scientific reason and justification people will adopt this new vessel, which will pay dividends in due course of time, first by reduction of medical bill, keeping feel good and wellness. It is also elaborated in the book that the adequate vitamin will enable produce health and mentally sound offspings. Therefore, in order to enable this thing to happen a social culture blessing is enforced. In this social welfare all guests to the married couples should be given non-reactive coral made vessels. The gifted item will be highly useful for the recover for use for eating meals and keeping remaining food for the next time consumption. This fact and resulting development will sweep lot of ailments occurring due to deficiency in vitamins. It is visioned that lot of progress will be made in use of non-reactive vessels it is lot of precious resource would get saved which will come for welfare of community.

Generation of Basic Material from Marines

The globe is occupied by marine and sea even more than two third of surface. This vast resources must have been utilized in ways one might think in isolation for fishing and sea product. This chapter focuses that vast sea resource should be harnessed for use for fostering growth of coral, which will enable sufficient raw materials to be used in preparation of non-reactive vessels as brought under section 3.2 and 3.3. This new window will create employment and resources for the world and marketable semi durable vessels. This is a wonderful development. Although some processes are known, when world eyes look at the avenue some simple method of processing will come in use. Therefore, beginning made in this study will grow to become trees to provide prosperity in the global health (Figure 2).

fig 2

Figure 2: Coral from marines.

Utility of Clay Siltation Depositions in Water Bodies

Soil formation and erosion are earth surface processes which are highly variable. Countries have developed water conservation dam reservoirs under multipurpose projects viz irrigation, flood control, electricity generation and fisheries etc. The catchment areas have always been attempted with soil conservation measures in upland areas and silt detention structures to reduce siltation and save loss in water storage capacities. However, in spite of any level of efforts, the fine sediments viz clay and silt cannot be completely checked, meaning thereby large accumulation of clay it is silt deposit in such water bodies. This valuable deposits accumulating in water storage bodies, remained as a problem causing loss in storage capacity only, but it could not come to imaginations that these deposits could be extracted and economically utilized for making value added products and endless efforts have been made with expenditure of huge budget. Thus, this research is bringing new scientific vision in the present study that such clay and silt may be useable in preparation of pottery which will serve as nonreactive vessel. The utility of such non-reactive dinner sets have already been brought out in sectinns 3.3 and 3.4.

Thus, this dual benefit will create new work opportunity for the local people. Government of India had created Mahatma Gandhi National Rural Employment Guarantee Act (MNREGA) initiated in 2005, remain at the brink of existence. This act provides rural employment for 100 days work mostly in digging and excating earth in pond and allied water bodies. There has been nothing scientific advancementit remained mere social promoting scheme, which have been suffering of pros and conse with the change of governments. This innovative and ideal creates use of such materials will become new solution and making it very effective in using resource, creating employment generation and beneficial employment guarantee scheme under the MNREGA, which have been renamed at conveniences. There has been lot of political debates on the MNREGA but nothing scientific vision could emerge. Derivation of such silt and clay materials will be useable and silting water bodies will get ready for runoff water storage in the rainy season, which create ground water recharge and supplementary irrigation during intermittent droughts and safeguard country from adversities of climate change.

Enterprise of Manufacture of Non-Reactive Vessels and Coral Based Dinner Sets

The clay and silt deposits have been used in making earthen small pot by earth potter and to some extent in making clay based crockery. Such ventures have been rather on traditional fashion and had no scientific backing. This research is giving scientific backing which will ease and improve feel good and wellness of people. Therefore, the dying system will get revamped to create employment and business. The new material will be useable for coral based dinner sets, whereas clay derived from the water bodies will produce low cost vessels for public in general.

A functional unit of creating such produce is developed based on example cited in reference, Horobin [8]. The diagrammatic figure explains provision of selected material mixing tank, fine grinding by burr mill, wet grinding tank, filtration unit and again mixing to bring consistency required from needing and molding as well as slip casting of utilities of required shape and sizes. The prepared vessels are fired at first stage of cooking at 1650 0F for which very high rise chimneys are constructed which emit large volume of CO, causing air pollutions and suffer restriction from pollution control board. A new innovative kiln has been developed to capture and recirculate the smoke and reuse for burning that will eliminate air pollution and enhance fuel use efficiency. Its low height will make low cost and easily manoeuverable. The temperature manouuvre can be carried out by electronic based controllers. Thus, the scientific kiln will permit large scale multiplication and use.

The vessels so prepared are again polished which carried out I as second firing which is at 23700F, which can be carried out in the large size such facility. This innovative ideal development needs guided fabrication of the facility (Figure 3).

Geographical Registry in Sea and Marine Material and Products Processing Resulting Quality Product

When sea produce coral made material use dinner set are used the quality will be different which can be given unique geographical registry number (GIr) [9]. Similar quality differences may appear for the material produced from clay based pottery and crockery for their quality by same GIr. Such standards will establish uniqueness in the product and it will fortify business and confidence in the buyers. This identification will attract international market reputation.

Linking of Ocean, Coral, Fishery, Bird, Pottery Industry, Agriculture, Human and Environment

This new process and products will come in use to produce employment and prosperity, business of marketing and sale. This new innovative module will have different segments and lot of employment opportunities. This is an ideal venture for consideration under the startup projects. The entire end result will lead to development of new science backed venture and produce exact anticipated and certain results. The earlier innovative researches have created method for harvesting of organic nitrogen (N) [10] and phosphorus (P) [11]. Birds eat the fish from water bodies and dropping, which is called as guano becomes harvestable and refined to make various uses. Likewise the coral can be harnessed for preparing for coral based dinner set of attractive designs. The vast ocean resources have not come in imagination and this innovation will create new opportunity of employment, water fishery, birds, environment and human. This new linkage will be very prosperous. Thus, these researches open new world opportunity.

Discussion

New Opportunity of Eliminating Wastage of Precious Vitamins

As presented in Table 1 lot of finished food ready for eating has been getting de ionised and neutralized one to one [12-14]. The corresponding ailments occurring due to deficiency of corresponding ailments fully justify elimination of such undue losses. Thus, this research created a new opportunity for eliminating wastage of precious invisualised wealth.

Creation of New Resource

The vitamin’s losses have been occurring since ages and lot of wealth had been going to drains due to lack of knowledge and wisdoms and lot of ailments and medical expenses are adding to undue suffering of the people. The article is creating full justification for saving of such invisualised wealth and bringing them to creating awareness in the public. There have been many researches on exploitation of ocean and marines including marine fisheries, but it did not get adequate scientific backing, hence use of coral had been in a weak stage of development. This research has provided adequate scientific backing for in justification of coral vessels as nonreactive dining sets. The 71 % of earth areas are occupied but ocean and marines with vast length of shores with shallow water. There are some specific areas where corals thrive and grow. The coral growth can be harnessed for promoting such vessels.

The clay and silt deposits in the inland water bodies can be equaly well utilized in creating such vessels affordable low cost purchasing. These types of vessels also lead to same end levels in saving loss of such unforeseen wealth. Thus, this innovative research has created new precious resource and method of retrieving as well as conserving by use of non-reactive vessels for both high profile prosperous gentry as well as low investing gentry.

Extending Utility and Scope of Harnessing Useful Products from Sea and Marine

Use of coral obtainable from some specific coral belts have begun making such products, thus, it is not a new claim of product being made in this research. What had been going on in this direction is in weak stage due to lack of scientific backing. This research has created new and adequate scientific backing with full justification of convincing people to adopt the non-reactive vessels for storage of cooked food and for dining is new thrust. Thus, this research creates strong business, markets for feel good and wellness and wealth using resource from vast ocean and marines. There had always been provocation of limited land fresh water throughout the world, but there had been any new innovation to make still better use of vast sea and marine resource. This research has created wow innovation for benefitting global as well local gentry by using product, which is not limited by quality of water requirement of land and even a non-dispensible use of sea water. Whatever have been going on or might come in future, remains equally open for future developments. This research is not limited by any constraints of climate change, budget involvement and any defeat of any ongoing research.

The development of crockery from clay and silt is equally in that direction. The earlier efforts on soil conservation of soil loss remain in sufficient in arresting such fine particle pollutants and get deposited in transition. Such deposited materials can be annually scrapped from such water bodies and brought to effective use, thus this action will restore storage capacities of inland water bodies, which will enhance ground water recharge and its use during intermittent droughts for supplementary irrigation. Thus, this research is going to change life of global gentry in its own function without worrying about it and getting to realization in due course of use and change in social behaviour.

New Use of Long Term Deposited Clay and Silt in Inland Water Bodies

NAREGA has been suffering from lack of technological linking of water use hence it is subjected to lot of sociopolitical debates [14]. New use of material will create new opportunity, for employment generation and deriving such unimagined feel good and health wellness, in addition creating an auto-function in creating storage facility that will create resilience during climate change and aberrations of rain events leading to intermittent droughts season. Thus, this research is creating new resilience under the changing climate, where ???? have been feeling very happy in development of unsuitable and un effective measures.

Innovations in Manufacturing Process of Non-Reactive Vessel

The process of manufacturing storage and dining set is drawn on line of highly known and well documented record [8]. The component operational units are collection of geological base materials viz quartz and feldspar, which might be existing and placed in mixing tank in equal proportion. The next operation is fine grinding of the base mixed materials, followed by wet grinding. The wet grounded fine material is passed through multistage filtration unit. The filtered material is brought to workable consistency so that material is kneaded and casted in to mold or slip casted. The dried material is separated from their mold/castings and stked in a firing kiln for firing at 1650o F for reasonable duration of 7-10 days.

The selected half burnt prepared vessels are coated once again for the second time with materials prepared in second lot and grounded dry followed by wet fine grinding (Figure 3). The new paste is coated on all vessels in similar manner and with additional decorative designs. The entire vessel lots are staked in high temperature range and burnt at still higher temperature at 2370 0 F. These two controlled temperature burning completes process of manufacturing of the non-reactive vessels.

fig 3 stage 1

fig 3 stage 2

Figure 3: Functional units of organizing coral based industrial production unit for producing nonreactive coral vessels.

The village artisans making earthen pots do not add quartz, hence their pots remain largely red and temperature is also not so high. The quantity of quartz is deciding factor of quality of crockery, addition of soda and lime and burning at high temperature converts product in almost white colour.

Second firing and polishing mate the product tough and still brighter in colour. There are variations in qualities and cost increases with completion and perfection of burning.

The unit operations are almost patternised and use of machineries for various operations may vary from plant to plant depending on preference, ease of operation, performance efficiency and cost of machineries. The ratio of mixture of quartz and feldspar will have deciding command on quality. Next operation is firing in kilns, Conventional kilns have high chimney which is costly and emit large volume smokes, which cause air pollution and suffer set back of regulatory restrictions on height of chimney. In the present study an innovative no smoke releasing low height kiln was developed which involves low height and it becomes easy in operations and maintenance. The new kiln will consume low volume of fuel and the fuel will get converted in to biochar, which will become source for carbon useable in agriculture. The enhancement in bio-char will increase C/N ratio that will enhance productivity of agriculture. Thus, cause of sea derived operational process produces usable bio-char for agriculture and food production. Such links have not been existing and this chain will be synchronizing one being input for the other. The irrotaional operation of system will induce sustainability in agriculture. These developments require research endevours for refining the operational parameters to produce quality product of coral, clay based crockery. This research has set module of process and inspired following generations to optimize and further refine it.

New Vast Resource of Creating Startup Projects for Employment Generation and Supporting House Hold

The new vast resource and innovative technology and tremendous beneficial impact innovation creates new opportunity for new startup project. This area needs special attention and crating new initiative for second generation of employment, for which MNREGA was launched. This research creates new resource which has evolved from previous programmes. This will add new vigour to ongoing programme as well as new intutitaive in creating employment opportunity for justification of bringing for effective public governance.

Enhancement of Resource Opportunity of Planet Earth and Reducing Pressure on Limited Terrestrial Ecosystems

The planet earth has been occupied by vast are under sea and marines. The limited terrestrial are have been going under stress. The present research makes use of natural resource, which have been existing and bringing in strong stream proceed vitamins get lost. The conservation of such vitamins will make still better use of stressfully resources. The linkage between sea and marine, fishery, birds, agriculture human and environment have already developed in deriving organic nitrogen (N) [11,15], which was recognized in global assessment and declared winner of world Academic Championship in Biological Sciences in2018 and phosphorus (P) [12]. This research demonstrates new opportunity creating innovative method not limited by any aspect and any corner. The marine biological product and clay deposits in inland water bodies are new addition in deriving useable non-conventional products.

New Geologic and Geographic Resources Avenue

This research is not limited by any geographical and geologic limitations. Depending on water depths, situation of sea wave still condition the coral reaf are primarily developing at Andman sea shore between two hills viz Andmon city and Ross Island, where it is shown by boat operators in touristic visits and becoming source of recreation. Such plentiful situations are existing where corals are developing (Figure 2). In any case use of coral is not limited by any such restrictions. The business related to coral will flourish with global increase in population [16] and increase in Indian population [17]. Earlier sections have enlightened various aspects of this wow innovation.

Climate Change Will Not Affect Sustainability of Resources Harnessing

Lot of vices have been raise in revealing adverse impact of climate change on coral reef. What have been going it the least impact of climate change. Different aspects have already brought in creating such resilience in terrestrial eco system. The vast area of ocean and marines will be benefiting and producing the profuse growth of coral. The coral will be useable in creating high value vessels which will become source of promoting international business. The global gentry will derive benefits in terms of feel good and wellness from use of coral vessel as it will stay for long doing good, hence creating sustainably increasing business and employment opportunities.

Relevance, Effect, Efficiency and Impact and Sustainability

This research is highly relevant as it is related to food and health which is priority of human needs, it is creating impact, it is highly effective in eliminating loss of vitamins. It involves change in one to one chemical change ions, impact of change in quality of life which will come to realization after some days of use. It is highly sustainable as it is going to function in irrotational rotation [15]. This research is most innovative that will change daily life of the global people.

Opportunity of Vast Natural Resource Harvestable for Human Welfare

This research has brought new natural resource derivable from vast resources as well as inland water bodies to save loss of unimagined tremendous important wealth. This surpasses any natural resources so far managed and created new resource, method and process which will utilize both the types of materials and produce quality product. This will create tremendous employment. The new natural resource is derived from the planet earth and also reducing stress of terrestrial ecosystem. Thus, this is a real and true way of sccomplishment of the earth care. Such earth care have not come to imagination and countries have been trying to explore new planets. The Earth wonderful planet can be further sufficiently brought to new uses viz non-dispensible use of water, not demanding any terrestrial land for production and may other important features brought out earlier.

Strength, Weakness, Opportunity and Threat (SWOT) Analysis

SWOT analysis revealed going in strong favour of strength as it is scientifically backed. It is free from any weakness as nothing is causing it to be fond bringing adverse impact but in this research new avenues have been created. The study set way to draws resources from earth’s vast resource sea and marine as well as terrestrial water bodies, hence it is creating tremendous unforeseen resource, creating reduction of precious vitamin wealth, getting to drains and creating opportunity of employment to the extent that it can be extended to any level. There is no threat, rather people will come to realization of impact on feel good and wellness and saving in medical bills.

Conclusions

This new research on the cause of deficiency in vitamin which occurs due to ionic change of food made after having gone for investment, reduce loss and avoid occurrence of non-bearable ailments and diseases. This will save large volume of finished vitamins, which will get in use in its auto function, which has been going to waste water streams. This may appear as an airy thought, but all things have been derived based on scientific facts. The vast ocean will create new opportunity for world to flourish and make use of resources in still better way than what has been going on. This will transform world population healthy, brainy and efficient working.

References

  1. Gupta US (1992) Crop improvement quality characters. Science Publishers Inc Enfield New Hampshire 3: 037480.
  2. Hui cited in Gpta [1] (1992).
  3. Yadav RC, Yadav J (2018) Innovative biotechnology for production to consumption for promoting new theme of health care-food is medicine, Madrid Spain.
  4. Yadav RC (2020) Eating milk is better than drinking. Paper accepted for presentation at 6th global congress on food and beverages, Dubai.
  5. Yadav RC, Yadav UR (2019) Innovative scientific management of milk-dairy-food-health fodder-waste and environment. Under publication. Oxford Scholar Publishing co. London.
  6. Eric Cheng, “Down loaded from internet”, 1997.
  7. Hindustan (Hindi) (2019) Daily news Paper, Chintajanak: saat me se ek bhartiya mansik rog se grast Worry: One of every seven Indians are affected by mental ailments. Hindustan Hindj, New Delhi.
  8. Bandy, Horbin, “China clay-porcelain. Science and technology, How it works. 4: 465-461.
  9. Guftafson AE (2010) “Hand Book of Fertilisers, Their sources, make, effect and use”, Third edition, Agro Bios, Jodhpur, India.
  10. Yadav RC, Yadasv J (2013) Development of business out sourcing (BPO) in agriculture for sustainable productivity and environment protection.ijmsem. Taylor and Francis London.
  11. Yadav RC (2014) Biological nitrogen harvesting from acquatic eco systems: A new scientific vision. Fish and Aqua culture Journal.
  12. Yadav RC (2015) Biological phosphorus harvesting for multiple uses-A new scientific vision. J Aqua Culture and Marine Biology 2: 2.
  13. Yadav RC (2015) Geology and geographical implications on food related health hazards. And their remedial measures in 8th WSE A conference on geology and geography. Celerno university, Italy.
  14. Hindustan (Hindi).” Manrega majdori pandrah din me nahi dene par muwabja (Delay in payment of wage at every 15 days will be compensated. Hindustan, Delhi, Dec 25, 2019 pp 8
  15. Ramamrutham S (2008) Hydraulics, Fluid Mechanics, and Hydraulic Machines. Dhanpat Rai Publishing Co., New Delhi, 110002, Eigth Edition
  16. S Thompson, Warren and Tony Evan, Baver, Population Problem, McGraw Hill. New York, pp (1965)304
  17. Carolin, Thomas, Evans T (2011) Poverty Development and Hunger: In Balis John Srev, Smith and Patrics Ovan (Eds) Globalization of world politics-An introduction to waorld relation. Oxford University Press.
fig 1

Dosimetric Comparison and Clinical Toxicity in Cervical Cancer Patients Treated with Intensity- Modulated and Three-Dimensional Conformal Radiotherapy: Real-World Data

DOI: 10.31038/CST.2020541

Abstract

Background: Predominantly used in external beam radiotherapy (EBRT) are intensity modulated radiotherapy (IMRT) and three-dimensional conformal radiotherapy (3DCRT). However, the superiority between these two techniques remains inconclusive. This study aim to evaluate the late clinical toxicity of cervical cancer patients treated with intensity-modulated radiation therapy (IMRT) compared to three-dimensional conformal radiation therapy (3D-CRT) and dosimetrically compare the planning target volume (PTV) plan of 3D-CRT to the PTV plan of IMRT based on target coverage and bladder and rectum doses at different volumes.

Methods and Materials: From September 2011 – December 2015, 146 patients with International Federation of Gynaecology and Obstetrics (FIGO) stage IB2-IIB squamous cell carcinoma of the cervix were analysed retrospectively. The patients received EBRT of 50 Gy in 25 fractions of the whole pelvic delivered with IMRT or 3D-CRT. Seventy-five (75) patients received 3D-CRT and seventy-one (71) patients received IMRT.

Results: The 2 years’ overall survival (OS) was 92% in the IMRT group and 88% in the 3D-CRT group (p-value = 0.073). The disease-free survival outcome (DFS) was 83% and 80% in IMRT and 3D-CRT group respectively (p-value). Acute genitourinary (GU) and gastrointestinal (GI) toxicity were lower in IMRT patients compared to 3D-CRT patients (GU, 21.1% vs. 37.3%, p-value = 0.179; GI, 46.5% vs. 49.3%, p-value = 0.436). The mean coverage of the prescribed dose in IMRT and 3D-CRT techniques was 50.02 ± 0.10 Gy and 50.10 ± 0.23 Gy respectively with a non-significant p-value of 0.005 for 95 percent (D95) of the PTV. Also, the mean coverage of 5% (D5) of the PTV was 52.66 ± 0.39 Gy and 53.89 ± 0.76 Gy of the prescribed dose in IMRT and 3D-CRT techniques respectively with a significant p-value of 0.0001.

Conclusion: Patients treated with IMRT had a lower dose to bladder and rectum, a lesser rate of late toxicity and comparable clinical outcome than 3D-CRT. We admonish larger sample size studies and longer follow-up in subsequent studies to affirm our results.

Keywords

Cervical cancer; IMRT; 3D-CRT; Rectum; Bladder

Introduction

Cancer has become a significant public health problem in China since 2010 due to increasing incidence and mortality, making it the number one cause of death in the country [1,2]. External beam radiotherapy (EBRT) is a vital method of treatment for cervical cancer management. Most often than not EBRT and brachytherapy in addition to chemotherapy are often used when treating and managing locally advanced cancer of the cervix. The primary goal of EBRT is in the delivering of maximum radiation to the malignant tissue, with minimum radiation to healthy organs. This treatment can be noxious, and about 20-25% of patients are reported to have severe side effects [3]. Hence, reliable dose-response knowledge in malignant lesions and organs at risk (OAR) is therefore very vital. Before advancement into new treatment planning and imaging technique, most cervical cancer patients were treated using 2D (Two-dimensional) planning. In 2D treatment planning, the contour of the patient is captured with x-ray using lead wire, and bony landmarks and is transcribed on a graph paper sheet with an identified reference point, [4] which results in the target volume being inadequately uncovered. With the limitation of 2D planning, 3D treatment planning and conformal radiotherapy became the standard for EBRT in the 90ths [5]. This treatment planning uses computer tomography (CT) scan images with patients required to be positioned in the planning set-up and requires a computerised treatment planning system (TPS). 3D-CRT is a form of EBRT which uses computers and unique imaging technologies to optimize the radiation beams precisely in other to reduce radiation to surrounding healthy tissues; and was started to be used for effective management of patients since it could give a maximum target coverage and also has the tendency for dose optimization to normal healthy tissues. It makes use of several high photon beams to amply deliver a high dose to a centrally located target volume with minimum dose to superficial structures in the pelvis. Intensity-modulated radiation therapy (IMRT) allows radiation to be more precisely shaped to fit the target volume by using heterogeneous fluences beams from different directions thereby optimises high radiation dose to the target volume and also limiting the amount of radiation received by the normal healthy organs. With IMRT, the beam intensity is able to be optimised as it orients around the patients using computer algorithms [6]. The ‘inverse method’ in treatment planning forms the basis of this process hence able to generate significant dose gradients in the adjacent structures and target volume to accomplish dose-volume prescription [7]. In IMRT, many beams with varying intensity levels are used in treating the tumour while 3D-CRT uses uniform intensity radiation beams hence the constraint of the latter is evident whenever a tumour is wrapped around an organ. Many experts indicated that IMRT is capable of reducing doses to the bone marrow, rectum and bowel and are linked with reduced levels of haematological, gastrointestinal (GI) and genitourinary (GU) toxicity compared to conventional radiation therapy. Nevertheless, these studies were usually defined by small sample sizes and the absence of clinical outcome data. Additionally, brachytherapy patients were involved in their selection criteria and this could influence toxicity. Retrospective reviews comparing IMRT and 3D-CRT technique for cervical cancer patients treated by radiotherapy are deficient, and also there has been inconsistency finding in dose to OAR. The purpose of this study was to analyse retrospectively the clinical toxicity of cervical cancer patients treated with IMRT compared to 3D-CRT and secondly, to compare the PTV plans of 3D-CRT to the PTV plan of IMRT on the basis of target coverage and doses to bladder and rectum at different volumes.

Materials and Methods

Patient Selection

146 stage IB2-stage IIB cervical cancer patients were treated from September 2011-December 2015. The eligibility criteria were [8]:

I.     Biopsy confirmation of squamous cell carcinoma or adenocarcinoma.

II.    Cytological /histological diagnosis of cervical cancer.

III.   No previous surgery, chemotherapy or radiation.

IV.   No evidence of distance metastasis.

V.    KPS performance score 70-80.

Pre-Treatment Evaluation

The pre-treatment workup included a comprehensive medical history, vagina-recto-abdominal examination. Radiological studies like CT-scan of the abdomen-pelvis, chest x-ray and MRI in a few selected patients. Laboratory studies included a complete blood count (CBC), Liver function test (LFT), Blood Chemistries, BUN/Cr, SCC blood test. The clinical-stage was defined according to the International Federation of Obstetrics & Gynaecology (FIGO) staging system.

CT-Simulation

All patients were immobilised with a thermoplastic sheet and underwent CT simulation for planning in a supine position. Philips CT scanner was used for simulation and 3 mm slice images of the abdomen and pelvis area were obtained. The Pinnacle treatment planning system (TPS) (Version 9.2) was used for planning and target contouring.

Treatment Planning

The clinical target volume (CTV) and organs at risk (OAR) were contoured using the concept and definition of volume targets from ICRU reports [9,10]. The gross tumour volume (GTV) and clinical target volume (CTV) were contoured on each single axial CT slice. The CTV included palpable tumour and areas expected to be affected with subclinical tumours. Therefore, the CTV included the pelvic lymph node (external, internal and common iliac), cervix, vagina upper section and uterus. A margin of 10 mm was generated around the CTV to define the planning target volume (PTV). Four fields (two lateral and PA-AP fields) with zero-degree (0°) couch angle were used to generate the 3D-CRT plans (Figure 1). The isocenter was positioned at the PTV’s geometric centre. 10 megavolt (MV) photon energy was used for all plans to improve coverage of PTV and reduce dose to the skin. The beam aperture was shaped to the PTV in each beam’s eye view and a margin of 0.5 cm in all directions accounting for the beam penumbra. The PTV was prescribed a total dose of 50 Gy (2Gy per fraction). The bladder and rectum were protected with a 4-cm central shield after 40 Gy. IMRT plans were generated using 10 megavolt energy with six coplanar fields (Figure 2). Patients had whole pelvic radiotherapy prescribe to 50 Gy with either 3D-CRT or IMRT in 1.8-2 Gy per fractions from Monday – Friday. Chemotherapy involving cisplatin (25 mg/m2) was given concurrently to all patients from second to fifth week during radiotherapy treatment. None of the patients received high dose rate-intracavitary brachytherapy.

fig 1

Figure 1: Shows the 4-field beam arrangement and isodose curve in 3D-CRT.

fig 2

Figure 2: Shows the beam arrangement and isodose curve in IMRT technique.

Plan Evaluation

All plans were passed and accepted after more than 95% of the PTV received more than 95% of the dose prescribed (PD). The dose-volume histograms (DVHs) were used in evaluating the PTV coverage, rectum and bladder between 3D-CRT and IMRT plans. The parameter analysed for bladder and rectum included D15D50D80 (dose to 15%, 50% and 80% of organ volume) while PTV coverage was based on D5 and D95 (Dose to 5% and 95% of the PTV respectively). The conformity index (CI) and homogeneity index (HI) was calculated in both techniques using the formulae below.

HI95% = D5/D95; where D5 is the minimum dose of 5% of the target volume indicating the maximum dose, and D95 is the maximum dose of 95% of the target volume indicating the minimum dose. The Homogeneity Index (HI) is an accurate method for analysing the homogeneity of the target volume dose distribution. HI, therefore, demonstrates in all terminology the ratio between both the minimum and maximum dose in the target volume and the lower value demonstrates a more homogeneous distribution of the dose within this volume.

The ideal value is 1, and it increases as the plan become less homogeneous.

CI95% = Total volume receiving 95% of prescribed dose/planning target volume. The ideal value is 1.

Statistical Analysis

All statistical analyses were carried out using SPSS 18, and a substantial difference in each set of dosimetric variables was determined using an independent sample test and chi-square. The rate of survival was evaluated after treatment was completed. The Kaplan – Meier method was used to calculate overall survival (OS) and disease-free survival (DFS). With the aid of the log-rank test, the significance of the difference was analyzed and a p-value < 0.05 was considered significant statistically.

Follow-Up

One month after treatment, patients had a gynaecological examination and pelvic CT/MRI. Afterwards, they were followed at a regular interval of 3 months for the first 2 years and at an interval of 6 months thereafter and then once a year. Version 3.0 of the Common Terminology Criteria for Adverse Events (CTCAE) was used in evaluating chronic and acute toxicity.

Results

Characteristics and Treatment of patients

146 stage IB2-stage IIB cervical cancer patients were treated from September 2011-December 2015. Seventy-five (75) were treated with 3D-CRT and the median age was 50 years (range, 39-68). Seventy-one (71) were also treated with IMRT and the median age was 53 years (range, 32-78). The squamous cell carcinoma histology type was seen in one hundred and thirty-seven (137, 93.8%) patients and nine (9, 6.2%) patients with adenocarcinoma. Table 1 shows a summary of the patients’ characteristics.

Table 1: Patients clinical characteristics.

Characteristics

IMRT 3D-CRT

p-value

Age
Median

53

50

Range

32-78

39-68

Histology type
SCC

64 (93.8%)

73 (97.3%)

Adenocarcinoma

7 (9.9%)

2 (2.7%)

0.071

Stage
IB2

6 (8.5%)

7 (9.3%)

IIA1

29 (40.8%)

44 (58.7%)

IIA2

2 (2.8%)

2 (2.7%)

0.131

IIB

34(47.9%)

22 (29.3%)

Grade
1

8 (11.3%)

12 (16.0%)

0.166

2

59 (83.1%)

53 (70.7%)

3

5 (5.6%)

10 (13.3%)

Tumour Size
<4 cm

45 (63.4%)

50 (66.7%)

0.677

≥ 4 cm

26 (36.6%)

25 (33.3%)

LVSI
Yes

30 (42.3%)

39 (52.0%)

0.238

No

41 (57.7%)

36 (48.0%)

Pelvic Node
Yes

19 (26.8%)

17 (22.7%)

0.540

No

52 (73.2%)

57 (76.0%)

Dose-Volume Histogram (DVH) Outcomes

The 95% PTV mean value was 50.02 ± 0.10 Gy and 50.10 ± 0.23 Gy of the prescribed dose in IMRT and 3D-CRT techniques respectively with a significant p-value of 0.005. Also, the mean coverage of 5% of the PTV was 52.66 ± 0.34 Gy and 53.89 ± 0.76 Gy of the prescribed dose in IMRT and 3D-CRT techniques respectively with a significant p-value of 0.001. Hence the target coverage was esteemed satisfactory and appropriate in both groups.

The HI mean value was 1.052 ± 0.008 and 1.083 ± 0.021 in IMRT and 3D-CRT plans respectively, and the p-value 0.001, indicates the statistical significance of HI in both plans. The CI mean value was 1.330 ± 0.103 and 1.109 ± 0.214 in IMRT and 3D-CRT plans respectively, with a significant 0.001 p-value. Table 2 shows the outcomes of the CI, HI and target coverage in both treatment technique.

Table 2: Outcomes of the CI, HI and target coverage in both treatment technique.

Dosimetric Parameters

 IMRT 3D-CRT

P-value

D5

52.66 ± 0.39

53.89 ± 0.76

 0.001

D95

50.02 ± 0.10

50.10 ± 0.23

0.005

CI

1.330 ± 0.103

1.109 ± 0.214

0.001

HI

1.052 ± 0.008

1.083 ± 0.021

0.001

The dose received by 15% (D15), 50% (D50) and 80% (D80) of the bladder in IMRT was 51.30Gy, 46.79 Gy and 38.69 Gy respectively while that of 3D-CRT was also 52.96 Gy, 51.30 Gy and 41.95 Gy at D15, D50 and D80 respectively. The dose difference between these two techniques at D15, D50 and D80 was highly significant with p-value 0.0001 at all level. Furthermore, dose received by 15% (D15), 50% (D50) and 80% (D80) of the rectum in IMRT was 51.04 Gy, 48.82 Gy and 43.72 Gy respectively while that of 3D-CRT was also 52.24 Gy, 50.99 Gy and 48.08 Gy at D15, D50 and D80 respectively. The dose difference between these two techniques at D15, D50 and D80 was highly significant with p-value 0.001 at all level. Table 3 shows the detailed values of rectum and bladder dose at D15, D50 and D80.

Table 3: Summary of rectum and bladder dose.

Dosimetric Parameters

IMRT 3D-CRT

P-value

Bladder
D15

51.300.39

52.96 ± 0. 88

0.001

D50

46.792.28

51.30 ± 1.72

0.001

D80

38.69 ± 3.63

41.95 ± 6.14

0.001

Rectum
D15

51.04 ± 0.52

52.24 ± 0.89

0.001

D50

48.82 ± 0.97

50.99 ± 0.75

0.001

D80

43.72 ± 2.59

48.08 ± 2.97

0.001

Survival Outcome and Failure Patterns

The 2 years’ overall survival (OS) was 92% in the IMRT group and 88% in the 3D-CRT group with a non-significate p-value of 0.073 and the median follow-up time was 28 months. The disease-free survival outcome (DFS) was 83% and 80% in IMRT and 3D-CRT group respectively. Locoregional failure was noticed in 5 patients. Three (3) from the 3D-CRT group and 2 from the IMRT group. Distant metastasis was observed in one patient in the three-dimensional conformal radiotherapy group in addition to the locoregional failure. Six (6) death rate was recorded during the follow-up, two (2) from the IMRT group and 4 from the 3D-CRT group. The causes of death were pulmonary embolism (1 patient), heart failure (3 patients) and natural death (2).

Clinical Toxicity Outcome

Table 4 shows the percentage of patients with acute genitourinary (GU), haematological and gastrointestinal (GI) toxicity and their grades. Less acute genitourinary (GU) and gastrointestinal (GI) toxicity were noticed in the IMRT patients compared to the 3D-CRT patients (p-value = 0.436 and 0.179 respectively). None of the patients experienced grade 4 genitourinary (GU) and gastrointestinal (GI) toxicity in both groups. Two patients in the IMRT category developed oedema while 12 patients in the 3D-CRT category experienced the same effect. None significant statistical difference was noticed between the two groups when the various clinical toxicity was considered.

Table 4: Clinical toxicity between IMRT and 3D-CRT.

Toxicity

Grade 3D-CRT arm, n (%) IMRT arm, n (%) x2

p-value

Hematologic

0

43 (57.3%) 47 (5.3%) 1.834

0.608

1

21 (28.0%)

18 (25.4%)

2

8 (10.7%)

4 (5.6%)

3

3 (4.0%)

2 (2.8%)

GI

0

47 (62.7%) 56 (78.9%) 4.907

0.179

1

22 (29.3%)

12 (16.9%)

2

5 (6.7%)

2 (2.8%)

3

1 (1.3%)

1 (1.4%)

GU

0

28 (37.3%) 22 (31.0%) 2.726

0.436

1

33 (44.0%)

31 (43.7%)

2

10 (13.3%)

16 (22.5%)

3

4 (5.3%)

2 (2.8%)

Edema

Yes

12 (16.0%) 2 (2.8%) 7.311

0.007

No

63 (84.0%)

69 (97.2%)

Discussion

Previous epidemiological studies have shown that most cervical cancer patients mostly report to the hospital in advance stages of the disease. The public, accepted management for locally advanced cervical cancer (LACC) is brachytherapy with concurrent cisplatin chemoradiotherapy. Conventional radiotherapy continues to be the golden standard for LACC. There has been a reduction in the clinical outcomes and toxicities of IMRT compared with 3D-CRT from preliminary studies. The utilisation of IMRT for gynaecologic tumours including locally advanced cervical cancer has upsurge over these years even though there is insufficient retrospective randomised data to support its usage. From our results, both techniques attained the desired target coverage since 95% of the PTV had above 95% of the prescribed dose (PD). Also, there was better CI, HI and PTV coverage in IMRT compared to 3D-CRT because IMRT uses computer optimised intensity beams and multiple beam angles. Secondly, by using computer algorithms, the intensity of the beam can be optimised in IMRT as it orients around the patient, therefore, allowing radiation to be more precisely shaped to fit the target volume. The results of previous studies, when compared to this present study, confirmed that both IMRT and 3D-CRT are useful in PTV coverage hence no difference in our PTV coverage when compared with previous studies. Van De Bunt et al. [11] reported that IMRT is superior to conformal and conventional treatment in sparing critical organs with ample target volume coverage and also stated that IMRT remains superior after EBRT of 30 Gy regardless of internal organ movement and tumour deterioration.

Mell et al. [12], reported IMRT that there was a reduction in doses to the bone marrow and small bowel when patients were treated with IMRT. A study by Naik et al. [13], reported that doses to organ volume of bladder and rectum were reduced in IMRT patients compared to 3D-CRT. Fiorino et al. [14] concluded that IMRT was superior regarding bowel sparing for doses above 30Gy and also a correlation exists between toxicity and the amount of radiation received by an organ. Central target volume boost is possible with IMRT for patients whom brachytherapy is not possible due to a reduction in doses to OAR thereby allowing higher dose up to 66-70 Gy to be delivered using IMRT. Retrospective studies have accounted that decrease in dose to healthy organs may present a clinical benefit in clinical toxicities reduction. Jereczek – Fossa et al. [15] examined 317 postoperative endometrium carcinoma patients and reported that there was a statistically significant correlation between late and acute bowel reactions. The morbidity and complications among cervical cancer patients after a long-term treatment survivor was assessed by Kamal et al. [16] and reported that the rate of obstruction of the small intestines was comparable in IMRT and 3D-CRT with no significant p-value in both groups. Ajeet et al. [17] reported grade 2 diarrhoea, tenesmus and constipation in patients treated with 3D-CRT compared to a lower grade in IMRT patients. Avinash et al. [18] concluded that there were no differences in both techniques when the grade of haematological toxicities was considered every week even though there was a statistically significant difference between IMRT and 3D-CRT during the second week when the total count and Neutrophils count were assessed. Our results showed that less acute genitourinary (GU) and gastrointestinal (GI) toxicity was noticed in the IMRT patients compared to the 3D-CRT patients (p-value = 0.436 and 0.179 respectively). None of the patients experienced grade 4 genitourinary (GU) and gastrointestinal (GI) toxicity in both groups. Two patients in the IMRT category developed oedema while 12 patients in the 3D-CRT category experienced the same effect. In general, lower clinical toxicities were observed in the IMRT patients than the 3D-CRT patients even though there wasn’t any statistical significance between the two techniques.

Past studies [19-27] in postoperative patients treated with IMRT have normally shown suitable survival outcomes. Chen et al. [28] analyzed 35 patients receiving four-field radiation therapy and 33 patients receiving intensity-modulated radiotherapy and concluded that IMRT improved locoregional control. An update of the study of the Gynaecologic Oncology Group showed 3-year overall survival and progression-free survival rates of 88% and 86% respectively in stage IB cervical cancer patients. Results from the Radiation Therapy Oncology Group 0418 study, involving 48 patients showed an estimated 2-year OS and DFS rates of 94.6% and 86.9% respectively with a median follow-up duration of 2.68 years. In Folkert et al. [29] studies involving 34 patients, the 3 years OS was 91.1% and the 5 years DFS was 91.2%. Our findings were similar to this study.

Our study’s major limitation is the short follow-up period. Furthermore, using bone marrow-sparing methods could reduce the higher rates of haematological toxicity recorded in treated patients with intensity-modulated radiotherapy. In addition, more focus should be given to the target margin in order to leave an adequate margin in IMRT planning for PTV expansion.

Conclusion

In conclusion, patients treated with IMRT had a lower dose of bladder and rectum, a lesser rate of clinical toxicity and comparable clinical outcome than 3D-CRT. We admonish larger sample size studies and longer follow-up in subsequent studies to affirm our results.

References

  1. Shan J (2014) Cervical cancer increases among young Chinese women.
  2. Ostor AG, Rome RM (1994) Micro-invasive squamous cell carcinoma of the cervix: a clinico-pathologic study of 200 cases with long-term follow up. Int J Gynecol Cancer 4: 257-264.
  3. Chen W, Zheng R, Baade PD, Zhang S, Zeng H, et al. (2016) Cancer statistics in China, 2015. CA Cancer J Clin 66: 115-132.
  4. Hochman A, Ratzkowski E, Schrieber H (1955) Incidence of carcinoma of cervix in Jewish women in Israel. Br J Cancer 9: 358-364.
  5. Perez CA (1998) Uteri cervix. In: Perez CA, Brady LW, Principles and practice of radiation oncology 3rd edition. Philadelphia, PA: Lippincott-Raven Publishers 1998: 1733-1834.
  6. Low D, Purdy JA, Perez CA et al. (1992) Intensity modulated radiation therapy, In: Levitt SH, Potish RA, Khan FM, Perez CA eds. Levitt and Tapley’s technological basis of radiation therapy: Clinical application 3rd edition. Baltimore, MD: Lippincott Williams and Wilkins 1992: 126-146.
  7. Khan FM (2007) Treatment Planning in Radiation Oncology, 2nd edition, Philadelphia: Lippincott Williams and Wilkins.
  8. Drokow EK, Zi L, Qian H, Xu L, Foli F, et al. (2020) Tolerability, efficacy and feasibility of concurrent gemcitabine and cisplatin (CGP) combined with intensity modulated radiotherapy for loco-regionally advanced carcinoma of the cervix. Journal of Cancer 11: 2632-2638. [crossref]
  9. ICRU Report 50 (1993) Prescribing, recording and reporting photon beam therapy: ICRU, Bethesda, MD,
  10. ICRU Report 62 (1999) Prescribing, recording and reporting photon beam therapy (Supplement to ICRU report 50): ICRU, Bethesda, MD.
  11. Van de Bunt L, van der Heide UA, Ketelaars M, de Kort GA, Jurgenliemk-Schulz IM (2006) Conventional, conformal, and intensity-modulated radiation therapy treatment planning of external beam radiotherapy for cervical cancer: the impact of tumor regression. Int J Radiat Oncol Biol Phys 64: 189-196. [crossref]
  12. Mell LK, Tiryaki H, Ahn KH, John C Roeske, Bulent Aydogan et al. (2008) Dosimetric comparison of bone marrow-sparing intensity-modulated radiotherapy versus conventional techniques for treatment of cervical cancer. Int J Radiat Oncol Biol Phys 71: 1504-1510. [crossref]
  13. A Naik, O.P. Gurjar, P. Bagdare et al. (2016) Dosimetric comparison between IMRT and 3D-CRT planning. J. Radiat 14: 189-196.
  14. Fiorino C, Alongi F, Perna L Et al. (2009) Dose–volume relation- ships for acute bowel toxicity in patients treated with pelvic nodal irradiation for prostate cancer. Int J Radiat Oncol Biol Phys 75: 29-35. [crossref]
  15. Jereczek-Fossa BA, Jassem J, Badzio A (2002) Relationship between acute and late normal tissue injury after postop- erative radiotherapy in endometrial cancer. Int J Radiat Oncol Biol Phys 52: 476-482. [crossref]
  16. Kamal A Elghamrawi (2011) Treatment complications among long-term survivors of cervical cancer: treated by surgery or radiotherapy. Oncology Reviews 5: 261-266.
  17. Gandhi AK, Sharma DN, Rath GK, Julka PK, Subramani V, et al. (2013) Early clinical outcomes and toxicity of intensity modulated versus conventional pelvic radiation therapy for locally advanced cervix carcinoma: a prospective randomized study. Int J Radiat Oncol Biol Phys 87: 542-548. [crossref]
  18. Avinash HU, Arul Ponni TR, Janaki M G, Kirthi Koushik A S, Kumar SM (2015) A prospective dosimetric and clinical comparison of acute haematological toxicities in intensity modulated radiation therapy and three-dimensional conformal radiotherapy with concurrent chemotherapy in carcinoma cervix. J Can Res Ther 11: 83-87. [crossref]
  19. Hui Beina MD, Zhang, Yingbing MD, Shi Fan MD, Wang Juan PhD, et al. (2014) Association Between Bone Marrow Dosimetric Parameters and Acute Hematologic Toxicity in Cervical Cancer Patients Undergoing Concurrent Chemoradiotherapy: Comparison of Three-Dimensional Conformal Radiotherapy and Intensity-Modulated Radiation Therapy. International Journal of Gynecological Cancer 24: 1648-1652. [crossref]
  20. Wang YM, Wang CJ, Fang FM, Chen HC, Hsu HC, et al. (2017) Differences in the outcomes and complications between elderly and younger uterine cervical cancer patients treated by definitive radiotherapy – a propensity score-matched study. Gynecol Oncol 145:277-283.
  21. Hui B, Zhang Y, Shi F, Wang J, Wang T, et al. (2014) Association between bone marrow dosimetric parameters and acute hematologic toxicity in cervical cancer patients undergoing concurrent chemoradiotherapy: comparison of three-dimensional conformal radiotherapy and intensity modulated radiation therapy. Int J Gynecol Cancer 24:1648-1652. [crossref]
  22. Chang Y, Yang ZY, Li GL, Li Q, Yang Q, et al. (2016) Correlations between radiation dose in bone marrow and haematological toxicity in patients with cervical cancer: a comparison of 3DCRT, IMRT, and Rapid ARC. Int J Gynecol Cancer 26:770-776. [crossref]
  23. Mell LK, Sirak I, Wei L, Tarnawski R, Mahantshetty U, et al. (2017) Bone marrow-sparing intensity modulated radiation therapy with concurrent cisplatin for stage IB-IVA cervical cancer: an international multicenter phase II clinical trial (INTERTECC-2). Int J Radiat Oncol Biol Phys 97:536-545. [crossref]
  24. Tanderup K, Fokdal LU, Sturdza A, Haie-Meder C, Mazeron R, et al. (2016) Effect of tumor dose, volume and overall treatment time on local control after radio-chemotherapy including MRI guided brachytherapy of locally advanced cervical cancer. Radiother Oncol 120:441-446. [crossref]
  25. Sturdza A, Potter R, Fokdal LU, Haie-Meder C, Tan LT, et al. (2016) Image guided brachytherapy in locally advanced cervical cancer: improved pelvic control and survival in RetroEMBRACE, a multi-center cohort study. Radiother Oncol 120: 428-433. [crossref]
  26. Weiping W, Xiaorong H, Junfang Y, Jie S, et al. (2017) Outcome and toxicity of radical radiotherapy or concurrent chemoradiotherapy for elderly cervical cancer women. BMC Cancer 17:510. [crossref]
  27. Mei-Ling LAN, Xian YU, He XIAO et al. (2016) Clinical outcomes and toxicity of postoperative intensity-modulated versus three-dimensional conformal radiation therapy in patients with cervical cancer. Asia-Pacific Journal of Clinical Oncology 12: 430-436. [crossref]
  28. Chen MF, Tseng CJ, Tseng CC, Yu CY, Wu CT, et al. (2008) Adjuvant concurrent chemoradiotherapy with intensity modulated pelvic radiotherapy after surgery for high-risk, early stage cervical cancer patients. Cancer J 14: 200-206. [crossref]
  29. Folkert MR, Shih KK, Abu-Rustum NR et al. (2013) Postoperative pelvic intensity-modulated radiotherapy and concurrent chemotherapy in intermediate- and high-risk cervical cancer. Gynecol Oncol 128: 288-293. [crossref]