Archives

fig 1 414

Unusual Sella Mass: Pituitary Abscess (PA)

DOI: 10.31038/EDMJ.2020442

Abstract

Pituitary abscess (PA) caused by an infectious process is a rare cause of Sellar mass. The clinical features and radiological appearance of PA as an intra- or supra-sellar mass are similar to many other pituitary lesions, and so they are often misdiagnosed as pituitary tumor.

70% of cases occur in a previously healthy pituitary gland. These are classified as primary pituitary abscesses, persumbly secondary to either hematogenous spread or as an extension from an adjacent infective focus such as meningitis, sphenoid sinusitis, Cavernous sinus thrombophlebitis or contaminated cerebrospinal fluid (CSF) fistula.

The rest are secondary abscesses, and arise from pre-existing lesions, such as an adenoma, apoplexy in a tumor, a craniopharyngioma, or a complicated Rathke’s cleft cyst and lymphoma. The risk factors are for PA are immunosuppression, previous irradiation or surgical procedures to the pituitary gland [1].

In almost 50% of cases, the pathogenic microorganism causing the infection is not isolated. A history of recent meningitis sinusitis or head surgery can be the source [2].

Correct diagnosis before surgery is difficult and is usually confirmed intra- or post-operatively. The early surgical intervention allows appropriate antibiotic therapy and hormone replacement resulting in reduced mortality and morbidity. A long term follow-up is recommended because of the high risk of recurrence and of postoperative hormone deficiencies.

Keywords

Pituitary abscess, Papilledema, Panhypopituitarism, Rathke’s cleft cyst, Propionibacterium acnes

Introduction

A pituitary abscess (PA) represents 0.2%-0.6% of all pituitary lesions and can be life threatening. It can have a prolonged disease course. The first case was reported by Heslop in 1848, and so far, <300 cases have been reported worldwide [3]. It is an infectious process that presents as a mass in the Sella. Clinical features and the radiological appearance of the PA as an intra or suprasellar mass are similar to many other pituitary lesions, so it is often misdiagnosed as a cystic pituitary tumor, craniopharyngioma, and Rathke’s cyst. It can be life-threatening if not appropriately diagnosed or treated, and the outcome is difficult to predict. Fortunately, the majority of the cases have a chronic course. The disease has a higher prevalence in females between the age of 12 to 76 years. The average period it takes to diagnose from the onset of symptoms is around 8 years.

PA can occur as a primary disease or can be secondary to infections caused by either hematogenous spread or as an extension from an adjacent infected tissue such as meningitis, sphenoid sinusitis, Cavernous sinus thrombophlebitis or contaminated cerebrospinal fluid fistula 70% of cases occur in a previously healthy pituitary gland. These are classified as primary pituitary abscesses, and the rest are secondary abscesses that arise from pre-existing lesions, such as an adenoma, apoplexy in a tumor, a craniopharyngioma or a complicated Rathke’s cleft cyst and lymphoma [4].

In almost 50% of cases, the pathogenic microorganism causing the infection cannot be isolated. A history of recent meningitis sinusitis or head surgery can be the source [2].

Correct diagnosis before surgery is difficult and is usually confirmed intra- or post-operatively. The early surgical intervention allows appropriate antibiotic therapy and hormone replacement resulting in reduced mortality and morbidity. A long term follow-up is recommended because of the high risk of recurrence and postoperative hormone deficiencies.

We present 2 cases of pituitary abscess in young women. One presented with bilateral papilledema and the other with panhypopituitarism. Both had a sellar mass on an MRI scan, and the diagnosis was made intra-operatively. Microbiological culture in both cases was positive for Propionibacterium acnes (P.acnes). P.acnes is a gram-positive organism, a part of the normal skin microbe. This organism is most commonly isolated from wounds following craniotomies after Staphylococcus aureus and streptococcus epidermidis. Low-grade infections can manifest between 3-36 months.

Case 1

A 14-year old South Asian girl presented with a one-month history of worsening frontal headaches that occurred daily, associated with vomiting, nausea, lethargy, photophobia, and sleep disturbance. Aside from well-controlled asthma, she has been previously healthy. There was no recent travel history or infectious contacts. On examination, she appeared alert and active. She had bilateral papilledema, suggesting raised intracranial pressure (ICP). She was apyrexial and systemically well. Her cerebral magnetic resonance imaging (MRI) scan revealed a soft tissue mass in the pituitary fossa extending up towards the optic chiasm, with mild edema in the optic nerve and tracts. The scan also showed an enlarged pituitary gland and thickened stalk. The findings suggest an inflammatory process like hypophysitis, particularly Langerhans cell histiocytosis (LCH) because of her age. There were no other features of LCH. She had a normal liver US and skeletal survey. She had no symptoms of Diabetes insipidus. Her pituitary hormones were normal, including the stimulated cortisol. Her Prolactin was elevated. Her serum sodium and osmolality were normal. Her ESR was slightly raised, but autoantibodies, serum tumor markers, ACE, and the Quantiferon tuberculosis test were negative. Her IgG4 subclass was normal (Table 1). The formal ophthalmology review did not show evidence of bilateral papilledema. Her symptoms improved with oral analgesics, and steroid treatment was not initiated.

Table 1: Results at initial presentation.

                    Short Synacthen test

Time T=0 T-30 T=60
Cortisol (nmol/L) 186 452 594

                   Baseline tests

Test Result Normal range
IGF-1(nmol/L) 47.9 18.3 to 63.5
TSH (mU/L) 1.62 0.51-4.3
T4 (pmol/L) 13.3 10.8-19
LH (IU/L) 4.3 Follicular phase 2-13

Mid cycle 14-6

Luteal phase 1-11

FSH (IU/L) 1.8 Follicular phase 4-13

Mid cycle 5-22

Luteal phase 2-8

Postmenopause>25

ACTH (ng/L) <3 0-50
Prolactin (mU/L) 806 102-496
Serum Na mmol/L 144 133-146
Serum Osmolality mOsmo/Kg 293 282-300
Random Urine Osmolality mOsmo/Kg 475 100-1400
LDH (u/L) 188 120 to 300
HCG (IU/L) <1 0-1
alpha Fetoprotein (kU/L) 1 0-10
C-Reactive protein (mg/L) 1.5 0-5
ESR (mm/h) 28 1-12
Complement C3 (g/l) 1.1 0.75-1.65
Complement C4 (g/l) 0.29 0.14-0.54
Antinuclear antibodies Negative
Angiotensin convert enzyme (U/L) 42 16-85
IgG4 (g/L) 0.04 0-1.3


A repeat MRI scan 3 months later discussed in a multidisciplinary meeting was reported to suggest Rathke’s cleft cyst abscess/ Pituitary abscess (Figures 1 and 2). She underwent a trans-sphenoidal endoscopic pituitary biopsy for diagnosis. The appearances suggested a Rathke’s left cyst and a pituitary abscess. Immunostaining for ACTH, FSH, LH, growth hormone, TSH and Prolactin, chromogranin, synaptophysin, and collagen IV was consistent with anterior pituitary tissue. Microbiological culture on prolonged incubation was positive for Propionibacterium with no acid-fast bacilli growth. TB culture was also negative. She received a 6-week course of antibiotics, including 2 weeks of intravenous ceftriaxone and oral metronidazole followed by 4 weeks of oral co-amoxiclav. Her headaches and vomiting deteriorated after biopsy with a peak CRP of 218 mg/L, which resolved following medical treatment. Imaging with MRI and baseline pituitary function blood tests has since been repeated following the 6 weeks to assess the management’s effectiveness, which showed normal results. The patient reported the resolution of headaches and able to resume full-time schooling.

fig 1 414

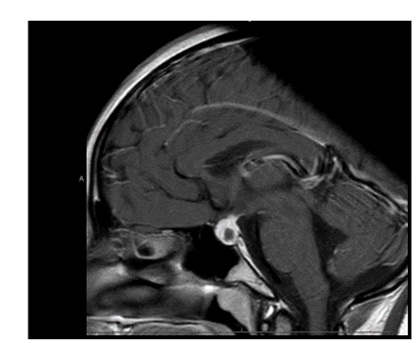
Figure 1: MRI at presentation.

fig 2 414

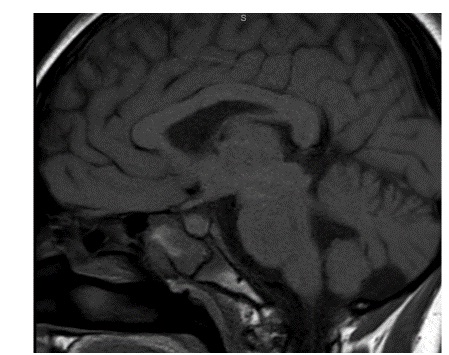
Figure 2: MRI 3 months after transphenoidal surgery.

Case 2

29 years old Caucasian fine arts student presented to the emergency department with fever, headaches, profuse sweating, tiredness, and blurring of vision. Her symptoms, particularly headaches, had worsened over the last 12 months. She had noticed polydipsia and polyuria. She also had amenorrhoea for twelve months. She was treated at her local hospital twice in the preceding 3 years with symptoms of headaches, fever, weight loss, and vomiting. She had a lumbar puncture 3 times to rule out a possibility of central nervous system infection. On both occasions, she was discharged home after empirical treatment with antibiotics for suspected meningitis. There was no other past medical history. There was no recent travel history or infectious contacts. She was not on any regular medications.

The initial pituitary MRI and contrast-enhanced MRI scan revealed the absence of the posterior pituitary bright spot and a thickened pituitary stalk with a deviation of infundibulum to the right. There was a homogenous hyperintense area within the pituitary gland with no discernable pituitary tissue. This area was hypointense on T2 (Figures 3-5). The differential diagnosis was apoplexy, hypophysitis or a proteinaceous cystic lesion replacing or compressing the pituitary gland. The optic nerves and the chiasm appeared normal. Her investigations confirmed her to have hypopituitarism with Diabetes insipidus (Table 2). Her lumbar puncture showed no CSF abnormality. Her tumor markers and Quantiferon for tuberculosis were negative. The case was discussed in multidisciplinary meeting (MDT) and with empirical diagnosis of hypophysitis, she was started on prednisolone with the replacement of deficient hormones, including Desmopressin. She showed no improvement in her clinical symptoms. A 3 month interval scan showed an increase in the size of the pituitary gland with further thickening of the stalk and optic chiasm displaced superiorly. After the second discussion in MDT, she had a pituitary biopsy. During surgery, soft yellow-white pus-like material was drained after dural incision. The microscopy showed necrotic material with a little amount of compressed anterior pituitary gland, chronic inflammation, and no evidence of adenoma or granuloma or giant cells was found. No acid-fast bacilli or organisms were seen on gram staining, and the culture for TB was negative. There was scanty growth of Propionibacterium acneformis. Her interval scan 3 months later showed complete resolution of the non-enhancing T1 hypertense pituitary tissue with a further decrease in the size of the pituitary gland. She remains on full hormones replacement. She had an insulin tolerance test that confirmed her growth hormone deficiency, and she is now on growth hormone replacement. She remains on hydrocortisone, Thyroxine, female hormone replacement, and Desmopressin.

fig 3 414

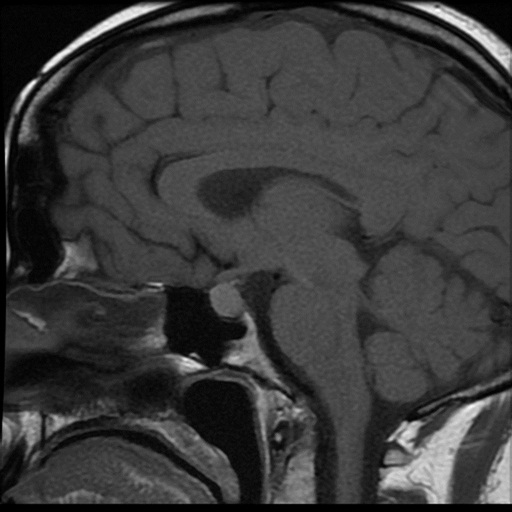
Figure 3: MRI at presentation.

fig 4 414

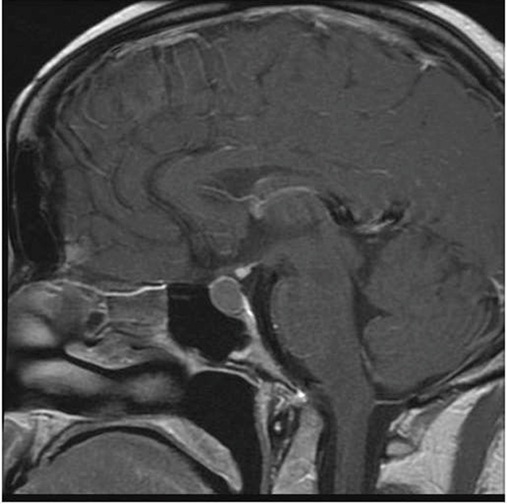
Figure 4: MRI 3 months later.

fig 5 414

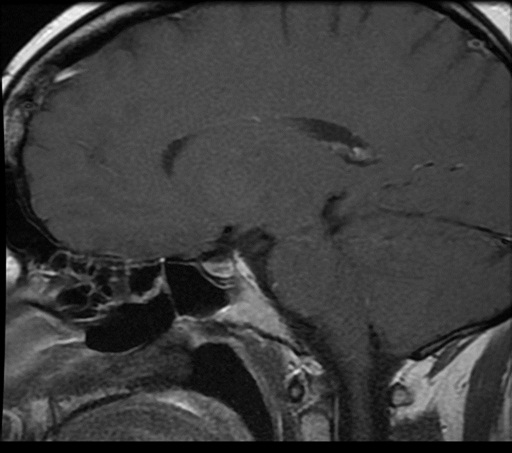
Figure 5: MRI post-surgery.

Table 2: Results at initial presentation.

                   Short Synacthen test

Time T=0 T-30
Cortisol (nmol/L) 148 169

                   Baseline tests

Test Result Normal range
IGF-1(nmol/L) 12.7 11.9-40.7
TSH (mU/L) 1.35 0.27-4.20
T4 (pmol/L) 5.3 10.8-25.5
LH (IU/L) 3.1 Follicular phase 2-13

Mid cycle 14-96

Luteal phase 1-11

FSH (IU/L) 5.1 Follicular phase 4-13

Mid cycle 5-22

Luteal phase 2-8

Postmenopause>25

Oestradiol (pmol/L) <92 92-1462
Prolactin (mU/L) 577 102-496
Serum Na mmol/L 142 133-146
Serum Osmolality mOsmo/Kg 301 275-295
Random Urine Osmolality mOsmo/Kg 154 100-1400
CSF-b HCG (IU/L) <2 <2
CSF-alpha fetoprotein (µg/L) <1 <1
C-reactive protein (mg/L) 1.4 0-5
ESR (mm/h) 3 1-12
Antinuclear antibodies Negative
IgG4 (g/L) <0.01 0-1.3

Discussion

A pituitary abscess is an infectious process characterized by the accumulation of purulent material in the sella turcica. It is rare, and can be a life-threatening condition unless promptly diagnosed and treated. We report 2 cases of secondary pituitary abscess in young women. The first case was due to abscess in the Rahtke’s cleft cyst (RCC), and the second was Pituitary gland abscess with a history of otitis media and repeated lumbar punctures for presumed meningitis.

The clinical presentation of PA is nonspecific, such as headaches, pituitary hypofunction, and visual disturbances, whereas the infection can be discreet and inconstant [5,6]. Symptoms can be acute, subacute, or chronic, explaining the late diagnosis; in some cases. Visual disturbance, including hemianopia, can be present in 50% of cases. Headache without a particular pattern is a regular feature (70-90%) and can be debilitating. Anterior pituitary hypofunction due to destruction and necrosis of the gland is the commonest presentation resulting in fatigue and amenorrhoea (54-85%). In one series, 28 out of the 33 patients had anterior pituitary hypofunction. Pituitary hormone deficiencies persist in the majority of patients following treatment Up to 70% of patients with PA can have central Diabetes insipidus. In contrast, fever with signs of meningeal irritation is reported in 25% of cases [5].

MRI is the imaging of choice for the pituitary lesions. PA can present as a suprasellar mass (65%) or as an intrasellar mass (35%). A typical PA appears as a single cystic or partially cystic mass that is hypointense on T1-weighted image and hyperintense in T2-weighted image. It can show a rim of enhancement after contrast gadolinium. The posterior pituitary bright spot is mostly absent in majority of the cases (Wang et al.). The lesion’s signal depends on protein, water, lipid content, and whether there is hemorrhage. Imaging can also show the invasion of an adjacent anatomical structure, peripheral meningeal enhancement, thickening of the pituitary stalk, and paranasal sinus enhancement [6].

Diffusion-weighted magnetic resonance imaging (DWI) is widely used to differentiate cerebral abscess from other necrotic masses. Brain abscesses typically show high intensity on DWI with decreased apparent diffusion coefficient (ADC) value in their central region. The high intensity on DWI is useful but not specific to PA because pituitary apoplexy can also exhibit high intensity on DWI [7]. The accuracy of DWI in PA remains controversial. In the Wang et al. case series, PA was misdiagnosed in one-third of the case [6]. The radiological differential diagnosis includes, Rathke’s cleft cyst, cystic pituitary adenoma, arachnoid, and dermoid cysts, metastases, glioblastoma multiforme, chronic hematoma, and multiple sclerosis [8]. Rathke’s cleft cyst mainly can mimic a pituitary abscess [9]. RCC is the second most common incidentaloma after adenomas and accounts for 20% of incidental pituitary lesions at autopsy. The incidence of RCCs in children was reported to be much lower than in adults. However, the prevalence is now believed to be much higher, especially among those with the endocrine-related disorder [10]. Gunes et al. reported the radiological appearance of RCC on MRI in 13.5% of the children who underwent MRI for the investigation of endocrine-related disorders. Patients with RCC are usually asymptomatic, but symptomatic RCC is more common in females in both adult and pediatric populations [11]. RCC can cause significant morbidity such as headache, visual disturbances, chemical meningitis, endocrine dysfunction (hypothyroidism, menstrual abnormalities, diabetes insipidus, adrenal dysfunction, and very rarely apoplexy). Short stature, growth deceleration, delayed puberty are also reported in children and adolescents.

The diagnosis of PA in most cases can only be confirmed after surgical exploration, due to overlapping of clinical signs, symptoms, imaging, and laboratory findings with other sellar lesions. Signs of inflammation are present in less than a third of the patients. The PA should be included in the differential diagnosis of patients with headaches or signs of pituitary dysfunction and patients with pituitary mass who develop signs of meningeal inflammation.

The main treatment for PA in patients with mass effect is Transsphenoidal excision (TSS) with decompression of sella and antibiotic therapy. This can result in the resolution of visual abnormalities. Treatment is effective for typical symptoms such as fever, headache, and visual changes. Patients with shorter duration of symptoms and those with primary abscess have better improvement in their pituitary dysfunction. Majority of the patients remain with pituitary dysfunction even after the treatment.

Antibiotic therapy should to started promptly even in the patients who are waiting for microbiology and histological confirmation for about 4–6 weeks [1,12]. Empirical treatment with ceftriaxone is indicated until the results are available. Hormone replacement is commenced depending on the hormone deficits including stress dose glucocorticoid therapy. Hypocortisolemia should be recognized among patients presenting with sellar masses, as early diagnosis and treatment improve survival and endocrinological outcome. Patients who suffer from the pituitary abscess may eventually have a good quality of life if they are diagnosed and treated early. A craniotomy is reserved for larger lesions with the suprasellar extension or where transsphenoidal surgery is ineffective [13]. In a series published with 66 patients, 81.8% of patients recovered completely, 12.1% of patients had at least one operation for recurrence, and only one patient had died [14].

There are widespread pathogenic microorganisms in abscesses. These include Gram-positive bacteria, Gram-negative bacteria, anaerobes, and fungi [8,11]. Streptococcus and Staphylococcus are the most predominant Grampositive bacteria, whereas Escherichia coli, Mycobacterium, and Neisseria have also been reported [3,10,11]. Aspergillus fumigatus is mostly isolated in cases of secondary PA. Immunosuppressed patients mostly have Candida and Histoplasma. Cultures are positive only in 50% of cases; therefore, broad-spectrum antibiotics are given as empirical treatment. The pathogen identification is important for the therapeutic management [15].

Both patients had culture-positive for Propionibacterium acnes (P. acnes). This organism is seated deeply in the pilosebaceous glands, mainly in the scalp and face. It is a slow-growing, pleomorphic, non-spore-forming gram-positive anaerobic bacillus that is a universal component of the normal skin microbiota. It is usually considered a contaminant of blood cultures but occasionally can cause serious infections, including postoperative central nervous system (CNS) infections. P. acnes are the most commonly isolated organism after Staphylococcus aureus and Staphylococcus epidermidis following craniotomies. In the presence of heavy infiltrates, the Gram stain is not reliable. Gram stain is only positive in about 10.5% of clinically significant infections with moderate growth. P. acnes behave in a less aggressive manner than other postsurgical organisms and only accounts for a small fraction of CNS infections [16]. P. acnes abscesses typically follow craniotomy, shunts, access to reservoirs, trauma, and foreign bodies. Granulomatous responses have been documented in the CNS following P. acnes infections.

P. acnes grow slowly in the laboratory. This can cause in a delay in diagnosis, missed diagnosis, or delay in treatment if specimens are not cultured for an extended period. Cultures may not grow for as long as 14 days, so samples should be held beyond the usual 5 to 7 days. Gram stain may not be a reliable technique for the rapid diagnosis of P. acnes infections. When there is evidence of an abundant inflammatory response in the Gram-stained smear, a more careful evaluation of cultures must be performed. Polymerase chain reaction for the 16S rRNA or mass spectrometry can be a useful tool for rapid identification and typing of P. acnes following recovery in culture. Propionibacterium is susceptible to antibiotics used for the treatment of anaerobic infections, including penicillin, erythromycin, lincomycin, and clindamycin, but not metronidazole, which is notably ineffective against P. acnes [17].

Patients with PA should be followed up with serial MRI of the pituitary, hormonal profile and visual fields at 3, 6, and 12 months after surgery. The recurrence rate is variable and depends on the nature of the abscess (primary or secondary. The majority of relapses are associated with either an immunological defect or previous pituitary surgery [12,18].

Conclusion

We presented 2 cases of unusual sellar mass from an abscess in an adolescent and a young adult due to P. acnes, both responded well to treatment.

The pituitary abscess should be included as the differential diagnosis of patients with a sellar or a suprasellar mass, headaches, pituitary dysfunction, and meningeal inflammation.

The diagnosis is difficult before surgery because of overlapping clinical signs, radiological and laboratory findings with other sellar lesions.

Broad-spectrum antibiotics should be started empirically even before the culture results are available.

Culture is positive only in 50% of cases, and in case of unusual bacteria like P. acnes, an extended culture is required for the confirmation of the diagnosis.

Pituitary dysfunction should be recognized and appropriately treated particularly glucocorticoid replacement.

Transsphenoidal surgery is the treatment of choice and this is followed by pronged 4-6 weeks of broad-spectrum antibiotic therapy.

Early and efficient surgical and medical management results in lower mortality and higher recovery of pituitary hormone function.

Patients should be followed up with MRI imaging, assessment of the hormone replacement if required, and visual field assessment because of a chance of recurrence.

References

    1. Lin Y, Lin F, Liang Q, Li Y, Wnag Z, et al. (2017) Pituitary abscess: report of two cases and review of the literature. Neuropsychiatr Dis Treat 13: 1521-1526. [crossref]
    2. Furnica RM, Lelotte J, Duprez T, Maiter D, Alexopoulou O, et al. (2018) Recurrent pituitary abscess: case report and review of the literature. Endocrinol Diabetes Metab Case Rep 17-0162. [crossref]
    3. Kummaraganti S, Bachuwar R, Hundia V, et al. (2013) Pituitary abscess: A rare cause of pituitary mass lesion. Endocrine Abstracts 31: 1. [crossref]
    4. Al Salamn JM, Al Agha RAMB, Helmy M, et al. (2017) Pituitary abscess. BMJ Case Rep 2016-217912. [crossref]
    5. Nordjoe YE, Igombe SRA, Laamrani FZ, Jroundi L, et al. (2019) Pituitary abscess: two case reports. J Med Case Rep 13: 342.
    6. Wang Z, Gao L, Zhou X, Guo X, Wang Q, Lian W, Wang R, Xing B, et al. (2018) Magnetic resonance imaging characteristics of pituitary abscess: a review of 51 cases. World Neurosurg 114: e900-e902. [crossref]
    7. Xu XX, Li B, Yang HF, Du Y, Li Y, Wang WX, et al. (2014) Can diffusion-weighted imaging be used to differentiate brain abscess from other ring-enhancing brain lesions? A meta-analysis. Clin Radiol 69: 909-915. [crossref]
    8. Corsello SM, Paragliola1 RM, et al. (2017) Differential diagnosis of pituitary masses at magnetic resonance Imaging. Endocrine 58: 1-2.
    9. Coulter IC, Mahmood S, Scoones D, Bradey N, Kane PJ, et al. (2014) Abscess formation within a Rathke’s cleft cyst. J Surg Case Rep 11: 105. [crossref]
    10. Vasilev V, Rostomyan1 L, Daly AF, Potorac J, Zacharieva S, et al. (2016) Bonneville JF and Becker A. Pituitary ‘incidentaloma’: neuroradiological assessment and differential diagnosis. European Journal of Endocrinology 175: R171-R18. [crossref]
    11. Güneş A, Güneş SO (2020) The neuroimaging features of Rathke’s cleft cysts in children with endocrine-related diseases. Diagn Interv Radiol 1: 61-67. [crossref]
    12. Vates GE, Berger MS, Wilson CB, et al. (2001) Diagnosis and management of pituitary abscess: a review of twenty-four cases. J Neurosurg 95: 233-241. [crossref]
    13. Karagiannis AKA, Dimitropoulou F, Papatheodorou A, Lyra S, Seretis A, Vryonidou A, et al. (2016) Pituitary abscess: a case report and review of the literature. Endocrinol Diabetes Metab Case Rep [crossref]
    14. Ling X, Zhu T, Luo Z, Zhang Y, Chen Y, Zhao P, Si Y (2017) A review of pituitary abscess: our experience with surgical resection and nursing care. Transl Cancer Res 6(4): 852-859.
    15. Achermann Y, Goldstein EJC, Coenye T, Shirtliff ME, et al. (2014) Propionibacterium acnes: from Commensal to Opportunistic Biofilm-Associated Implant Pathogen. Clin Microbiol Rev 27: 419-440. [crossref]
    16. Chung S, Kim JS, Seo SW, Ra EK S, Joo SI, Kim SY, Park SS, Kim EC, et al. (2011) A Case of Brain Abscess Caused by Propionibacterium acnes 13 Months after Neurosurgery and Confirmed by 16S rRNA Gene Sequencing. Korean J Lab Med 31(2): 122-126. [crossref]
    17. Yacoub AT, Khwaja S, Daniel L, et al. (2015) Propionibacterium acnes Causing Central Nervous System Infections: A Case Report and Review of Literature. Infectious Diseases in Clinical Practice 23: 60-65. [crossref]
    18. Batool SM, Mubarak F, Enam SA, et al. (2019) Diffusion-weighted magnetic resonance imaging may be useful in differentiating fungal abscess from malignant intracranial lesion: Case report. Surg Neurol Int 10: 13. [crossref]
fig 1

Safety and Efficacy of a Spirulina-Based Dietary Supplement, in Patients with Long-Term Tendinopathy: An Observational Preliminary Study

DOI: 10.31038/IJOT.2020323

Abstract

Background: In vitro data demonstrated that TOL-19-001, a spirulina-based dietary supplement, improves tendon healing in IL-1β and ciprofloxacin induced tendinopathies

Aim: To obtain, from real life conditions, preliminary data on efficiency and safety of TOL19-001, before designing a high quality double-blind, controlled clinical trial.

Patients and methods: Cross-sectional survey including 300 consecutive subjects treated at least 3 months with TOL-19-001 for a tendinopathy. Patients were asked to fulfill a 37-item questionnaire including demographic data, previous and current sports activity, location and duration of the tendinopathy, previous and current treatments for tendinopathy, patient assessment of efficacy, safety, and satisfaction. Patients were classified according to the tendinopathy duration (<and> 6 months).

Results: 219 patients (73%) fulfilled the questionnaire (mean age 61, range 21-88). The most frequently involved tendons were rotator cuff (44%), lateral epicondyle (19%) and Achilles (16%) tendons. Before taking TOL19-001 most patients have been treated with NSAIDs and/or analgesics (56%), rehabilitation/physiotherapy (58%), corticosteroid injection (40%), and shock waves (21%). Patients with tendinopathy 6 months (65%) were not significantly different regarding demographics, sports activity and tendinopathy location. 88% of patients reported improvement in pain and function after TOL19-001 treatment. Time for achieving improvement was 8 weeks in 28%. There was no difference in patient’s satisfaction according to the involved tendon and the tendinopathy duration. 78% of patients who had to stop professional or sports activity were able to return to sport or work. The percentage of patients who returned to sport was lower in long-lasting tendinopathies (77% vs. 93%; p=0.004). There was no safety concern.

Conclusion: Due to its original mechanism of action, TOL19-001 might be helpful in patients with long-lasting tendinopathy, in whom the conventional treatment has failed. Randomized controlled trials are mandatory to confirm or refute these preliminary data.

Introduction

Tendinopathies account for a substantial percentage of overuse injuries in sports and are very common causes of consultation with General Practitioners (GPs), rheumatologists and sports medicine doctors [1,2]. The medical management of tendinopathy includes non-pharmacological approach (i.e., rest, rehabilitation with eccentric exercises and stretching, low laser therapy, extracorporeal shock waves, cryotherapy…) and pharmacological treatments [3-5]. The latter are mainly symptomatic and include analgesics, Non-Steroidal Anti-Inflammatory Drugs (NSAIDs), corticosteroid, prolotherapy, and hyaluronic acid [6] or Platelet-Rich Plasma (PRP) injections. NSAIDs, in the absence of an inflammatory process, do not change the course of chronic tendinopathy [5] and should be used with caution, because of a possible negative effect on the regenerative processes of tissue [7]. Corticosteroid injections are very commonly used but have a short-term effect on pain and their effectiveness at long term has not been evidenced [4]. However, despite the adequate use of the available therapies, tendinopathies can result in chronic disability and ultimately in the most severe cases, in tendon rupture most often requiring surgery.

Histologic abnormalities of tendinopathy include tenocyte apoptosis, disorganization of the collagen matrix, and acute or chronic inflammation mediated through an up regulation of pro-inflammatory cytokines, enhancing Matrix Metalloproteinases (MMPs) expression, and Prostaglandin E2 (PGE2) production [5,8,9]. Despite an appropriate management, after injury the tendon structure and mechanical properties can no more reach those of healthy tendons, especially because of higher concentrations of type III collagen, thinning of fibrils and hypercellularity [8]. All these histologic abnormalities result in tendon weakening that predispose to injury recurrences. However, most of the tendinopathies have a spontaneously favorable prognosis, and cure in a few weeks to a few months, even in absence of treatment, provided that relative rest is maintained.

TOL19-001 is a food supplement composed of spirulina, glucosamine sulfate and several antioxidants (ginseng, selenium, silicon, iron, vitamin E and zinc). Due to its mechanisms of action TOL19-001 might improve tendon healing by inhibiting the abnormal production of type III collagen. In an in vitro study Baugé et al. [8] showed that, in IL-1β stimulated human tenocytes, co-treatment with TOL19-001 reduced the effects of IL-1β by inhibiting by about 40% the induction of matrix metalloproteases MMP1, MMP2 and MMP3. Interestingly, TOL19-001 reduced dramatically (by 80%) type III collagen expression, suggesting a potential effect on tendon healing.

Before considering the design of a high quality clinical controlled trial, aimed to demonstrate the clinical effectiveness of TOL19-001 in patients with chronic or remitting tendinopathies, it seemed to us of mandatory to obtain data from real life conditions, on both efficacy and safety of TOL19-001. Hence, we conducted the present study by collecting data on safety and efficacy, in subjects suffering from a tendinopathy who have been treated with TOL19-001 in daily practice conditions. We particularly studied those whose tendinopathy had been evolving for more than 12 months. Indeed, if one can imagine that most of the patients, treated for a recent tendinopathy would have cured anyway in a few weeks or months, it is much unlikely that those suffering from a tendinopathy for more than 1 year, despite adequate care, can heal within a few weeks.

Patients and Methods

Design: Observational Cross-sectional Survey

Patients

300 consecutive patients who have been treated within the previous year with TOL19-001 (marketed under the brand name Cicatendon®, Labrha SAS, Lyon, France) at a dosing regimen of 2 capsules by day for at least 3 months, for a symptomatic tendinopathy, were asked to fulfill a 37-item standardized questionnaire. Patients were fully informed of the trial objectives and methodology and were required to give their oral informed consent on the scientific and anonymous usage of the data collected in the questionnaire. The survey was achieved in compliance with the reference methodology of the French “Conseil National Informatique et Libertés” (CNIL MR-001).

Patients were registered under a single number, in increasing order of inclusion (neither initials nor birth dates were registered). According to the French regulatory, no IRB number was necessary due to the non-drug status of the studied food-supplement. The questionnaire was administered by a single research nurse, blinded to the patient’s identity. Demographic data (gender, age, professional activity), previous and current sports activity, frequency of sports practice, location of the tendinopathy, history of recurring tendinopathy, time since diagnosis, analgesics and NSAIDs consumption, previous and current pharmacological and non-pharmacological treatments for tendinopathy, patient self-evaluation of efficacy, satisfaction with the treatment and tolerability were all collected on a 4-point Likert scale (4 pt-LS). Patients were classified according to the disease duration (<and> 6 months).

Statistics

A descriptive analysis was performed on the collected data. Qualitative variables were described using frequencies and percentages. Quantitative variables were described using mean, standard deviation and characteristics of their distribution (minimum, maximum and median). Univariate analysis was performed using chi-2 test or Fischer’s exact test, or Mann-Whitney test as appropriate. All statistical tests were carried out two tailed at the 5% level of significance. The statistical analysis was carried out using XLstats© software version 2019.3.2 (Addinsoft).

Results

Patients’ Characteristics

Two hundred nineteen patients (73%) accepted to fulfill the questionnaire: 59% were women, and 41% men. The mean age was 61, ranging from 21 to 88. Most patients were retired (56%) and practiced a regular sporting activity (61%), mostly twice a week. In 66% the present tendinopathy was the first one involving this tendon, but 51% had history of previous tendinopathy at other(s) tendon(s). The most frequently involved tendons were rotator cuff (44%), lateral epicondyle (19%) and Achilles (16%) tendons. Before taking TOL19-001 most patients have been treated with NSAIDs and/or analgesics (56%), rehabilitation and physiotherapy (58%) Forty percent received at least one corticosteroid injection, and 21% were treated with shock wave therapy. Prescribers were mostly rheumatologists (45%) and sports medicine practitioners (14%). The tendinopathy was attributed by patients to a transient overuse (26%), sports practice (24%), work (21%) and injury (13%). In 16% no etiology was mentioned. At time of TOL19-001 prescription, the tendinopathy has been evolving for less than 3 months in 20% of patients, from 3 to 6 months in 15%, from 6 to 12 months in 11% and for more than 1 year in 54%.

The 76 patients with recent tendinopathy (<6 months) and the 143 with long-lasting tendinopathy (>6 months) were not significantly different regarding gender, age, body mass index, sports activity, tendinopathy location (all p>0.05). Patients with long-lasting tendinopathy were more often treated by rheumatologists, whereas those with recent tendinopathy were more likely treated by sport medicine practitioners (p=0.04). Patients with long-lasting tendinopathy attributed it more frequently to their professional activity (27%) but the difference with patients with recent tendinopathy (12%) did not reach the statistical significance (p=0.07). Unsurprisingly the 2 subgroups differed in the treatments used before resorting to TOL19-001 (p=0.001): In 38% of patients with recent tendinopathy, TOL19-001 was the first-line treatment versus only 17% in patients with long-lasting tendinopathies. Long-lasting tendinopathies were more frequently treated with corticosteroid injection (44% versus 30%). The full patients’ characteristics are given in Table 1.

Table 1: Patients characteristics.

Items Units All <6 Months >6 Months P Value
Number of patients N 219 76 143
Gender: M/F % 41/59 43/57 39/61 0.66
Age (SD) range year 61(13) 21-88 61 (13) 28-88 61(13) 21-86 0.99
BMI (SD) range kg/m2 25(4) 18-35 24(4) 18-35 25(4) 18-38 0.70
Activity

  • Active/Retired or inactive
 

%


44/56


51/49


42/58


0.26

Regular sport practice: Yes/No % 61/39 67/33 58/42 0.24
Weekly sport practice

  • 1 time
  • 2 times
  • 3 times or more


%


29

42

30


32

47

21


25

39

35


0.08

First tendinopathy: Yes/No % 66/34 73/27 61/39 0.07
History of other tendonitis Yes/No % 49/51 49/51 49/51 1
Involved tendon

  • Rotator cuff tendinopathy
  • Epicondylitis
  • Calcaneus tendinopathy
  • Other


%


44

19

16

21


42

22

18

18


45

16

15

24


0.64

Previous treatment for current tendinopathy

  • None
  • Rehabilitation
  • Shock waves
  • NSAIDS/analgesics
  • Corticosteroid injection
  • PRP injection
  • Hyaluronic acid injection
  • Acupuncture


%


25

58

21

56

40

4

5

16


38

55

19

53

30

2

0

6


17

58

22

57

44

4

7

19


0.001

Prescriber of TOL19-001

    • Rheumatologist
    • Sport medicine
    • Orthopedic surgeon
    • General practitioner
    • Other


%


45

14

4

4

33


36

22

1

4

37


50

10

5

4

31


0.04

Probable cause of tendinopathy

    • Sport
    • Work
    • Injury
    • Transient overuse
    • No detectable cause


%


24

21

13

26

16


29

12

11

29

19


21

27

14

24

14


0.07


Efficacy Outcomes

Eighty-eight percent of patients reported pain and function improvement after TOL19-001 treatment. Time needed to achieve improvement was <4 weeks in 36% of patients, 4 to 8 weeks in 37% and more than 8 weeks in 28%. After TOL19-001 treatment, 78% of patients who had to stop their professional of sport activity because of the tendinopathy, were able to return to sport or go back to work. Overall, 83% of patients expressed satisfaction with the treatment (24% very satisfied, 59% satisfied, 10% little satisfied, 7% not satisfied). There was no difference in the patient’s satisfaction according to the involved tendon (χ2, P=0.54; Fisher’s test, P=0.48) and gender (P=0.24). Satisfaction was positively correlated with age (Figure 1).

fig 1

Figure 1: Self-rated patient’s satisfaction according to age.

Differences between Recent and Long-Lasting Tendinopathies

Even more interestingly, there was no significant difference in improvement (P=0.89), time before onset of improvement (P=0.12) and patient satisfaction (P=0.15) (Table 2), according to the tendinopathy duration. However, the percentage of patients who returned to sport or professional activities was lower in long-lasting tendinopathies (P=0.004) and the treatment duration was significantly longer (P=0.001) in the latter than in those with recent ones. All details are given in Table 3.

Table 2: Improvement, patient’s satisfaction and return to sport and professional activities, according to the tendinopathy duration (6 months).

Items Units All <6 Months >6 Months P Value
Number of patients N 219 76 143
Improvement Yes/No % 88 93 86 0.89
Percentage of improvement

  • <25%
  • [25-50[%
  • [50-75[%
  • [75-100[%
  • 100%
 

12.5

22.8

37.2

21.9

5.6


9

21

35

23

9


16

25

37

21

2


0.15

Time before improvement

    • <2 weeks
    • [2-4[ weeks
    • [4-8[ weeks
    • > 8 weeks


%


8

28

37

28


9

25

45

21


7

29

31

33


0.12

TOL19-001 treatment duration

    • <3 months
    • [3-6[ months
    • >6 months


%


11

36

53


16

42

42


9

33

58


0.001

Satisfaction

    • Very satisfied
    • Satisfied
    • Little satisfied
    • Not satisfied


%


24

59

10

7


22

68

7

4


26

54

12

8


0.19

Return to sport or work

    • Without limitation
    • With some limitations
    • No recovery


%


49.5

33

17.5


59

34

7


44.4

32.3

23.3


0.004


Table 3: Percentage of satisfied and unsatisfied patients according to the tendinopathy duration before TOL19-001 prescription (χ2 test: P=0.23; Fisher test: P=0.25).

Time Before TOL19-001 (month=M)

<1 M [1 M-3 M[ [3 M-6 M[ [6 M-12 M[

≥12 M


Level of satisfaction

(% of patients)

1-Very satisfied

54.5 12.5 19.3 20.8 26.8

2-Satisfied

45.5 81.2 61.3 62.5

52.7

1+2

100 93.7 80.6 83.3

79.5

3-Little satisfied

0 6.3 9.7 12.5

11.6

4-Not satisfied

0 0 9.7 4.2

8.9

3+4 0 6.3 19.4 16.7

19.5


Safety

Neither severe nor serious Adverse Events (AEs) were reported by the patients. Safety was rated as very good or good by 97% of subjects. Only 7 patients reported minor gastrointestinal discomfort, possibly related to treatment. Three patients (1.4%) discontinued TOL19-001 for AEs.

Discussion

First of all it must be stressed that the present study has not been designed to demonstrate the efficacy of TOL19-001 in tendinopathies, but for giving information that could be useful to design, at best, a controlled trial. It should also be emphasized that, in the absence of a control group, we do not assert that TOL19-001 is an effective treatment for relieving pain and “accelerate” healing of tendinopathies. Although the magnitude of the clinical benefit may be overestimated due to a possible placebo effect, our results suggest that TOL19-001 may be helpful in many patients with long-lasting tendinopathies, in whom conventional therapies have failed. Indeed, it is unlikely that a chronic tendinopathy, lasting for more than 6, and even more than 12 months (i.e., 54% of our cohort), despite a well-conducted treatment (including rehabilitation and corticosteroid injection), spontaneously cures in less than two months, as we observed in several of our patients. On the contrary, as mentioned above, it is probable that most patients suffering from a tendinopathy for less than 3 to 6 months would have healed within 2 or 3 months anyway, even without treatment. It is the reason why we particularly focused attention on patients with tendinopathy evolving for many months (>12 months). Most of them had been forced to stop any sport or professional activity because of the tendinopathy. Among those patients, a large majority could return to sport or work after only a few weeks, most of the time without any limitation. More than 8 out of 10 patients considered TOL19-001 as very effective or effective and were satisfied with the treatment, whatever the tendon involved or the duration of the condition. Yet most of them had already received multiple treatments, without getting healing.

Our survey suffers from several limitations. The present data are patient self-reported and have been obtained retrospectively. Only 73% of TOL19-001 treated patients answered the questionnaire. So it cannot be presumed what the missing 27% would have answered. The retrospective nature of the survey made impossible to measure the decrease of pain over time. Furthermore, we were not able to obtain data about the anatomical severity of the condition and did not have any imaging data. Lastly, satisfaction with a treatment, is a subjective and patient-dependent data, involving many and varied parameters.

It has been shown that the mechanism of action of TOL19-001 is mainly mediated through its antioxidant properties [9]. TOL19-001 is mainly constituted of spirulina (Arthrospira maxima), an undifferentiated multicellular filamentous cyanobacterium, also called blue-green alga. Spirulina is known, since a long time, for being a potential source of vitamins and essential amino acids. Indeed, Spirulina contains a wide spectrum of nutrients including B-complex vitamins, minerals, essential amino-acids, beta-carotene, vitamin E. Spirulina is also noteworthy for its high contents (7%) in fatty acids (α-linolenic acid, linoleic acid, stearidonic acid, docosahexaenoic acid, and arachidonic acid) and proteins, making it desirable as a food supplement [10]. Spirulina has hypolipidemic, hypoglycemic, and antihypertensive properties. It is claimed to have also anti-cancer and immune-suppressing properties [11,12]. Spirulina also exerts a strong Radical Oxygen Species (ROS) scavenging activity and can reduce oxidative damage by decreasing free oxygen radical accumulation, through activation of several antioxidant enzyme systems (i.e., Superoxide Dismutase (SOD), glutathione peroxidase, catalase) [13]. The anti-inflammatory activity of Spirulina is mainly due to phycocyanin as demonstrated in several in vitro and in vivo animal models of arthritis [13].

Spirulina is also an important source of essential amino acids. A strong relationship between leucine and collagen synthesis has been demonstrated in several animal models [5]. A positive effect on collagen synthesis was demonstrated in malnourished mice teated with a leucine-enriched diet. Leucine increases hydroxyproline levels which plays a role in collageb fiber stability [14]. Glycine also stimulates the synthesis of both hydroxyproline and glycosaminoglycans, resulting in higher collagen fiber strength [15]. These properties could also support recovery from tissue damage [5].

TOL19-001® is mainly composed of Spirulina maxima (about 60%), but also contains significant amounts of glucosamine sulfate (~20%), and ginseng (~15%). Consequently, it is impossible to assert which of these components are responsible for TOL19-001 effect on the tendon. A systematic review [16] including preclinical and clinical data from 46 articles suggested that several nutraceuticals (i.e. curcumin, vitamin C, bromelain, glucosamine, chondroitin…) demonstrated beneficial effects on normal and pathological tendons through a possible role on collagen synthesis, inflammation, mechanical properties, oxidative stress, and analgesia. We previously published that TOL19-001® reduces the expression of MMPs, PGE2 and type III collagen in IL-1β stimulated cells. By reducing MMPs, TOL19-001 might reduce the deterioration and favor regenerative processes and tendon healing [8]. The downregulation of PGE2, likely plays a role in relieving pain due to tendon inflammation.

Glucosamine may also contribute to the beneficial effect of TOL-19-001 on tendon. Animal studies [17-19] have shown positive effects of glucosamine and chondroitin sulfate on collagen synthesis, tendon ultrastructural organization and biomechanical properties, probably as a consequence of the lower tissue inflammation and greater collagen synthesis [19]. Lastly, another reason for TOL19-001 effectiveness in long-lasting tendinopathies may be its ability in reducing type III collagen production, since type III collagen-rich scar tissue impairs tendon function and makes the tendon susceptible to re-injury [8]. This particular property might be beneficial effect on tendon healing, especially in long-lasting or recurrent tendinopathies.

Conclusion

This pilot cross-sectional study, carried-out in real life conditions gave interesting information on tendinopathies clinical evolution in patients taking TOL19-001. It suggested that TOL19-001 might benefit patients with long-lasting tendinopathy, in whom the conventional treatment failed. Further randomized controlled trials, focused on patients with long-lasting tendinopathies and using tendon imaging methods, are mandatory for confirming these preliminary results, and to assess the in vivo mechanisms of action of TOL19-001 on tendon tissue.

Authors Contribution

TC performed data analysis, contributed to the drafting the article, gave final approval of the version to be published, and agreed to be accountable for all aspects of the work.

PL wrote the article, gave final approval of the version to be published, and agreed to be accountable for all aspects of the work.

EN contributed to the drafting the article, gave final approval of the version to be published, and agreed to be accountable for all aspects of the work.

HB contributed to the drafting the article, gave final approval of the version to be published, and agreed to be accountable for all aspects of the work.

Funding

No funding.

None of the authors have received fees related to the present study.

LABRHA SAS paid only for the article publication.

Ethics Declarations

Conflict of Interest

HB declares having received fees from LABRHA SAS as a board member.

TC declares having received fees from LABRHA SAS as a scientific and medical consultant and board member.

EN and PL declare that they have no conflict of interests related to the present study.

Informed Consent

Due to the retrospective nature of the study, the patient consent was not required. We make sure to keep patient data confidential and compliance with the Declaration of Helsinki.

Availability of Data and Materials

All data generated or analyzed during this study are available at Laboratoire de rhumatologie appliqué; 19 place Tolozan, Lyon, France.

References

    1. Andarawis-Puri N, Flatow EL, Soslowsky LJ (2015) Tendon Basic Science: Development, repair, regeneration, and healing. J Orthop Res 33: 780. [crossref]
    2. McCormick A, Charlton J, Fleming D (1995) Assessing health needs in primary care. Morbidity study from general practice provides another source of information. BMJ 310: 1534. [crossref]
    3. Andres BM, Murrell GAC (2008) Treatment of tendinopathy: What works, what does not, and what is on the horizon. Clin Orthop Relat Res 466: 1539-1554. [crossref]
    4. Childress MA, Beutler A (2013) Management of chronic tendon injuries. Am Fam Physician 87: 486-490. [crossref]
    5. Loiacono C, Palermi S, Massa B, Belviso I, Romano V, et al. (2019) Tendinopathy: Pathophysiology, therapeutic options, and role of nutraceutics. A narrative literature review. Medicina (Kaunas) 55: 447. [crossref]
    6. Abate M, Schiavone C, Salini V (2014) The use of hyaluronic acid after tendon surgery and in tendinopathies. Biomed Res Int 2014: 783632. [crossref]
    7. Zhang K, Zhang S, Li Q, Yang J, Dong W, et al. (2014) Effects of celecoxib on proliferation and tenocytic differentiation of tendon-derived stem cells. Biochem Biophys R Commun 450: 762-766.
    8. Baugé C, Leclercq S, Conrozier T, Boumediene K (2015) TOL19-001 reduces inflammation and MMP expression in monolayer cultures of tendon cells. BMC Complement Altern Med 15: 217. [crossref]
    9. Riley G (2008) Tendinopathy-from basic science to treatment. Nat Clin Pract Rheumatol 4: 82-89. [crossref]
    10. Nicoletti M (2016) Microalgae nutraceuticals. Foods 5. [crossref]
    11. Khan Z1, Bhadouria P, Bisen PS (2005) Nutritional and therapeutic potential of spirulina. Curr Pharm Biotechnol 6: 373-379. [crossref]
    12. Finamore A, Palmery M, Bensehaila S, Peluso I (2017) Antioxidant, immunomodulating, and microbial-modulating activities of the sustainable and ecofriendly spirulina. Oxid Med Cell Longev  2017: 3247528. [crossref]
    13. Romay C, Armesto J, Remirez D, González R, Ledon N, et al. (1998) Antioxidant and anti-inflammatory properties of C-phycocyanin from blue-green algae. Inflamm Res Off J Eur Histamine Res Soc Al 47: 36-44. [crossref]
    14. Barbosa AWC, Benevides GP, Alferes LMT, Salomão EM, Gomes-Marcondes MCC, et al. (2012) A leucine-rich diet and exercise affect the biomechanical characteristics of the digital flexor tendon in rats after nutritional recovery. Amino Acids 4: 329-336. [crossref]
    15. Vieira CP, De Oliveira LP, Guerra FDR, De Almeida MDS, Marcondes MCCG (2015) Glycine improves biochemical and biomechanical properties following inflammation of the achilles tendon. Anat Rec 298: 538-545. [crossref]
    16. Fusini F, Bisicchia S, Bottegoni C, Gigante A, Zanchini F, et al. (2016) Nutraceutical supplement in the management of tendinopathies: A systematic review. Muscles Ligaments Tendons J  6: 48-57. [crossref]
    17. Taşkesen A, Ataoğlu B, Özer M, Demirkale İ, Turanli S (2015) Glucosamine-chondroitin sulphate accelerates tendon-to-bone healing in rabbits. Jt Dis Relat Surg 26: 77-83. [crossref]
    18. Lippiello L (2007) Collagen synthesis in tenocytes, ligament cells and chondrocytes exposed to a combination of glucosamine hcl and chondroitin sulfate. Evid Based Complement Alternat Med 4: 219-224. [crossref]
    19. Ozer H, Taşkesen A, Kul O, Selek HY, Turanlı S, et al. (2011) Effect of glucosamine chondroitine sulphate on repaired tenotomized rat achilles tendons. Eklem Hastalik. Cerrahisi 22: 100-106. [crossref]
fig 1

Utilization of a Combined Adductor Canal and IPACK (Interspace between the Popliteal Artery and the Capsule of the Posterior Knee) Block for Pediatric Anterior Cruciate Ligament Repair

DOI: 10.31038/IJOT.2020322


The incidence of Anterior Cruciate Ligament (ACL) reconstruction amongst pediatric patients has risen over the last decade [1]. Injuries to the ACL can result in ligament rupture or, less commonly, traumatic avulsion fracture at the ACL insertion site on the proximal tibia. Postoperative pain control after ACL reconstruction or repair usually involves opioids. Adult literature demonstrated daily opioid consumption of 35-45 mg morphine equivalents in the first 2 weeks after ACL reconstruction [2]. Regional anesthesia has proven to reduce nociceptive pain and opioid requirements following ACL surgery, thereby facilitating earlier hospital discharge and improved patient satisfaction [3-5].

Widely used for knee surgery, the Adductor Canal Block (ACB) provides motor-sparing analgesia to the anteromedial knee and distal medial leg [2,4,6]. However, its lack of posterior knee and anterolateral coverage makes it non-ideal as a sole agent. The ultrasound-guided deposition of local anesthetic to the Interspace between the Popliteal Artery and The Posterior Knee Capsule (IPACK) in combination with blockade of the anterior knee with an ACB has gained significant interest for such surgery [7,8]. Herein we describe the utilization of the IPACK combined with an ACB for arthroscopic ACL repair in a pediatric patient.

A 10-year old, 41kg, healthy male presented following a motor vehicle injury. Imaging revealed left ACL avulsion from its tibial attachment, anterior-lateral meniscus tear and avulsion of the popliteofibular ligament. He underwent arthroscopic assisted repair of the proximal tibial avulsion fracture. Proceeding general anesthesia, the patient was positioned supine with the left lower extremity externally rotated and flexed 40 at the knee. A high-frequency linear ultrasound probe (15MHz) was placed transverse to the medial thigh, and rotated medially to visualize the adductor canal for ACB. A 22-gauge 50 mm echogenic needle was advanced in-plane from the lateral to medial direction, deep to the sartorius and juxtaposed to the vastus medialis. Following negative aspiration, 6ml of bupivacaine 0.25% with preservative-free clonidine 20mcg was deposited in the adductor canal. A curvilinear, low-frequency transducer (2-5MHz) was used for the IPACK to maximize visualization. With the patient in the same position, the probe was placed in the popliteal fossa identifying the popliteal artery and femoral condyles. The probe was then advanced cephalad until the shaft of the femur was visualized. A 22-gauge 80 mm echogenic needle was advanced in-plane, deep to the popliteal artery and above the joint capsule. Following negative aspiration, 10 ml of bupivacaine 0.25% with preservative-free clonidine 20mcg was deposited (Figure 1). Both ACB and IPACK single shot nerve blocks were performed in 6 minutes.

fig 1

Figure 1: IPACK blockade with arrow highlighting needle in-situ. Femoral Artery (FA), Popliteal Nerve (PN), Local Anesthetic (LA).

After the patient was prepped and draped, the anatomic landmarks of the anteromedial and anterolateral portals were identified. Additional short-acting local anesthetic (lidocaine 1% with epinephrine 1:200k) was administered by the surgeon at the anterolateral and anteromedial port sites. The arthroscope was introduced through the anterolateral portal. Systematic arthroscopic evaluation revealed a displaced tibial spine fracture with the ACL attached to a fragment and hinging of the anterior aspect of the fracture with intermeniscal ligament interposition. The intermeniscal ligament was extracted and the fracture bed was debrided. The sutures were secured to the ACL base and then secured to the donor site of the fracture with push lock anchors. There was successful fixation after anchor placement. The patient was maintained on 1 MAC of sevoflurane and received a total of 1.5 mg/kg of ketamine given in divided doses; no intraoperative opioids were required. The total operative time was 89 minutes. The procedure was uneventful and there were no apparent complications. The estimated blood loss was minimal.

In the immediate post-operative period the child’s numeric pain score was 4/10. Pain was isolated to the anterior lateral port site, for which 0.02 mg/kg (1mg) of morphine was administered. Physical exam revealed no sensation to light touch on the anteromedial or posterior knee with preserved plantar-dorsiflexion at the ankle. On 24-hour outpatient follow-up, parents reported good pain control without motor weakness. He received one dose of an oral acetaminophen-opioid preparation approximately16 hours from discharge. There was no evidence of block complication.

Arthroscopic tibial spine fracture repair usually involves medial and lateral parapatellar portals. The tibial spine is fixed via sutures or screws. The ACL emerges from the medial and anterior tibial plateau coursing superiorly to its posterior insertion site along the posterior lateral femoral condyle. As such, surgical manipulation can impose both anterior and posterior capsule knee pain. The ACB reproducibly offers similar anterior knee analgesia when compared to a femoral nerve block while avoiding quadriceps weakness, which allows faster ambulatory recovery and discharge [6,7]. IPACK targets the articular branches originating from the tibial and obturator nerves that travel through a tissue space between the popliteal artery and the femur. It provides posterior knee capsule analgesia by blockade of the obturator, tibial and common peroneal sensory innervation while sparing the motor effect observed with a sciatic nerve block, thereby maintaining the sensorimotor function of the leg and foot.

As evident in a cadaveric study, local anesthetic delivered via IPACK spreads throughout the popliteal fossa without proximal sciatic involvement [8], albeit extension to the common peroneal and tibial nerves was plausible. Combining the ACB and IPACK, opioid-sparing effect can be achieved for ACL repair or reconstruction while preserving motor function. This concept harmonized with the adult literature where reduction of morphine equivalent consumption and faster ambulatory discharge were noted with the addition of an IPACK block for ACL repair [9]. Our experience demonstrated motor-sparing effect and adequate analgesia with the IPACK and ACB combination for a pediatric patient undergoing ACL repair. While the adult literature and our observation suggests promising results, there are no studies that have investigated the safety and efficacy of IPACK block among pediatric patients undergoing knee surgery. Future investigation into the role of the IPACK block for ACL repair in pediatric patients is required.

References

    1. Ellis HB, VandenBerg C, Beck J, Pennock A, Pennock A, Cruz AI, et al. (2019) Trends in pediatric anterior cruciate ligament reconstruction: A review of surgeon fellowship, geography, and meniscus surgery in the ABOS part 2 database. Orthopc J Sports Med. [crossref]
    2. Barnett S, Murray MM, Liu S (2020) Resolution of pain and predictors of postoperative opioid use after bridge-enhanced anterior cruciate ligament repair and anterior crucial ligament reconstruction. Arthrosc Sports Med Rehabil 2: 219-228.
    3. Iskandar H, Benard A, Ruel-Raymond J, Cochard G, Manaud B, et al. (2003) Femoral block provides superior analgesia compared with intra-articular ropivacaine after anterior cruciate ligament reconstruction. Reg Anesth Pain Med 28: 29-32. [crossref]
    4. Abdallah FW, Whelan DB, Chan VW, Prasad GA, Endersby RV, et al. (2016) Adductor canal block provides noninferior analgesia and superior quadriceps strength compared with femoral nerve block in anterior cruciate ligament reconstruction. Anesthesiology 124: 1053-1064. [crossref]
    5. Koh IJ, Chang CB, Seo ES, Kim SJ, Seong SC, et al. (2012) Pain management by periarticular multimodal drug injection after anterior cruciate ligament reconstruction: A randomized, controlled study. Arthroscopy 28: 649-657. [crossref]
    6. Ludwigson JL, Tillmans SD, Galgon RE, Chambers TA, et al. (2015) A comparison of single shot adductor canal block versus femoral nerve catheter for total knee arthroplasty. J Arthroplasty 30: 68-71. [crossref]
    7. Kim D, Beathe J, Lin Y, Goytizolo E, Oxendine J, et al. (2019) The addition of ACB and IPACK to PAI enhances postoperative pain control in TKA: A randomized controlled trial. Anesth Analga 129: 526-535.
    8. Niesen AD, Harris DJ, Johnson CS, Stoike DE, et al. (2019) Interspace between Popliteal Artery and Posterior Capsule of the Knee (IPACK) injectate spread: A cadaver study. J Ultrasound Med 38: 741-745. [crossref]
    9. Huang A, Singh PA, Woon KL (2020) Interspace between the popliteal artery and the capsule of the knee (IPACK) block for anterior cruciate ligament reconstruction surgery: A two case series. Open Journal of Anesthesiology 10: 134-143.
fig 1

Circulating Agonist Autoantibody to 5-Hydroxytryptamine 2A Receptor in Lean and Diabetic Fatty Zucker Rat Strains

DOI: 10.31038/EDMJ.2020435

Abstract

Aims: Circulating neurotoxic autoantibodies to the 5-hydroxytryptamine 2A receptor were increased in older adult type 2 diabetes in association with certain neurodegenerative complications. The male Zucker diabetic fatty (ZDF) rat is a model system for studies of obese, type 2 diabetes mellitus. The aim of the current study was to test for (and compare) circulating neurotoxic autoantibodies to the 5-hydroxytryptamine 2A receptor in the Zucker diabetic fatty rat and age-matched lean Zucker rat strains.

Methods: Plasma from lean and Zucker diabetic fatty rat (obtained at different developmental stages) was subjected to protein G affinity chromatography. The resulting immunoglobulin G fraction was tested for neurotoxicity (acute neurite retraction, accelerated neuron loss) in N2A mouse neuroblastoma cells and for binding to a linear synthetic peptide corresponding to the second extracellular loop of the 5-hydroxytryptamine 2A receptor.

Results: The male Zucker diabetic fatty rat (fa/fa) and two Zucker lean strains (+/?) and (fa/+) harbored autoantibodies to the 5-hydroxytryptamine 2A receptor which appeared spontaneously around 7-8.5 weeks of age. The circulating autoantibodies persisted until at least 25 weeks of age in the Zucker diabetic fatty rat and in the Zucker heterozygote (fa/+), but were no longer detectable in 25-week-old lean (+/?) Zucker rats. Autoantibody-induced acute neurite retraction and accelerated loss in mouse neuroblastoma N2A cells was dose-dependently prevented by selective antagonists of the 5-hydroxytryptamine 2A receptor. It was also substantially prevented by co-incubation with antagonists of RhoA/Rho kinase-mediated signaling (Y27632) or Gq11/phospholipase C/inositol triphosphate receptor-coupled signaling.

Conclusions: These data suggest that neurotoxic 5-hydroxytryptamine 2A receptor-targeting autoantibodies increase in the aging male Zucker diabetic fatty rat and in male Zucker lean rats harboring a heterozygous mutation, but not in age-matched, older Zucker lean rats lacking a known leptin receptor mutation. The Zucker genetic strain may be useful in studies of the role of humoral and/or innate immunity in late neurodegeneration.

Introduction

Type 2 diabetes mellitus is associated with an increased risk of late neurodegeneration [1,2] via mechanisms which may involve (in part) increased peripheral and central inflammation. Increased pro-inflammatory cytokines and innate immunity have been associated with early Parkinson’s disease [3] and dementia [4] through complex mechanisms. Leptin is a hormone released by fat cells that is important in energy metabolism. Dysfunction of the leptin system results in classic signs of type 2 diabetes mellitus, such as obesity, insulin resistance and high circulating insulin. Leptin is also a member of the type 1 cytokine family that includes interleukin-6 [5,6]. The leptin receptor is normally expressed on hematopoietic cells where it stimulates helper- T cell, and effector T cell functions and inhibits regulatory T cell function [7].

The male Zucker Diabetic Fatty rat (fa/fa) (ZDF) is a well-recognized animal model of obese type 2 diabetes mellitus and hypertension [8,9] in which hyperphagia causes morbid obesity leading to high level of pro-inflammatory adipocytokines [10]. In the ZDF rat, pro-inflammatory cytokines cause enhanced innate immunity [11], however, owing to its complete leptin receptor deficiency, helper T-cell function is reduced [12]. The lean heterozygous Zucker rat (fa/+) has haplo-sufficiency at the leptin receptor and a two-fold increased plasma leptin concentration [13] compared to the wild-type (+/+) lean Zucker rat. Since hyperleptinemia promoted helper-T cell-mediated autoantibody formation and worsened clinical outcome(s) in a mouse model of systemic lupus erythematosus [14], the lean heterozygote Zucker rat might be expected to exhibit higher autoantibody expression than in the ZDF (fa/fa) rat strain.

In prior studies in older adult (human) obese type 2 diabetes, patients harboring increased circulating autoantibodies to the 5-hydroxytryptamine 2A receptor (5-HT2AR) had an increased prevalence of co-morbid neurodegenerative complications including Parkinson’s disease and dementia [15]. Human plasma autoantibodies targeting the 5-HT2A receptor promoted long-lasting (agonistic) activation of Gq11/phospholipase C/inositol triphosphate receptor/Ca2+ signaling causing accelerated endothelial cell and neuronal cell death [16]. Since the 5-hydroxytryptamine 2A receptor is normally expressed on arterial smooth muscle cells [17] and on neurons in specific brain regions involved in the regulation of mood, thinking, perception, and sleep [18], altered signaling at the 5-HT2A receptor could have diverse peripheral and central effects.

The aim of the present study was to test for spontaneously-occurring autoantibodies to the 5-HT2A receptor in the circulation in male ZDF rat (fa/fa) and age-matched male lean Zucker rats either lacking a known leptin receptor mutation (+/?) or harboring a heterozygous leptin receptor mutation (fa/+). The developmental expression of autoantibody was compared in each genetic strain, and the mechanism of neurotoxicity downstream of 5-HT2AR binding was evaluated in mouse neuroblastoma N2A cells.

Materials and Methods

Animals

All procedures were conducted according to the National Institutes of Health (NIH) Guide for the Care and Use of Laboratory Animals and approved by the Institutional Animal Care and Use Committee of the Veterans Affairs Medical Center (East Orange, New Jersey). Male ZDF (N=12) and lean (+/?) Zucker rats (N=12) were obtained from Charles River Laboratories (Kingston, NY) at approximately 6 weeks of age. All rats were single housed upon arrival, with modest enrichment (a PVC tube). Rats were provided ad libitum access to food and water and maintained in a 12 h light/dark cycle with lights on at 0630. All procedures occurred during the light phase of the cycle.

Blood Drawing

EDTA plasma from 10-week ZDF rat and 10-week lean, heterozygous (fa/+) Zucker rats was obtained from Charles River Laboratories. For all other time points, blood was collected from the retro-orbital plexus of ZDF, and lean (+/?) Zucker rats using a retro-orbital blood procedure. The blood was centrifuged at 1400 g x 10 minutes at 4 degrees C. The resulting plasma was stored at -4oC for up to 2-3 weeks prior to protein G affinity chromatography.

Tail-Nick

Capillary blood glucose was determined from a drop of blood obtained after tail nick at sequential time intervals. A glucose dehydrogenase method (Accucheck Aviva, Roche Diagnostics, Inc) was used for the determination of blood glucose.

Protein G Affinity Chromatography

Protein-G affinity chromatography was carried out as previously reported for protein-A affinity chromatography in human plasma [16]. The pH of the 10 mm Tris binding buffer (6.5) and the 0.1 M citrate elution buffer (2.7) was adjusted to optimize binding and elution of rat immunoglobulin G. Protein-G eluate fractions were stored at 0-4 degrees C.

Mouse N2A Neuroblastoma Cells

Cells were cultured in DMEM with 10% fetal calf serum as previously reported [16].

Neurite Retraction and N2A Cell Survival Assays

Assays were performed as previously described [16].

Enzyme-Linked Immunoassay (ELISA)

The ELISA procedure was carried out as previously reported using an 18-meric linear synthetic peptide Q..N18 corresponding to the second extracellular loop of the human 5-HT2AR as the solid phase antigen [15].

Chemicals

All chemicals were obtained from Sigma Co., Inc. (St. Louis, MO).

Protein determination-Protein levels were determined using a bichinchonic assay method (BioRad, Inc.).

Statistics

Statistical analysis was performed using an unpaired Student’s t-test with an α cutoff level for significance of < 0.05.

Results

Occurrence of Circulating 5-HT2A Receptor Autoantibody in the ZDF Rat: Relation to Obesity and Diabetes

Mean body mass in ZDF rats significantly exceeded that in lean (+/?) Zucker rat at week 7, week 8.5, and week 12 (Figure 1A). There was no longer a significant weight difference between the strains at week 25 (Figure 1A). Diabetes (hyperglycemia) emerged between week 8-10 in the ZDF rat, but at week 7 the ZDF rat was still normoglycemic (Figure 1B). In contrast, lean (+/?) Zucker rats were normoglycemic at all ages tested (Figure 1B), not tested at week 7.

fig 1 mark

Figure 1: Age-dependent change in body mass(A) and capillary blood glucose concentration (B) in male Zucker fatty (ZDF) vs lean (+/?) (ZDL) rats. A) Body weight increased significantly in the male ZDF rat (starting at week 7) compared to control lean Zucker rat B) capillary blood glucose was determined by tail nick using glucose dehydrogenase method as described in Materials and Methods. Glucose was normal at week 7 in the ZDF rat, but increased significantly compared to ZDL rat starting at week 8.

Detection of plasma immunoreactive 5-HT2AR autoantibody had a similar trajectory to diabetes in ZDF rats. At 7 weeks of age, ZDF rat had no detectable plasma immunoreactive 5-HT2AR autoantibody (Figure 1C). At 10-weeks of age, plasma from ZDF rat contained a two-fold, higher binding to 5-HT2AR (0.14 AU, N=2) compared to background levels (0.07 AU; Figure 2a). Plasma from lean ((+/?) Zucker rats harbored two-fold or slightly higher level of autoantibody binding to 5-HT2AR between 8.5-15 weeks of age which declined to undetectable levels at 25 weeks of age (Figure 2B).

fig 2

Figure 2: Developmental expression of autoantibody binding to 5-HT2AR synthetic peptide in three Zucker rat strains. A 2 ug/mL concentration of the protein G eluate was tested for binding to the linear synthetic 18-meric 5-HT2A receptor peptide as described in Materials and Methods. Results are “mean +/- SE” in A) ZDF rat: 7-week (N=2); 8.5-week (N=3); 10-week (N=2); 25-week (N=3) B) lean (+/?) Zucker rat: 7-week (N=3); 8.5 week (N=3); 15-week (N=10); 25-week (N=6). C) lean heterozygote (fa/+) Zucker rat: 7-week (N=2); 10-week (N=5); 25-week (N=2).

Spontaneous IgG autoantibody to the 5-HT2A receptor was already present at 7 weeks of age in the heterozygous lean (fa/+) Zucker rat (Figure 2C) and levels at 10-weeks old and 25-weeks old were substantially higher than in age-matched ZDF rat (Figure2C). Autoantibody to the 5-HT2A receptor persisted into older age, i.e. 25 weeks old, in male ZDF and lean heterozygous Zucker rats, but disappeared at 25 weeks of age in the lean (+/?) Zucker rat lacking a known leptin receptor mutation. In a recent report [19], diabetes, obesity and hypertension were associated with substantially increased hazard rates for the occurrence of dementia, Parkinson’s disease and severe depression following traumatic brain injury in older adult veterans.

The present data suggest that male ZDF and heterozygous lean rat strains may be useful in modeling the effects of heightened innate and/or adaptive immunity, respectively, on the occurrence of neurodegeneration.

Zucker Diabetic Fatty Rat Plasma 5-HT2AR Autoantibody Inhibits N2A Cell Survival

We next tested for neurotoxicity in the autoantibody (from 10- week-old ZDF rat plasma) that displayed increased binding to the 5-HT2A receptor peptide. Autoantibody in plasma from the 10-week old ZDF rat caused dose-dependent inhibition of survival in N2A mouse neuroblastoma cells (Figure 3). A two and one-half microgram per milliliter concentration of the IgG caused approximately 40% neuroblastoma cell loss (after 24 hours incubation) compared to control, untreated cells (P< 0.01, Figure 3).

fig 3

Figure 3: Dose-dependent neurotoxicity in the protein G eluate fraction from Zucker diabetes fatty rat plasma. The protein G-eluate fraction from 10-week-old male Zucker diabetic fatty rat plasma was incubated with N2a mouse neuroblastoma cells (at the indicated concentrations) for 24 hours. % N2a cell survival was determined with an MTT assay as described in Materials and Methods. Each point represents the mean + SE of quadruplicate determinations; * P < 0.01 compared to cell survival in untreated cells.

Zucker Diabetic Fatty Rat Plasma 5-HT2AR Autoantibody Causes Acute N2A Neurite Retraction

A 120 nanomolar concentration (1.8 g/mL IgG) of the protein G- eluate fraction of plasma from 10-week-old male ZDF fatty rat caused significant 37% acute neurite length-shortening (after 15 minutes of incubation) of N2A mouse neuroblastoma cells (Figure 4A). Co-incubation with a 200 nanomolar concentration of M100907, a highly selective, potent antagonist of the 5-HT2AR, afforded 86% significant (P < 0.01) protection against autoantibody-induced neurite retraction (Figure 4A).

fig 4A-4B

Figure 4: Neurite outgrowth inhibition (A) and accelerated N2A neuroblastoma cell loss (B) in autoantibody from ZDF rat plasma: neutralization by M100907, a highly selective 5-HT2AR antagonist. A) A 120 nM concentration of the protein-G eluate fraction of 10-week-old male ZDF rat plasma was incubated with N2A mouse neuroblastoma cells in the presence or absence of a 200 nM concentration of the selective 5-HT2AR antagonist M100907. % Basal neurite length was determined after 15 minutes as described in Materials and Methods B) A 160 nM concentration of the protein G-eluate fraction from 10-week-old male Zucker diabetic fatty rat plasma was incubated with N2a mouse neuroblastoma cells in the presence or absence of the indicated concentration of M100907 for 24 hours at 37 deg C. Percent N2A cell survival was determined with an MTT assay as described in Materials and Methods. Each point represents the mean + SE of triplicate determinations.

Pharmacologic Profile of Zucker Diabetic Fatty Rat Plasma 5-HT2AR Autoantibody Toxicity

A ~170 nanomolar concentration (2.5 µg/mL) of the protein G-eluate fraction of plasma from 10-week-old male ZDF rat was incubated with N2A mouse neuroblastoma cells in the presence or absence of a (500 or 1000) nanomolar concentration of M100907 for 24 hours at 37 deg C. M100907 caused significant (dose-dependent) protection against accelerated N2A cell loss, after 24 hours incubation with the ZDF rat IgG (Figure 4B).

Spiperone is a potent, but less selective 5-HT2AR antagonist. Spiperone at 500-1000 nanomolar concentrations afforded significant dose-dependent protection against ZDF rat IgG-induced accelerated N2A cell loss (Figure 5). Ketanserin is a less potent 5-HT2AR antagonist compared to M100907 or spiperone. Substantially higher concentration (2.5 µM) of ketanserin was required to significantly protect against ZDF rat IgG-induced N2A cell loss (Figure 6).

fig 5

Figure 5: Potent, less selective 5-HT2AR antagonist (spiperone) dose-dependently prevented accelerated neuron loss induced by ZDF rat plasma autoantibody. A 160 nM concentration of the protein G-eluate fraction from 10-week-old male Zucker diabetic fatty rat plasma was incubated with N2a mouse neuroblastoma cells in the presence or absence of the indicated concentration of spiperone for 24 hours at 37 deg C. Percent N2a cell survival was determined with an MTT assay as described in Materials and Methods. Each point represents the mean + SE of triplicate determinations.

fig 6A-6B

Figure 6: Higher concentration of ketanserin, a less potent, but selective 5-HT2AR antagonist dose-dependently prevented accelerated neuron loss induced by ZDF rat plasma autoantibody A-B) 120 nM concentration of the protein G-eluate fraction from 10-week-old male Zucker diabetic fatty rat plasma was incubated with N2a mouse neuroblastoma cells in the presence or absence of the indicated concentration of ketanserin for 24 hours at 37 deg C. Percent N2a cell survival was determined with an MTT assay as described in Materials and Methods. Each point represents the mean + SE of triplicate determinations.

The receptor antagonist profile and concentration associated with significant protection against ZDF IgG autoantibody-induced neuroblastoma cell loss is consistent with relative affinity constants on the 5-HT2A receptor (M100907 < spiperone<< ketanserin).

A one micromolar concentrations of SB-20471, a selective antagonist to the 5-HT2B receptor did not significantly prevent ZDF autoantibody-induced neurite retraction (Table 1). A ten micromolar concentration of either bosentan (an endothelin-1 receptor) or losartan (an angiotensin II type 1 receptor) antagonist did not significantly protect against ZDF IgG-induced acute N2A neurite retraction (Table 1). An 850 nanomolar concentration of prazosin (alpha 1 adrenergic R antagonist) did not afford significant protection against ZDF IgG autoantibody-induced acute neurite retraction (Table 1). Taken together, these data suggest that neurotoxicity in the 10-week old male ZDF rat IgG appears selective for the 5-HT2A receptor.

Table 1: Receptor specificity of prevention of ZDF rat IgG autoantibody-induced acute N2A neurite retraction.

Antagonist

Conc GPCR

% of ZDF IgG-induced Neurite Retraction

M100907

200 nM 5HT2A

13% + 15%

SB-20471

1 µM 5HT2B

89% + 20%

Bosentan

10 µM ET-1

95% + 20%

Losartan

10 µM AT-1

81% + 5%

Prazosin

850 nM A1-A

89% + 11%

A 160 nanomolar concentration of 10-week-old male Zucker fatty rat IgG autoantibodies was incubated in the presence or absence of the indicated GPCRs. Acute N2A neurite retraction was determined after 15 minutes as described in Materials and Methods. Results are mean +/- SD.

Involvement of Gq11/Phospholipase C/Inositol Triphosphate and Rho Kinase Signaling Pathways

Co-incubation of N2A cells with ZDF plasma IgG autoantibodies together with individual selective antagonists of Gq11 (YM-254890), phospholipase C (U73122), inositol triphosphate receptor (2-APB) signaling or Rho A/Rho kinase (Y27632) mediated signaling completely or nearly completely protected against acute neurite retraction (Table 2) consistent with involvement of Gq11/phospholipase C/inositol triphosphate and Rho kinase signaling pathways in mediating IgG neurotoxicity downstream of 5-HT2A receptor binding.

Table 2: Effect of signaling pathway inhibitors on ZDF rat IgG autoantibody-induced acute N2A neurite retraction.

Antagonist

Conc  Signaling  Intermediate % of ZDF IgG-induced Neurite Retraction

U73122

10 µM PLC

14% + 13%

YM-254890

1 µM Gq11

14% + 5%

2-APB

50 µM IP3R

  0% + 0%

Y27632

10 µM Rho kinase

  0% + 0%

A 160 nanomolar concentration of 10-week-old male Zucker fatty rat IgG autoantibodies was incubated in the presence or absence of the indicated GPCRs. Acute N2A neurite retraction was determined after 15 minutes as described in Materials and Methods. Results are mean +/- SD as described in Materials and Methods.

Level and Titer of Autoantibody to 5-HT2A Receptor in Male Zucker Heterozygote (fa/+)

An identical (1.5 µg/mL concentration) of the IgG from Zucker heterozygote rat plasma (N=5) displayed two-fold significantly higher binding (to the 5-HT2A receptor peptide) compared to IgG in plasma from five ZDF rat plasmas (N=2, 10-week-old and N=3, 25-week-old rats) (Figure 7A). The titer of autoantibody to the 5-HT2A receptor peptide was more than two-fold higher in the 10-week old lean Zucker heterozygous rat compared to age-matched, 10-week old ZDF rat (Figure 7B).

fig 7 mark

Figure 7: A) 2 ug/mL concentration of the protein G eluate of ZDF rat and lean Zucker heterozygote plasma was tested for binding to linear, synthetic 18-meric 5-HT2A receptor peptide.
B) Titer of autoantibody binding to 5-HT2A receptor peptide was tested at the indicated concentrations in 10-week lean Zucker heterozygote (N=5) or 10-week ZDF (N=2) protein G eluate. Results are “mean +/- SE”. * P< 0.01

Bioactivity in the Antibody Fraction of Male Zucker Heterozygous (fa/+) Plasma

Dose-dilution curves of the protein-G eluate fraction from three, 10-week-old lean heterozygous Zucker heterozygous plasmas demonstrated potent inhibition of N2A cell survival at all IgG concentrations tested in two of three rats (Figure 8A). In one of the three rats, lean heterozygous Zucker rat #3, a component of significant N2A survival-promoting activity were observed at high IgG dilution (Figure 8A). ‘Functional selectivity’ is a unique property of the 5-hydroxytryptamine 2A receptor [20]-it refers to the ability of different 5-HT2AR ligands to preferentially activate alternative signaling pathways, e.g. PLC/IP3/Ca2+ signaling or a beta-arrestin 2/PI3-kinase survival pathway. Since the selective 5-HT2AR antagonist M100907 significantly protected against lean heterozygous Zucker rat IgG autoantibody-induced accelerated N2A cell loss (Figure 8B) the neurotoxicity is likely due to Gq11/PLC/IP3/Ca2+-mediated signaling occurring downstream of 5-HT2AR binding. More study is needed, however, to determine whether N2A survival-promoting activity in a subset of lean heterozygous Zucker rat IgG autoantibodies may result from selective activation of beta arrestin-2/PI3-kinase-mediated signaling. In a prior report [21], highest level of 5-HT2A receptor-binding occurring in the autoantibodies from a patient with lupus. The lupus IgG autoantibodies were not only neurotoxic, but (at certain concentrations) promoted N2A neuroblastoma cell survival dependent on PI3 kinase-mediated signaling [21].

fig 8A-8B

Figure 8: A) Dose-dilution curves of three Zucker lean heterozygous protein G eluates on survival in N2A mouse neuroblastoma cells; B) Co-incubation of a representative lean heterozygous protein G eluate fraction with 1 µM concentration of the selective 5-HT2AR antagonist M100907. * P< 0.05.

Apparent MW of the Active Component in ZDF Protein G Eluates

The active component in the ZDF protein G eluate (which caused accelerated N2A cell loss) had an apparent MW > 10 kD (Figure 9A) consistent with an antibody or antibody fragment. There was no significant N2A cell survival-inhibitory activity present in the flow-through fraction following membrane dialysis of the ZDF protein G eluate on a 10 kilodalton Molecular Weight (MW) cutoff membrane (Figure 9A). The freshly-isolated, lean heterozygous Zucker rat (fa/+) protein G eluate fraction (SM, starting material) caused significantly increased N2A cell survival. Following dialysis on a 10 kD MW cutoff membrane, more than 90% of the N2A survival stimulatory activity was recovered in the fraction having an apparent MW > 10 kD, i.e. retained on the membrane (Figure 9B). The low MW (< 10 kD) flow-through fractions following membrane dialysis of the ZDF or lean heterozygous Zucker rat protein G eluate did not cause significant inhibition or stimulation of N2A survival (Figure 9A and 9B).

fig 9A-9B

Figure 9: Apparent MW of peak neuroblastoma survival-inhibitory (A) and – stimulatory (B) activity in the plasma protein G eluate from ZDF or heterozygous lean ZDL rat. Apparent MW of peak neuroblastoma survival-inhibitory (A) or -stimulatory (B) activity in the protein G eluate from a representative ZDF (A) and lean heterozygote # 3 Zucker rat (B) plasma. A 160 nM concentration of the protein G-eluate fraction from 10-week-old male Zucker rat plasma was dialyzed on a 10kD MW cutoff membrane. The resulting retained and flow-through fractions or starting material (SM) were incubated with N2a mouse neuroblastoma cells for 24 hours as described in Materials and Methods. Each point represents the mean + SE of triplicate determinations. * P < 0.05 compared to control N2A cell without added test fractions.

Discussion

The male ZDF rat is a well-studied model of human obese type 2 diabetes mellitus. The animals undergo progressive gain in fat mass, with obesity arising around 4-weeks of age [9]. Hyperglycemia commences around week 8- 9, and chronic marked elevation in blood glucose concentrations (400-500 mg/dL) is associated with early hyperinsulinemia followed by later relative insulin deficiency [10]. Hypertension and severe hypertriglyceridemia manifest around week 9 in the ZDF rat [9,10]. In adult, long-standing human obese type 2 diabetes mellitus from the Veterans Affairs Diabetes Trial, the baseline presence of anti-endothelial cell autoantibodies was significantly associated with lack of baseline insulin therapy (i.e. relative insulin deficiency) and lack of baseline triglyceride-lowering medication [22]. Endothelial cell heparanase expression is upregulated in insulin deficiency [23] and by high level of pro-inflammatory cytokines [24]. Heparanase cleaves heparan sulfate side chains abundant on neurons and vascular cells, and heparan sulfate proteoglycan is a known target of humoral autoimmunity [25]. In older adult diabetes patients evidence suggested that autoantibodies targeting the 5-HT2AR were in many cases cross-reactive with heparan sulfate proteoglycan [26]. Taken together it is possible that certain metabolic derangements in the ZDF rat strain, (insulin deficiency, and high level of pro-inflammatory cytokines) may contribute in part to the long persistence of circulating 5-HT2A receptor autoantibodies at older ages.

Although the heterozygous (fa/+) Zucker rat is lean and non-diabetic, it demonstrated substantially higher titer of 5-HT2A receptor autoantibodies compared to age-matched ZDF rat. One possibility is that enhanced helper T-cell immunity in the lean heterozygote Zucker rat drives autoantibody formation which includes a subset (of autoantibodies) targeting the 5-HT2A receptor. Neurotoxicity in the lean heterozygote Zucker IgG autoantibodies (i.e. acute neurite retraction and accelerated N2A cell loss) was as high or higher than in ZDF IgG autoantibodies consistent with a prior report of a significant correlation between antibody binding level and level of acute neurite retraction in N2A cells [15]. Higher level of 5-HT2AR targeting autoantibodies in the lean heterozygote Zucker rat supports a role for upregulated adaptive humoral immunity (in part) due to a heterozygous leptin receptor mutation causing hyperleptinemia. More study is needed to determine whether high titer of autoantibodies in the lean heterozygous Zucker rat may predispose to immune complex formation that could bias signaling pathway activation downstream of 5-HT2A receptor binding.

In summary, 5-HT2A receptor autoantibodies increased in the circulation in male hypertensive ZDF rat between 8.5-10-weeks of age and persisted up until 25-weeks old or longer. The ZDF rat 5-HT2A receptor-targeting autoantibodies caused acute neurite retraction and accelerated mouse neuroblastoma cell loss by a mechanism involving activation of Gq11/PLC/IP3R pathway and RhoA/Rho kinase coupled signaling. The ZDF and lean heterozygous Zucker rat strains may be suitable animal models for investigations of the roles of obesity-associated inflammation and dysregulated humoral immunity, respectively, in the etiology of certain forms of late-onset neurodegeneration.

Funding

This project was supported by grants from the New Jersey Commission on Brain Injury Research (CBIR19PIL007) to MBZ and the Biomedical Laboratory Research and Development Service of the VA Office of Research and Development (I1BX004561) to KCHP. The views expressed in this article are those of the authors and do not necessarily reflect the position or policy of the Department of Veterans Affairs or the United States government.

References

    1. Hu G, Pekka J, Siamak B, Riitta A, Jaakko T (2007) Type 2 Diabetes and the Risk of Parkinson’s Disease. Diabetes Care 30(4): 842-847. [crossref]
    2. Xu WL, Qiu CX, Wahlin A, Winblad B, Fratiglioni L (2004) Diabetes mellitus and risk of dementia in the Kungsholmen project: a 6-year follow-up study. Neurology 63(7): 1181-1186. [crossref]
    3. Prieto GA, Tong L, Smith ED, Cotman CW (2019) TNFα and IL-1β but not IL-18 Suppresses Hippocampal Long-Term Potentiation Directly at the Synapse. Neurochem Res 44(1): 49-60. [crossref]
    4. Qin XY, Zhang SP, Cao C, Loh YP, Cheng Y (2016) Aberrations in Peripheral Inflammatory Cytokine Levels in Parkinson Disease: A Systematic Review and Meta-analysis. JAMA Neurol 73(11): 1316-1324. [crossref]
    5. Baumann H, Morella KK, White DW, Dembski M, Bailon PS, Kim H, Lai CF, Tartaglia LA (1996) The full-length leptin receptor has signaling capabilities of interleukin 6-type cytokine receptors. Proc Natl Acad Sci U S A 93(16): 8374-8. [crossref]
    6. Dozio E, Ruscica M, Galliera E, Corsi MM, Magni P (2009) Leptin, ciliary neurotrophic factor, leukemia inhibitory factor and interleukin-6: class-I cytokines involved in the neuroendocrine regulation of the reproductive function. Curr Protein Pept Sci 10(6): 577- 584. [crossref]
    7. Lord, G., Matarese, G., Howard, J. et al. (1998) Leptin modulates the T-cell immune response and reverses starvation-induced immunosuppression. Nature 394, 897-901. [crossref]
    8. Clark JB, Palmer CJ, Shaw WN (1983) The diabetic Zucker fatty rat. Proc Soc Exp Biol Med 173(1): 68-75. [crossref]
    9. Kurtz TW, Morris RC, Pershadsingh HA (1989) The Zucker fatty rat as a genetic model of obesity and hypertension. Hypertension 13: 896-901. [crossref]
    10. Shibata T, Takeuchi S, Yokota S, Kakimoto K, Yonemori F, Wakitani K (2000) Effects of peroxisome proliferator-activated receptor-alpha and -gamma agonist, JTT-501, on diabetic complications in Zucker diabetic fatty rats. Br J Pharmacol 130(3): 495-504. [crossref]
    11. Ruth MR, Taylor CG, Zahradka P, Field CJ (2008) Abnormal immune responses in fa/fa Zucker rats and effects of feeding conjugated linoleic acid. Obesity Silver Spring 16(8): 1770-9. [crossref]
    12. Tanaka SI, Isoda F., Yamakawa T., Ishihara M, Sekihara H (1998) T lymphopenia in genetically obese rats. Clinical Immunology and Immunopathology 86(2): 219-225. [crossref]
    13. Imai T, Cho YM, Takahashi M, Kitahashi T, Takami S, Nishikawa A, Ogawa K (2013) High susceptibility of heterozygous (+/fa) lean Zucker rats to 7,12-dimethylbenz(a)anthracene-induced mammary carcinogenesis. Oncol Rep 29(5): 1914-1922. [crossref]
    14. Lourenço EV, Liu A, Matarese G, La Cava A (2016) Leptin promotes systemic lupus erythematosus by increasing autoantibody production and inhibiting immune regulation. Proc Natl Acad Sci U S A 13(38): 10637-10642. [crossref]
    15. Zimering MB (2019) Autoantibodies in Type-2 Diabetes having Neurovascular Complications Bind to the Second Extracellular Loop of the 5-Hydroxytryptamine 2A Receptor. Endocrinol Diabetes Metab J 3(4): 1-8. [crossref]
    16. Zimering MB (2017) Diabetes Autoantibodies Mediate Neural- and Endothelial Cell- Inhibitory Effects Via 5-Hydroxytryptamine- 2 Receptor Coupled to Phospholipase C/Inositol Triphosphate/Ca2+ Pathway. J Endocrinol Diabetes 4(4): 10.15226/2374-6890/4/4/00184. [crossref]
    17. Xu T, Pandey SC (2000) Cellular localization of serotonin (2A) (5HT (2A)) receptors in the rat brain. Brain Res Bull 51: 499-505. [crossref]
    18. Alsip NL, Harris PD, Durrani GE (1991) Multiple Serotonin Receptors on Large Arterioles in Striated Muscle. J Vasc Res 28: 537-541. [crossref]
    19. Zimering MB, Patel D, Bahn G (2019) Type 2 Diabetes Predicts Increased Risk of Neurodegenerative Complications in Veterans Suffering Traumatic Brain Injury. J Endocrinol Diabetes 6(3). [crossref]
    20. Schmid CL, Raehal KM, Bohn LM (2008) Agonist-directed signaling of the serotonin 2A receptor depends on beta-arrestin-2 interactions in vivo. Proc Natl Acad Sci U S A 105: 1079-1084. [crossref]
    21. Zimering MB, Nadkarni SG (2019) Schizophrenia Plasma Autoantibodies Promote ‘Biased Agonism’ at the 5-Hydroxytryptamine 2A Receptor: Neurotoxicity is Positively Modulated by Metabotropic Glutamate 2/3 Receptor Agonism. Endocrinol Diabetes Metab J [crossref]
    22. Zimering MB, Anderson RJ, Moritz TE, Ge L (2009) Investigators for the VADT. Endothelial cell inhibitory autoantibodies are associated with laser photocoagulation in adults from the Veterans Affairs Diabetes Trial. Metabolism 58(6): 882-7. [crossref]
    23. Han J, Woytowich AE, Mandal AK, Hiebert LM (2007) Heparanase upregulation in high glucose-treated endothelial cells is prevented by insulin and heparin. Exp Biol Med (Maywood) 232(7): 927-34. [crossref]
    24. Chen G, Wang D, Vikramadithyan R, Yagyu H, Saxena U, Pillarisetti S, Goldberg IJ (2004) Inflammatory cytokines and fatty acids regulate endothelial cell heparanase expression. Biochemistry 43(17): 4971-7. [crossref]
    25. Faaber P, Rijke TP, van de Putte LB, Capel PJ, Berden JH (1986) Cross-reactivity of human and murine anti-DNA antibodies with heparan sulfate. The major glycosaminoglycan in glomerular basement membranes. J Clin Invest 77(6): 1824-30. [crossref]
    26. M.B. Zimering, A.T. Pulikeyil, CE Myers, KC Pang (2020) Serotonin 2A Receptor Autoantibodies Increase in Adult Traumatic Brain Injury In Association with Neurodegeneration. J Endocrinol Diab 7(1): 1-8. [crossref]
Featured Image

How Misinformation that Facemasks are Effective for Reducing COVID-19 is Transmitted

DOI: 10.31038/JNNC.2020323


The evidence from randomized controlled trials (RCTs) that surgical facemasks and cloth facemasks are ineffective for preventing transmission of respiratory viruses in public is conclusive [1-8]. In all the meta-analyses of all the existing RCTs [4-7], not a single trial was found in which facemasks provided any protection against virus transmission in public [1,2]. Consistent with the findings of all RCTs comparing transmission rates in public with and without facemasks, Leung et al. compared the rates of detection of three types of viruses in exhalations by infected individuals with and without facemasks: they concluded that, with facemasks, there was: “no significant reduction in detection of influenza virus in aerosols;” “For rhinovirus there were no significant differences between detection of virus with or without facemasks, both in respiratory droplets and in aerosols;” and, for coronavirus there was “no significant reduction in detection in aerosols [3].” They did observe a reduction in detection of viruses in respiratory droplets for influenza virus and coronavirus. There is no doubt that facemasks can reduce the transmission of droplets, but droplets are not the concern for transmission of viruses in public. Significant numbers of droplets are not exhaled by asymptomatic carriers because they are not coughing or sneezing in public. Symptomatic carriers who are coughing and sneezing should be quarantined. The rationale for both recommended and mandated facemasks in public is to reduce transmission by asymptomatic carriers. Since all the RCTs in the literature show no reduction in transmission of viruses in public due to facemasks, one wonders why the CDC, NIH and virtually all medical authorities are stating that there is conclusive scientific evidence that facemasks reduce viral transmission in public.

For example, Brooks, Butler and Redfield [9] stated in the July 14, 2020 issue of JAMA that, “At this critical juncture when COVID-19 is resurging, broad adoption of cloth face covering is a civic duty.” Redfield is the Director of the CDC. Similarly, Gostin, Cohen and Koplan [10] stated in the August 11, 2020 issue of JAMA that, “The ethical justification for face coverings is their utility in preventing transmission of serious disease to community members.” Gostin et al. recommend delivering a public health message of, “When we all mask up, we are all safer [10].” The scientific facts are that facemasks have no effect on the transmission of viruses in public. This is proven by multiple RCTs. And yet, the CDC, writers in JAMA, and many medical authorities, state that it is scientifically proven that facemasks will protect the public from COVID-19. What is the evidence these authorities cite as scientific proof, while ignoring and never citing the RCTs?

Brooks et al. have 14 references that provide their evidence [9]. Their first reference is a study in health care settings that provides no data on transmission in public. The second and third references are to the Massachusetts Department of Public Health website and provide no data. The fourth paper describes a web app for screening healthcare workers for COVID-19. The fifth reference, published in 2019, provides guidance for how to respond to pandemics. The sixth reference says that asymptomatic carriers can transmit the virus to others but does not discuss or provide any data on facemasks. The seventh reference says that undocumented coronavirus infections can result in transmission to others but does not discuss or provide evidence on facemasks. The eighth reference is to a 1994 physics paper that describes reduction of “respiratory jets” by facemasks but provides no evidence on viral transmission. The ninth reference discusses the filtration efficiency of facemasks but provides no data on transmission in public. The tenth reference discusses the “potential utilities” of hand washing and facemasks but provides no evidence that they work. The eleventh reference is a paper by Greenlagh et al. that provides the authors’ responses to their critics but does not provide data on transmission in public [8]. The twelfth reference describes factors affecting whether people use facemasks but no data or evidence on whether facemasks work to reduce transmission in public. The thirteenth paper describes a single situation in which two COVID-positive hair stylists wore masks at work and none of their 104 clients followed up two weeks later reported symptoms of COVID-19; 102 of the 104 clients wore facemasks themselves while at the salon. None of these 104 individuals were tested for COVID-19 and many of them could have been asymptomatic carriers. The fourteenth paper is a discussion of facemasks and Gross National Product in a Goldman Sachs Research publication.

Thus, of Brooks et al.’s fourteen references, none provide any controlled data on the effects of facemasks on transmission of viruses in public [9]. Gostin et al. provide ten references to support their assertion that it is a civic duty to wear facemasks during the COVID-19 pandemic [10]. The first reference is to a CDC website statement that facemasks work in public and should be worn in public [11]. The CDC website provides 19 references to support their recommendation, but those references consist of small or single case uncontrolled studies, discussions of asymptomatic transmission that provide no data on facemasks, papers about infections in residents of long-term care facilities, and papers about the filtration properties of facemasks. None of the CDC references provide any evidence or data that facemasks work in public to reduce the rate of viral transmission.

Returning to the Gostin et al. [10] paper, their second reference is Brooks et al. [9]. Their third reference is to a study that provides no data on reduction of viral transmission rates due to wearing facemasks in public. Their fourth reference is to a study of health care workers not of transmission in public. Their fifth reference is to a study by Lyu et al. [11] that has been previously discussed by Ross and will be discussed below [2]. Their sixth, seventh and eighth references are to single legal cases. Their ninth reference is to a 2007 book by the Institute of Medicine. Their tenth reference discusses the administrate duties of the Social Security Commissioner.

Thus, the CDC website, Brooks et al. and Gostin et al. provide a total of 43 references, none of which provide any controlled evidence that facemasks worn in public reduce the rate of coronavirus transmission [9,10]. None of these three authorities reference a single one of the RCTs, all of which found zero evidence that facemasks reduce viral transmission when worn in public. The authorities in these three examples (the CDC, Brooks et al, and Gostin, et al.), and authorities throughout the United States are virtually unanimous in saying that facemasks work, that this has been proven scientifically, and that the public should wear them. This is put forward as a recommendation at the least, and often as a mandate.

The only paper out of the 43 that provides any data on facemasks in public is a study by Lyu et al. [12]. These authors tracked the rates of COVID-19 infections in 15 states and D.C. from March 31 to May 22, 2020. They found that infection rates declined more in the states that instituted mask wearing in public compared to states that did not. The difference in rates varied from 0.9% to 2.0%. If we assume that during this time period 5% of the population became infected, this would mean that facemasks could have reduced the number of infections in the population by a maximum of (0.05 x 0.02 = 0.001) 0.1%. However, during that time period the COVID-19 curve was flattening in most of the country. More importantly, multiple variables were contributing to the rate of infections including social distancing, hand washing, quarantines, and business and school closures, so facemasks likely contributed only a fraction of 0.1%, which is not clinically meaningful and is well within the margin of error for viral disease epidemiology in the United States. The CDC’s estimate of the number of flu deaths in the United States in a given year is usually stated as a being within a range of tens of thousands of cases. A fluctuation of 0.1% in the infection rate when the best CDC estimate for annual flu deaths is +/-10,000-20,000 is completely meaningless.

If single cases and small uncontrolled observational studies with weak methodology were cited to prove the effectiveness of an alternative treatment for pneumonia, a paper reporting those results would never get published in any mainstream journal; the claim that the alternative treatment was effective would be rejected by medical authorities. Yet this is the quality of evidence cited by the CDC, medical authorities and leading medical journals that facemasks are effective for reducing coronavirus transmission in public. That claim has been disproven by four meta-analyses of RCTs. In any case, there is no reason to expect surgical facemasks to work because their pore size is in the range of 50-100 microns, while the coronavirus is about 0.1 microns and aerosols are about 2-3 microns in size [1,2]. The available science shows conclusively that public facemasks don’t work. This is not a conspiracy theory, an anti-masker ideological statement, or an anti-medical or anti-authority statement. It is a statement of scientific fact. Facemasks may make people feel safer, and may confer a sense of solidarity, but this is just a feeling. Medically and scientifically, facemasks do not protect the public during the COVID-19 pandemic.

Ignoring these facts will not change them. It is not possible to create confidence in organized medicine by mandating public policies that are proven to be ineffective by medical science. The medical profession is putting itself at risk for blowback by endorsing and mandating public wearing of facemasks. Once statements that facemasks work are made enough times by medical authorities, they become common knowledge, and are transmitted throughout the culture. Hopefully, at some point science, data and sound medicine will prevail. The statement that public wearing of facemasks is ineffective for reducing coronavirus infection rates has been made twice by the same group from Harvard in recent issues of the New England Journal of Medicine: “We know that wearing a mask outside health care facilities offers little, if any, protection from infection [13,14].” In conclusion, it should be noted that the author’s mother is in her nineties and living in a long-term care facility. The author is fully supportive of all the COVID-19 precautions instituted at this facility including facemasks, social distancing, quarantining and restriction of visitors during the height of the pandemic and rigorous daily screening of employees. The author is also fully in support of wearing facemasks inside operating rooms. The evidence just does not support wearing facemasks in public.

References

    1. Ross CA (2020) Thoughts on COVID-19. Journal of Neurology and Neurocritical Care 3: 1-3.
    2. Ross CA (2020) Facemasks are not effective for preventing transmission of the coronavirus. Journal of Neurology and Neurocritical Care 3: 1-2.
    3. Leung NHL, Chu DKW, Cowling BY (2020) Respiratory virus shedding in exhaled breath and efficacy of facemasks. Nature Medicine 26: 676-680.
    4. Brainard JS, Jones N, Lake I, Hooper L, Hunter P (2020) Face masks and similar barriers to prevent respiratory illness such as COVID-19: A rapid systematic review. Medrxiv. doi:10.1101/2020.04.01.20049528.
    5. Cowling BJ, Zhou Y, Ip DK, Leung GM, Aiello AE (2010) Face masks to prevent transmission of influenza virus: a systematic review. Epidemiology of Infections138: 449-456.
    6. Xiao J, Shiv EYC, Gao H, Wong JY, Fong MW, Ryu S, et al. (2020) Nonpharmaceutical measures for pandemic influenza in nonhealthcare settings – personal protective and environmental measures. Emerging Infectious Diseases 26: 967-975.
    7. Aggarwhal N, Dwarakananthan V, Gautham N, Ray A (2020) Facemasks for prevention of viral respiratory infections in community settings: A systematic review and meta-analysis. Indian Journal of Public Health64: 192-200.
    8. Greenhalgh T, Schmid MB, Czypionka T, Bassler D, Gruer L (2020) Facemasks for the public during the COVID-19 crisis. British Medical Journal. doi:10.10.1136/bmj.m1435.
    9. Brooks JT, Butler JC, Redfield RR (2020) Universal masking to prevent SARS-CoV-2 transmission – the time is now. JAMA. doi.10.1001/jama.2020.13107.
    10. Gostin LO, Cohen IG, Koplan JP (2020) Universal masking in the United States. The role of mandates, health education and the CDC. JAMA10.1001/jma.2020.15271.
    11. Centers for Disease Control and Prevention (2020) https://www.cdc.gov/coronavirus/ 2019-ncov/prevent-getting-sick/cloth-face-cover- guidance.html.
    12. Lyu W, Wehby GL (2020) Community use of face masks and COVID-19: Evidence from a natural experiment of state mandates in the US. Health Affairs. doi.org/10.1337/hlthaff.2020.00828.
    13. Klompas M, Morris CA, Sinclair J, Pearson M, Shenoy ES (2020) universal masking in hospitals in the COVID-19 era. New England Journal of Medicine 382: e62-63.
    14. Klompas M, Morris CA, Shenoy ES (2020) Universal masking in the COVID-19 era. New England Journal of Medicine 383: e9.


fig 1 JCRM

Liver Stiffness Using Transient Elastography Predicts Worse Survival in Patients with Chronic Heart Failure

DOI: 10.31038/JCRM.2020341

Abstract

Background: Transient elastography using FibroScan is a noninvasive and reliable method to assess liver stiffness. Liver stiffness is influenced not only by fibrosis but also by liver congestion, inflammation and cholestasis. This study aimed to investigate the correlation between liver stiffness, liver congestion and liver fibrosis, and to elucidate the utility of liver stiffness measurement (LSM) in patients with chronic heart failure (CHF).

Methods: We investigated 42 patients with chronic heart failure undergoing right heart catheterization (RHC) from November 2015 to November 2016.LSM was performed with FibroScan. Patients underwent right arterial pressure (RAP) measurement by RHC.

Results: LSM was 10.9 ± 12.6 kPa. RAP was 8.0 ± 5.7 mmHg, and 18 patients had RAP>8 mmHg. LSM was correlated with FIB-4 (r=0.67, p=0.002), HA (r<0.57, p<0.001) and RAP (r=0.67, p9.65kPa) was significantly associated with shorter survival (mean OS; 19.9 vs. 29.9 months, p<0.001).

Conclusion: LSM was directly influenced by liver congestion and liver fibrosis in patients with CHF. Moreover, high LSM was demonstrated to be related with worse survival in patients with CHF.

Keywords

Fibroscan, Hyaluronic acid, Right arterial pressure, Survival

Introduction

Heart failure is a pathologic condition in which impaired pumping function reduces blood flow and leads to congestion of blood and fluids in many organs. Cardiac dysfunction causes liver damage. In particular, right-sided heart failure causes liver congestion, which is known as congestive hepatopathy [1]. Chronic liver congestion progresses to liver fibrosis [2,3]. Histological examination of liver congestion shows sinusoidal engorgement, degeneration, and variable degrees of hemorrhagic necrosis. In patients with chronic or recurrent heart failure, reticulin and collagen accumulation cause liver fibrosis [4].

Despite the seriousness of this condition, only a few studies have reported the progression of liver fibrosis in congestive hepatopathy [5]. Liver biopsy is the gold standard for fibrosis identification. However, it cannot be used as a routine screening tool to detect or monitor liver fibrosis progression due to its inherent shortcomings, which include its invasive nature and the concomitant rare potential risks of bleeding and sampling variability [6].

Because of these disadvantages, several serologic markers that can evaluate the degree of hepatic fibrosis have been used. Hyaluronic acid (HA), which is a highly evolutionarily conserved glycosaminoglycan component of the extracelluar matrix, is generally used as a serum biomarker of liver fibrosis [7]. Moreover, combined assays of multiple markers to improve the predictive ability of liver fibrosis have been also been developed. Among them, fibrosis index based on four factors (FIB-4) is a non-invasive test to stage liver fibrosis in patients with co-infected human immunodeficiency virus (HIV) and hepatitis C virus (HCV) [8]. FIB-4 relies on patient age, aspartate aminotransferase (AST) and alanine aminotransferase (ALT) levels, and platelet counts, which are routinely measured and available. Recently, FIB-4 has come to be applied to various liver diseases for its convenience and cost effectiveness [9,10].

In addition to laboratory tests, the method of non-invasive transient elastography (TE) for assessing liver fibrosis has been developed and widely used in the routine clinical setting. FibroScan is a rapid, non-invasive, and reproducible approach for assessing liver fibrosis by measuring liver stiffness [11,12], and has been approved for clinical use in Japan. In various liver diseases such as viral hepatitis, alcoholic liver disease and non-alcoholic fatty liver disease, liver stiffness measurement (LSM) has been found to be strongly associated with the degree of liver fibrosis [13-15]. However, LSM is considerably influenced by liver congestion, inflammation and cholestasis, independent of the degree of fibrosis [16,17]. Colli et al. showed increased LSM in most patients with acute decompensated heart failure in the absence of parenchymal liver disease [18]. Therefore, LSM can not properly reflect liver fibrosis in patients with congestive heart failure [19]. Little is known about LSM in patients with CHF.

The purposes of this study were to assess the relationship between liver stiffness, volume status and liver fibrosis in patients with chronic heart failure (CHF), and to elucidate the utility of TE in those patients.

Methods

Patient Enrollment

We prospectively investigated LSM using transient elastography in 47 patients who were admitted to our hospital with CHF and scheduled for right heart catheterization (RHC) in the Department of Cardiology of Mie University Hospital from November 2015 to November 2016. RHC was performed in patients who required accurate hemodynamic monitoring because of clinically indeterminate volume and in patients who were refractory to initial therapy. The diagnosis of CHF was made clinically based on signs and symptoms derived from patient history and examination. Exclusion criteria included history of alcohol abuse, known chronic liver disease with an etiology other than heart failure, positivity for hepatitis B surface antigen or hepatitis C antibody, severe obesity, and ascites. The study protocol conformed to the ethical guidelines of the 1975 Declaration of Helsinki as reflected in a priori approval by the institution’s human research committee (Authorization Number 2271).

Laboratory Tests and FIB-4

Laboratory data were obtained beginning at the closest date to RHC. FIB-4 was calculated using the formula: FIB-4  =  age (years) × AST (IU/l)/[platelet count (Plt) (109/l) × ALT1/2 (IU/l)].

Echocardiography

Transthoracic echocardiography was performed using AplioTM 500 (Toshiba medical systems, Tokyo, Japan). Non-invasive RAP was estimated from diameter of inferior vena and its respiratory motion.

Cardiac Catheterization

RHC was performed in the cardiac catheterization laboratory using a flow-directed pulmonary artery catheter. Pressure calibration was performed before and after pressure measurements. All readings were referenced to the midaxillary line with the patient in the supine position. Pressure measurements were determined at the end-expiratory period, with an average of 3 to 5 cycles obtained. The physician performing the cardiac catheterization was unaware of LSM results.

Liver Stiffness Measurement

LSM was measured with FibroScan (Echosens, Paris, France) in the hepatology unit of our hospital. LSM was obtained within 24 hours before or after RHC. The tip of the probe transducer was placed on the skin between intercostal spaces and the level of the right lobe of the liver. The measurement depth was between 25 and 65 mm below the skin surface. Ten validated measurements were performed on each patient with success rates of at least 60%. The results were expressed in kilopascals (kPa). The only procedures considered reliable were those with at least 10 validated measurements and interquartile range <30% of the median value.

Statistics Analysis

Results are presented as the mean ± standard error of the mean or n, as appropriate. The means or percentages were compared by using independent Student’s t-test or the Mann-Whitney U test for continuous variables. Relationships between variables were determined using the two-sided Pearson’s correlation coefficient. Receiver operator characteristic (ROC) curves and the corresponding area under the curve (AUC) were used to obtain cut-offs for the outcomes. The Youden index was applied to calculate the optimal cutoff point. Overall survival (OS) was measured using the Kaplan-Meier method and compared using the log-rank test. Differences were considered significant at p.

Results

Patient Characteristics

In total, 47 patients were screened for this study. Five patients were excluded before scanning: 5 patients with history of alcoholic abuse, and one patient with positivity for hepatitis C antibody. A total of 42 patients (27 men and 15 women) were enrolled in this study. The distribution of the individual forms of cardiac disease is shown in Table 1. The enrolled patients represented a wide spectrum of cardiac disease. The most dominant form was valvular heart disease. The subjects’ baseline clinical and laboratory characteristics are shown in Table 2. The average duration of heart disease was 79.8 ± 85.7 months. The mean FIB-4 was 2.77 ± 1.72. In the individual components of FIB-4, the mean values were as follows: age (70.0 ± 13.9 yrs), AST (25.6 ± 9.3 IU/l), ALT (17.8 ± 8.9 IU/l), and Plt (205 ± 86 109/l). Aminotransferase levels were only slightly elevated in 2 patients. Mean HA was 102 ± 104 ng/ml, and 25 patients had abnormal HA (>50 ng/ml). In echocardiograph, the mean IVC diameter was 20.5 ± 16.4 mm. IVC did not collapse in only 4 patients. In RHC indications, the mean RAP was 8.0 ± 5.7 mmHg. Successful LSM was obtained in 42 patients. The median IQR was 0.9 and the median IQR/median of liver measurement was 20%, showing reliable results. The mean LSM was 10.9 ± 12.6 kPa, and 28 patients with chronic heart failure were higher than the normal range reported previously (normal, <5.5 kPa).

Table 1: Clinical diagnoses.

Clinical Diagnosis

n=42

Valvular heart disease

18

Ischemic cardiomyopathy

8

Dilated cardiomyopathy

5

Cardiac sarcoidosis

4

Atrial septal defect

3

Pulmonary hypertension

2

HF with preserved ejection fraction

1

Hypertrophic cardiomyopathy

1

HF, heart failure

Table 2: Clinical and laboratory characteristics.

Variable

n=42

Age (years)

70.0 ± 13.9

Sex (F/M)

15/27

Body mass index (kg/m2)

22.3 ± 6.0

Duration of heart disease (months)

79.8 ± 85.7

Laboratory tests
Alb (mg/dl)

3.9 ± 0.5

T-Bil (mg/dl)

0.8 ± 0.3

AST (IU/l)

25.6 ± 9.3

ALT (IU/l)

17.8 ± 8.9

ALP (IU/l)

239.0 ± 76.6

BUN (mg/dl)

22.5 ± 11.3

Cre (mg/dl)

1.07 ± 0.38

WBC

6055 ± 1718

Hb

12.8 ± 2.2

Plt (109/l)

205 ± 86

BNP (pg/ml)

253 ± 326

HA (ng/ml)

102 ± 104

FIB-4

2.77 ± 1.72

Echocardiography
Ejection fraction (%)

51.8 ± 19.5

IVC diameter (mm)

20.5 ± 16.4

Hemodynamics
Systolic aortic pressure (mmHg)

123.5 ± 20.7

Diastolic aortic pressure (mmHg)

68.0 ± 11.8

Heart rate (beats/min)

76 ± 13

Pulmonary capillary wedge pressure (mmHg)

14.7 ± 8.4

Mean pulmonary artery pressure (mmHg)

22.2 ± 11.5

Mean RAP (mmHg)

8.0 ± 5.7

Cardiac index (l/min/m2)

2.83 ± 0.84

Transient elastography
LSM (kPa)

10.9 ± 12.6

Interquartile range/median

15 ± 6

Alb, albumen; T-Bil, total bilirubin; AST, aspartate aminotransferase; ALT, alanine aminotransferase; ALP, alkaline phosphatase; WBC, white blood cells count; Hb, hemoglobin; Plt, platelet count; BUN, blood Urea nitrogen; Cre, creatinine ; Plt, platelet count; BNP, brain natriuretic peptide; HA, hyaluronic acid; FIB-4, fibrosis index based on four factors; IVC, inferior vena cava; RAP, right arterial pressure; LSM, liver stiffness measurement.

Correlation between LSM, FIB-4, HA and RAP

LSM was correlated with FIB-4 (r=0.57, p<0.001, Figure 1A), HA (r=0.67, p<0.001, Figure 1B) and RAP (r=0.67, p<0.001, Figure 1C). FIB-4 was correlated with HA (r=0.68, p<0.001, Figure 1D).

fig 1 JCRM

Figure 1: LSM was correlated with fibrotic markers and RAP. Correlation of LSM with FIB-4 (A). Correlation of LSM with HA (B). Correlation of LSM with RAP (C). Correlation of FIB-4 with HA (D). LSM, liver stiffness measurement; FIB-4, fibrosis index based on four factors; HA, hyaluronic acid; RAP, right arterial pressure.

Patient Outcome

Our study period had 8 out of 42 patients (19%) who died in the average follow-up period of 30.0 months. The cause of death for 7 patients included the following conditions related to CHF: heart failure, respiratory failure, and sudden death. One patient died of lymphoma. ROC analyses concerning predictors of survival yielded AUC values of 0.745 for LSM (p=0.04), 0.575 or RAP (p=0.511) (Figure 2A). We calculated the cut-off value of LSM, 9.65 (sensitivity: 0.625, and specificity: 0.647), from our ROC analysis of survival curves. Mean OS was significantly longer in patients with LSM≥9.65 versus those patients with LSM<9.65 (mean OS; 19.9 vs. 29.9 months, p<0.001; Figure 2B). Factors associated with LSM higher than 9.65 kPa are outlined in Table 3. Patients with low LSM were significantly younger (p=0.034) and had lower duration of heart disease, BNP, HA, FIB-4 and RAP but higher hemoglobin and Plt. However, Albumen, T-Bil, AST, ALT and IVC diameter had no significant differences.

Table 3: Characteristics of subjects stratified by LSM.

Variable

LSM>9.65kPa

(n=17)

LSM≤9.65kPa

 (n=25)

p value

Age (years)

75.1 ± 10.2

66.6 ± 15.3

0.037

Duration of heart disease (months)

123 ± 100

50 ± 61

0.013

Alb (mg/dl)

3.8 ± 0.6

4.0 ± 0.4

0.394

T-Bil (mg/dl)

0.9 ± 0.3

0.8 ± 0.3

0.142

AST (IU/l)

26.6 ± 7.9

24.9 ± 10.3

0.543

ALT (IU/l)

17.2 ± 10.0

18.2 ± 8.3

0.746

ALP (IU/l)

259 ± 65

225 ± 82

0.146

BUN (mg/dl)

25.2 ± 12.0

20.7 ± 10.7

0.216

Cre (mg/dl)

1.18 ± 0.40

0.99 ± 0.36

0.131

WBC

5728 ± 2086

6278 ± 1420

0.352

Hb

11.7 ± 2.1

13.5 ± 2.1

0.011

Plt (109/l)

156 ± 68

239 ± 82

0.001

BNP (pg/ml)

418 ± 423

141 ± 172

0.019

HA (ng/ml)

150 ± 130

70 ± 68

0.029

FIB-4

3.89 ± 1.67

2.01 ± 1.30

<0.001

IVC diameter (mm)

20.5 ± 5.3

20.5 ± 21.0

0.998

RAP (mmHg)

11.3 ± 6.4

5.7 ± 3.9

0.004

LSM, liver stiffness measurement; Alb, albumen; T-Bil, total bilirubin; AST, aspartate aminotransferase; ALT, alanine aminotransferase; BUN, blood Urea nitrogen; Cre, creatinine ; WBC, white blood cells count; Hb, hemoglobin; Plt, platelet count; BNP, brain natriuretic peptide; HA, hyaluronic acid; FIB-4, fibrosis index based on four factors; IVC, inferior vena cava; RAP, right arterial pressure;

Figure 2: Survival was worsened with LSM>9.65 in patients with chronic heart failure. ROC curves for identification of survival of LSM and RAP (A). Kaplan-Meier curve in patients with chronic heart failure according to LSM (B). LSM, liver stiffness measurement; ROC, receiver operating characteristic; RAP, right arterial pressure.

Discussion

In this study, there was a higher level of liver stiffness in patients with CHF without known pre-existing liver disease. The mean LSM reached 9.2 kPa in those patients, which is a significantly higher value than the normal range reported previously [20]. Several studies have investigated the influence of increased RAP in LSM during heart failure [18,21,22]. Taniguchi et al. showed a close correlation between RAP and LSM with a curvilinear regression equation in patients with heart failure [21]. We also found a good correlation between LSM and RAP in the present study, which is consistent with previous reports. The use of a non-invasive tool for evaluation of RAP should be a great interest for clinical management of patients with CHF. The evaluation of RAP has the potential to improve the hemodynamic profiling of patients, which can lead to better patient management and outcomes.

Millonig et al. showed that the central venous pressure (CVP) value reversibly controls LSM in an animal model [23]. However, Colli et al. used diuresis to demonstrate a small reduction in LSM in patients with chronic heart failure, from 8.8 to 7.2 kPa in 27 patients, with a median reduction of 1.2 kPa [18]. The explanation for the small change in LSM in patients with CHF before and after diuresis was not clear, but the elevated LSM following attainment of euvolemia may be due to the presence of the underlying fibrosis. In the present study, we found that FIB-4 index was increased in patients with CHF. FIB-4 was important biomarkers of liver fibrosis in patients with CHF.

Although little is known about the mechanism of liver fibrosis in patients with CHF, the pathogenesis of congestive hepatic fibrosis is thought to be a reaction of stellate cells following prolonged congestive heart failure or hepatic outflow obstruction. The stellate cells are transformed into alpha-smooth muscle actin-positive myofibroblasts, and these myofibroblasts produce extracellular matrix proteins in centrilobular sinusoidal areas under congestive condition [24]. Fujimoto et al. showed that HA was increased in right heart failure rat model as well as in patients with liver cirrhosis [25]. In the present study, we found that HA was increased in patients with CHF.

As mentioned, liver stiffness is influenced by liver congestion independent of the degree of liver fibrosis. In addition, inflammatory infiltration, tissue edema, and cholestasis can also affect LSM [16,17]. However, total bilirubin, AST, and ALT were within normal range in almost all the patients and there was no significant correlation between LSM and these laboratory parameters in the present study.

Previous studies demonstrated LSM is associated with risk of decompensation, liver cancer, and death in patients with chronic liver disease [26]. In the present study, we found that LSM was also associated with OS in patients with CHF. Moreover, our results showed that LSM was a better prognostic indicator than RAP for OS of CHF patients. The reason is that LSM could be affected not only by RAP but also by liver fibrosis.

There were several limitations in the present study. Firstly, the liver histological data, which would lead to a better proof of the utility of LSM, was insufficient. However, liver biopsy is invasive and considered inappropriate for patients with CHF because of the greater possibility of bleeding complications. Secondly, it is not clear whether the FIB-4 is valuable in patients with CHF. Following congestive heart failure, AST levels also may be routinely increased; however, the liver test abnormalities in our patients were very small, indicating that liver injuries were not severe in our patients. Thirdly, the sample size was not large enough for definitive conclusions. Therefore, further multicenter studies are needed to confirm the present results. Despite these limitations, our findings could be relevant in the future and will stimulate further research in this field.

In conclusion, we suggest the possibility that LSM obtained via Fibroscan may be associated with RAP, but also with the underlying liver fibrosis and survival in patients with CHF. LSM might be used in risk stratification in patients with CHF.

Author Contributions

Concept of the study (K.S, Y.T.), extraction of data (Y.T., K.S.), drafting of the manuscript (Y.T.), writing of the manuscript (Y.T., K.S., K.D), revision for important intellectual content (all authors). All authors approved the final version of the manuscript.

Funding: No external financial support was received.

Conflict of interest: Nothing to declare for all authors.

References

    1. Kubo SH, Walter BA, John DH, Clark M, et al. (1987) Liver function abnormalities in chronic heart failure. Influence of systemic hemodynamics. Arch Intern Med 147(7): 1227-30. Epub 1987/07/01. [crossref]
    2. Sherlock S (1951) The liver in heart failure; relation of anatomical, functional, and circulatory changes. Br Heart J 13(3): 273-93. Epub 1951/07/01. [crossref]
    3. Gelow JM, Desai AS, Hochberg CP, Glickman JN, et al. (2010) Clinical predictors of hepatic fibrosis in chronic advanced heart failure. Circ Heart Fail 3(1): 59-64. Epub 2009/10/16. [crossref]
    4. Myers RP, Cerini R, Sayegh R, Moreau R, et al. (2003) Cardiac hepatopathy: clinical, hemodynamic, and histologic characteristics and correlations. Hepatology 37(2): 393-400. Epub 2003/01/24. [crossref]
    5. Simonetto DA, Yang HY, Yin M, de Assuncao TM, et al. (2015) Chronic passive venous congestion drives hepatic fibrogenesis via sinusoidal thrombosis and mechanical forces. Hepatology 61(2): 648-59. Epub 2014/08/22. [crossref]
    6. Cadranel JF, Rufat P, Degos F (2000) Practices of liver biopsy in France: results of a prospective nationwide survey. For the Group of Epidemiology of the French Association for the Study of the Liver (AFEF). Hepatology 32(3): 477-81. Epub 2000/08/29. [crossref]
    7. Suzuki A, Angulo P, Lymp J, Li D, et al. (2005) Hyaluronic acid, an accurate serum marker for severe hepatic fibrosis in patients with non-alcoholic fatty liver disease. Liver Int 25(4): 779-86. Epub 2005/07/07. [crossref]
    8. Sterling RK, Lissen E, Clumeck N, Sola R, et al. (2006) Development of a simple noninvasive index to predict significant fibrosis in patients with HIV/HCV coinfection. Hepatology 43(6): 1317-25. Epub 2006/05/27. [crossref]
    9. Vallet-Pichard A, Mallet V, Nalpas B, Verkarre V, et al. (2007) FIB-4: an inexpensive and accurate marker of fibrosis in HCV infection. comparison with liver biopsy and fibrotest. Hepatology 46(1): 32-6. Epub 2007/06/15. [crossref]
    10. Shah AG, Lydecker A, Murray K, Tetri BN, et al. (2009) Comparison of noninvasive markers of fibrosis in patients with nonalcoholic fatty liver disease. Clin Gastroenterol Hepatol 7(10): 1104-12. Epub 2009/06/16. [crossref]
    11. Martinez SM, Crespo G, Navasa M, Forns X (2011) Noninvasive assessment of liver fibrosis. Hepatology 53(1): 325-35. Epub 2011/01/22. [crossref]
    12. Castera L, Forns X, Alberti A (2008) Non-invasive evaluation of liver fibrosis using transient elastography. J Hepatol 48(5): 835-47. Epub 2008/03/13. [crossref]
    13. Castera L, Vergniol J, Foucher J, Le Bail B, et al. (2005) Prospective comparison of transient elastography, Fibrotest, APRI, and liver biopsy for the assessment of fibrosis in chronic hepatitis C. Gastroenterology 128(2): 343-50. Epub 2005/02/03. [crossref]
    14. Fernandez M, Trepo E, Degre D, Gustot T, et al. (2015) Transient elastography using Fibroscan is the most reliable noninvasive method for the diagnosis of advanced fibrosis and cirrhosis in alcoholic liver disease. Eur J Gastroenterol Hepatol 27(9): 1074-9. Epub 2015/05/27. [crossref]
    15. Hashemi SA, Alavian SM, Gholami-Fesharaki M (2016) Assessment of transient elastography (FibroScan) for diagnosis of fibrosis in non-alcoholic fatty liver disease: A systematic review and meta-analysis. Caspian J Intern Med 7(4): 242-52. Epub 2016/12/22. [crossref]
    16. Arena U, Vizzutti F, Corti G, Ambu S, et al. (2008) Acute viral hepatitis increases liver stiffness values measured by transient elastography. Hepatology 47(2): 380-4. Epub 2007/12/21. [crossref]
    17. Millonig G, Reimann FM, Friedrich S, Fonouni H, et al. (2008) Extrahepatic cholestasis increases liver stiffness (FibroScan) irrespective of fibrosis. Hepatology 48(5): 1718-23. Epub 2008/10/07.
    18. Colli A, Pozzoni P, Berzuini A, Gerosa A, et al. (2010) Decompensated chronic heart failure: increased liver stiffness measured by means of transient elastography. Radiology 257(3): 872-8. Epub 2010/10/12. [crossref]
    19. Lebray P, Varnous S, Charlotte F, Varaut A, et al. (2008) Liver stiffness is an unreliable marker of liver fibrosis in patients with cardiac insufficiency. Hepatology 48(6): 2089. Epub 2008/11/13.
    20. Alsebaey A, Allam N, Alswat K, Waked I (2015) Normal liver stiffness: A study in living donors with normal liver histology. World J Hepatol 7(8): 1149-53. Epub 2015/06/09. [crossref]
    21. Taniguchi T, Sakata Y, Ohtani T, Mizote I, et al. (2014) Usefulness of transient elastography for noninvasive and reliable estimation of right-sided filling pressure in heart failure. Am J Cardiol 113(3): 552-8. Epub 2013/12/10. [crossref]
    22. Hopper I, Kemp W, Porapakkham P, Sata Y, et al. (2012) Impact of heart failure and changes to volume status on liver stiffness: non-invasive assessment using transient elastography. Eur J Heart Fail 14(6): 621-7. Epub 2012/04/24. [crossref]
    23. Millonig G, Friedrich S, Adolf S, Fonouni H, et al. (2010) Liver stiffness is directly influenced by central venous pressure. J Hepatol 52(2): 206-10. Epub 2009/12/22. [crossref]
    24. Seki E, Schwabe RF (2015) Hepatic inflammation and fibrosis: functional links and key pathways. Hepatology 61(3): 1066-79. Epub 2014/07/30. [crossref]
    25. Fujimoto Y, Urashima T, Shimura D, Ito R, et al. (2016) Low Cardiac Output Leads Hepatic Fibrosis in Right Heart Failure Model Rats. PLoS One 11(2): e0148666. Epub 2016/02/11. [crossref]
    26. Singh S, Fujii LL, Murad MH, Wang Z, et al. (2013) Liver stiffness is associated with risk of decompensation, liver cancer, and death in patients with chronic liver diseases: a systematic review and meta-analysis. Clin Gastroenterol Hepatol 11(12): 1573-84 e1-2; quiz e88-9. Epub 2013/08/21. [crossref]
JDMR fig7

The Influence of Glass Content on the Hydraulic Conductance and Tubule Occlusion of Novel Bioactive GlassToothpastes

DOI: 10.31038/JDMR.2020332

Abstract

Bioactive glasses are widely used as additives in remineralising toothpastes for treating dentine hypersensitivity, which is associated with dentinal fluid flow within exposed dentinal tubules. This study investigates the weight percentage of a fluoride containing bioactive glass in a toothpaste formulation on tubule occlusion and fluid flow of mid coronal dentine discs. Tests were performed after brushing, after immersion in artificial saliva and after a citric acid challenge.

There was a statisticallly significant reduction in fluid flow after application of all the toothpastes but the fluid flow reduction was not statistically significantly above a 5% loading of bioactive glass in the toothpaste. Immersion In artificial saliva after brushing reduced the fluid flow for all loadings but was not statisticaly significant, whilst an acid challenge increased the fluid flow but was again not statistically significant.

SEM observations of mid coronal sections showed improved occlusion of the dentinal tubules up to a 5% loading but minimal further improvement for higher loadings.

In conclusion a 5% loading of bioactive glass is close to optimum for reducing fluid flow and tubule occlusion.

Keywords

Bioactive glass, Glass loading, Hydraulic conductance, Tubular occlusion, Dentine hypersensitivity

Introduction

Dentine Hypersensitivity (DH) is characterized as a sharp dental pain of short duration caused by the reaction of exposed dentine surfaces to stimuli, typically thermal, evaporative, tactile, osmotic or chemical that cannot be associated to any other dental defect of pathology [1]. It is based on the hydrodynamic theory where stimuli applied onto the exposed dentinal tubules cause fluid movement across the dentine, passing them to the intradental pulpal nerves and thereby initiating a painful sensation [2].

DH is known to usually impact on the quality of life of affected individuals by instigating painful sensation during eating and drinking hot and cold food and beverages [3]. The prevalence of DH in UK is estimated at 52% [4]. This figure however drops significantly when the conduct of the study shifted from patients’ self-reported questionnaires to clinical examinations by dentists. In clinical studies, the reported prevalence is 2.8% [5] and 18% [6] respectively.

The hydrodynamic theory is consistent with the observation that when DH is treated with a tubule-occluding agent, this will result in a reduction in DH [7,8]. Occlusion of exposed dentinal tubules is a widely used strategy for treating DH, and many Over-The-Counter (OTC) toothpastes propose tubule occlusion as their mode of action.

Previously, a bioactive glass (NovaMin®, developed originally by NovaMin Technology Inc., Alachua, FL, USA) based on the original 45S5 Bioglass® composition (US Biomaterials Corp. Jacksonville, FL, USA) has been used as a remineralising and occluding ingredient in toothpaste formulations for treating DH [9-17]. This works by precipitating Hydroxycarbonate Apatite (HCA) onto the tooth surface and subsequently occluding the dentinal tubules [12-17]. However, concerns have been expressed over the long-term durability of HCA in the mouth, and formation of Fluorapatite (FAp), rather than HCA is preferable, as it is more resistant to subsequent acid attack and dissolves less readily when exposed to acids (e.g. during consumption of fruit juice and carbonated beverages).

In recent years solid state Nuclear Magnetic Resonance Spectroscopy has been used to understand bioactive glass structure, enabling new bioactive glass compositions to be developed [18,19] with vastly improved bioactivity. Of particular note here are the fluorine containing bioactive glasses developed by Brauer et al. [20,21] and the high phosphate fluorine containing glasses developed by Mneimne et al. [22]. These new glass compositions release fluoride in addition to calcium and phosphate and form fluorapatite and have recently been developed specifically for toothpastes [23-31].

The objective of this paper is to investigate the ability of one of these new fluorine containing glasses to occlude dentinal tubules and to reduce fluid flow as a function of the amount of glass in the paste immediately after treatment, after immersion in saliva and after an acid challenge.

Materials and Methods

The materials and methods consisted of two stages. The first stage involved the preparation of the raw materials to be used for the study whereas the second stage comprised the experimental design, which covered the conduct of the study.

Collection of Teeth

A total of 108 extracted, caries-free human molars were collected from patients attending the walk-in clinic at Tanah Puteh Dental Clinic, Malaysia from May 2016 to August 2016. In accordance with local ethics in the Malaysian clinic verbal consent was obtained from patients who required extraction of their teeth. Following extraction, the teeth were washed and stored in Listerine (Listerine Original) mouthwash solution at room temperature. The collected teeth were then brought to London in September 2016 by SFT under strict health and safety guidelines as required by QMUL. On arrival in the UK laboratory the teeth transferred to a 70% Ethanol solution until the commencement of the study.

Preparation of Mid Coronal Dentine Sections

All the collected human molar teeth were prepared into dentine discs of 1.3 mm thickness using an automatic precision cutting machine (Struers Accutom 5, Denmark). The dentine discs were then ground using a Kemet 4 machine (Kemet Maidstone Kent ME15 9NJ UK) followed by polishing with three different silicon carbide papers in a descending order of abrasive coarseness, starting from carbide paper grade P600, P1000 to P2500. The polishing was considered complete when the discs were polished to the thickness of 1.0 mm. The thickness of the discs was monitored constantly using a digital micrometer to avoid over polishing.

Etching of Dentine Sections

The etching of dentine discs was only performed just before the discs were to be used for the experimental steps. It was undertaken by dipping the discs into 6% w/w citric acid solution for 30 seconds. The purpose of etching was to remove any smear layer on the discs, thereby opening up the tubules [32]. The discs were then ultrasonicated with deionized water in an ultrasonic bath for 30 seconds to remove any residual acid.

Preparation of Artificial Saliva

The artificial saliva is based on a formulation first proposed by Featherstone et al. [32] and consists of 2.24 grams of KCl, 1.36 grams of KH2PO4, 0.76 grams NaCl, 0.44 grams of CaCl2.2H2O, 2.2 grams of porcine Mucin and 0.2 grams of NaN3 (all Sigma-Aldrich, UK) were mixed with 800 grams of deionized water in a 1 litre volumetric flask. The mixture was stirred using a magnetic hotplate stirrer for 30 minutes until all reagents were fully dissolved. The mixture’s pH was then adjusted to 6.5 at room temperature using a pH meter (Oakton, Netherlands) by adding 0.5 M of KOH sequentially until the desired pH was obtained. Separately, 0.5 M of KOH was prepared beforehand by mixing 1.40 grams of KOH (Sigma-Aldrich, UK) in 50 ml deionized water. The final mixture was made up with deionized water to 1 litre. The produced artificial saliva solution was kept in a fridge set at 5°C until required and used within 2 weeks of preparation.

Preparation of Bioactive Glass Toothpaste

The Bioactive Glass BioMinF® was supplied by CDL Ltd Stoke UK and is a fluoride containing bioactive glass. The particle size of the supplied BioMinF® was characterised using a Malvern 3000 Particle Size analyser (Malvern Pananalytical Malvern WR14 1XZ, UK). For comparison a sample of NovaMin® was obtained from 3M (Ceradyne) Seattle USA.

Preparation of the Bioactive Glass Base Paste

This stage involved the preparation of the base paste first, which was then mixed with different loading of bioactive glass. The base paste was made in the laboratory according to the formulation in US Patent US 2009/0324516 [33] with slight modifications. Components such as bioactive glass, fluoride and flavour were omitted. The composition of the active and inactive ingredients required to produce 100 grams of base paste are listed in Table 1. Each ingredient was weighed separately and then mixed together with a metallic mixing spatula in a 100 ml plastic container. The end product was kept in room temperature until use.

Table 1: Composition of active and inactive ingredients required to produce 100 gram of base paste.

Component Function Weight Percentage
Glycerol Humectant 68.75%
Polyethylene Glycol Dispersant and to reduce stickiness 20.83%
K Acesulfame Sweetener 0.48%
Polyacrylic Acid Binder 0.59%
Titanium Oxide Whitener 1.91%
Syloid 63 Silica 7.15%
Sodium Dedecyl Sulfate Surfactant 1.01%


Five 10 grams toothpastes with a different loading of bioactive glass of 0.0%, 2.5%, 5.0%, 7.5%, 10.0% and 15.0% by weight were fabricated manually by using a mortar and pestle technique. The composition for each toothpaste is represented in Table 2.

Table 2: Composition of Bioactive Glass in Various Loading.

Type of Toothpaste                  Materials incorporated into each toothpaste
Base Paste (g) Bioactive glass (g)
0.0% loading 10.00 0.00
2.5% loading 9.75 0.25
5.0% loading 9.50 0.50
7.5% loading 9.25 0.75
10.0% loading 9.00 1.00
15.0% loading 8.50 1.50


To produce a 2.5% bioactive toothpaste, 9.75 grams of base paste were added to a clean mortar. This was followed by adding 0.25 grams of bioactive glass. The two elements were mixed thoroughly for 150 seconds. The same methods were applied to produce 5.0%, 7.5%, 10.0% and 15.0% loading of bioactive toothpaste. All the prepared toothpastes were stored in six separate sealed 50 ml plastic bottles until required.

The experimental design involves two parts:

     a) Comparing the dentine permeability by measuring hydraulic conductance (Lp).

     b) Comparing the occlusive effect of dentinal tubules using SEM.

Hydraulic Conductance Measurement Procedures

A split chamber device based on the design by Pashley and Galloway [34] was used. The total distance travelled by the air bubble in 240 seconds was designated as the baseline flow rate, which was allocated a value of 100% permeability.

Measuring the Dentinal Permeability after Treatment with Toothpaste

0.4 gram of toothpaste was squeezed onto a brush head (Oral-B Floss Action Replacement) and mounted on an electric rechargeable toothbrush (Oral-B Vitality Plus). Without removing the disc from the Pashley cell, it was treated with the toothpaste for 2 minutes. The brush head bristles were applied on to the discs at an inclination of 90 degrees. Immediately after 2 minutes of brushing, the disc was rinsed with deionized water for 10 seconds.

Measuring the Dentinal Permeability Post-treatment with Artificial Saliva

The dentine disc together with the Pashley cell were immersed in 40 ml of artificial saliva at room temperature for 1 hour and then rinsed with deionized water for 10 seconds. The dentine permeability was then measured again.

Measuring the Dentinal Permeability Post-treatment with Artificial Saliva and an Acid Challenge

The disc was next immersed in 30 ml of a 6% citric acid solution for 2 minutes and rinsed with deionized water for 10 seconds. The dentine permeability was then measured for a final time.

A total of 30 dentine discs were used. They were distributed equally into six groups, with each group treated with a different loading of toothpaste. Each toothpaste was dedicated with a specific brush head to avoid contamination with others. Analysis of the dentinal permeability measurement was conducted as follows:

     a) Percentage flow reduction after treatment with toothpaste

f1

     b) Percentage flow reduction after treatment with toothpaste and immersion in artificial saliva

f2

     c) Percentage flow reduction after treatment with toothpaste, immersion in artificial saliva and acid challenge

f3

       where V0 =  Dentine permeability at baseline (after acid etch)

                 V1 = Dentine permeability immediately after toothpaste application

                 V2 = Dentine permeability following immersion in artificial saliva

                 V3 = Dentine permeability following acid challenge

Scanning Electron Microscopy was conducted on separate samples according to the same protocols used for the dentine permeability measurements. The discs were sputter coated with gold prior to examination and examined in a FEI Inspect-F SEM.

Results

Particle Size Analysis

Table 3 gives the D90, D50 and D10 values for the particle size for two commercially available Bioactive Glasses. The particle size of the BioMinF® glass is somewhat smaller than the NovaMin® and is thought to have been optimised for tubule occlusion with a larger proportion of particles being smaller than the size of dentinal tubules.

Table 3: Particle Size of Bioactive Glasses.

BioActive Glass

D90

(μm)

D50

(μm)

D10

(μm)

BioMinF®

23.00 5.92

0.62

NovaMin® 45.55 14.47

1.77

Hydraulic Conductance

Figure 1 shows the percentage reduction in hydraulic conductance or fluid flow reduction (FFR) after brushing the toothpaste on to mid coronal dentine discs. There is a small approximately 20% reduction in hydraulic conductance after applying the 0% BG toothpaste that may be a result of silica particles in the paste occluding the tubules. This increases to approximately 30% for the 2.5% glass loading and to just over 60% for a 5% loading of the glass. Above 5% there is a much more limited reduction in the hydraulic conductance with the 15% loading giving a 70% reduction. Above 5% loading of glass there is no statistical increase in the FFR (Tables 4-7). However the FFR is statistically significant up to a 5% loading of glass.

fig1

Figure 1: Percentage FFR against BioMinF Loading after Brushing.

Table 4: Statistical Result for Comparison of Percentage Fluid Flow Reduction after Toothpaste Application.

Comparison of Percentage Fluid Flow Reduction after Toothpaste Application
 Statistical Data Bioactive Glass Loading
0% 2.50% 5.00% 7.50% 10.00% 15.00%
Sample Mean (in %), x 19.72 29.37 61.53 63.63 67.39 71.19
Sample sd, s 13.71 5.31 15.02 3.33 8.61 8.77
Sample Size, n 5 5 5 5 5 5
Confidence Interval, CI 1.96 1.96 1.96 1.96 1.96 1.96
Margin of Error 12.02 4.65 13.16 2.92 7.55 7.69
Upper Bound 31.73 34.02 74.69 66.55 74.94 78.88
Lower Bound 7.70 24.72 48.36 60.70 59.84 63.51
Paired t-test Comparing Each Group (P<0.05)
T-test comparing to 0% 0.128529 0.000693 0.001276 0.002087 0.0022316
T-test comparing to 2.5% 0.004738 0.000264 0.000104 3.269E-05
T-test comparing to 5.0% 0.386578 0.238683 0.1454652
T-test comparing to 7.5% 0.246252 0.0712444
T-test comparing to 10.0% 0.2436429

Table 5: Percentage FFR in Comparison to the Baseline Control after treatment with the toothpaste after treatment with the toothpaste and immersion in artificial saliva (AS) and then with an acid challenge.

Bioactive Glass Loading Percentage FFR in Comparison with Baseline/Control (%)
After treatment with toothpaste After treatment with toothpaste and immersion in artificial saliva After treatment with toothpaste, immersion in artificial saliva and acid challenge
0.0% 19.72 22.29 16.11
2.5% 29.37 33.97 26.57
5.0% 61.53 63.83 49.02
7.5% 63.63 64.96 56.63
10.0% 67.39 66.29 55.53
15.0% 71.19 71.53 65.26

Table 6: Statistical Result for Comparison of Percentage Fluid Flow Reduction after Toothpaste Application and Saliva Immersion.

Comparison of Percentage Fluid Flow Reduction after Toothpaste Application and Saliva Immersion
Statistical Data Bioactive Glass Loading
0% 2.50% 5.00% 7.50% 10.00% 15.00%
Sample Mean (in %), x 22.29 33.97 63.83 64.96 66.29 71.53
Sample sd, s 17.14 5.58 18.70 3.85 6.04 13.59
Sample Size, n 5 5 5 5 5 5
Confidence Interval, CI 1.96 1.96 1.96 1.96 1.96 1.96
Margin of Error 15.03 4.89 16.39 3.38 5.29 11.91
Upper Bound 37.32 38.86 80.22 68.34 71.58 83.44
Lower Bound 7.27 29.07 47.44 61.58 61.00 59.62
Paired t-test Comparing Each Group (p<0.05)
T-test comparing to 0% 0.1560 0.0011 0.001758 0.003325 0.0073734
T-test comparing to 2.5% 0.019915 0.000576 0.000312 0.0009269
T-test comparing to 5.0% 0.446936 0.389115 0.2486045
T-test comparing to 7.5% 0.357676 0.182191
T-test comparing to 10.0% 0.1308723

Table 7: Statistical Result for Comparison of Percentage Fluid Flow Reduction after Toothpaste Application, Saliva Immersion and Acid Challenge.

Comparison of Percentage Fluid Flow Reduction after Toothpaste Application, Saliva Immersion and Acid Challenge
 Statistical Data Bioactive Glass Loading
0% 2.50% 5.00% 7.50% 10.00% 15.00%
Sample Mean (in %), x 16.11 26.57 49.02 56.63 55.53 65.26
Sample sd, s 14.39 3.63 20.55 5.17 15.04 10.75
Sample Size, n 5 5 5 5 5 5
Confidence Interval, CI 1.96 1.96 1.96 1.96 1.96 1.96
Margin of Error 12.61 3.18 18.01 4.53 13.18 9.42
Upper Bound 28.72 29.75 67.03 61.16 68.71 74.69
Lower Bound 3.50 23.39 31.01 52.09 42.35 55.84
Paired t-test Comparing Each Group (P<0.05)
T-test comparing to 0% 0.0734 0.0087 0.0006 0.0093 0.0035
T-test comparing to 2.5% 0.0353 5.46E-05 0.0047 0.0005
T-test comparing to 5.0% 0.2447 0.2922 0.0873
T-test comparing to 7.5% 0.4460 0.1220
T-test comparing to 10.0% 0.0952


Table 5 shows the FFR results after immersion in artificial saliva (AS) and then following an acid challenge to mimic the consumption of an acidic drink. In all cases there is an increase in the FFR from 0% to 2.5% to 5% and these differences are statistically significant (Tables 3 and 4). The results mirror the data before immersion in AS.

Above a 5% loading of BAG in the paste there are no statistically significant increases in the FFR. There was also no significant increase or decrease in the FFR values for any given loading from application to immersion in AS to applying an acid challenge. However, for all glass loadings there is a small decrease in the FFR following an acid challenge, but this was not statistically significant in paired t-tests in regard to either the brushed or the brushed with AS treatments.

Tubule Occlusion

The tubule occlusion was followed using scanning electron microscopy mid coronal dentine discs. Figure 2 shows the SEMs after brushing with the 0% BioMinF toothpaste. There is no visual evidence of any tubule occlusion, although there are a small number of fine particles on the treated surfaces. Figure 3 shows the SEMs of the 2.5% BioMinF toothpaste. There is significant tubule occlusion and a marked reduction in their size. The tubules are more obvious following the acid challenge. For dentine discs treated with 5% or more BioMinF loaded toothpastes (Figures 4-8) there is excellent tubule occlusion. There is slight evidence that this might improve slightly after immersion in AS and may deteriorate slightly on exposure to an acid challenge. There may be very slightly better tubule occlusion on increasing the glass loading above 5%.

JDMR fig2

Figure 2: SEM Images seen at x10000 Magnification. (A) Control. (B) After 0.0% Bioactive Glass Toothpaste Application. (C) Following Saliva Immersion. (D) Following Acid Challenge.

JDMR fig3

Figure 3: SEM Images seen at x10000 Magnification. (A) Control. (B) After 2.5% Bioactive Glass Toothpaste Application. (C) Following Saliva Immersion. (D) Following Acid Challenge.

JDMR fig4

Figure 4: SEM Images seen at x10000 Magnification. (A) Control. (B) After 5.0% Bioactive Glass Toothpaste Application. (C) Following Saliva Immersion. (D) Following Acid Challenge.

JDMR fig5

Figure 5: SEM Images seen at x10000 Magnification. (A) Control. (B) After 7.5% Bioactive Glass Toothpaste Application. (C) Following Saliva Immersion. (D) Following Acid Challenge.

JDMR fig6

Figure 6: SEM Images seen at x10000 Magnification. (A) Control. (B) After 10.0% Bioactive Glass Toothpaste Application. (C) Following Saliva Immersion. (D) Following Acid Challenge.

JDMR fig7

Figure 7: SEM Images seen at x10000 Magnification. (A) Control. (B) After 15.0% Bioactive Glass Toothpaste Application. (C) Following Saliva Immersion. (D) Following Acid Challenge.

JDMR fig8

Figure 8: SEM Observation of all bioglass loading(s) following brushing (Cross-Sectional View at x5000 magnification).

At a 0.0% glass loading, there was no crystal formation at the surface or within the tubules. However, at 2.5%, a thin layer of crystal deposit (arrow) was observed covering the surface. As the bioactive glass loading increased, the crystal deposits were observed to extend deeper into the tubules (arrows). At the 15.0% bioactive glass loading, large amounts of crystal deposits were observed at the surface of the dentine disc and within the dentinal tubules.

In general the SEM observations fit well with the hydraulic conductance data and FFR values observed.

Discussion

In the absence of the glass in the toothpaste formulation there is a small reduction in hydraulic conductance and the FFR is about 20%, There may be some tubule occlusion due to the presence of fine particles in the paste, notably silica and titanium dioxide particles. There is no evidence of any significant tubule occlusion when examined by SEM. On incorporating 2.5% glass particles into the toothpaste there is a further approximately 10% increase in FFR. The glass has a D50 of 5.92 μm (Table 3) close to the diameter of the larger dentinal tubules and up to 50% of the glass particles are therefore potentially small enough to enter the dentinal tubules and occlude them. On increasing the loading of glass to 5% there will be twice as many particles present that are small enough to occlude the dentinal tubules and the FFR increases to more than 60%. Figure 3 shows much greater tubule occlusion for the 5% glass loading than Figure 2 for the 2.5% loading. More than 90% of the tubules are occluded with the 5% loading. On increasing the bioactive glass content further there were no statistically significant increases in FFR or any observable increase in tubule occlusion in the SEM micrographs. Above 5% there are probably sufficient numbers of particles smaller than the dentinal tubule diameter to fully occlude the tubules and more glass particles present in the higher loadings do not improve the tubule occlusion.

On immersion in AS all the samples show a small increase in the FFR values, however it is not statistically significant. Bioactive glasses react with physiological solutions to form apatite and in the case of fluoride containing bioactive glasses such as BioMinF® fluorapatite is formed. Fluorapatite formation is desirable because fluorapatite is much more resistant to acids than hydroxyapatite or calcium carbonate used to occlude tubules in other proprietary dentine hypersensitivity toothpastes. The micrographs are all very similar to the ones before immersion in AS.

On immersing the samples in 6% citric acid, to mimic the consumption of an acidic drink in the mouth the FFR values all decrease slightly. However statistically there is no significant reduction. The micrographs do show some evidence of more open tubules following the acid treatment, but the effect is small on tubule occlusion. There seems to be evidence that the material of the surface layer and in the entrances of the tubules is being dissolved but that material deeper within the tubules remains, this phenomenon is most marked in with the 2.5% glass loading. The surfaces of the dentine discs also become noticeably smoother and there is generally a loss of the angular glass particles on the surface that is probably a result of the citric acid dissolving the remaining glass particles. Bingel et al. [35] showed that bioactive glasses dissolve much more rapidly under acidic conditions.

Conclusions

      • A 5% loading of glass is close to being optimal in terms of its effect on FFR reduction immediately after brushing, after immersion in AS and after an acid challenge.
      • There is no statistically significant increase in FFR after immersion in AS and no statistically significant reduction after an acid treatment.
      • There is virtually no tubule occlusion for the 0% glass toothpaste and an obvious increasing tubule occlusion up to 5% after this there may be a very slight increase in tubule occlusion with glass loading, but the effect is small.
      • There is a slight effect of immersion in AS improving tubule occlusion and there may be a slight reduction in tubule occlusion on applying an acid challenge.
      • It is possible that a higher loading of glass would be desirable, but this would involve a significant cost increase.

References

      1. Dowell P, Addy M (1983) Dentine hypersensitivity–a review. Aetiology, symptoms and theories of pain production. J Clin Periodontol 10: 341-350. [crossref]
      2. Brännström M, Åström A (1972) Hydrodynamics of dentine—its possible relationship to dentinal pain. International Dental Journal 22: 219-227. [crossref]
      3. Gillam DG (2013) Diagnosis and management of dentine sensitivity. Dental Nursing 9: 320-327.
      4. Gillam DG, Seo HS, Bulman JS, Newman HN (1999) ‘Perceptions of dentine hypersensitivity in a general practice population’. J Oral Rehabil 26: 710-714. [crossref]
      5. Rees JS, Addy M (2004) A cross-sectional study of buccal cervical sensitivity in UK general dental practice and a summary review of prevalence studies’. Int J Dent Hyg 2: 64-69. [crossref]
      6. Orchardson R, Collins WJ (1987) ‘Clinical features of hypersensitive teeth’. Br Dent J 162: 253-256. [crossref]
      7. Pashley DH, Meara JA, Kepler EE, Galloway SE, Thompson SM, et al. (1984) ‘Dentin permeability. Effects of desensitizing dentifrices in vitro’. J Periodontol 55: 522-5. [crossref]
      8. Pashley D (1986) Dentin permeability, sensitivity and treatment through tubule occlusion. Journal of Endodontics 12: 465-474. [crossref]
      9. Gillam DG, Tang JY, Mordan NJ, Newman HN (2002) The effects of a novel Bioglass® dentifrice on dentine sensitivity: a scanning electron microscopy investigation. J Oral Rehabil 29: 305-313. [crossref]
      10. Burwell A, Jennings D, Muscle D, Greenspan DC (2010) NovaMin and dentin hypersensitivity–in vitro evidence of efficacy. J Clin Dent 21: 66-71. [crossref]
      11. LaTorre G, Greenspan DC (2010) The role of ionic release from NovaMin (calcium sodium phosphosilicate) in tubule occlusion: an exploratory in vitro study using radio-labeled isotopes. J Clin Dent 21: 72-76. [crossref]
      12. Litkowski L, Greenspan DC (2010) A clinical study of the effect of calcium sodium phosphosilicate on dentin hypersensitivity–proof of principle. J Clin Dent 21: 77-81. [crossref]
      13. Salian S, Thakur S, Kulkarni S, LaTorre G (2010) A randomized controlled clinical study evaluating the efficacy of two desensitizing dentifrices. J Clin Dent 21: 82-87. [crossref]
      14. Kanwal N, Brauer DS, Earl J, Wilson RM, Karpukhina N. and Hill R.G (2018) “In-vitro apatite formation capacity of a bioactive glass – containing toothpaste” J Dent 68: 51-58. [crossref]
      15. Greenspan DC (2010) NovaMin and tooth sensitivity-an overview. J Clin Dent 21: 61-65. [crossref]
      16. Earl JS, Ward MB, Langford RM (2010) Investigation of dentinal tubule occlusion using FIB-SEM milling and EDX. J Clin Dent 21: 37-41 [crossref]
      17. Earl JS, Topping N, Elle J, Langford RM, Greenspan DC (2011) Physical and chemical characterization of the surface layers formed on dentin following treatment with a fluoridated toothpaste containing NovaMin. J Clin Dent 22: 68-73 [crossref]
      18. Elgayar I, Aliev AE, Boccaccini AR, Hill RG (2005) Structural analysis of bioactive glasses. Journal of Non-Crystalline Solids 351: 173-183. [crossref]
      19. O’Donnell MD, Watts SJ, Hill RG, Law RV (2009) The effect of phosphate content on the bioactivity of soda-lime-phosphosilicate glasses. Journal of Materials Science: Materials in Medicine 20: 1611-1618. [crossref]
      20. Brauer DS, Karpukhina N, Law RV, Hill RG (2009) Structure of fluoride-containing bioactive glasses. Journal of Materials Chemistry 19: 5629-5636.
      21. Brauer DS, Karpukhina N, O’Donnell M, Law RV, Hill RG (2010) “Fluoride containing bioactive glasses: Effect of glass design and structure on degradation, pH and apatite formation in simulated body fluid” Acta Biomaterialia 6: 3275-3282.
      22. Mneimne M, Hill RG, Bushby AJ and Brauer DS (2011) “High phosphate content significantly increases apatite formation of fluoride-containing bioactive glasses”. Acta Biomaterialia 7: 1827-1834. [crossref]
      23. Lynch E, Brauer DS, Karpukhina N, Gillam DG and Hill RG (2012) “Multicomponent bioactive glasses of varying fluoride content for treating dentin hypersensitivity”. Dental Materials 18: 168-178.
      24. Imran Farooq, Imran Alam Moheet, Emad AlShwaimi (2015) In vitro dentin tubule occlusion and remineralization competence of various toothpastes Archives of Oral Biology 60: 1246-1253. [crossref]
      25. Patel VR, Shettar L, Thakuri S, Gillam D, Kamal DN (2019) A randomised clinical trial on the efficacy of 5% fluorocalcium phosphosilicate‐containing novel bioactive glass toothpaste. J Oral Rehabil 46: 1121-1126. [crossref]
      26. Luiza Pereira Dias da Cruz, Robert G Hill, Xiaojing Chen, David G. Gillam (2018) Dentine Tubule Occlusion by Novel Bioactive Glass-Based Toothpastes. International Journal of Dentistry. [crossref]
      27. Shalini D Aggarwal, Anamika Borkar, Nikhil Borse, Aneesha Acharya (2019) Comparative evaluation of fluoro calcium phosphosilicate, calcium sodium phosphosilicate, and strontium chloride hexahydrate containing dentifrice for the treatment of dentin hypersensitivity: A randomized single-blind study. Journal of International Oral Health 11: 404-411.
      28. Ella A Naumova, Moritz Staiger, Ouafaa Kouji, Jakov Modri, Thessa Pierchalla, et al. (2019) Randomized investigation of the bioavailability of fluoride in saliva after administration of sodium fluoride, amine fluoride and fluoride containing bioactive glass dentifrices. BMC Oral Health 19: 119.
      29. Shaikh K, Pereira R, Gillam DG, Phad S (2018) Comparative evaluation of desensitizing dentifrices containing BioMin®, Novamin® and fluoride on dentinal tubule occlusion before and after a citric acid challenge– A scanning electron microscope in‐vitro study. J Odontol 2: 105.
      30. Saqib Ali, Imran Farooq, Ahmad M Al-Thobity, Khalifa S Al-Khalifa, Khalid Alhooshani and Salvatore Sauro (2019) An in-vitro evaluation of fluoride content and enamel remineralization potential of two toothpastes containing different bioactive glasses. Bio-Medical Materials and Engineering 30: 487-496. [crossref]
      31. Farooq, I, Majeed A, Al Shwaimi, E, Almasc K (2019) Efficacy of a Novel fluoride Containing Bioactive Glass Based Dentifrice in Remineralising Artificially Induced Demineralisation in Human Enamel. Fluoride 52: 447-455.
      32. Matos AB, Palma RG, Saraceni CHC, Matson E (1997) Effects of Acid Etching on Dentin Surface: SEM Morphological Study Braz Dent J 8: 35-41. [crossref]
      33. Muscle DP, Burwell KA, La Torre G. Composition and methods for enhancing fluoride uptake using bioactive glass.
      34. Pashley DH, and Galloway E (1985)The effects of oxalate treatment on the smear layer of ground surfaces of human dentine. Archives of Oral Biology 30: 731-737. [crossref]
      35. Bingel L, Groh D, Karpukhina N, Brauer DS (2015) Influence of dissolution medium pH on ion release and apatite formation of Bioglasss 45S5. Materials Letters 14: 3279-3282.

COVID-19 Infection Presenting as Acute Onset Focal Status Epilepticus in a Nine Year Old Boy

DOI: 10.31038/JNNC.2020322

Abstract

Atypical  presentations of COVID-19 in children, such as new onset seizures must be recognized, and warrant liberal testing to prevent spread of      the disease. We describe the unique presentation of a child with acute onset focal status epilepticus and vomiting, positive for COVID-19. Patient demographics, history, neurological findings, MRI, treatment, and prognosis were reviewed. The literature was reviewed for prior case reports. This nine year old boy had an episode of vomiting followed by acute onset focal status epilepticus. He was able to walk with assistance but could not speak or follow most commands. He had persistent left eye gaze deviation which could not be overcome and loss of motor function in his right arm. He   also developed left arm automatisms. These symptoms lasted for approximately 90 minutes before resolution following administration of lorazepam. Ten hours after the onset of symptoms our patient developed a temperature of 38.6 and began vomiting again. COVID-19 testing was performed and resulted positive. He had no medical history, no known sick contacts, and there was no family history of seizures or epilepsy. Pediatric patients with COVID-19 present with a broader spectrum of symptoms than adults. While fever and cough are the most common presenting symptom in both the pediatric and adult populations, GI symptoms are more common in the pediatric population. It is important to be aware that atypical presentations including neurologic symptoms are being noted in the pediatric population and may indicate the presence of infection rather than another etiology. This is only the second documented pediatric patient in the world to present with seizure and test positive for COVID-19.

Keywords

Children, Novel Corona virus, Status epilepticus

Introduction

Estimates suggest children currently account for 1%-5% of diagnosed COVID-19 cases [1,2]. Available literature focusing on children is limited in comparison to adults but suggests the clinical spectrum of illness in the pediatric population associated with severe acute respiratory syndrome coronavirus 2 (SARS-CoV-2) which causes coronavirus disease 2019 (COVID-19) is distinct from and broader than that in the adults. The most frequently reported symptoms in adults with COVID-19 include fever, dry cough, fatigue, and in severe cases dyspnea is common [3]. Children, when symptomatic, also present with fever and cough, but a significant proportion present with atypical symptoms such as vomiting and diarrhea [4,5]. A large proportion of COVID-19 positive children are asymptomatic or have mild cases of disease [6,7]. This difference in presentation and severity may lead to underdiagnosis in children facilitating spread of the disease [8]. This report documents the first reported case of a COVID-19 positive child presenting with focal status epilepticus.

Case History

On the evening of admission our patient, a healthy 9 year old boy of Brazilian Portuguese descent, was at his aunt’s home for dinner. At 2200 hours he became nauseous and vomited one time. He was given an antacid and driven back to his parents’ house where he arrived at 2300 hrs. He required assistance but was able to walk into his house where his mother noticed fixed eye deviation to the left, inability to move the right arm, and was unable to speak. He was able to follow commands and was even able to take a shower. One hour after symptom onset, he was reaching out with his left hand for objects that were not there. He was also producing clicking sounds with his tongue. His mother became concerned that he was not improving and transported him to the Emergency Department for evaluation where he was able to walk under his own power.

In the Emergency Department, he was afebrile and vital signs were normal for age. There were no signs of meningismus. He had fixed left eye deviation with absent oculocephalic reflexes, 4 mm pupils responsive bilaterally, a fine tremor in the distal right upper extremity, which was not suppressible, and left arm automatisms. He was aphasic. Our patient was given 1 mg lorazepam IV which terminated his gaze deviation, abnormal movements, and aphasia with return to baseline mental status shortly afterwards. He was then loaded with levetiracetam 20 mg/kg. This child had no significant medical history, immunizations were up to date, took no medications, had no drug allergies, had no history of hospitalizations or surgeries, and had no family history of seizures or epilepsy. He had no recent head trauma, no fevers, URI symptoms, GI symptoms, sick contacts, or recent foreign travel.

Clinical Findings

Laboratory evaluations included a glucose level of 147 mg/dl. CBC and Chem10 were normal. LFTs showed a mild transaminitis. Urine toxicology screen and chest x-ray were normal. CT of the head without contrast was normal. LTM vEEG was abnormal due to the presence of nearly continuous delta slowing seen broadly throughout the right hemisphere, indicative of cortical and subcortical dysfunction. No epileptiform features were seen. Following admission overnight, our patient had returned to baseline mental status without any further clinical seizure activity. On the morning following admission, ten hours after his initial onset of symptoms, our patient developed a temperature of 38.6 C and experienced multiple episodes of vomiting. He was given ondansetron for nausea and acetaminophen for fever, after which symptoms resolved. In the setting of the COVID-19 pandemic, the acute onset of fever with GI symptoms suggested possible infection with the coronavirus. A test was obtained and resulted positive later on the day of admission. An MRI of the Brain was planned due to the focal neurological findings but was deferred due to his positive coronavirus test. Due to the highly infectious nature of COVID-19, his MRI would require scheduling during a low volume period with additional time required to disinfect the scanning equipment, in turn prolonging his admission and possibly exposing staff and other patients. Our patient was asymptomatic and had a normal examination. Thus the decision was made to provide pharmacologic coverage for seizure control and discharge to home, with outpatient MRI follow up after quarantine.

Our patient was in optimal health prior to the onset of symptoms. His presentation with acute focal status epilepticus and vomiting was typically concerning for an infectious etiology, intracranial process, or structural abnormality. He was afebrile, without leukocytosis, had no signs of meningismus or encephalopathy, and had no known sick contacts, so a lumbar puncture was deferred and antibiotics were not started. Computed tomography of the head was normal, indicating mass or hemorrhages were unlikely. Resolution of his presenting symptoms with lorazepam suggested seizure as an etiology.

Discussion

Prior to the COVID-19 result, thought was also given to norovirus and rotavirus infections as those two viruses are associated with seizures in children. Benign convulsions associated with mild gastroenteritis (CWG) are associated with norovirus and rotavirus, however, the highest incidence occurs in children 12-24 months, and is characterized by generalized tonic-clonic seizure activity lasting < 5 minutes [9]. This was inconsistent with our patient’s presentation. Our patient was outside of the expected age group for febrile seizures or CWG, and his presenting seizure was prolonged and focal in semiology. Furthermore, his electroencephalogram the following day revealed diffuse and continuous right hemispheric slowing. All of these features were atypical for febrile seizures or CWG. Yet, given his rapid return to baseline neurological functioning the following morning, acute infectious encephalitis and stroke were similarly unlikely.

Our patient was discharged to home quarantine. At his follow up visit two weeks later, our patient reported no further seizure activity and had returned to his baseline excellent health. Magnetic resonance imaging of the brain was normal without any signs for ischemic injury or structural lesions to account for his seizure. Anticonvulsant therapy was continued pending a following EEG. The current COVID-19 literature documents the clinical symptoms of over 3000 children world-wide and the spectrum of disease in children is still emerging. Only one two year-old girl in China has previously been reported to present with fever, convulsions, and GI symptoms and test positive for COVID-19 [10]. By contrast, the adult literature contains a growing number of COVID-19 positive patients presenting with central nervous system symptoms, including encephalopathy and seizures. A recent report describes a 78 year old woman presenting with focal status epilepticus as a unique clinical feature of COVID-19 [11]. While the link between COVID-19 infection and epileptogenesis has not been established yet, there is a physiologically logical hypothesis to propose linking the two. First, infection is by far the leading cause of focal status epilepticus in children, even outside the setting of direct infection of the meninges. Coronavirus is also thought to cause a dysregulated immune response which ultimately causes much of the morbidity and mortality associated with the disease. It is reasonable that an infectious etiology such as COVID-19 may cause seizures through alterations of cytokine responses, which are also implicated as an etiologic factor in febrile seizures. In this time of pandemic, it is important to recognize atypical presenting symptoms of COVID-19 such as new onset seizures, test liberally, and isolate those infected to prevent spread of the disease [12]. If focal status epilepticus is a unique presenting feature of COVID-19, our patients’ full outcome suggests that this rare presentation may portend a favorable prognosis.

Competing Interests

The authors declare that they have no competing interests.

Funding Information

No internal or external funding for this manuscript. The authors have indicated they have no financial relationships relevant to this article to disclose.

References

  1. Tezer H, Bedir Demirdağ T (2020) Novel coronavirus disease (COVID-19) in children. Turk J Med Sci 50: 592-603. [crossref]
  2. Ludvigsson JF (2020) Systematic review of COVID-19 in children shows milder cases and a better prognosis than adults. Acta Paediatr 109: 1088-1095. [crossref]
  3. Rothan HA, Byrareddy SN (2020) The epidemiology and pathogenesis of coronavirus disease (COVID-19) outbreak. J Autoimmun 109: 102433. [crossref]
  4. Cai J, Xu J, Lin D, Zhi Yang, Lei Xu, et al. (2020) A Case Series of children with 2019 novel coronavirus infection: clinical and epidemiological features [published online ahead of print, 2020 Feb 28]. Clin Infect Dis ciaa198. [crossref]
  5. Hong H, Wang Y, Chung HT, Chen CJ (2020) Clinical characteristics of novel coronavirus disease 2019 (COVID-19) in newborns, infants and children. Pediatr Neonatol 61: 131-132. [crossref]
  6. Cruz AT, Zeichner SL (2020) COVID-19 in Children: Initial Characterization of the Pediatric Disease. Pediatrics e20200834. [crossref]
  7. Tan YP, Tan BY, Pan J, Wu J, Zeng SZ, et al. (2020) Epidemiologic and clinical characteristics of 10 children with coronavirus disease 2019 in Changsha, China. J ClinVirol 127: 104353. [crossref]
  8. Chang TH, Wu JL, Chang LY (2020) Clinical characteristics and diagnostic challenges of pediatric COVID-19: A systematic review and meta-analysis. J Formos Med Assoc 119: 982-989. [crossref]
  9. Ma X, Luan S, Zhao Y, Lv X, Zhang R (2019) Clinical characteristics and follow-up of benign convulsions with mild gastroenteritis among children. Medicine (Baltimore) 98: e14082. [crossref]
  10. Tan YP, Tan BY, Pan J, Wu J, Zeng SZ, et al. (2020) Epidemiologic and clinical characteristics of 10 children with coronavirus disease 2019 in Changsha, China. J ClinVirol 127: 104353. [crossref]
  11. Vollono C, Rollo E, Romozzi M, Frisullo G, Servidei S, et al. (2020) Focal status epilepticus as unique clinical feature of COVID-19. a case report, Seizure: European Journal of Epilepsy 78: 109-112. [crossref]
  12. Shen K, Yang Y, Wang T, Dongchi Zhao, Yi Jiang, et al. (2020) Diagnosis, treatment, and prevention of 2019 novel coronavirus infection in children: experts’ consensus statement. World J Pediatr 16: 223-231. [crossref]
fig3

An In Vitro Study for the Detection of Breast Cancer by Computed Tomography Using Targeted Gold Nanoparticles

DOI: 10.31038/NAMS.2020321

Abstract

Breast cancer is the second most commonly diagnosed type of cancer worldwide and one of the leading causes of death in women in developed countries, second only to lung cancer. Standard clinical imaging techniques such as mammography, ultrasound and MRI can readily identify anatomical patterns, tumor location and size, but they cannot distinguish between benign and malignant lesions and are not able to detect metastases smaller than 0.5 cm. We have developed a targeted gold nanoparticle (AuNP) for the CT detection of breast cancer. To enable homing to breast cancer, AuNPs are coated with 2-Deoxy-D-Glucose that facilitates their binding to the Gluocose transporter (Glut-1), a cellular transmembrane receptor linked to the progression of breast cancer. Breast cancer cells MDA-MB-231, macrophages RAW 264.7 and fibroblasts MC 3T3.E1 were scanned using a pre-clinical CT scanner after incubation with AuNPs to analyze for AuNPs uptake. Breast cancer cells showed the most intense signal for 2-DG-AuNPs (916 HU), with almost no signal registered for the bare AuNPs (22 HU) or for the control sample (19 HU). In conclusion, 2-DG-AuNPs are a feasable targeting contrast agents for breast cancer detection, ensuring high contrast enhancement and low toxicity.

Keywords

Gold nanoparticles, Computed tomography, Breast cancer detection, Contrast agents, Glut-1

Introduction

Breast cancer is the second most commonly diagnosed type of cancer worldwide and one of the leading causes of death in women in developed countries, second only to lung cancer [1,2]. Although the overall 5-year survival rate in patients with breast cancer has improved over the past decades, the disease is still a serious public health threat [3,4]. More than 3.5 million women in the United States are living with a history of breast cancer and in 2014 approximately 41,213 deaths caused by this type of cancer were registered [1,2,5].

Despite the undeniable concern posed by this disease, recent advancements in screening and treatment techniques, such as surgery, radiotherapy and adjuvant systemic therapy (endocrine therapy, chemotherapy with anthracyclines and taxanes) have brought little improvement to the life expectancy and quality of life of breast cancer patients [5]. The golden standard for breast cancer imaging is mammography [6]. Early detection and diagnosis strongly correlate with a better outcome and higher survival rates and there is evidence that mammography screening could reduce breast cancer mortality rates in several countries [6,7]. However, in women with dense breasts, the sensitivity of mammography is only 62.9% and the specificity is 89.1%, as opposed to 87% sensitivity and 96.9% specificity in women with fatty breasts. Younger women are more likely to have dense breast tissue and cancer lesions are therefore harder to diagnose with conventional mammography in this patient group [6-8]. Moreover, mammography has a sensitivity of only 55-68% for the diagnosis of locally recurrent breast cancer. This is particularly due to the post-operative benign changes that appear after Breast Conserving Surgery (BCS), such as edema, calcifications, asymmetry and skin thickening [8,9]. Another disadvantage would be the discomfort caused by the compression of the breasts and the exposure to high doses of ionized radiation [8].

Standard clinical imaging techniques such as mammography, ultrasound and MRI are classified as structural imaging modalities because although they can readily identify anatomical patterns and tumor location and size, they cannot distinguish between benign and malignant lesions and are not able to detect metastases smaller than 0.5 cm [10]. Due to these limitations, a new field of imaging has been raising interest in recent years: nanoimaging.

Nanoparticles have unique physiological, optical and magnetic characteristics which bring new possibilities to the field of imaging [11,12]. Their size usually ranges between 1-100 nm and they can have different properties depending on shape, size and surface chemistry [10,13,14]. They can be used for imaging specific receptors, vascular abnormalities and even innate immune responses [13].

Gold nanoparticles (AuNPs) are attractive nanoparticles to study as Computed Tomography (CT) contrast agents [14-16]. Computed Tomography is one of the most common imaging modalities in hospitals as a diagnostic tool, having the advantages of providing superior tissue penetration and spatial resolution [6,17,18]. CT works by visualizing differences between tissue densities, which results in clear anatomical images. However, in order to see the differences between diseased and normal tissues, specific contrast agents need to be used. Radiopaque X-ray contrast agents are usually injected intravenously and exhibit non-specific penetration and binding, as well as rapid renal excretion [19]. These limitations have determined a surge in the research of targeting agents and cellular imaging, using metal-based agents instead of the traditional iodinated ones, such as Omnipaque or Visipaque [17,18,20].

Gold has proven to be an attractive alternative to conventional contrast agents, having a higher atomic number and a higher absorption coefficient compared to iodine. Due to these properties, gold nanoparticles offer a 3-fold increase in contrast per unit weight compared to iodine-based contrast agents [18,19,21]. Moreover, imaging gold nanoparticles at 80-100 kV provides lower soft tissue absorption, as well as allowing the reduction of bone tissue interference [19]. Gold nanoparticles can be prepared in various sizes and can be selected to facilitate specific extravasation through angiogenic endothelium such as those present in the leaking vasculature of cancer cells. Safety is an obvious consideration with any contrast agent. There is extensive experience with the use of gold in the treatment of various inflammatory and infective conditions in humans such as rheumatoid arthritis.

Bare gold nanoparticles exhbit rapid renal clearance. The rapid clearance and aggregation of AuNPs can be prevented by using a coating agent such as Polyethylene Glycol (PEG) [18,19,22,23]. The coating can be done using a short-strand PEG derivative, such as PEG-SH and/or a longer one such as OPSS-PEG-SVA (orthopyridyldisulfide-polyethyleneglycol-N-hydroxysuccinimide). OPSS-PEG-SVA is being used for the covalent couple of a highly specific ligand, resulting in a targeting agent specific for one cellular group.

We have developed a biocompatible targeted radiocontrast agent based on goldnanoparticles (AuNPs) which has the advantages of offering 3-fold greater contrast per unit weight than iodine-based x-ray contrast agents. Glucose transporter (Glut) is a cellular transmembrane receptor linked to the progression of various types of cancer. It had been previously demonstrated that MDA-MB-231 and MCF-7 breast cancer cells are characterized by over-expression of Glut-1. It is also known that 2-deoxy-D-glucose (2-DG) are specific ligands for Glut-1 [24,25]. Our imaging platform consists of 2-deoxy-D-glucose covalently coupled to spherical gold nanoparticles to target Glut-1 over-expressed by breast cancer cells.

Material and Methods

Materials

Sodium citrate, gold chloride and Picrosirius Red stain (Direct Red 80, Picric acid solution and Hematoxylin Solution A according to Weigert) were purchased from Sigma-Aldrich (St. Louis, MO, USA). OPSS-PEG-SVA was purchased from Laysan Bio (Arab, AL, USA). PES membranes (3000 MWCO) were purchased from Fisher Scientific. Silver enhancement staining kit was purchased from Structure Probe, Inc. (West Chester, PA, USA). DMEM, Fibroblast Basal Media and Fibroblast Serum-Free Growth kit were purchased from ATCC (Manassas, VA, USA), Primary anti-Glut1 antibody was purchased from Fisher Scientific, Alexa Fluor 288 goat anti-rabbit IgG (H+L) was purchased from AbCam (Cambridge, MA, USA), Vectashield mounting medium with DAPI was purchased from Vector Laboratories Inc. (Burlingame, CA, USA), Phalloidin was purchased from Invitrogen (Carlsbad, CA, USA), MTT assay kit was purchased from Roche Applied Science (Indianapolis, IN, USA), 2-Deoxy-D-Glucose was purchased from VWR, D (+)-Glucosamine hydrochloride was purchased from Fisher Scientific. Highest grade V1 mica discs 12 mm were purchased from Ted Pella, Inc., (Redding, CA, USA).

Gold Nanoparticle Synthesis

AuNPs were prepared by a method involving the reduction of chloroauric acid with a sodium citrate solution. Nanopure water (500 ml) was filtered through 0.22 μm filter and boiled in a 1 L conical flask. 5 ml of Gold Chloride (10%) was added to the boiling water followed by 4 ml of 1% sodium citrate solution. The solution was boiled for about an hour or until 200 ml of solution was left. The solution has a burgundy color. Next, the AuNPs were pegylated with polyethylene glycol derivatives in order to avoid aggregation. The AuNPs were incubated for 1 hour with a 100:1 molar ratio of PEG-SH to prevent aggregation and with 50:1 OPSS-PEG-SVA for the covalent coupling of the 2-DG. After pegylation, the AuNPs were further concentrated by centrifugation at 3270 rpm for 60 min. The AuNPs collected were further concentrated using PES membrane concentrators (MWCO 10,000) to a final concentration of ~40 mg Au/ml. The AuNPs were characterized in terms of size and polydispersity by UV Spectrophotometry and Dynamic Light Scattering (Malvern Nano-ZS Zetasizer, Malvern Instruments Ltd., a Spectris Company; Worcestershire, UK). The particles were also analyzed by Atomic Force Microscopy.

2-Deoxy-D-Glucose-AuNPs Synthesis

A solution of 2-deoxy-D-glucose (2-DG) (4 mg of 2-DG in 2 mL of nanopure water) was added to 2.2 mL of AuNPs solution (6 nM) and left to stir overnight at room temperature. The unbound 2-DG was removed by centrifugation through PES membrane tubes at 3270 rpm, for 1 hour. The 2-DG-AuNPs were reconstituted with 1 mL of nanopure water.

Assessment of Glut-1 Expression in Cells

The cells were grown overnight on 8-chamber slides. They were fixed with 300 µl of 4% formalin for 10 minutes and then incubated with 500 µl of 1% BSA (10% normal goat serum, 0.3M glycine) in 0.1% PBS-Tween for 1 hour to permeabilize the cells and block non-specific protein-protein interactions. The cells were then incubated with 300 µl of antibody (ab652, 1:1000 dilution) overnight at 4ºC. Next, the cells were washed thouroughly with PBS followed by incubation with the secondary antibody, Alexa Fluor® 288 goat anti-rabbit IgG (H+L), used at a 1:1000 dilution for 1 hour at room temperature. The cells were washed with PBS and the slides mounted with DAPI-containing mounting media. Phalloidin was used for staining actin filaments. Fluorescence microscopy was used to determine the Glut-1 expression in cells.

Internalization of AuNPs in Cells

The cells were grown overnight on 8-chamber slides. 50 µl of AuNPs solution was added directly into the media and the cells were incubated for 2, 4 and 24 hours at 37°C and 5% CO2. The cells were then washed three times with warmed PBS and fixated with 300 µl of 4% formaldehyde for 20 minutes at room temperature. The cells were washed three times with PBS and then incubated with 100 µl of Hematoxylin for 15 minutes to stain the nuclei. After the cells were washed again, they were stained for Au with 100 µl of silver staining for 12 minutes. The slides were then washed and dried followed by mounting. Light microscopy was performed to determine the distribution of AuNPs retention in the cells.

Atomic Force Microscopy (AFM) Analysis

Gold nanoparticles were characterized using AFM. Freshly cleaved mica surface was treated with 10 µl of APTES (1 µM in miliQ-water) for 5 min and rinsed with 2 ml of miliQ-water (AP-mica). A drop of 10 µl of AuNPs suspension (to a concentration of 200 µg/ml) was incubated for 15 min at room temperature on functionalized mica (AP-mica) and rinsed with 60 µl of miliQ-water. Excess of liquid was absorbed and let it dry to be immediately scanned after preparation.

Atomic Force Microscopy was conducted at the UT Health – AFM Core Facility using a BioScope II™ Controller (Bruker Corporation; Santa Barbara, CA). This system is integrated to a Nikon TE2000-E inverted optical microscope (Nikon Instruments Inc.; Lewisville, TX). The image acquisition was performed with the Research NanoScope software version 7.30 and analyzed with the NanoScope Analysis software version 1.40 (copyright 2013 Bruker Corporation). High resolution images of AuNPs were obtained using RTESP cantilevers (fo=237-289 kHz, k=20-80 N/m, Bruker Corporation, Santa Barbara, CA). AuNPs size was determined using tapping mode operated in air to a scan rate of 0.5-0.6 Hz. Particle analysis was performed in 2 and 3 µm2 scans.

Computed Tomography Scans

One milliliter of cell suspension (105 cells/mL) was mixed with 1 mL of AuNPs (targeted or non-targeted) and allowed to interact for 4 hours at 37°C. PBS was used as control. Then, the solutions were centrifuged 3 times at 1000 rpm for 5 minutes, to wash out unbound AuNPs. After each centrifugation step the mixture was resuspended in PBS solution (1 mL total volume).

The cell suspensions were then analyzed with computed tomography. CT imaging was performed with a GE Ultra flat panel CT scanner (General Electric, Milwaukee, WI) with the following acquisition settings: 80kVp, 22 mA with 16 s rotation/exposure. Simple back projections were obtained for the 0.154 µm image reconstruction and exported as DICOM images. Image analysis was performed using the OsiriX software.

Results

The gold nanoparticles were synthesized by citrate reduction, using the Turkevich method. All the AuNPs preparations used in this study were analyzed using UV spectrometry, DLS, and atomic force microscopy (AFM). For all the samples, the UV absorbance peaked at 540 nm that corresponds to 60 nm particles. The AFM analysis showed a uniform preparation of AuNPs of 40-50 nm, at 2.0 µm scan zise (Figure 1). The DLS data showed a diameter of 46 nm with a polydispersity index (PDI) value of 0.451 for the bare AuNP samples. 2-DG-AuNPs had a diameter of 43 nm with a PDI value of 0.374.

Colloidal gold has been found to be unstable in a saline environment. The AuNPs were stabilized using a functionalized long chain PEG with a molecular weight of 5 kDa (OPSS-PEG-SVA) to prevent the formation of aggregates and rapid clearance in vivo. Moreover, OPSS-PEG-SVA had functional groups available for covalent bonding which allowed the conjugation via strong gold-thiolate bonds of a specific ligand (a D-glucose analogue).

Glut-1 expression was assessed using immunocytochemistry by staining Glut-1 receptors with green Alexa Fluor® 288 goat anti-rabbit IgG (H+L). Breast cancer cells MDA-MB-231 (image B, Figure 2) and macrophage cells RAW 264.7 (image A, Figure 2) showed Glut-1 receptor expression when compared to fibroblast control cells MC 3T3.E1 (image C, Figure 2). Fibroblasts did not display any Glut-1 expression.

Gold nanoparticle uptake was analyzed after incubating the cells with targeted or non-targeted AuNPs solution for four hours. The gold nanoparticles were stained with silver and appear as small black particles on the light microscopy images (Figure 3).

fig1

Figure 1:AFM amplitude image of gold nanoparticles scaned at 2 µm (X-Y) in tapping mode in air.

fig2

Figure 2:Fluorescence microscopy images of Glut-1 expression in RAW 264.7 macropages (image A), MDA-MB-231 breast cancer cells (image B) and MC 3T3.E1 fibroblasts (image C); scale bar represents 100 µm. Glut-1 expression is observed in RAW 264.7 and MDA-MB-231 breast cancer cells, but not in MC 3T3.E1 fibroblasts (green color).

fig3

Figure 3:Light microscopy images of gold nanoparticle internalization in RAW 264.7 macrophage (A-C), MC 3T3.E1 fibroblast (D-F), and MDA-MB-231 breast cancer cells (G-I) cell lines; scale bar is equal to 100 µm. 2-DG-AuNPs are taken-up by MDA-MB-231 (C) and RAW 264.7 cells (F). Very little non-specific uptake of bare AuNPs is observed in MDA-MB-231 (B) and RAW 264.7 cells (E). No uptake of bare AuNPs (H) or 2-DG-AuNPs (I) is observed in MC 3T3.E1.

Both breast cancer cells MDA-MB-231 and macrophage cells RAW 264.7 displayed AuNPs internalization as compared to fibroblast cells MC 3T3.E1 (Figure 3). Macrophages showed the most uptake of the targeted AuNPs which can be noted because of the presence of darker aggregates inside the cells (image F, Figure 3). Fibroblasts showed no difference in gold nanoparticle uptake between the AuNPs, 2-DG-AuNPs, and control (images G-I, Figure 3).

Breast cancer cells MDA-MB-231, macrophages RAW 264.7 and fibroblasts MC 3T3.E1 were scanned using a pre-clinical CT. The cells were incubated with targeted or non-targeted AuNPs for 4 hours followed by extensive washing. Breast cancer cells showed the most intense signal for 2-DG-AuNPs at 916 HU (Image C, Figure 4) with almost no signal registered for the bare AuNPs at 22 HU (Image B, Figure 4) or the control sample at 19 HU (Image A, Figure 4). No signal was visible on the scan in the control and bare AuNPs sample (Figure 4).

fig4

Figure 4:In vitro CT imaging of AuNPs internalization in MDA-MB-231 (A-C), RAW 264.7 (D-F), and MC 3T3.E1 (G-I) cells. Samples that display a higher uptake signal appear red on the CT images. The intensity of the red spots are quantified in Hounsfield Units (HU) included in each image. Approximately 40-fold higher attenuation and 5-fold higher attenuation is observed for the 2-DG-AuNPs as compared to bare AuNPs for the MDA-MB-231 cells and RAW 264.7, respectively.

For the RAW 264.7 macrophages, the 2-DG-AuNPs sample also displayed the highest radiointensity at 767 HU (Image F, Figure 4), followed by bare AuNPs at 140 HU (Image E, Figure 4). No signal was visible on the scan for the control (image D, Figure 4). Control samples registered 20 HU for fibroblast cells. The MC 3T3.E1 registered baseline values for all the samples analyzed (Images G-I, Figure 4).

Discussion

Medical imaging techniques can be divided into structural and functional imaging. Recently, functional imaging has been gaining interest over more conventional anatomical imaging. This came as a response to the need for earlier detection of malignant tissues and metastases, which were not visible through structural scans. This study proposed a novel approach to functional imaging using gold nanoparticles to target a ligand specific to mesenchymal breast cancer cells and macrophages. The imaging platform consisted of 2-deoxy-D-glucose covalently coupled to spherical gold nanoparticles to target Glut-1 over-expression in breast cancer cells. The feasibility of this platform was examined using CT imaging and histological staining.

One of the advantages of the proposed imaging technique is the use of a novel targeting agent (AuNPs) which provides superior X-ray attenuation over conventional iodine-based contrast agents. Moreover, it provides the specific targeting of cancer cells with a ligand against the Glut-1 overexpressed by breast cancer cells and macrophages. CT imaging offers excellent tissue penetration and spatial resolution as well as rapid image acquisition.

Carcinoma cells have been proven to have a higher metabolic rate as well as faster proliferation, which leads to greater demand of glucose. Such metabolic characteristics can be linked to the over-expression of certain glucose transporters, such as Glut-1 or Glut-4, on malignant cell membranes. Glut-1 has been proved to be expressed by almost all cancerous cell types [24,25]. The receptor binds and transports D-glucose within the cell, which is further metabolized into D-glucose-6-phosphate and 1,2-diphosphate [24]. D-glucose analogues can be transported by Glut-1 or Glut-4 receptors, but cannot be fully metabolized, therefore remaining inside the cells for longer periods before excretion. This property allows analogues such as 2-DG to be used as specific ligands for malignant cells. Positron emission tomography (PET) scans with radioactive Fluorodeoxyglucose (FDG) use the glucose pathway described to successfully target cancerous lesions and metastases, which are not always visible through structural imaging techniques. Targeting a metabolic mechanism instead of a cell membrane receptor is one of the most promising developments in cancer research and could eventually lead to better drug delivery systems and overcoming drug-resistance [24,25].

MDA-MB-231 is a breast cancer cell line that is known to overexpress Glucose transporter 1 (Glut-1). These types of cancer cells have a high risk of metastasis and an intermediate response to chemotherapy [25-28]. Previous studies show that RAW 264.7 cells also overexpress Glut-1 transporters and therefore exhibit increased glucose uptake and metabolism [29,30].

We were able to demonstrated Glut-1 expression by Immunocytochemistry (Figure 2) and ELISA (results not shown). Following staining with Glut-1 antibody (green), MDA-MB-231 cells showed the highest Glut-1 expression (most intense green coloration), followed by RAW 264.7. Fibroblasts MC 3T3.E1 were used as a control group and displayed no Glut-1 expression (Figure 2). A pilot study was first conducted to determine the adequate incubation time with gold nanoparticles. Cells were incubated with AuNPs for 2, 4 and 24 hours and the results were analyzed histologically. It was concluded that 2 hours did not allow sufficient gold internalization, while 24 hours allowed too much time for the clearance of the nanoparticles. Therefore the 4-hour time point was used in the following experiments.

The AuNPs internalization was first observed histologically, using a silver staining to stain the nanoparticles. Silver staining gave AuNPs a dark, almost black coloration. Therefore, when comparing MDA-MB-231 and RAW 264.7 slides to MC 3T3.E1, a darker coloration of the Glut-1 expressing cells can be noted due to small dark aggregates present inside said cells. Moreover, MDA-MB-231 and RAW 264.7 cells which were incubated with PBS confirm these results, displaying a light coloration, with no dark particles visible (Figure 3). When comparing bare AuNPs and functionalized 2-DG-AuNPs, a slight difference could be noted in MDA-MB-231 cells, which displayed higher internalization for functionalized nanoparticles (Figure 3). However, for RAW 264.7 cells, the amount of internalization for bare AuNPs and 2-DG-AuNPs was similar (Figure 3). A reason for this could be the presence of other mechanisms (independent of glucose transporters) for internalization in macrophage cells.

The 2-DG-AuNPs were then tested using a pre-clinical CT. As the cells were washed and centrifuged before scanning, the cells gathered at the bottom of the sample tubes, forming cell pellets. The radiointensity measurements were done in triplicates using values from the bottom of the sample tubes, representative for each cell group. It could be noted that 2-DG-AuNPs displayed the highest radiointensity both when measured with the OsiriX software and visually on the scans for the MDA-MB-231 cells (Images A-C, Figure 4) and RAW 264.7 cells (Images D-F, Figure 4). 2-DG-AuNPs registered values of 916 HU for MDA-MB-231 cells and 767 HU for RAW 264.7 cells. The bare AuNPs registered values of 22 HU for MDA-MB-231 cells and 140 HU for RAW 264.7 cells.The PBS controls showed baseline values of 19 HU and 25 HU, respectively. MC 3T3.E1 cells displayed baseline values 20-32 HU.The attenuation coefficient for the 2-DG targeted AuNPs was approximately 40-fold higher than that of the bare AuNPs for MDA-MB-231 breast cancer cells and 5-fold higher for RAW 264.7 cells. The bare AuNPs registered values of 22 HU for MDA-MB-231 cells and 140 HU for RAW 264.7 cells.The PBS controls showed baseline values of 19 HU and 25 HU, respectively. MC 3T3.E1 cells displayed baseline values 20-32 HU.

The attenuation coefficient for the 2-DG targeted AuNPs was approximately 40-fold higher than that of the bare AuNPs for MDAMB-231 breast cancer cells and 5-fold higher for RAW 264.7 cells.

Breast cancer cells express a high level of GLUT-1 receptors. By harnassing the increased metabolic demand and uptake, tracers such as the functionalized 2-DG-AuNPs is an attractive option to detect the cancer cells. This study was the first attempt at using gold nanoparticles functionalized with 2-deoxy-D-glucose to trace and image breast cancer and tumor-associated macrophages. Functionalized 2-DG-AuNPs proved to be a valid targeting contrast agent for cell lines MDA-MB-231 and RAW 264.7, exhibiting high radiointensity upon CT imaging. Gold internalization was verified with histological and radiological techniques and the positive results indicate a need for further research into this topic, such as testing the concept in vivo in a mouse model of breabt cancer. The targeting agent developed, 2-DG-AuNPs, promises to be a cheap and safe alternative for other types of functional imaging techniques such as nuclear imaging with radioactive fluorodeoxyglucose (FDG).

Acknowledgement

We would like to thank Dr. Xiaohong Bi for her help with the cell work. The CT imaging was conducted at the UT Health-Pre-Clinical CT Core Facility/Department of Internal Medicine using a GE Ultra flat panel CT scanner (General Electric, Milwaukee, WI). Atomic Force Microscopy was conducted at the UT Health – AFM Core Facility using a BioScope IITM Controller (Bruker Corporation; Santa Barbara, CA).

References

  1. Ferlay J, Soerjomataram I, Dikshit R, Eser S, Mathers C, et al. (2015) Cancer incidence and mortality worldwide: Sources, methods and major patterns in GLOBOCAN. International Journal of Cancer 136: 359-386. [crossref]
  2. Siegel RL, Miller KD, Jemal A (2016) Cancer statistics. CA: A Cancer Journal for Clinicians 66: 7-30.
  3. Falagan-Lotsch P, Grzincic EM, Murphy CJ (2017) New Advances in Nanotechnology-Based Diagnosis and Therapeutics for Breast Cancer: An Assessment of Active-Targeting Inorganic Nanoplatforms. Bioconjug Chem 28: 135-152. [crossref]
  4. Berry DA, Cronin KA, Plevritis SK, Fryback DG, Clarke L, et al. (2005) Effect of Screening and Adjuvant Therapy on Mortality from Breast Cancer. N Engl J Med 353: 1784-1792. [crossref]
  5. Freddie B, McCarron P, Parkin MD (2004) The changing global patterns of female breast cancer incidence and mortality. Breast Cancer Research 6: 229-239. [crossref]
  6. Jalalian A, Mashohor S, Mahmud R, Karasfi B, Iqbal Saripan M, et al. (2017) Computer-Assisted Diagnosis System for Breast Cancer in Computed Tomography Laser Mammography (CTLM). J Digit Imaging 30: 796-811. [crossref]
  7. Carney PA, Miglioretti DL, Yankaskas BC, Kerlikowske K, Rosenberg R, et al. (2003) Individual and combined effects of age, breast density, and hormone replacement therapy use on the accuracy of screening mammography. Ann Intern Med 138: 168-175. [crossref]
  8. Ponhold L, Bickel H, Pinker K, Helbich T (2012) Mammography screening and follow-up of breast cancer. Hamdan Medical Journal
  9. Kim SJ, Moon WK, Cho N, Chang JM (2011) The detection of recurrent breast cancer in patients with a history of breast cancer surgery: comparison of clinical breast examination, mammography and ultrasonography. Acta Radiol 52: 15-20. [crossref]
  10. Popovtzer R, Agrawal A, Kotov NA, Popovtzer A, Balter J, et al. (2008) Targeted gold nanoparticles enable molecular CT imaging of cancer. Nano Lett 8: 4593-4596. [crossref]
  11. Polo E, Collado M, Pelaz B, Del Pino P (2017) Advances toward More Efficient Targeted Delivery of Nanoparticles in Vivo: Understanding Interactions between Nanoparticles and Cells. ACS Nano 11: 2397-2402. [crossref]
  12. Zhang Y, Hensel M (2013) Evaluation of nanoparticles as endocytic tracers in cellular microbiology. Nanoscale 5: 9296-9309.
  13. Langer R, Weissleder R (2015) Nanotechnology. JAMA 313: 135-136.
  14. Pillai G, Ceballos-Coronel ML (2013) Science and technology of the emerging nanomedicines in cancer therapy: A primer for physicians and pharmacists. SAGE
  15. Giljohann DA, Seferos DS, Daniel WL, Massich MD, Patel PC, et al. (2010) Gold nanoparticles for biology and medicine. Angew Chem Int Ed Engl 49: 3280-3294. [crossref]
  16. Hornos Carneiro MF, F Barbosa Jr (2016) Gold nanoparticles: A critical review of therapeutic applications and toxicological aspects. J Toxicol Environ Health B Crit Rev 19: 129-148. [crossref]
  17. Chhour P, Naha PC, O’Neill SM, Litt HI, Reilly MP, et al. (2016) Labeling monocytes with gold nanoparticles to track their recruitment in atherosclerosis with computed tomography. Biomaterials 87: 93-103. [crossref]
  18. Danila D, Johnson E, Kee P (2013) CT imaging of myocardial scars with collagen-targeting gold nanoparticles. Nanomedicine 9: 1067-1076. [crossref]
  19. Leung K (2004) Polyethylene glycol-gold nanoparticles. Molecular Imaging and Contrast Agent Database (MICAD) Bethesda (MD).
  20. Reuveni T, Motiei M, Romman Z, Popovtzer A, Popovtzer R (2011) Targeted gold nanoparticles enable molecular CT imaging of cancer: an in vivo study. Int J Nanomedicine 6: 2859-2864.
  21. Connor EE, Mwamuka J, Gole A, Murphy CJ, Wyatt MD (2005) Gold nanoparticles are taken up by human cells but do not cause acute cytotoxicity. Small 1: 325-327. [crossref]
  22. Otsuka H, Nagasaki Y, Kataoka K (2003) PEGylated nanoparticles for biological and pharmaceutical applications. Adv Drug Deliv Rev 55: 403-419. [crossref]
  23. Cai QY, Kim SH, Choi KS, Kim SY, Byun SJ, et al. (2007) Colloidal gold nanoparticles as a blood-pool contrast agent for X-ray computed tomography in mice. Invest Radiol 42: 797-806. [crossref]
  24. Shan XH, Hu H, Xiong F, Gu N, Geng XD, et al. (2012) Targeting Glut1-overexpressing MDA-MB-231 cells with 2-deoxy-D-g1ucose modified SPIOs. Eur J Radiol 81: 95-99.
  25. Venturelli L, Nappini S, Bulfoni M, Gianfranceschi G, Dal Zilio S, et al. (2016) Glucose is a key driver for GLUT1-mediated nanoparticles internalization in breast cancer cells. Sci Rep 6: 21629. [crossref]
  26. Holliday DL, Speirs V (2011) Choosing the right cell line for breast cancer research. Breast Cancer Res 13: 215. [crossref]
  27. Su S, Liu Q, Chen J, Chen J, Chen F, et al. (2014) A positive feedback loop between mesenchymal-like cancer cells and macrophages is essential to breast cancer metastasis. Cancer Cell 25: 605-620. [crossref]
  28. Shroff K, Kokkoli E (2012) PEGylated liposomal doxorubicin targeted to alpha5beta1-expressing MDA-MB-231 breast cancer cells. Langmuir 28: 4729-4736. [crossref]
  29. Green CE, Liu T, Montel V, Hsiao G, Lester RD, et al. (2009) Chemoattractant signaling between tumor cells and macrophages regulates cancer cell migration, metastasis and neovascularization. PLoS One 4: 6713. [crossref]
  30. Freemerman AJ, Johnson AR, Sacks GN, Milner JJ, Kirk EL, et al. (2014) Metabolic reprogramming of macrophages: glucose transporter 1 (GLUT1)-mediated glucose metabolism drives a proinflammatory phenotype. J Biol Chem 289: 7884-7896. [crossref]
IJNUS-2-1-202-g002

The Profile of Clinically Diagnosed New Type 2 Diabetes among Asian Indians

DOI: 10.31038/EDMJ.2020434

Abstract

Aim: To study the clinical and metabolic characteristics of newly diagnosed type 2 diabetes (T2DM) in urban clinics (CDD) and also to compare with the screen detected new diabetes cases (SDD) during an urban population survey.

Methods: Newly diagnosed T2DM (aged 20-60 years, n=741), based on blood glucose and Glycosylated haemoglobin (HbA1c) of ≥6.5% (48 mmol/mol) were selected. Demography, anthropometry, blood pressure, glycaemic and lipids profiles were analysed. Relevant statistical tests were used for group comparisons.

Results: Both groups had young age (45.0 ± 8.6 years) at diagnosis. Fasting blood glucose (p<0.05) and HbA1c (p<0.0001) were higher in CDD. Mean values of HbA1c were 9.1 ± 2.3% (76 ± 20 mmol/mol) in CDD and 8.3 ± 2.4% (67 ± 19 mmol/mol) in SDD (p<0.0001). Values  of HbA1c were higher   than ≥9.0% (75 mmol/mol) in 44.6% of CDD versus 26.4% of SDD (z=4.60, p<0.0001). SDD had higher body mass index (p<0.0001), abdominal obesity (p<0.005), hypertension (p<0.0001), cholesterol (p<0.005) and low density lipoprotein cholesterol (p<0.05) than CDD.

Conclusion: Both groups had young age at diagnosis. CDD had more severe glycaemia than SDD, probably suggesting that the clinic visits were delayed and therefore had longer period of undiagnosed diabetes. In comparison to CDD, SDD had higher metabolic abnormalities although the HbA1c values were lower.

Keywords

Newly diagnosed type 2 diabetes, South Asians, Clinical characteristics, HbA1c, Metabolic abnormalities

Introduction

Many developing countries show a rising trend in the prevalence and also in the incidence of type 2 diabetes T2DM [1-3]. Recently, a systematic review of studies on trends in the incidence of T2DM among adults in developed countries has shown that between 2006 and 2014, 27% of the reported populations had a stable incidence over time, while 36% reported a declining trend and 36% reported an increasing trend in the incidence of T2DM [4]. The declining trend in the incidence has been shown mostly in the developed countries. A huge clinical burden of newly diagnosed T2DM is present in developing countries. There is only limited real-world data describing the clinical characteristics of such patients [5].

The prevalence of diabetes is increasing rapidly in India, which is estimated to be 77 million adults in 2019 [1]. A recent epidemiological study done in urban India showed that, the prevalence and incidence of diabetes have increased significantly in all areas, including the Peri Urban Villages (PUV) of Tamil Nadu [2]. Using the data from the two studies conducted in 2006 [6] and 2016 [2] to estimate the incidence of diabetes, it was noted that, a sharper increase in the incidence occurred in the urban areas when compared with the villages [2]. A similar observation was made in the INdia DIABetes (INDIAB) study conducted in 15 states of India [7] as well as in a cohort study of 10 years follow-up in the urban area in southern India [8].

Several peculiar features are seen among the newly diagnosed South Asian populations with T2DM such as, younger age at onset, delayed clinical diagnosis due to lack of public awareness regarding the disease, reluctance to undergo periodic medical check-up and a long asymptomatic phase of T2DM [3,9]. The diagnosis of diabetes is often delayed, more so in the developing societies. Previous studies have described the characteristics of patients attending the clinics, who are under treatment [3,6,8]. There is sparse data on the profile of clinically diagnosed new T2DM patients in India.

The aim of this project was to study the clinical and metabolic characteristics of newly diagnosed adult T2DM patients from different clinics (CDD). We compared the profile with that of new T2DM identified during an epidemiological screening of urban population (SDD) [2].

Methods and Materials

Study Subjects

This is a study of newly diagnosed adult T2DM from 12 different centres located in four southern states of India. Patients with a previous history of diabetes or had taken anti-diabetes treatment were excluded from the study by the clinicians. Persons with prediabetes were also excluded. Details of men and women in the selected age group, who were treatment naïve were collected and analysed. For comparison, a group of newly detected T2DM subjects from an epidemiological survey of the urban population was taken.

All participants reported on fasting on the day of testing. In the clinics, the diagnosis of diabetes was based on blood glucose (fasting blood glucose ≥7.0 mmol/l and/2 hour Post Prandial Glucose (PPG)≥11.1 mmol/l) [10]. In the epidemiological study, diagnosis was made based on fasting and 2 h Post Blood Glucose (PBG) values. The 2 hour PBG was measured after giving 75 g of glucose load. We selected only patients who had an HbA1c value of ≥6.5% (48 mmol/mol) [11]. The total number of subjects analysed was 741, comprising of 514 from CDD and 227 from SDD; Identifier: NCT03490136 [2].

All centres followed uniform and standardised procedures for metabolic and clinical assessments. The study details and methodology were discussed in a meeting of the investigators, participating physicians and the researchers prior to the commencement of the study.

The Ethics Committee of the India Diabetes Research Foundation and Dr. A. Ramachandran’s Diabetes Hospitals approved the study. A written informed consent was obtained from all participants prior to the enrollment, at all centres. It was also agreed that the identity of the participants would not be disclosed. All study procedures were carried out in accordance to the ethical guidelines.

Clinical Assessments

Age, sex and presence of family history of diabetes were collected. Height was measured to the nearest centimeter using a stadiometer with the patient standing erect. Weight was measured to the nearest 0.1 kg using a digital weighing scale. Body mass index (BMI) was calculated as weight in kilograms divided by the square of height in meters. Generalized obesity was defined as BMI ≥23.0 kg/m2., BMI between ≥23.0 and 24.9 kg/m2 was considered overweight, and BMI≥25.0 kg/m2 was defined as obese. Waist circumference (WC), the smallest girth between the coastal margin and the iliac crest, was measured. Abdominal obesity was indicated by WC of ≥90 cm for men and ≥80 cm for women. Blood pressure was measured in the sitting position using the electronic measuring device (Omron HEM 7132; Omron, Tokyo, Japan). An average of two readings taken at 5-minutes’ interval was recorded. Persons with a history of hypertension and those with newly diagnosed diabetes with blood pressure readings ≥140/90 mmHg were categorized as hypertensive. All the clinical and metabolic details were recorded in a standardised questionnaire.

Biochemical Assessments

Glucose was measured in the respective study centres by the glucose oxidase method. Other biochemical parameters such as HbA1c and lipid profile were estimated at the central laboratory (Dr. A. Ramachandran’s Diabetes Hospitals, Chennai). Glycosylated haemoglobin (HbA1c) was measured by immunoturbidimetry (TINA-QUANT II; Roche Diagnostics Corporation, Germany); a procedure certified by the National Glycohemoglobin Standardization Program. Fasting serum lipid profile was estimated by standard enzymatic procedures using the reagents of Roche Diagnostics, Germany. HDLc was estimated by the direct assay. Samples were shipped to the central laboratory between 2° and 8°C on the same day of collection.

Statistical Analyses

Data are presented as mean ± standard deviation (SD) for continuous variables with a normal distribution, as median with interquartile range for skewed continuous variables and as number and frequency (%) for categorical variables. Independent samples t test, chi-square or Z – test were used to assess group differences for continuous variables and categorical variables respectively. Mann Whitney U test was used for skewed variables. A p value of <0.05 was considered statistically significant. Statistical analyses were performed using SPSS version 21.0.

Results

Table 1 shows the demographic and anthropometric characteristics of the two groups with newly diagnosed T2DM. CDD had higher percentage of men than SDD (p<0.05). Both groups had similar mean age at diagnosis (45.2 ± 8 years). The mean BMI was higher in SDD (p<0.0001). Prevalence of overweight and obesity were similar in both the groups. Women in SDD had higher WC (p<0.005) and the percentage of abdominal obesity (≥80 cm) was also higher in SDD (p<0.05). SDD had higher mean diastolic blood pressure (p<0.0001) and higher percentage of hypertension (p<0.005).

Table 1: Demographic and anthropometric characteristics of the study groups with newly diagnosed type 2 diabetes.


Clinically diagnosed
(n=514)
(CDD)

Diagnosed during screening
(n=227)
(SDD)

Men (n, %)

313 (60.9)*

117 (51.5)

Positive family history of DM (n, %)

175 (34.0)

92 (40.5)

Age (yrs)

45.2 ± 8.6

45.0 ± 8.6

BMI (kg/m2)

25.3 ± 3.7

27.3 ± 4.6$

Nonobese ≤ 22.9 (n, %)

101 (19.6)

39 (17.2)

Overweight & Obese ≥ 23.0 (n, %)

413 (80.4)

188 (82.8)

Waist Circumference (cm)

Men (cm)

91.9 ± 8.9

93.0 ± 9.8

Women (cm)

88.7 ± 10.6

91.8 ± 10.8#

Men ≥ 90 (n, %)

195 (37.9)

73 (32.2)

Women ≥ 80 (n, %)

164 (31.9)

94 (41.4)*

Blood Pressure

Systolic Blood Pressure (mm Hg)

128 ± 13

127 ± 18

Diastolic Blood Pressure (mm Hg)

81 ± 9

86 ± 11$

BP > 140/90 mm Hg (n, %)

54 (10.5)

44 (19.4)#

Data are presented as mean ± SD for continuous variables with normal distribution and as frequency (%) for categorical variables. Independent samples t test and chi-square test or Z test were used to test inter group differences for continuous variables and categorical variables.
CDD vs.SDD=*p< 0.05; #p< 0.005; $p< 0.0001.
CDD, Clinically Diagnosed Diabetes; SDD, Screen Detected Diabetes; BMI, Body Mass Index; BP, Blood Pressure.

Table 2 shows the metabolic profile of the study groups. SDD had lower FBG (p<0.05) and HbA1c (p<0.0001) when compared with CDD. Among the total cohort of 741, 445 (60.1%) had HbA1c values
≥8.0% (64 mmol/mol), of which 289 (39.0%) had values ≥9.0% (75 mmol/mol).

Table 2 Metabolic profile of the study groups with newly diagnosed type 2 diabetes.


Clinically diagnosed
(n=514)
(CDD)

Diagnosed during screening
(n=227)
(SDD)

Glycemic Parameters

Fasting blood glucose (mmol/l)

9.8 ± 3.3*

9.3 ± 3.2

2 hour post blood glucose (mmol/l)

15.4 ± 4.4

15.3 ± 4.2

HbA1c % (mmol/mol)

 9.1 ± 2.3 (76.1± 19.8)$

8.3 ± 2.4 (66.8 ± 19.0)

HbA1c ≥ 8.0% (64mmol/mol) (n,%)

349 (67.9)$

96 (42.3)

HbA1c ≥ 9.0% (75mmol/mol) (n,%)

229 (44.6)$

60 (26.4)

Lipid Profile (n)

 243

222

Triglyceride (mmol/l)

1.8 (1.3 – 2.7)

1.8 (1.3 – 2.8)

Total Cholesterol (mmol/l)

4.8 ± 1.0

5.1 ± 1.1#

LDLc (mmol/l)

3.4 ± 0.9

3.6 ± 1.0*

HDLc (mmol/l)

1.0 ± 0.3

1.0 ± 0.2

Data are presented as mean ± SD for continuous variables with a normal distribution, as median with interquartile range for skewedcontinuous variables and as frequency (%) for categorical variables. Independent samples t test and chi-square test or Z testwere usedto test intergroup differences for continuous variables and categorical variables. Mann Whitney U test was used for skewed variables.
CDD vs.SDD=*p<0.05; #p<0.005; $p<0.0001
CDD: Clinically Diagnosed Diabetes; SDD: Screen Detected Diabetes; HbA1c: Glycosylated hemoglobin; LDLc: Low Density Lipoprotein Cholesterol; HDLc:HighDensity Lipoprotein Cholesterol.

It was observed that a larger proportion of CDD (67.9%) had values of ≥8.0% (64 mmol/mol) versus 42.3% of SDD (z=6.47, p<0.0001). HbA1c values ≥9.0% (75 mmol/mol) were present in 44.6% in CDD versus 26.4% in SDD (z=4.60, p<0.0001). Among the lipid variables, total cholesterol (p<0.005) and Low Density Lipoprotein cholesterol (LDLc) (p<0.05) were higher in SDD.

Discussion

There have been many reports highlighting the differences in the clinical profile of diabetes between South Asians and the western populations [12,13]. But, there is sparse data on the clinical and metabolic characteristics of newly diagnosed T2DM from India. In this communication we report the clinical and metabolic characteristics of newly diagnosed diabetes patients recruited from different centres in southern India (CDD). The group represents the urban population with diabetes. We compared its clinical profile with a group of undiagnosed diabetes detected during an urban epidemiological survey (SDD).

In our study, the mean age of the newly diagnosed T2DM in both the groups was similar (45.2 ± 8.6 and 45.0 ± 8.6 years in CDD and SDD respectively). Another large, multicentre, cross-sectional study among diabetes patients in India also showed that the mean age at onset of T2DM was 45.4 ± 10.9 years which was similar to the observation made in our study [14]. This was significantly lower than that reported among the newly diagnosed T2DM cases in the United States (55.6 ± 13 years) [5]. Similarly, in two large multi-ethnic studies from UK [15,16], the age at diagnosis of T2DM was found to be lower (51.5 ± 10.42 and 52.6 ± 13.5 years respectively) in the South Asian population when compared to the White population (58.9 ± 10.09 and 63.3 ± 13.8 years respectively). South Asians develop T2DM at least a decade earlier.

Lower BMI with higher HbA1c in the CDD compared to SDD could possibly be due to a reduction in weight usually associated with moderate to high levels of undetected hyperglycaemia. In an earlier study, we had observed that more than 20% of the cases had weight loss prior to the clinical diagnosis of T2DM [17]. Among the Asian populations, Indians have a reluctance to undergo regular health check-up and medical consultation is often sought only when the symptoms or related problems arise due to diabetes [9]. Similar observation had been reported earlier in migrant Asian populations in western countries [15,18]. In the UK, a multiethnic South London study mentioned above showed that HbA1c levels were higher in South Asians than in the Europeans at an early period after the diagnosis. This was partially attributed to a delayed diagnosis in the Asians [15]. In our study, the significantly higher FBG and HbA1c observed in CDD could be related to a delay in the diagnosis of diabetes when compared with those diagnosed during an epidemiological screening. There is a higher likelihood of a few CDD patients having taken treatment for hypertension and hyperlipidaemia prior to visiting a diabetes clinic.

In our study, 44.6% of the patients had significantly higher HbA1c ≥9.0% (75 mmol/mol) when compared with 21.7% of the newly diagnosed patients in the clinics in USA [5]. There may be a number of reasons for high HbA1c in newly detected diabetes. One important reason could be longer periods of undetected T2DM in our population, partially due to the delay on the part of the patients to seek medical help. In India, a larger percentage of men report for medical consultation than women. Therefore, the proportion of men was more among the clinically diagnosed cases.

In an earlier study, we had noted that T2DM remains asymptomatic for a longer period of time and many develop complications such as retinopathy even before diagnosis [19]. We did not record the presence of symptoms or complications in this study.

Hypercholestremia seen among the newly diagnosed patients may also be related to the delayed diagnosis of diabetes and higher blood glucose levels. In SDD, screening for diabetes was done among adults with neither a previous history nor the presence of symptoms of diabetes. There is a higher chance of early detection of diabetes among this group than in the clinic diagnosed cases. The likelihood of early detection of hypertension is also higher when screening is done.

Our study describes the clinical and metabolic features of newly diagnosed T2DM in the clinics. The differences with the screen detected diabetes in the population probably indicate late diagnosis in the clinics.

Declarations

Funding

The study was funded by India Diabetes Research Foundation, Chennai.

Conflict of interest

None

Ethics approval

The study was approved by the Ethics Committee of the India Diabetes Research Foundation and Dr. A. Ramachandran’s Diabetes Hospitals.

Consent to participate

A written informed consent was obtained from all participants prior to the enrollment in the respective studies.

Authors’ contributions

Arun R, AR, CS, AN and RV contributed to the study design, developed the protocol, supervised the study, drafted the manuscript and revised it with critical input. AR, CS, Arun R, PS and KS contributed to data preparation and analyses. KS and PS participated and coordinated the field work and data collection. All authors have read and approved the final draft of the manuscript.

Acknowledgements

The authors acknowledge the support rendered by the study physicians of various hospitals for providing the data source of the clinic patients. The help rendered by Mr.M.Karthikeyan and the epidemiology team of the India Diabetes Research Foundation in coordinating the epidemiological screening is greatly acknowledged. We are grateful to all the participants of the study for their co- operation and support.

Abbreviation

BMI: Body Mass Index

CDD: Clinically Diagnosed Diabetes

FBG: Fasting Blood Glucose

HbA1c: Glycosylated Haemoglobin

PBG: Post Blood Glucose

PPG: Post Prandial Blood Glucose

SDD: Screen Detected Diabetes

T2DM: Type 2 Diabetes

WC: Waist Circumference

References

  1. International Diabetes Federation.IDF Diabetes Atlas, 9thedn. Brussels, Belgium: 2019. Available at: http: //www.diabetesatlas.org. Last accessed on 11th March 2020.
  2. Ramachandran A, Snehalatha C, Shaw JE, Susairaj P, et al. (2019)Response to Comment on Nanditha et al. Secular TRends in DiabEtes in India (STRiDE-I): Change in Prevalence in 10 YearsAmong Urban and Rural Populations in Tamil Nadu. Diabetes Care42: 476-485.[crossref]
  3. Misra A, Ramchandran A, Jayawardena R, Shrivastava U, et al. (2014)Diabetes in South Asians. Diabet Med31: 1153-62.[crossref]
  4. Magliano DJ, Islam RM, Barr ELM, Gregg EW, et al. (2019)Trends in incidence of total or type 2 diabetes: systematic review. BMJ 366: l5003. [crossref]
  5. Pantalone KM, Hobbs TM, Wells BJ, Kong SX, et al. (2016)Changes in characteristics and treatment patterns of patients with newly diagnosed type 2 diabetes in a large united states integrated health system between 2008 and 2013. Clin Med Insights Endocrinol Diabetes9: 23-30. [crossref]
  6. Ramachandran A, Mary S, Yamuna A, Murugesan N, et al. (2008)High prevalence of diabetes and cardiovascular risk factors associated with urbanization in India. Diabetes Care 31: 893-898.[crossref]
  7. Anjana RM, Deepa M, Pradeepa R, Mahanta J, et al. (2017)ICMR-INDIAB Collaborative Study Group. Prevalence of diabetes and prediabetes in 15 states of India: results from the ICMR-INDIAB population-based cross-sectional study. Lancet Diabetes Endocrinol 5(8): 585-596.[crossref]
  8. Anjana RM, Shanthi Rani CS, Deepa M, Pradeepa R, et al. (2015)Incidence of Diabetes and Prediabetes and Predictors of Progression Among Asian Indians: 10-Year Follow-up of the Chennai Urban Rural Epidemiology Study (CURES). Diabetes Care38(8): 1441-8.[crossref]
  9. Mohan V (2019)Expanding the concept of ‘Clinical Inertia’ in diabetes. J Diabetol 10: 1-3.
  10. World Health Organization. Definition and diagnosis of diabetes mellitus and intermediate hyperglycaemia: report of a WHO/IDF consultation. Geneva: World Health Organization 2006; 1-50.[crossref]
  11. Use of glycatedhaemoglobin (HbA1c) in the diagnosis of diabetes mellitus. Diabetes Res Clin Pract.93: 299-309.[crossref]
  12. Nanditha A, Ma RC, Ramachandran A, Snehalatha C, et al. (2016)Diabetes in Asia and the Pacific: Implications for the Global Epidemic. Diabetes Care39: 472-85.[crossref]
  13. Mathur R, Palla L, Farmer RE, Chaturvedi N, et al. (2020)Ethnic differences in the severity and clinical management of type 2 diabetes at time of diagnosis: A cohort study in the UK Clinical Practice Research Datalink. Diabetes Res Clin Pract160: 108006.[crossref]
  14. Mohan V, Shah SN, Joshi SR, Seshiah V, et al. (2014)DiabCare India 2011 Study Group. Current status of management, control, complications and psychosocial aspects of patients with diabetes in India: Results from the DiabCare India 2011 Study. Indian J EndocrinolMetab 18: 370-8.[crossref]
  15. Winkley K, Thomas SM, Sivaprasad S, Chamley M, et al. (2013)The clinical characteristics at diagnosis of type 2 diabetes in a multi-ethnic population: the South London Diabetes cohort (SOUL-D). Diabetologia56: 1272-81.[crossref]
  16. Wright AK, Welsh P, Gill J, Kontopantelis E,et al. (2020)Age-, sex- and ethnicity-related differences in body weight, blood pressure, HbA1c and lipid levels at the diagnosis of type 2 diabetes relative to people without diabetes. Diabetologia 63: 1542-1553.[crossref]
  17. Ramachandran A, Snehalatha C, Vijay V, Viswanathan M (1994)Underestimation of obesity in newly diagnosed non – insulin dependent diabetes subjects: A study from South India. Diabetes, Nutrition & Metabolism V7 (4): 251-55.[crossref]
  18. Sattar N, Gill JM (2015)Type 2 diabetes in migrant south Asians: mechanisms, mitigation, and management. Lancet Diabetes Endocrinol 3: 1004-16.[crossref]
  19. Ramachandran A, Snehalatha C, Vijay V, Viswanathan M (1996)Diabetic retinopathy at the time of diagnosis of NIDDM in south Indian subjects. Diabetes Res Clin Pract 32(1-2): 111-4.[crossref]