Archives

Improved Piglet Performance and Reduced Antibiotic Use Following Oral Vaccination with a Live Avirulent Escherichia Coli F4 Vaccine against Post-Weaning Diarrhea

DOI: 10.31038/JCRM.2020321

Abstract

Background: Post-weaning diarrhea (PWD) in pigs is a worldwide economically important disease, which is frequently controlled using antibiotics. However, emergence of antimicrobial resistance in E. coli strains urges the need for alternative control measures, such as adapted feeding strategies, pre- and probiotics, organic acids, MCFAs or immunization. Different alternative control strategies such as active immunization of piglets against PWD with an E. coli F4 vaccine combined with different feeding strategies, addition of nutraceuticals (medium chain fatty acids (MCFAs), organic acids and additional fibers) or supplementation of ZnO were evaluated for their efficacy against PWD due to F4 enterotoxigenic Escherichia coli (F4-ETEC) under field conditions.

Results: ZnO-supplemented piglets had a lower overall end weight and lower average daily weight gain, as compared to E. coli vaccinated piglets   or piglets fed a diet with additional nutraceuticals. Piglets fed a ZnO-supplemented diet had optimal fecal and general clinical scores and the lowest number of individual antibiotic treatments. All E. coli vaccinated groups had intermediate clinical scores and a relatively low number of antibiotic treatments. However, clinical scores were much higher in the nutraceutical group, indicating more severe clinical diarrhea, which needed additional antibiotic intervention. Mortality was also significantly increased in the nutraceutical-supplemented group. The present study demonstrated the efficacy of an oral live non-pathogenic E. coli F4 vaccine (Coliprotec® F4; Elanco) for active immunization of piglets against PWD due to F4-ETEC under field conditions. Different feeding strategies (1-, 2-, and 3-phase feeding) had no significant effect on the clinical outcome and performance parameters of E. coli vaccinated piglets.

Conclusions: In many parameters, E. coli vaccination performed equal compared to the ZnO-supplemented group. In contrast, the alternative control strategy combining MCFAs, organic acids and additional fibers resulted in significant clinical diarrhea and mortality, requiring additional  antibiotic treatment to control, although many other performance parameters were very similar to E. coli vaccination or ZnO supplementation. Therefore, E. coli vaccination could be one of the future preventive options to protect piglets against PWD due to pathogenic E. coli.

Keywords

F4-ETEC, PWD, E. coli F4 vaccine, performance, antibiotic reduction

Introduction

Post-weaning diarrhea (PWD) in pigs is a worldwide economically important disease [1], characterized by increased mortality, weight loss, retarded growth, increased treatment costs, higher use of antibiotics and batch variation [2-8]. Enterotoxigenic E. coli (ETEC) is regarded the most important cause of PWD. The ETEC pathotype is typically characterized by the presence of fimbrial adhesins, which mediate attachment to porcine intestinal enterocytes, and enterotoxins, which disrupt fluid homeostasis in the small intestine.

This results in mild to severe diarrhea within a few days post-weaning, associated with clinical signs of dehydration, loss of body condition (= disappearance of muscle volume) and mortality [9]. The adhesive fimbriae most commonly occurring in ETEC from pigs with PWD are F4 (K88) and F18 [9]. Other fimbriae such as F5 (K99), F6 (987P) and F41 rarely occur in E. coli isolates from PWD [9-13]. The main enterotoxins associated with porcine ETEC are heat-labile toxin (LT), heat-stable toxin a (STa) and heat-stable toxin b (STb). In some cases, both enterotoxins and a Shiga toxin (Stx2e) are produced by the pathogenic stains [9].

The disease is currently controlled using antimicrobials, although the emergence of antimicrobial resistance in E. coli strains isolated from cases of PWD urges the need for alternative control measures [14-18].

Several alternative strategies have been explored to increase intestinal health and decrease incidence of PWD due to E. coli in post- weaned piglets [19-21]. Overall, inclusion of additional dietary fiber and reduction of crude protein levels in post-weaning diets seemed to be an effective nutritional strategy that may counteract the negative effects of protein fermentation in the pig gut [20, 22-24]. Although specific fermentable carbohydrates combined with reduced crude protein content altered  the  microflora  and  fermentation  patterns  in the gastro-intestinal tract of post-weaned piglets, these favorable effects did not necessarily result in increased growth performance [25]. Other feeding strategies were more focused on feed consistency, thereby feeding more coarsely ground meal to the post-weaned piglets [26]. Coarsely ground feed meals change the physico-chemical conditions in the stomach, thereby increasing concentrations of organic acids which lower the pH. This promoted growth of anaerobic lactic acid bacteria and reduces survival of E. coli during passage through the stomach [26]. Fermentation of undigested dietary protein and endogenous proteins in the large intestines yield putative toxic metabolites that can impair epithelial integrity and promote enteric disorders such as PWD [27]. Incidence and severity of PWD may also be influenced by addition of probiotics to the diet, which may change the fermentation profile and thus promote gut health [28]. Furthermore, medium chain fatty acids (MCFAs) can neutralize bacterial metabolites in the small intestine [29].

From the late 1980’s onwards, several studies on zinc supply to post-weaned piglets have been performed. Several nutritional studies demonstrated the effects of dietary zinc oxide (ZnO) in the prevention and healing of PWD [30]. Therefore, ZnO has been admitted in the prevention and control of PWD at levels up to 3,000 parts per million (ppm) through the feed for a maximum of 14 days post-weaning. However, Committee for Veterinary Medicinal Products (CVMP) has recently decided that the use of ZnO in post-weaning diets should be phased out the latest by 2022 throughout the EU [31].

Therefore, other preventive strategies have recently been explored [1,32]. For an E. coli vaccination against PWD due to F4- and F18- ETEC, the prerequisite is that active mucosal immunity against F4 and F18 is mounted. This implies the local production of F4- and/or F18- specific sIgA antibodies, which prevent pathogenic F4- and F18-ETEC to attach to the intestinal F4- and F18-receptors and thus reduce clinical signs of PWD [32]. Recently, vaccination with a live non-pathogenic E. coli F4 or E. coli F4 and F18 vaccine has demonstrated efficacy against PWD due to F4-ETEC and F4- and F18-ETEC [33,34]. Immunization against the F4- and F18-ETEC pathogens resulted in decreased severity and duration of PWD clinical signs and fecal shedding of F4- and F18- ETEC [33,34]. Moreover, increased weight gain was demonstrated in piglets vaccinated with E. coli F4 vaccine [33].

Here, we report results demonstrating the efficacy of an oral live non-pathogenic E. coli F4 vaccine (Coliprotec®  F4; Elanco; Greenfield, IN) for active immunization of piglets against PWD caused by F4-ETEC with different feeding strategies under field conditions. We also included a group using the current approach of 3,000 ppm ZnO during 14 days post-weaning and a group with addition of a nutraceutical concept containing MCFAs, organic acids and additional fibers.

Materials and Methods

Experimental farm description

The field trial was performed on a conventional farrow-to-finish pig farm with 600 DanBred sows in Flanders (Belgium). The farm was managed in a 4-week batch-management system (with alternately weaning) with 120 sows per production batch. This management approach has been shown to improve the health status for several respiratory pathogens [35]. Piglets were weaned at 23 days of age and housed in specifically equipped post-weaning facilities, where they were raised for 7 weeks (50 days post-weaning). The post-weaning facility was equipped with 40 pens, which could each house 16 post- weaned piglets. Dry feeders with two waterers, one on each side, were located at the pen division, thus feeding two pens with a total of 32 piglets. The pens were further equipped with fully slatted plastic floors and were heated with hot water tubes on the side walls near the air inlet. Ventilation was performed through 3 ventilation tubes and fresh air entered into the compartment directly from the outside.

ETEC diagnosis and characterization at experimental farm

The farm was selected following ETEC diagnostics during the post-weaning period. Therefore, untreated piglets (n = 10) with typical clinical signs of PWD, such as watery feces, thin belly and signs of dehydration, were sampled using rectal swabs (Sterile Transport Swab Amies with Charcoal medium; Copan Italia S.p.A., Brescia, Italy). All sampled piglets were between 3 and 5 days post-weaning. The diagnostic samples were sent to the laboratory (IZSLER, Brescia, Italy) under cooled conditions for further processing.

Specimen were processed using standard procedures for isolation and characterization of intestinal E. coli  [18].  Briefly,  samples  were plated on selective media and on tryptose soy agar medium supplemented with 5% of defibrinated ovine blood and incubated aerobically overnight at 37°C. Haemolytic activity was evaluated and single coliform colonies were further characterized.

DNA samples were prepared from one up to five haemolytic and/ or non-haemolytic E. coli colonies and used to perform a multiplex PCR for the detection of fimbrial and toxin genes, including those encoding for F4 (K88), F5 (K99), F6 (987P), F18, F41, LT, STa, STb
and Stx2e, but not discriminating between F4ab, F4ac and F4ad. The methodology used for the identification of these virulence genes has been described previously [36]. All collected samples were positive for F4 in combination with STa, STb and LT. No other virulence factors could be detected.

Vaccination with a live non-pathogenic E. coli F4 vaccine

In order to vaccinate piglets at least 7 days before the clinical signs to mount sufficient protective local immunity in the gut [33], piglets were vaccinated at 18 days of age (5 days prior to weaning), during the suckling period. The live non-pathogenic E. coli F4 vaccine has a rapid onset of immunity (7 days) and a duration of immunity of 21 days post-vaccination, which covers the most critical period of PWD [1]. An efficacy trial using an experimental E. coli F4 challenge at 3 days post-vaccination showed reduction of the severity and duration of PWD and reduction in fecal shedding of pathogenic F4-ETEC [33].  Sows  were  randomly  assigned  to  treatment  (Coliprotec®  F4; Elanco, Greenfield, IN) or control group based on their parity and sow number. Parities were equally distributed to both treatment groups. Piglets from sows assigned to the treatment group were vaccinated orally through drenching with 2 ml of a live non-pathogenic E. coli F4 vaccine (Coliprotec® F4; Elanco, Greenfield, IN). Piglets from sows in the control group were not treated nor vaccinated. No antibiotics were administered to piglets from 15 days of age onwards, in order to omit interference with development of protective local immunity by the E. coli F4 vaccine during the 7 days following vaccination.

Experimental design

At weaning, E. coli vaccinated piglets were randomly assigned  to three groups with a different feeding strategy. The unvaccinated control piglets were randomly assigned to two groups with different preventive measures supplemented to the feed against PWD due to E.  coli. Each treatment group consisted of 128 piglets divided over  8 pens with 16 piglets each. Sexes were distributed equally within and between different treatment groups. The treatment groups were randomly allocated to the different pens within the compartment in order to evenly distribute all treatments for potential interaction with specific climatic subzones within the compartment (outer walls, air inlet, central part). Details on the experimental design in relation to feeding strategies and preventive measures are given in Table 1. Piglets were weighed per pen (n = 16 piglets) at three different time-points: d0 (start), d21 (mid-term) and d50 (end). Average piglets weights were calculated based on pen weight and number of piglets present at the moment of weighing. Piglet treatment identification was blinded to both farmer and veterinarian involved in trial follow-up by letter codes (A, B, C, D, and E).

Table 1. Schematic description of experimental trial set-up including treatment groups and their short comprehensive description and the respective differences in feeding strategies (weaning starter, starter and grow starter; blocks in the same colour have identical compositions), addition of ZnO (3,000 ppm), supplementary nutraceuticals (MCFAs, organic acids and additional fibers) and vaccination with a live non-pathogenic E. coli F4 vaccine.

Treatment groups
A B C D E

Treatment description

1-phase / vaccine 2-phase / vaccine 3-phase / vaccine 3-phase / nutriceutical 3-phase + ZnO

Weaning starter

2 kg 5 kg 5 kg 5 kg

Starter

8 kg 8 kg 8 kg

Grow starter

ZnO (14d)

0 0 0 0 3,000 ppm

Nutraceuticals

0 0 0 2 kg / tonne 0

E. coli F4 vaccine

yes yes yes no no

Feeding strategies

Feeding strategies were based on practical field situations, where a limited number of different feeding phases can be fed to piglets during the post-weaning period. Therefore, we decided to test 1-phase, 2-phase and 3-phase feeding strategies in combination with E. coli F4 vaccination. Unvaccinated control group were also fed the 3-phase strategy. One unvaccinated group was designed to resemble the current field situation with addition of 3,000 ppm ZnO to the feed during the first 14 days post-weaning, whereas the other unvaccinated group was formulated with 2 kg of extra protective nutritional supplements, i.e. nutraceuticals, consisting of a combination of MCFAs, organic acids and additional fibers.

Treatment

No group treatments were performed during the entire study period. Individual piglets with severe clinical signs of PWD were treated with an injectable antimicrobial, i.e. lincomycine. Other disorders were treated by the farmer, following consultation of the veterinarian, with the appropriate antimicrobial where needed. All individual treatments were registered with date, pen, product type and reason for treatment.

Performance parameters

The following performance parameters were collected during the trial: piglet weight at d0, d21 and d50, feed intake during period 1 (0-  21 days), period 2 (22-50 days) and period 3 (0-50 days), individual treatments with specific reason for treatment, mortality with date of death (number of days in trial) and piglet weight. Average daily weight gain (ADWG) was calculated based on piglet weight and number of days in trial for period 1 (0-21 days), period 2 (22-50 days) and period 3 (0-50 days). Feed conversion rate (FCR), the amount of feed to add one kg of bodyweight, was calculated based on average daily weight gain and feed intake for period 1 (0-21 days), period 2 (22-50 days) and period 3 (0-50 days). Treatment incidence 50 (TI50) was calculated based on the number of individual injections per treatment for a total of 100 piglets over the
trial duration of 50 days.

Pen fecal clinical score and general clinical score

Piglet feces consistency was scored daily from d0 to d21 using pen fecal clinical score (FCS) as described in Table 2. FCS was performed by the same person throughout the entire duration of the trial observation (0-21 days). Piglets were also scored on general appearance using a general clinical score (GCS), ranging from 0 (= severe clinical condition) to 10 (= excellent clinical condition). For both pen FCS and GCS, one score per pen was attributed daily in the morning at 9 am. For analysis, area under the curve (AUC) and time to maximal score was calculated per pen for both pen FCS and GCS. Clinical assessment of piglets with diarrhea was performed based on appearance of fluid watery stools in the anal and perineal region. The number of piglets per pen with these clinical signs was counted daily from d0 to d21 and reported as total number of piglets with diarrhea per treatment group over the entire observation period (0-21 days).

Table 2. Comprehensive description of the pen fecal clinical score with its interpretation and the clinical aspect of the fecal clinical score.

Score

Interpretation

Clinical aspect

0

Normal

Normal fecal consistency

1

Pasty

Soft pasty consistenty

2

Mild

Presence of fluid, but more particles than fluid

3

Moderate

More fluid than particles

4

Severe

Fluid watery faeces

Statistical analysis

For the continuous data, effect of treatment was assessed using pairwise comparison using t-test with pooled standard deviations. For the ordinal outcomes, effect of treatment was assessed using pairwise comparison using Wilcoxon rank sum test. The P-values were adjusted with the Bonferroni method for multiple comparison. All tests were performed at the nominal level of 5%.

Results

Piglet weight and average daily weight gain

On d0, average individual piglet weight was not significantly different among treatment groups, indicating an equal starting weight in all groups. At the mid-point weighing (d21), group E (ZnO) had a significantly higher (P < 0.05) weight as compared to the other treatment groups. In contrast with its higher mid-point weight  at  d21, group  E (ZnO) had the lowest numerical average individual piglet weight at d50, although no significant differences (P > 0.05) were present between all treatment group (Figure 1).

JCRM-3-2-309-g001

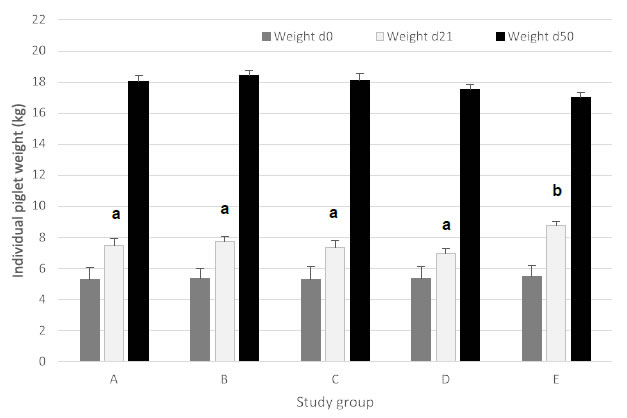
Figure 1. Average individual piglet weight (expressed in kg; mean ± SEM) for piglets at d0 (start of trial), d21 (mid-point weighing) and d50 (end of trial). Different treatment groups differed in feeding strategy and vaccination status against E. coli F4. Groups A, B, and C were vaccinated with Coliprotec® F4 at 18 days of age and combined with a 1, 2, or 3-phase feeding strategy. Group D was fed a 3-phase feeding strategy combined with additional nutraceutical protection, and Group E was fed a 3-phase feeding strategy with supplementation of 3,000 ppm ZnO for the first 14 days post-weaning. Different superscript letters indicate statistically significant differences (P < 0.05).

For period 1 (0-21 days), group E (ZnO) had a significantly higher (P < 0.05) ADWG  as compared  to the other treatment  groups.  The piglets vaccinated with the E. coli F4 vaccine grew equally well, whereas group D (nutraceuticals) slightly, though not significantly, underperformed, as compared to the E. coli vaccinated groups A, B, and C. For period 2 (22-50 days), group E had a significantly lower (P < 0.05) ADWG of 283 g/day compared to all other treatment groups, whereas E. coli vaccinated piglets in group A, B, and C grew 363 to 372 g/day. During this period, group E also had a significantly lower (P < 0.05) ADWG as compared to group D. Overall ADWG (0-50 days) was not significantly different among the different treatment groups (Figure 2).

JCRM-3-2-309-g002

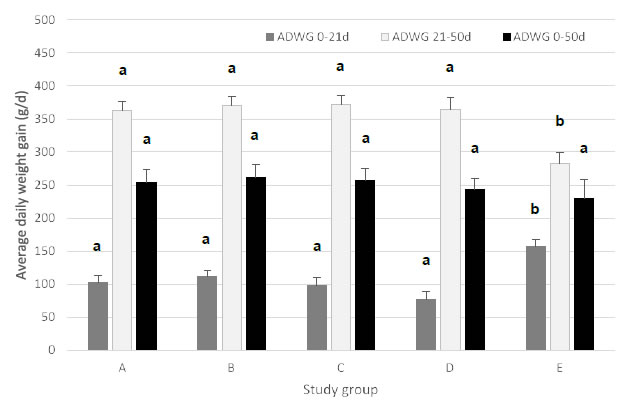
Figure 2. Average daily weight gain (ADWG; expressed in g/d; mean ± SEM) for piglets during period 1 (0-21 days post-weaning), period 2 (22-50 days post-weaning) and period 3 (0-50 days post-weaning). Different treatment groups differed in feeding strategy and vaccination status against E. coli F4. Group A, B, and C were vaccinated with Coliprotec® F4 at 18 days of age and combined with a 1, 2, or 3-phase feeding strategy, respectively. Group D was fed a 3-phase feeding strategy combined with additional nutraceutical protection, and Group E was fed a 3-phase feeding strategy with supplementation of 3,000 ppm ZnO for the first 14 days post-weaning. Different superscript letters indicate statistically significant differences (P < 0.05).

JCRM-3-2-309-g003

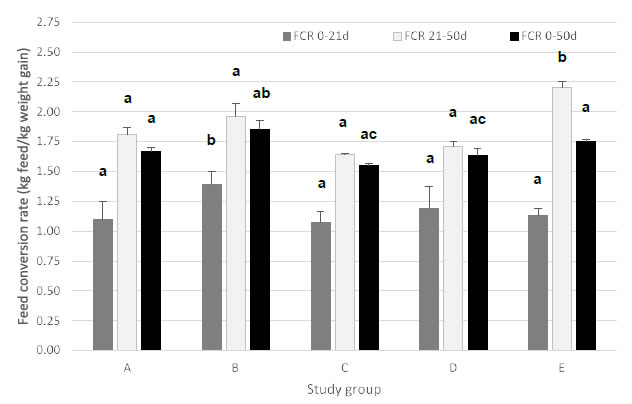
Figure 3. Feed conversion rate (FCR; expressed in kg of feed per kg of weight gain; mean ± SEM) for piglets during period 1 (0-21 days post-weaning), period 2 (22-50 days post- weaning) and period 3 (0-50 days post-weaning). Different treatment groups differed in feeding strategy and vaccination status against E. coli F4. Group A, B, and C were vaccinated with Coliprotec® F4 at 18 days of age and combined with a 1, 2, or 3-phase feeding strategy, respectively. Group D was fed a 3-phase feeding strategy combined with additional nutraceutical protection and Group E was fed a 3-phase feeding strategy with supplementation of 3,000 ppm ZnO for the first 14 days post-weaning. Different superscript letters indicate statistically significant differences (P < 0.05).

Feed conversion rate

For period 1 (0-21 days), group B (2-phase feeding) had a significantly higher (P < 0.05) FCR as compared to the other treatment groups. During period 2 (22-50 days), both group B (2-phase feeding) and group E  (ZnO)  had  a  significantly  higher (P < 0.05) FCR as compared to groups A, C, and D. Overall FCR (0-50 days) was significantly higher (P < 0.05) in group B (2-phase feeding) as compared to group C (3-phase feeding) and group D (nutraceuticals). None of the other groups was significantly different from each other.

Pen fecal clinical score and general clinical score

Pen FCS was collected daily for each individual pen from 0 to 21 days post-weaning. Pen FCS, expressed as AUC, was not significantly different (P > 0.05) among E. coli vaccinated groups (A, B and C). However, pen FCS of group E (ZnO) was significantly lower (P < 0.05) as compared to group D (nutraceuticals). Pen FCS of group E (ZnO) was significantly lower (P < 0.05) as compared to all E. coli vaccinated groups (Table 3). Although some numerical differences  in time to maximal FCS occurred among different treatment groups, no significant differences (P > 0.05) could be observed in the time to maximal FCS (Table 3).

Table 3. Area under the curve (AUC) of pen fecal clinical score and pen general clinical score (GCS), time to maximal FCS and GCS (mean ± SEM) for piglets during the first 21 days post-weaning and treatment incidence 50 (TI50; # individual treatment/100 piglets/50 days in trial; mean ± SEM). Pen FCS was scored daily on a score from 0 (= normal) to 4 (= watery diarrhea) and GCS was scored daily on a score from 0 (= very bad) to 10 (= excellent). Different treatment groups differed in feeding strategy and vaccination status against E. coli F4. Group A, B, and C were vaccinated with Coliprotec® F4 at 18 days of age and combined with a 1-2 or 3-phase feeding strategy, respectively. Group D was fed a 3-phase feeding strategy combined with additional nutraceutical protection and Group E was fed a 3-phase feeding strategy with supplementation of 3,000 ppm ZnO for the first 14 days post-weaning. Different superscript letters indicate statistically significant differences (P < 0.05).

Treatment group

A

B

C

D

E

Pen FCS

42.9 ± 2.97 a

41.6 ± 2.08 ac

43.1 ± 2.18 ad

52.6 ± 1.84 ad

15.8 ± 1.72 b

Time to maximal FCS

6.25 ± 0.59

6.50 ± 0.68

7.25 ± 0.56

6.62 ± 0.60

5.62 ± 0.65

Pen GCS

175 ± 3.96 a

187 ± 1.55 ac

176 ± 2.76 a

164 ± 3.04 ac

204 ± 1.79 bd

Time to maximal GCS

8.12 ± 0.61 a

6.12 ± 0.66 a

7.12 ± 0.61 a

7.62 ± 0.75 a

5.50 ± 0.38 a

# piglets with diarrhea (0-21 d)

76 a

73 a

105 a

315 b

11 c

TI50

1.21 ± 0.18 a

1.16 ± 0.14 ab

1.67 ± 0.30 ab

5.00 ± 1.05 c

0.17 ± 0.01 b

The number of piglets with clinical signs of diarrhea was significantly higher (n = 315; P < 0.05) in group D (nutraceuticals) as compared to the E. coli vaccinated groups. No significant differences were observed among the E. coli vaccinated groups (A, n = 76; B, n = 73; C, n = 105). Group E (ZnO) had a significantly lower number (n = 11; P < 0.05) of piglets with clinical diarrhea as compared to all E. coli vaccinated groups (A, B, and C) (Table 3).

Pen GCS was collected daily for each individual pen from 0 to 21 days post-weaning. AUC of pen GCS was significantly better (P < 0.05) in group E (ZnO) as compared to all other treatment groups. Group B (2-phase feeding) had a significantly better (< 0.05) pen GCS as compared to group A (1-phase feeding), C (3-phase feeding) and D (nutraceuticals) (Table 3). Although some numerical differences in time to maximal GCS occurred between the different treatment groups, no significant differences (P > 0.05) could be observed (Table 3).

Treatment incidence 50

TI50 was calculated as the total number of individual treatments per 100 piglets per group over 50 days of trial. In group D (nutraceuticals), TI50 was significantly higher (P < 0.05) as compared to the other treatment groups. Group E (ZnO)  had  the  lowest  TI50,  although the addition of 3,000 ppm ZnO was not taken into account in this calculation (Table 3). All E. coli vaccinated groups had equally low and non-significantly different (P > 0.05) TI50 values.

Mortality

Data related to mortality are given in Table 4. In summary, group D (nutraceuticals) had the highest percentage of overall mortality with 12.5%, which was nearly double the mortality percentage of group E (ZnO) and triple the mortality percentage in the vaccinated groups (A, B, and C). Moreover, piglets in group D (nutraceuticals) died early post-weaning (9.83 days post-weaning), mostly due to acute to subacute PWD. Mortality in group E (ZnO) occurred in period 2 (22- 50 d), after removal of 3,000 ppm ZnO from the diet at 14 days post- weaning. This was characterized by the highest mortality weight (11.56 kg) for period 2 (22-50 d). Mortality in the E. coli vaccinated groups (A, B, and C) was equally distributed among both periods and was very limited in numbers (n = 4-6 dead piglets per group) compared to both other groups (D and E).

Table 4. Mortality results per treatment group and study period with number of dead piglets per group (percentage of total piglets enrolled in the group), average weight of the dead piglets (kg;
± SEM), and average day of post-weaning mortality (d; ± SEM).

Study period

Period 1 (0-21 d post-weaning)

Period 2 (22-50 d post-weaning)

Treatment group

Mortality – number (%)

Average weight dead piglets (kg; avg ± SEM)

Average days post- weaning (d; avg ± SEM)

Mortality – number (%)

Average weight dead piglets (kg; avg ± SEM)

Average days post-weaning (d; avg ± SEM)

A

2 (1.56%)

6.00 ± 1.00

21.0 ± 0.0

4 (3.13%)

8.75 ± 1.11

35.2 ± 1.9

B

2 (1.56%)

4.50 ± 0.50

14.0 ± 5.0

3 (2.34%)

13.00 ± 5.00

40.7 ± 4.6

C

3 (2.34%)

4.00 ± 0.58

17.3 ± 2.7

1 (0.78%)

8.00 ± 0.00

25.0 ± 0.0

D

12 (6.67%)

4.17 ± 0.34

9.8 ± 1.6

4 (3.12%)

7.00 ± 3.67

30.4 ± 3.8

E

0 (0.00%)

N/A

N/A

9 (7.03%)

11.56 ± 1.32

39.8 ± 2.3

Discussion

From the current study, we can conclude that active immunization of piglets against PWD caused by F4-ETEC performed at an acceptable level as compared to the standard approach under field conditions with addition of 3,000 ppm ZnO during the first 14 days post-weaning. Although average individual piglet weight at 22 days post-weaning was significantly lower as compared to the ZnO-supplemented group (E), piglets vaccinated with the E. coli F4 vaccine were numerically heavier (1.0 to 1.4 kg extra) at the end of the nursery period (d50). Under field conditions, an extra kg of piglet weight during the nursery period is considered to result in at least 2-3 kg extra weight during the fattening period. This implies earlier slaughter at the same weight or heavier fattening pigs at the same slaughter age. Both scenarios mean economic benefit to the swine farmer. Average daily weight gain behaved in the same trend, although the ADWG for period 2 (22-50 d) was significantly lower in the ZnO-supplemented group (E). Under field conditions, most farmers only have access to start and end-point data related to post-weaning performances, therefore the significantly higher mid-term performance in the ZnO-supplemented group (E) is not considered relevant to practice. Nevertheless, the higher weight and better ADWG indicate that piglets supplemented with ZnO at 3,000 ppm for 14 days post-weaning might have a stable intestinal integrity and pathogenic E. coli bacteria have less impact on the performance of these piglets during the early post-weaning phase [30]. However, CVMP has recently decided that the use of ZnO in post-weaning diets should be phased out the latest by 2022 throughout the EU [31]. Therefore, alternative approaches to control PWD due to pathogenic E. coli should be explored. Several alternative strategies, such as adapted nutritional strategies (feed  consistency,  lower  crude protein, digestible fibers and other dietary fibers), prebiotics, probiotics, organic acids, MCFAs, specific IgA antibodies and oral vaccination have been explored [19-29,33,34,37-40].

In the current study, a nutraceutical approach, including a mixture of MCFAs, organic acids and additional fiber, was evaluated. Although performance parameters (weight, ADWG and FCR) were in line with the E. coli vaccinated groups and supplementation of ZnO, other parameters related to health (pen FCS, mortality and TI50) were significantly worse, indicating this approach did not provide as much
protection as ZnO supplementation or E. coli F4 vaccination. Indeed, intestinal pathogens have many different mechanisms to interact with the host, which makes complete inhibition of their pathogenesis through specific feed additives or a combination of these additives quite challenging [21,41].

Recently, vaccination with a live non-pathogenic E. coli F4 or E. coli F4 and F18 vaccine has demonstrated efficacy against PWD due to F4-ETEC, and F4- and F18-ETEC [33,34]. Immunization against the F4- and F18-ETEC pathogens resulted in decreased severity and duration of PWD clinical signs and fecal shedding of F4- and F18- ETEC [33,34]. Moreover, increased weight gain was demonstrated  in piglets vaccinated with E. coli F4 vaccine [33]. Our results are in line with these observations, indicating that feeding regime (1-, 2-  or 3-phase feeding strategy) had no impact on results induced by immunization with an E. coli F4 vaccine under field conditions. This implies that farms suffering from PWD due to F4-ETEC do not have to alter their specific feeding strategy. This is an advantage, since in most cases there are limitations in the number of available feed bins for the on-farm post-weaning facilities. From an economical point of view, however, 3-phase feeding strategies provide optimal performance parameters related to FCR.

As expected, supplementation of ZnO resulted in the lowest pen FCS and TI50 although time to maximal fecal clinical score did not differ among treatment groups. Nevertheless, from 14 days post-weaning onwards, at removal of the ZnO from the feed, pen FCS increased again, in contrast to the other groups, where pen FCS remained stable during that specific period. In practice, this phenomenon is referred to as ‘post-ZnO diarrhea’ and sometimes even needs antibiotic treatment to control. E. coli vaccinated piglets had similar pen FCS and GCS, which remain important evaluation parameters in practice, due to lack of many other directly available data for evaluation of preventive or clinical interventions to prevent or control PWD due to E. coli.

Another important evaluation parameter to assess the success of different intervention strategies in relation to PWD due to E. coli is mortality [33]. Mortality data were different among treatment groups, with acceptable levels (3.12 to 4.69%) in E. coli vaccinated piglets, and much higher levels of 7.03% to 12.5% in ZnO-supplemented and nutraceutical-supplemented groups, respectively. Analysis of mortality data per period showed early death in the nutraceutical- supplemented piglets, whereas ZnO-supplemented piglets died much later during the post-weaning period, i.e. after the removal of ZnO  at 14 days post-weaning. In the E. coli vaccinated piglets, mortality was more equally distributed throughout the entire study period and significantly lower as compared to both other alternative treatments (nutraceutical- and ZnO-supplementation).

In conclusion, the present study demonstrated the efficacy of an oral live non-pathogenic E. coli F4 vaccine (Coliprotec®   F4; Elanco) for active immunization of piglets against PWD due to F4-ETEC. Different feeding strategies had no significant impact on the clinical outcome and performance parameters of these vaccinated piglets. In many parameters, E. coli vaccination performed equally or better as compared to the ZnO- supplemented group. However, this approach is no longer future-proof due to EU-regulations on total ban of ZnO by 2022. Therefore, E. coli vaccination could be one of the preventive options to protect piglets against PWD due to E. coli in the near future. In contrast, the alternative strategy combining MCFAs, organic acids and additional fibers resulted in significant clinical diarrhea and mortality, requiring additional antibiotic treatment to control the disease. Nevertheless, in the nutraceutical-supplemented group, other performance parameters were similar to E. coli vaccination or ZnO supplementation.

Acknowledgements

The authors greatly acknowledge the technical staff of Innsolpigs (Aalter) for their assistance in randomization, weighing and data collection.

Declarations

Ethics approval and consent to participate: Field trial with Veterinary Medicinal Product approved for use in swine. No additional ethical approval needed. Consent to participate was obtained following full information of farmer on the protocol to be carried out.

Consent for publication: Not applicable.

Availability of data and material: The datasets analysed during the current study are available from the corresponding author on reasonable request.

Competing interests: The authors declare that they have no competing interests.

Author’s contributions: FV coordinated the entire study from study design to data collection and analysis to the manuscript. OT was involved in data analysis and manuscript preparation. All authors read and approved the final manuscript.

Acknowledgements: The author greatly acknowledges the swine farmer and his swine veterinarian participating in the study.

Author’s information: FV is currently a Sr. Technical Advisor Swine for Benelux / UK&ROI within Elanco Animal Health. He holds a DVM, a Master in Veterinary Public Health and Food Safety, a PhD in Veterinary Sciences and a PhD in Applied Biological Sciences, oxide and is a Diplomate in the European College of Porcine Health Management. He has a specific interest in swine intestinal health  and the specific approach to improve intestinal health through non- antibiotic solutions.

Abbreviations

AUC: area under the curve

CVMP: Committee for Veterinary Medicinal Products

ETEC: enterotoxigenic Escherichia coli

EU: European Union

FCS: fecal clinical score

GCS: general clinical score

LT: heat-labile toxin

MCFAs: medium chain fatty acids

ppm: parts per million

PWD: post-weaning diarrhea:

STa: heat-stabile toxin a

STb: heat-stabile toxin b

Stx2e: shiga-toxin 2e

ZnO: zinc oxide

References

  1. Fairbrother JM, Nadeau É, Gyles CL (2005) Escherichia coli in postweaning diarrhea in pigs: an update on bacterial types, pathogenesis, and prevention strategies. Anim Heal Res Rev 6:17-39. [crossref]
  2. Hoa NX, Kalhoro DH, Lu C (2013) Distribution of serogroups and virulence genes of E. coli strains isolated from porcine post weaning diarrhea in Thua Thien Hue province Vietnam. Tạp chí Công ngh Sinh học 11:665-672. [crossref]
  3. Lyutskanov M (2011) Epidemiological characteristics of post-weaning diarrhea associated with toxin-producing Escherichia coli in large intensive pig farms. Trakia J Sci 9:68-73.
  4. Svensmark B, Jorsal SE, Nielsen K, Willeberg P (1989) Epidemiological studies of piglet diarrhoea in intensively managed Danish sow herds. I. Pre-weaning diarrhoea. Acta Vet Scand 30:43-53. [crossref]
  5. Svensmark B, Nielsen K, Willeberg P, Jorsal SE (1989) Epidemiological studies of piglet diarrhea in intensively managed Danish sow herds. II. Post-weaning diarrhea. Acta Vet Scand 30:55-62. [crossref]
  6. Tubbs RC, Hurd HS, Dargatz D, Hill G (1993) Preweaning morbidity and mortality in the United States swine herd. Swine Heal Prod 1:21-28.
  7. USDA. Part II. Reference of Swine Health and Health Management in the United States, 2000. USDA:APHIS:VS, CEAH, National Animal Health Monitoring System, Fort Collins, CO. 2002;vol. #N355.0202.
  8. Zhang W, Zhao M, Ruesch L, Omot A, Francis D (2007) Prevalence of virulence genes in Escherichia coli strains recently isolated from young pigs with diarrhea in the US. Vet Microbiol 123:145-152. [crossref]
  9. Fairbrother JM, Gyles CL (2012) Chapter 53: Colibacillosis. In: Diseases of Swine. 10th Edition. Eds. Zimmerman JJ, Karriker LA, Ramirez A, Schwartz KJ, Stevenson GW. Wiley-Blackwell. p. 723-749.
  10. Chen X, Gao S, Jiao X, Liu XF (2004) Prevalence of serogroups and virulence factors of Escherichia coli strains isolated from pigs with postweaning diarrhoea in eastern China. Vet Microbiol 103:13-20. [crossref]
  11. Frydendahl K (2002) Prevalence of serogroups and virulence genes in Escherichia coli associated with postweaning diarrhoea and edema disease in pigs and a comparison of diagnostic approaches. Vet Microbiol 85:169-182. [crossref]
  12. Luppi A, Gibellini M., Gin T,  Vangroenweghe F,  Vandenbroucke  V,  Bauerfeind   R, Bonilauri P, Labarque G, Hidalgo Á (2016) Prevalence of virulence factors in enterotoxigenic Escherichia coli isolated from pigs with post-weaning diarrhea in Europe. Porcine Health Manag 2:20-25. [crossref]
  13. Vu-Khac H, Holoda E, Pilipcinec E, Blanco M, Blanco JE, Mora A, Dahbi G, Lopéz C, González EA, Blanco J (2006) Serotypes, virulence genes, and PFGE profiles of Escherichia coli isolated from pigs with postweaning diarrhoea in Slovakia. BMC Vet Res 2:13-20. [crossref]
  14. Abraham S, Trott DJ, Jordan D, Gordon DM, Groves MD, Fairbrother JM, Smith MG, Zhang R, Chapman TA (2014) Phylogenetic and molecular insights into the evolution of multidrug-resistant porcine enterotoxigenic Escherichia coli in Australia. Int J Antimicrob Agents 44:105–111. [crossref]
  15. Abraham S, Jordan D, Wong HS, Johnson JR, Toleman MA, Wakeham DL, Gorden DM, Turnidge JD, Mollinger JL, Gibson JS, Trott DJ (2015) First detection of extended-spectrum cephalosporin- and fluoroquinoloneresistant Escherichia coli in Australian food-producing animals. J Glob Antimicrob Resist 3:273-277.
  16. Boyen F, Vangroenweghe F, Butaye P, De Graef E, Castryck F, Heylen P, Vanrobaeys M, Haesebrouck F (2010) Disk prediffusion is a reliable method for testing colistin susceptibilitys in porcine E. coli strains. Vet Microbiol 144:359-362. [crossref]
  17. Jahanbakhsh S, Smith MG, Kohan-Ghadr HR, Letellier A, Abraham S, Trott DJ, Fairbrother JM (2016) Dynamics of extended-spectrum cephalosporin resistance   in pathogenic Escherichia coli isolated from diseased pigs in Quebec, Canada. Int J Antimicrob Agents 48:194-202. [crossref]
  18. Luppi A, Bonilauri P, Dottori M, Gherpelli Y, Biasi G, Merialdi G, Maioli G, Martelli P (2013) Antimicrobial resistance of F4+ Escherichia coli isolated from swine in Italy. Transbound Emerg Dis 62:67–71. [crossref]
  19. Jha R, Berrocoso JD (2015) Review: dietary fiber utilization and its effects on physiological functions and gut health of swine. Animal 9:1441-1452. [crossref]
  20. Jha R, Berrocoso JFD (2016) Dietary fiber and protein fermentation in the intestine of swine and their interactive effects on gut health and on the environment: a review. Anim Feed Sci Technol 212:18-26.
  21. Tran THT, Everaert N, Bindelle J (2018) Review on the effects of potential prebiotics on controlling intestinal enteropathogens Salmonella and Escherichia coli in pig production. J Anim Physiol Anim Nutr (Berl) 102:17-32. [crossref]
  22. Heo JM, Kim JC, Hansen CF, Mullan BP, Hampson DJ, Pluske JR (2009) Feeding  a diet with decreased protein content  reduces  indices  of  protein  fermentation  and the incidence of postweaning diarrhea in weand piglets challenged with an enterotoxigenic strain of Escherichia coli. J Anim Sci 87:2833-2843. [crossref]
  23. Hermes RG, Molist F, Ywazaki M, Nofrarias M, Gomes de Segura A, Gasa J, Pérez JF (2009) Effect of dietary level of protein and fiber on the productive performance and health status of piglets. J Anim Sci ;87:3569-3577. [crossref]
  24. Pieper R, Villodre Tudela C, Taciak M, Bindelle J, Pérez JF, Zentek J (2016) Health relevance of intestinal protein fermentation in young pigs. Anim Health Resh Rev 17:137-147. [crossref]
  25. Bikker P, Dirkzwager A, Fledderus J, Trevisi P, le Huërou-Luron I, Lallès JP, Awati A (2006) The effect of dietary protein and fermentable carbohydrates levels on growth performance and intestinal characteristics in newly weaned piglets. J Anim Sci 84:3337-3345. [crossref]
  26. Mikkelsen LL, Naughton PJ, Hedemann MS, Jensen BB (2004) Effects of physical properties of feed on microbial ecology and survival of Salmonella enterica Serovar Typhimurium in the pig gastro-intestinal tract. Appl Environ Microbiol 70:3485-3492. [crossref]
  27. Htoo JK, Araiza BA, Sauer WC, Rademacher M, Zhang Y, Cervantes M, Zijlstra RT (2007) Effect of dietary protein content on ileal amino acid digestibility, growth, performance, and formation of microbial metabolites in ileal and cecal digesta of early-weaning pigs. J Anim Sci 85:3303-3312. [crossref]
  28. Escobar Garcia K, Reis de Souza TC, Mariscal Landin G, Aguilera Barreyro A, Guadalupe Bernal Santos M, Guadalupe Gomez Soto J (2014) Microbial fermentation patterns, diarrhea incidence and performance in weaned piglets fed a low protein diet supplemented with probiotics. Food Nutr Sci 5:1776-1786.
  29. Zentek J, Buchheit-Renko S, Männer K, Pieper R, Vahjen W (2012) Intestinal concentrations of free and encapsulated dietary medium-chain fatty acids and effects on gastric microbial ecology and bacterial metabolic products in the digestive tract of piglets. Arch Anim Nutr 66:14-26. [crossref]
  30. Poulsen HD (1995) Zinc oxide for weanling pigs. Acta Agric Scand 45:159-165.
  31. European Medicinal Agency (2017) Questions and answers on veterinary medicinal products containing zinc oxide to be administered orally to food producing species. Outcome of a referral procedure under Article 35 of Directive 2001/82/EC (EMEA/ V/A/118). EMA/394961/2017.
  32. Melkebeek V, Goddeeris BM, Cox E (2013) ETEC vaccination in pigs. Vet Immunol Immunopathol 152:37-42. [crossref]
  33. Fairbrother JM, Nadeau E., Bélanger L, Tremblay C-L, Tremblay D, Brunelle M, Wolf R, Hellmann K, Hidalgo A (2017) Immunogenicity and protective efficacy of a single-dose live non-pathogenic Escherichia coli oral vaccine against F4-positive enterotoxigenic Escherichia coli challenge in pigs. Vaccine 35:353-360. [crossref]
  34. Nadeau E, Fairbrother JM, Zentek J, Bélanger L, Tremblay D, Tremblay C-L, Röhe I, Vahjen W, Brunelle M, Hellmann K, Cvejíc D, Brunner B, Schneider C, Bauer K, Wolf R, Hidalgo A (2017) Efficacy of a single oral dose of a live bivalent E. coli vaccine against post-weaning diarrhea due to F4 and F18-positive enterotoxigenic E. coli. Vet J 226:32-39. [crossref]
  35. Vangroenweghe F, Suls L, Van Driessche E, Maes D, De Graef E (2012) Health advantages of transition to batch management system in farrow-to-finish pig herds. Veterinarni Medicina, 57:83-91.
  36. Casey TA, Bosworth BT (2009) Design and evaluation of a multiplex polymerase chain reaction assay for the simultaneous identification of genes for nine different virulence factors associated with Escherichia coli that cause diarrhea and edema disease in swine. J Vet Diagn Invest 21:25–30. [crossref]
  37. Delisle B, Calinescu C, Mateescu MA, Fairbrother JM, Nadeau É (2012) Oral immunization with F4 fimbriae and CpG formulated with Carboxymethyl Starch enhances F4-specific mucosal immune response and modulates Th1 and Th2 cytokines in weaned pigs. J Pharm Pharm Sci 5:642-656. [crossref]
  38. Nguyen UV, Melkebeek V, Devriendt B, Goetstouwers T, Van Poucke M, Peelman L, Goddeeris BM, Cox E (2015) Maternal immunity enhances systemic recall immune responses upon oral immunization of piglets with F4 fimbriae. Vet Res 46:72-79. [crossref]
  39. Rutter JM, Jones GW (1973) Protection against enteric disease caused by Escherichia coli—a model for vaccination with a virulence determinant? Nature 242:531-532. [crossref]
  40. Virdi V, Palaci J, Laukens B, Ryckaert S, Cox E, Vanderbeke E, Depicker A, Callewaert N (2019) Yeast-secreted, dried and food-admixed monomeric IgA prevents gastrointestinal infection in a piglet model. Nat Biotechnol. 37:527–530. [crossref]
  41. Daudeling J-F, Lessard M, Beaudoin F, Nadeau E, Bissonnette N, Boutin Y, BrousseauJ-P, Lauzon K, Fairbrother JM (2011) Administration of probiotics influences F4 (K88)-positive enterotoxigenic Escherichia coli attachment and intestinal cytokine expression in weaned pigs. Vet Res 42:69-79. [crossref]

Operational and Clinical Implementation Plan for an Anesthesiologist-Led Coronavirus-2019 Hospital “SWAT” Team

DOI: 10.31038/IJAS.2020111

Abstract

One unique facet of the COVID 19 pandemic is the patient surges that deplete hospitals and hospital systems of critical resources such as equipment, medications, and personnel.Addressing such a surge in patients with coronavirus 2019 (COVID-19) has proven to be challenging in many countries, including in the United States.To prepare for the surge of COVID-19 infected patients in the hospital setting, complex operational preparation plans were enacted with the Kaiser Permanente Southern California Kaiser Health System.Critical care units and emergency departments were identified as venues needing the most assistance.Due to the anticipated cancellation of all elective surgeries, anesthesiologists were identified as an ideal available physician pool for redeployment to these patient care areas.Anesthesiologists have intensive care training in their residencies, and they have expertise performing procedures such as intubation, central line placement, and arterial line placement that are needed to monitor and treat COVID 19 patients.Accordingly, an anesthesiologist led team comprised of physicians and certified nurse anesthetists was developed and named “Special Weapons And Tactics” (SWAT) team.The COVID-19 SWAT response team provided multi-disciplinary clinical consultation, airway management and insertion of invasive catheters for COVID-19 patients in intensive care units, emergency departments, and/or other sectors. The utilization of SWAT teams is one way to maximize operations during a resource strapped event such as the current COVID-19 pandemic and serves as one model to deliver a highly synergistic care delivery for this dynamic and complex pandemic.

Keywords

COVID-19, Pandemic, Anesthesiologist, SWAT team, Surge planning

Introduction

The coronavirus 2019 (COVID-19) pandemic has impacted over 150 countries around the world and has resulted in a global health care crisis [1]. The United States has become one of the most impacted countries and based on most recent CDC data, 12% of COVID-19 patients require hospitalization and 7% require admission to intensive care unit (ICU) [2]. Once in the ICU, patients’ respiratory status can rapidly deteriorate requiring intubation [3]. The sheer number of COVID-19 patients arriving in the ICU has, in many cases, overwhelmed institutional resources, including those of critical care physician intensivists, nurses (RN) and specialist staff who are already working at maximal levels.

The original SWAT teams were created by Los Angeles Police Department inspector Daryl Gates; he first envisioned “SWAT” as an acronym for “Special Weapons Attack Team” in 1967, but later accepted “Special Weapons And Tactics” on the advice of his deputy chief, Edward M. Davis. Many governmental and health care officials have stated that the COVID-19 pandemic is a war against an invisible enemy being fought by our front-line health care providers. In an effort to provide coordinated assistance, an operational and clinical care plan was devised and implemented to facilitate an anesthesiologist-led “SWAT” team to deliver complex problem-solving capabilities, provide requisite airway management (i.e. intubation), as well as placement of invasive arterial and central venous access for COVID-19 patients in ICUs and Emergency Departments (ED). No subjects were utilized in this clinical innovation, and Institutional Review Board approval was not required.

Clinical Care Innovation

Delivery of coordinated services in multiple sectors for airway management and placement of invasive catheters by a physician-led anesthesiology SWAT team requires a vast amount of planning that must be facilitated by each respective medical center or temporary medical field hospital through complex infrastructure and logistical operations. Considerations included the pool of available anesthesiologists, nurse anesthetists and anesthesiology technologists per day who were not utilized in the operating room for emergent and urgent cases, the number of COVID 19 designated ICU beds in our hospital, and the number of patients undergoing care in the ED.Additionally, surge estimation projections were factored into the manpower and logistics models.Within the southern California Kaiser Permanente Health (KPH) system, every individual Kaiser Permanente hospital ascertained its needs for supplemental physician and healthcare providers based upon suspected or confirmed COVID-19 patient assessment.For our tertiary care hospital integrated in this medical system, the SWAT team was designated the best structure.

SWAT team structure: After a thorough review of the clinical needs in the ICU and ED, the department of anesthesia determined that the anesthesiologist-led SWAT team would be composed of three members: 1) a physician anesthesiologist (MDA) 2) a Certified Registered Nurse Anesthetist (CRNA) or another MDA and 3) an Anesthesiology Technologist (AT).A minimum of one SWAT team was assigned per day based on overall demand for services 24 hours-a-day/7 days-a-week; however, additional teams were added based on surge projection modeling and subsequent opening of more ICUs exclusively designated for the care of COVID-19 patients.In KPH system, the team was assigned to the entire hospital, but in other hospitals the team(s) could be assigned to a specific sector (i.e. ICU, ED), field hospital or temporary triage area) or work jointly in sequence covering areas as consultations are requested. In the KPH system, SWAT teams were designed as Alpha, Bravo, Charlie, Delta. Each team member was given a cell phone and beeper, and all beepers were synced to deploy simultaneously. Each SWAT team was assigned to one 12-hour shift per day allow for optimal performance without undue fatigue or burn-out of team members.

SWAT team work flow:A major tenet in the SWAT structure is to support each team member to optimize team performance and cohesion through open communication channels. Daily briefing and group “huddles” were coordinated at the beginning and end of every SWAT team shift (i.e. 0700, 1900) and occurred in the anesthesiology workroom. After the 0700 morning huddle, the SWAT team(s) would participate in clinical rounds with the entire ICU staff (physicians, nurses, respiratory therapists, other specialists) to determine which COVID-19 infected patients may likely require interventions, as well as to plan the timing of any necessary procedures by the SWAT team. The evening SWAT team would round with the ICU staff at 2300. For unplanned or emergency services, the ICU intensivist, hospitalist or ED physician would page the team for immediate response.

SWAT teams maintain constant communication to ensure availability, therefore, if one SWAT team is performing a procedure, the other team would be alerted to be readily available immediately to assist in the event of a critical event. Intubation and procedure kits were pre-assembled in “GO BAGS” for immediate “grab and go” functionality. When the SWAT team was called for intubation or procedures, the MDA would communicate directly with the ICU Medical Doctor (MD) to place sedation, ventilator, and restraint orders into Electronic Medical Record (EMR).The SWAT team would communicate with the primary nurse (RN) before starting any procedure(s) so that the RN could prepare sedation medications or perform additional tasks. The ICU RN should also be in the patient room assisting the SWAT team the entire time during procedural interventions. If time permits, a patient safety briefing (Table 1) with anesthesia SWAT team, RN, and RT was done prior to entering room. Donning and doffing protective equipment was performed with an established spotter – either the CRNA or AT. The spotter must pay close attention during entire procedure and act as a safety agent for both the provider(s) and patient to avoid any breaches in protocol. At the end of procedure(s), close loop with ICU MD, and inform the RN and MD of any issues, medications given or other notable events. At end of shift, get update from ICU MD and sign out to SWAT team MDA.

Table 1. “Time-Out” Safety Check Briefing Checklist.

If time permits, perform a pre-procedure time-out led by anesthesiologist.

• Introductions & Roles

• MD

• CRNA (or MD #2)

• Spotter (anesthesiology technologist) confirm easy visibility with monitor and team

• ICU nurse

• Respiratory therapist

• Confirm correct patient, procedure (s) to be done, necessary equipment inside of room for procedure (s), and orders placed in electronic medical record (if patient condition allows).

• Intubation

• Central venous catheter insertion (anticipated site)

• Arterial catheter

• Oral gastric tube

• Ventilator ready on standby

• Sedation ready on standby

• Patient review

• Code status

• Allergies

• Past Medical History (cardio-pulmonary status, renal function, pertinent labs)

• Potential airway issues

• Confirm functional intravenous access

• Hemodynamics and anticipated need for vasopressors

• Plan for airway management

• Confirm working bag-mask ventilation and suction readily available at head-of-bed.

• Primary intubation plan and backup plan(s); fiberoptic, bougies, etc.

• Induction drugs.

• Confirm pre-oxygenation.

• Designate repositioning help once induced.

• Location of nearest crash cart if necessary.

Table 2. SWAT Team Performance Enhancement Synergy.

OPEN LOOP COMMUNICATIONamong all SWAT teamsis key.

• Define and maintain specific roles prior to entering patient room to ensure optimal performance and maximize safety.

• Always work in groups of 3 anesthesia providers (2 inside room and 1 outside monitoring patient/administering medications)

• SWAT team(s) should attend rounds in each sector where services for COVID-19 patients will be needed (i.e. ICU, ED).

• Time procedures to ensure that ancillary support is available, as well as to coincide when patients are in supine position to facilitate procedures.

• Identify issues for patient care improvement during rounds (i.e. pressure ulcers, face protection, sedation protocols, safety issues) related to perioperative anesthesia expertise.

• Encourage multi-disciplinary problem solving with other knowledgeable providers (i.e. physician and nursing specialists) from any and all sectors.

• End each shift with debriefing and close communication channels to ensure planning for next SWAT team.

• Debriefing with stakeholders from other sectors.

• Identify any potential deficiencies or obstacles and notify appropriate executive channels for support.

Supply coordination: Due to the need for a wide variety of anesthesiology and procedural supplies, designated areas were partitioned in the various clinical sectors (i.e. ICU, ED). Set-up and inventory control is the responsibility of the anesthesiology technologist. Figure 1 demonstrates the supply set-up area with the necessary supplies.When providing direct care to COVID-19 patients, each team member was equipped with a purified air purifying respirator (PAPR) and full personal protective equipment (PPE). PAPRs were placed in locked orange tackles boxes and designed for each SWAT team member. Designated showers for decontamination at end of shift were also provided for all COVID-19 health care providers.

IJAS-1-1-101-g001

Figure 1. Designated secure area in intensive care unit and emergency department for anesthesia SWAT team supplies. (1) Cart: sterile towels, sterile gloves, central venous catheters (cordis, dialysis catheters); (2) Anesthesia portable cart with full array of medications, syringes, tubing, fluids;( 3) clean Mayo stand with clear waste bag; (4) Portable video laryngoscope screen (5) Ultrasound machine; (6) Black cart for clean products with “GO BAGS” underneath (7) Linens.

Discussion

The COVID-19 pandemic has created a major disruption in day-to-day care and necessitates emergency coordination of multidisciplinary teams to optimize patient outcome, minimize physician burnout, and improve operations.The use of SWAT teams in medicine have been widely employed to maximize clinical medical mission readiness and effectiveness during disasters [4-7]. The mission of combat/military SWAT is to save lives, and the primary focus of SWAT is to provide tactical solutions that increases the likelihood of de-escalation and safe resolution of high-risk incidents. In the medical setting, we organized our anesthesiologist-led SWAT team around three core concepts. The first was command control — an anesthesiologist led the team, fielded all consultations, ascertained medical history, ordered pertinent studies pre-procedure as needed, and performed procedures with help of a Certified Nurse Anesthetist (CRNA) and anesthesia technician.The second was containment of risk –the team employed a checklist to ensure appropriate and safe donning and doffing of protective patient equipment PPE with a spotter to ensure actions were performed without self-contamination.The third was rescue– for example, the resuscitation of the patient from respiratory distress via intubation. Therefore, SWAT concepts can be translated and adapted during a pandemic situation that requires multiple layers of operations, logistics and expertise for optimal management [8]. The various steps in the implementation and execution of an anesthesiologist led SWAT team.SWAT team protocols make use of checklists to ensure uniform standards, ensure 24/7 readiness, and maximize provider and patient safety. Additionally, the SWAT team structure can be expanded or tailored based upon a facility’s need, size or geographic footprint.

The implementation of an anesthesiologist-led SWAT team reduces the work burden for ICU personnel.As the course of critically ill COVID-19 requires relatively long-term care in the ICU, physician intensivists, nurses, and respiratory therapists may experience burn-out along with their own respective manpower shortages. The anesthesiologist-led SWAT team alleviates the strain of performing complex procedures on critically ill patients.Airway manipulation of patients infected with COVID-19 can be potentially hazardous to any healthcare providers and warrants a high degree of expertise and precautions [9-12]. As airway and invasive monitor experts, an anesthesiologist-led SWAT team employs the principles of in-depth knowledge, training, insight and preparation for duty in highly hazardous clinical settings. The utilization of a SWAT team is a manpower-efficient method of delivering care in resource constrained settings, especially given that a majority of anesthesia providers will have increased availability to due to mandatory cancellation of elective surgical procedures during the COVID-19 pandemic. Appropriate Personal Protective Equipment (PPE) should always follow up-to-date recommendations as set forth by the Centers for Disease Control and Prevention in conjunction with clinical guidelines issued jointly by the American Society of Anesthesiologists, Anesthesia Patient Safety Foundation and American Association of Nurse Anesthetists [2, 13-15].

The fiscal impact of anesthesiologist-led SWAT team implementation is variable and highly dependent upon the overall employment model utilized for anesthesia care providers. In non-salaried health care provider environments (i.e. private practice “fee-for-service’), the fiscal impact of SWAT team costs may be borne out by billing 3rd party payors for procedural relative value units, and/or through hospital stipends derived from state and federal subsidies provided to hospitals for management of COVID-19 patients during a national state of emergency. In academic practices or single- or multi-specialty salaried physician groups, the reallocation of health care providers to meaningful work assignments defrays the fixed costs of personnel who would otherwise not have any work to perform. Work performed in distressed situations beyond ordinary duty may possible quality for “hazard pay,” and state/federal laws govern this area. SWAT teams enable organized and coordinated provision of critical care services during distressed periods associated with rapidly arising scenario that may last a short or long-term period.

In conclusion, the utilization of an anesthesiologist-led SWAT team is a clinical innovation that is ideally suited to assist during the COVID-19 pandemic. The operational implementation plan described can be utilized in traditional tertiary care medical centers, temporary “field hospitals” or ambulatory surgery centers. In addition to the technical arsenal within our scope of practice, anesthesiologists, nurse anesthetists and anesthesiology technologists bring great insight and problem-solving capabilities to sectors that do not routinely interface with anesthesia providers. Multi-disciplinary teamwork allows a multitude of practitioners to use their expertise to handle a complex pandemic such as COVID-19.

References

  1. https://www.who.int/emergencies/diseases/novel-coronavirus-2019/situation-reports.
  2. https://www.cdc.gov/coronavirus/2019-ncov/index.html.
  3. Zhou F, Yu T, Du R, Fan G, Liu Y, et al. (2020) Clinical course and risk factors for mortality of adult inpatients with COVID-19 in Wuhan, China: a retrospective cohort study. The Lancet. [Crossref]
  4. Heiskell LE, Carmona RH (1994) Tactical emergency medical services: an emerging subspecialty of emergency medicine. Annals of Emergency Medicine 23:778-785.
  5. Jones JS, Reese K, Kenepp G, Krohmer J (1996) Into the fray: integration of emergency medical services and special weapons and tactics (SWAT) teams. Prehospital and Disaster Medicine 11:202-206. [Crossref]
  6. Yeskey KS, Llewellyn CH, Vayer JS (1996) Operational medicine in disasters. Emergency Medicine Clinics 14:429-438.
  7. McArdle DQ, Rasumoff D, Kolman J (1992) Integration of emergency medical services and special weapons and tactics (SWAT) teams: the emergence of the tactically trained medic. Prehospital and Disaster Medicine 7:285-288.
  8. https://post.ca.gov/Portals/0/post_docs/publications/SWAT-2019.pdf.
  9. Cheung JC-H, Ho LT, Cheng JV, Cham EYK, Lam KN (2020) Staff safety during emergency airway management for COVID-19 in Hong Kong. The Lancet Respiratory Medicine8. [Crossref]
  10. Brewster DJ, Chrimes NC, Do TB, Fraser K, Groombridge CJ, et al. (2020) Consensus statement: Safe Airway Society principles of airway management and tracheal intubation specific to the COVID-19 adult patient group. The Medical journal of Australia 212:1. [Crossref]
  11. Chen X, Shang Y, Yao S, Liu R, Liu H (2020) Perioperative care provider’s considerations in managing patients with the COVID-19 infections.TranslPerioper Pain Med7:216-223.
  12. Ng K, Poon BH, Puar THK, Quah JLS, Loh WJ, et al. (2020) COVID-19 and the risk to health care workers: a case report. Annals of Internal Medicine. [Crossref]
  13. https://www.asahq.org/in-the-spotlight/coronavirus-covid-19-information.
  14. https://www.apsf.org/covid-19-and-anesthesia-faq/.
  15. Learn A (2020) AANA, ASA, APSF and AAAA Issue Joint Statement on Use of Personal Protective EquipmentDuring COVID-19 Pandemic.

In Vitro and Intracellular Activities of Omadacycline against Staphylococcus aureus Isolates

DOI: 10.31038/IMROJ.2020524

Abstract

Purpose: Omadacycline is a once-daily Intravenous (IV) and oral aminomethylcycline antibiotic that exhibits in vitro activity against Gram-positive and Gram-negative aerobes, anaerobes and atypical bacteria including many drug-resistant strains. This study investigated the in vitro activity of omadacycline and comparators against 239 resistant Staphylococcus aureus strains.

Methods: The in vitro activity of omadacycline and comparators was tested against S. aureus strains including methicillin-resistant (mecA), macrolide-resistant (ermA, B or C) and ciprofloxacin-resistant (gyrA and parC) isolates. In addition, the intracellular human monocyte activity of omadacycline and comparators was determined against ATCC S. aureus strains.

Results: Against all resistant strains of S. aureus, the in vitro activity of omadacycline (MIC90 0.25 mg/L) was lower than that of other tested antibiotics. Bactericidal activity, defined as a mean growth reduction of ≥3 log10 CFU/mL (≥99.9%), was attained at 24 hours of antibiotic exposure with omadacycline, ceftaroline, levofloxacin, and moxifloxacin at extracellular MICs increasing from 1X MIC to 16X MIC against both Methicillin-Sensitive (MSSA) and Resistant (MRSA) strains of S. aureus. Mean intracellular growth reduction of ≥2 log10 CFU/mL (≥99%) was achieved at 24 hours by omadacycline, levofloxacin, and moxifloxacin at MICs increasing from 2X to 16X MIC against intracellular S. aureus strains (MSSA and MRSA).

Conclusion: Based on the results of this study, omadacycline exhibits potent extracellular and intracellular activity against S. aureus isolates including methicillin- and ciprofloxacin-resistant strains.

Keywords

Omadacycline, Staphylococcus aureus, MIC, Intracellular activity, Tetracycline

Introduction

Staphylococcus aureus is a frequent cause of serious bacterial infections worldwide [1,2]. Skin and skin structure infections have increased in recent years, and the most frequent bacteria were S. aureusor other Gram-positive bacteria [2,3]. Effective management of serious skin infections often is complicated by antibiotic resistance, in particular Methicillin-Resistant Staphylococcus Aureus (MRSA), which accounts for nearly half of all isolates from skin and skin structure infections in the United States [4]. Community-Acquired Pneumonia (CAP) is the most common infectious disease leading to hospitalization and mortality among all age groups, especially the elderly [5, 6]. While S. aureus only is isolated in approximately 2% of cases of CAP, identification of S. aureus as a cause of CAP is associated with poor outcomes and increased mortality [1] and has been reported to be the cause of co-infection in 39%-45% of patients hospitalized with influenza [7].

Infections due to S. aureus often are slow to respond to antibiotics with frequent recurrences and higher mortality [8]. While often thought of as an extracellular pathogen, with inherent problems of antibiotic resistance, new evidence indicates that S. aureus is a facultative intracellular pathogen [8,9], and the combination of antibiotic-resistance and intracellular activity can result in incomplete eradication of S. aureus even with recommended treatment. Intracellular antimicrobial activity may be markedly impaired compared to in vitro activity observed in broth or extracellular media. Thus, assessing both the intracellular and extracellular activity of antibiotics against S. aureus is essential to fully characterize its potential use to treat infections.

Omadacycline, a novel once-daily Intravenous (IV) and oral aminomethylcycline antibiotic, is a semisynthetic tetracycline derivative that exhibits in vitro activity against a range of Gram-positive and Gram-negative aerobes, anaerobes, and atypical bacteria [10,11]. In vitro and in vivo studies demonstrated that omadacycline circumvents the efflux and ribosomal protection mechanisms of tetracycline resistance and has activity against pathogens common in community-acquired infections, including MRSA [12-14]. In addition, evidence from healthy subjects showed that alveolar cell concentrations of omadacycline exceeded plasma concentrations [15].

This study investigated the in vitro activity of omadacycline and comparators against 239 resistant S. aureus including methicillin-resistant (mecA), macrolide-resistant (ermA, B or C) and ciprofloxacin-resistant (gyrA and parC) strains. In addition, the extracellular and intracellular human monocyte activity of omadacycline and comparators against a variety of ATCC S. aureus strains including drug-resistant isolates was determined.

Methods

Drugs

Standard antimicrobial reference powders were provided by the following sources: omadacycline (Lot #CA16-0193) from CarbogenAmcis AG, Bubendorf, Switzerland; ceftaroline from IRIX Pharmaceuticals, Durham, North Carolina; telithromycin from Sanofi Aventis, Montréal, Québec, Canada; doxycycline, tigecycline, linezolid, levofloxacin, moxifloxacin, azithromycin and erythromycin from Sigma Chemicals, Mississauga, Ontario, Canada.

Strains

The strain collection represents a phenotypically and genotypically well-characterized variety of resistant community and hospital-acquired S. aureus strains isolated from 1995 to 2016. Twenty of theses 239 (8%) strains were collected between 1995-2001 and the remainders have been more recently collected during the 2000s.

All strains were grown on Trypticase soy agar (with 5% sheep blood) to produce pure cultures. Genomic DNA was isolated as previously described [16] and multiplex polymerase chain reaction was performed with primers specific for mecA, ermA, ermB, ermC, and mefE [17] or for gyrA and parC [18]. Four ATCC S. aureus strains (two methicillin-sensitive S. aureus (MSSA) strains (ATCC 29213, ATCC 25923) and two methicillin-resistant (MRSA) strains (ATCC 33591, ATCC 43300)) were also used to assess the extracellular and intracellular activity.

In Vitro Activity

The in vitro activity of omadacycline was compared with that of doxycycline, tigecycline, linezolid, ceftaroline, levofloxacin, moxifloxacin, telithromycin, azithromycin, and erythromycin against a total of 239 resistant S. aureus by broth microdilution according to Clinical and Laboratory Standards Institute (CLSI) guidelines [19,20]. The tested strains included S. aureus that were methicillin-resistant (mecA [150]), macrolide-resistant (ermA, B or C [50]), and ciprofloxacin-resistant (gyrA and parC [39]).

Freshly cation-adjusted Mueller-Hinton broth (Becton Dickinson, Cockeysville, MD, USA) supplemented by 2% NaCl (MH) was used as broth medium against resistant S. aureus strains, ATCC S. aureus strains and Quality Control (QC) strain. MIC microplates, containing approximately 5±3 X 10⁵ CFU/mL in MH broth and drug dilutions were incubated at 35±2°C in aerobic conditions and were read after 20-24 hours of incubation. Exclusively to simulate the extracellular and phagolysosomal environments, MIC microplates of MH broth were prepared at pH 7.4±0.1 (original pH of medium) and 5.5±0.1 (modified pH of medium adjusted with 2 N HCl solution) and were tested only against S. aureus ATCC strains (ATCC 29213, ATCC 25923, ATCC 33591 and ATCC 43300)).

The minimum inhibitory concentration (MIC) was defined as the lowest concentration of drug that completely inhibited visible growth after incubation. S. aureus ATCC 29213 was included as a QC strain. For extracellular and intracellular activity, MICs obtained at pH 7.4±0.1 were considered for choosing the tested concentrations.

Determination of extracellular activity

Kill curve experiments against 4 ATCC S. aureus strains (ATCC 25923, ATCC 29213 and ATCC 33591, ATCC 43300) were performed in duplicate by broth microdilution methodology modified from CLSI procedure [21] using flat cell culture microplates. One hundred and fifty microliters of RPMI 1640 medium (with 10% fetal calf serum) with antimicrobial concentrations of 1 to 6 times their MIC was inoculated with log-phase culture of each ATCC S. aureus to final bacterial density of 5±1 X 10⁵ CFU/mL) into each well of culture microplates for a final volume of 300 µL. The bacterial cultures were maintained under stationary conditions for 24 hours at 37±2°C in 5% CO2 and 95% air. Counts of CFU/mL were perf¬ormed on all bacterial cultures at time 0, 2, 6, and 24 hours of incubation in triplicate using Brain Heart Infusion (BHI) agar.

Determination of intracellular human monocyte activity

The intracellular activity of omadacycline was compared against 4 ATCC S. aureus strains (ATCC 25923, ATCC 29213, ATCC 33591 and ATCC 43300). The in vitro method using mononuclear cells [22-24] was performed in duplicate using 48-flat cell well culture microplates using RPMI 1640 medium (with 10% fetal calf serum) and mononuclear cells (THP-1 (ATCC TIB-202) cell line; 2±1 X10⁶ cells/ mL). Logarithmic-phase culture in BHI broth pelleted down at 14000 r.p.m. for 4 min and opsonized by suspending pellets in RPMI 1640 supplemented with non-decomplemented 10% fresh human serum for 30 min at 37±2°C. Opsonized S. aureus were adjusted to 5±1 X10⁵ CFU/mL in RPMI 1640 and phagocytized at a 4:1 ratio of bacteria to THP-1 monocytes. After a 1 hour exposure at 37±2°C in a shaking incubator, the infected cultures were centrifuged (1300 rpm; 8 min) to eliminate non-phagocytized bacteria and were re-suspended in RPMI medium. One hundred and fifty microliters of RPMI with diluted antibiotics at 1, 2, 8 or 16 times the MIC of each ATCC S. aureus strain were added at time 0 into each well of infected culture microplates for a final volume of 300µL. Cultures were maintained under stationary conditions thereafter for 24 hours at 37±2°C in 5% CO2 and 95% air. Monocytes in a 20µl sample taken at each time point from each well were diluted by 10-fold dilutions and lysed with distilled water. Counts of CFU/mL at time 0, 2, 6, and 24 hours were performed on all bacterial cell cultures in triplicate using BHI agar.

Cytotoxicity

The cytotoxicity of omadacycline and comparators was assessed in THP-1 monocytes. After 24 h exposure to antibiotics, even the highest tested concentration (16XMIC) resulted in <1% cells being stained with tryptan blue. This observation suggested that all of the tested antibiotics were non-cytotoxic to THP-1 monocytes.

Results

In vitro Activity

Against all resistant strains of S. aureus, the activity of omadacycline (MIC90 0.25mg/L) was more potent than other tested antibiotics (Table 1). An MIC90 of 0.25mg/L was obtained against methicillin-resistant S. aureus (mecA genotype group) with omadacycline that was comparable to tigecycline (MIC90 0.5mg/L), and more potent than doxycycline (MIC90 1mg/L), ceftaroline (MIC90 1mg/L), linezolid (MIC90 2mg/L), and moxifloxacin(MIC90 4mg/L). An MIC90 of ≥16mg/L was observed with azithromycin, erythromycin, and levofloxacin against methicillin-resistant S. aureus (mecA genotype group). Against macrolide-resistant S. aureus (ermA, B, C genotype group) strains, omadacycline (MIC90 0.25 mg/L) was the most active agent and was more active than telithromycin, azithromycin, and erythromycin (MIC90 ≥4mg/L) or levofloxacin and moxifloxacin (MIC90 4mg/L). Against ciprofloxacin-resistant S. aureus (gyrA and parC genotype group), an MIC90 >16mg/L was observed with levofloxacin, moxifloxacin, azithromycin, and erythromycin. While, the MIC90 for omadacycline (0.25mg/L) remained lower than that of linezolid (MIC90 4mg/L), doxycycline (MIC90 1mg/L), and ceftaroline (MIC90 1mg/L), this was comparable to telithromycin (MIC90 0.25mg/L) and tigecycline (MIC90 0.5mg/L).

Table 1. Susceptibility of resistant S. aureus strains: methicillin-resistant (mecA), macrolide-resistant (ermA, B, C), and ciprofloxacin-resistant (gyrA and parC) strains using MH broth.

Organism (no. tested)

Antibiotic

MICa (mg/L)

Range

50%

90%

S. aureus
All resistant tested strains
(239)

Omadacycline

0.016-1

0.25

0.25

Doxycycline

0.06-≥16

0.5

1

Tigecycline

0.25-1

0.5

0.5

Linezolid

0.5-4

1

2

Ceftaroline

0.06-2

0.5

2

Levofloxacin

0.5-≥16

4

≥16

Moxifloxacin

0.25-≥16

4

≥16

Telithromycin

0.016-≥16

0.12

4

Azithromycin

0.016-≥16

2

≥16

Erythromycin

0.06-≥16

1

≥16

S. aureus
methicillin-resistant
mecAgenotype
(150)

Omadacycline

0.016-0.25

0.25

0.25

Doxycycline

0.06-≥16

0.5

1

Tigecycline

0.25-2

0.5

0.5

Linezolid

0.5-4

1

2

Ceftaroline

0.06-2

0.5

1

Levofloxacin

1-≥16

4

≥16

Moxifloxacin

0.25-≥16

2

4

Telithromycin

0.016-≥16

0.06

0.12

Azithromycin

1-≥16

2

≥16

Erythromycin

0.5-≥16

1

≥16

S. aureus
Macrolide-resistant
ermA, B & C genotype
(50)

Omadacycline

0.06-0.25

0.25

0.25

Doxycycline

0.25-1

1

1

Tigecycline

0.25-1

0.5

0.5

Linezolid

1-4

2

2

Ceftaroline

0.12-2

1

1

Levofloxacin

0.5-4

2

4

Moxifloxacin

0.25-4

1

4

Telithromycin

0.12-≥16

2

4

Azithromycin

4-≥16

≥16

≥16

Erythromycin

8-≥16

≥16

≥16

S. aureus
Ciprofloxacin- Resistant
gyrA&parC genotype
(39)

Omadacycline

0.06-0.25

0.25

0.25

Doxycycline

0.5-1

1

1

Tigecycline

0.25-0.5

0.5

0.5

Linezolid

1-4

2

4

Ceftaroline

0.06-1

0.5

1

Levofloxacin

8-≥16

≥16

≥16

Moxifloxacin

4-≥16

≥16

≥16

Telithromycin

0.016-4

0.06

0.25

Azithromycin

0.016-≥16

0.12

≥16

Erythromycin

0.12-≥16

1

≥16

a MICs determined by broth microdilution according to CLSI guidelines in antibiotic concentrations from 0.004 to 16 mg/L. Geometric mean value (mg/L) for MIC.
MIC: Minimal Inhibitory Concentration

At pH 7.4, the MICs obtained for omadacycline against ATCC S. aureus strains (ATCC 29213, ATCC 25923, ATCC 33591 and ATCC 43300) were from 0.25 to 0.5 mg/L (Table 2). Against the four tested ATCC S. aureus strains, the MICs of omadacycline were comparable to tigecycline (MIC range: 0.12 to 0.5 mg/L) and ceftaroline (MIC range: 0.12 to 2 mg/L). At a pH of 5.5 (phagolysosomal environments), omadacycline MICs were one to two 2-fold serial dilutions higher against ATCC S. aureus strains, which was less active than ceftaroline but comparable to tigecycline, linezolid, levofloxacin, and moxifloxacin.

Table 2. Susceptibility of S. aureus ATCC 25923 and ATCC 33591strains at pH 7.4 and pH 5.5 in MH broth.

Organism tested

pH

MICa (mg/L)

Omadacycline

Tigecycline

Linezolid

Ceftaroline

Levofloxacin

Moxifloxacin

Azithromycin

S. aureus ATCC 25923

7.4

0.5

0.12

2

0.12

0.25

0.06

0.5

5.5

2

0.5

4

0.12

1

0.25

>16

S. aureus ATCC 33591

7.4

0.25

0.25

2

0.5

8

2

>16

5.5

1

2

2

0.25

>16

4

>16

aMICs determined by broth microdilution according to CLSI guidelines in antibiotic concentrations from 0.004 to 16 mg/L. Geometric mean value (mg/L) for MIC.
Only data for strains, S. aureus ATCC 25923and ATCC 33591is shown due to similar data for strains S. aureus ATCC 29213 and ATCC 43300.

Extracellular and Intracellular Activity

Bactericidal activity, defined as mean growth reduction of ≥3 log10 CFU/mL (≥99.9%), was reached at 24 hours of antibiotic exposure with omadacycline, ceftaroline, levofloxacin, and moxifloxacin at increasing extracellular MIC concentrations from 1X to 16X MIC against both MSSA and MRSA ATCC strains (Figures 1-4). At 6 hours, growth reduction (≥2 log10 CFU/mL or ≥99%) of S. aureus (MSSA and MRSA) was detected at 1X to 16X MIC with omadacycline and moxifloxacin, at 1X to 8X (data not shown) MIC with ceftaroline, and at 8X (data not shown) to 16X MIC with linezolid. At 24 hours, growth reduction of S. aureus (MSSA and MRSA) was detected with linezolid at 2X to 16X MIC. Among the tested antibiotics, tigecycline and azithromycin only demonstrated a bacteriostatic activity (growth reduction <2 log10 CFU/mL or <99%) against tested MSSA and MRSA strains.

IMROJ-5-2-513-g001

Figure 1. In vitro extracellular (left) and intracellular (right) activity against S. aureus all tested strains: 2 MSSA (ATCC 29213 & 25923) and 2 MRSA (ATCC 33591 & 43300) with omadacycline (OMC) and comparators (tigecycline (TIG), linezolid (LIN), ceftaroline (CEF), levofloxacin (LEV), moxifloxacin (MOX), azithromycin (AZI)) at 1XMIC from 0-24 hours of incubation. Note that each point corresponds to the mean value of all tested strains determined by triplicate independent counts.

IMROJ-5-2-513-g002

Figure 2. In vitro extracellular (left) and intracellular (right) activity against S. aureus all tested strains: 2 MSSA (ATCC 29213 & 25923) and 2 MRSA (ATCC 33591 & 43300) with omadacycline (OMC) and comparators (tigecycline (TIG), linezolid (LIN), ceftaroline (CEF), levofloxacin (LEV), moxifloxacin (MOX), azithromycin (AZI)) at 2XMIC from 0-24 hours of incubation. Note that each point corresponds to the mean value of all tested strains determined by triplicate independent counts.

IMROJ-5-2-513-g003

Figure 3. In vitro extracellular (left) and intracellular (right) activity against S. aureus all tested strains: 2 MSSA (ATCC 29213 & 25923) and 2 MRSA (ATCC 33591 & 43300) with omadacycline (OMC) and comparators (tigecycline (TIG), linezolid (LIN), ceftaroline (CEF), levofloxacin (LEV), moxifloxacin (MOX), azithromycin (AZI)) at 16XMIC from 0-24 hours of incubation. Note that each point corresponds to the mean value of all tested strains determined by triplicate independent counts.

IMROJ-5-2-513-g004

Figure 4. In vitro extracellular activity (left) and intracellular activity (right) against 2 MRSA strains (ATCC 33591 & 43300) with omadacycline (OMC) at 1X to 16X MIC from 0-24 hours of incubation. Note that each point corresponds to the mean value of 2 MRSA strains determined by triplicate independent counts. Only data of strains MRSA ATCC 33591 and ATCC 43300 is shown due to similar data of strains MSSA ATCC 29213 and ATCC 25923.

Important intracellular activity, mean intracellular growth reduction of ≥2 log10 CFU/mL (≥99%), was achieved at 24 hours by omadacycline and levofloxacin, at increasing concentrations from 2X to 16X MIC against intracellular MSSA and MRSA (Figures 1-4). At 24 hours, intracellular activity, mean intracellular growth reduction of ≥1 log10 CFU/mL (≥90%) but <2 log10 CFU/mL (<99%), against intracellular MSSA and MRSA was detected with omadacycline at 1X MIC, levofloxacin at 1X MIC, moxifloxacin at 1X MIC and 2X MIC, tigecycline at 2X MIC or greater, and linezolid at 8X MIC or greater (data not shown). Unlike omadacycline, growth reduction of intracellular MSSA and MRSA was not modified by increasing concentrations of ceftaroline or azithromycin from 1X to 16X MIC.

Discussion

Results from this study showed that omadacycline exhibits in vitro activity against resistant strains of S. aureus. Omadacycline appeared to have more predominant activity than other older tetracyclines, ketolide, macrolides, quinolones, oxazolidinone or third generation cephalosporin’s against the most resistant isolates such as β-lactam-resistant, erythromycin-resistant or ciprofloxacin-resistant S. aureus. Further, these results revealed that omadacycline has potent extracellular and intracellular activity that was comparable to levofloxacin and moxifloxacin and was higher than tigecycline, linezolid, ceftaroline and azithromycin.

Previously, it was thought that S. aureus only infected the extracellular space, and treatment failure was caused by resistance mechanisms to many antibiotics that were inherent in S. aureus [8]. However, in recent years, S. aureus were discovered to exist in the intracellular space (phagolysosomes) in macrophages, monocytes, and other human cells as well as the extracellular space, which may provide a more complete explanation for failed antibiotic treatment of infections due to S. aureus [8,9,25]. Importantly, the results from this study showed that omadacycline demonstrated not only bactericidal extracellular activity (99.9% of growth reduction) but also produced an intracellular activity (99% of growth reduction) in human monocytes infected with resistant S. aureus. This finding supports the potential clinical activity of omadacycline against a broad variety of S. aureus isolates.

The pharmacokinetics of omadacycline has been studied extensively in healthy volunteers after IV and oral administration [15, 26-29].

Recent studies also provided evidence for the presence of omadacycline in alveolar macrophages of animals and humans [15, 25,30]. The pharmacokinetics of omadacycline and tigecycline were evaluated in plasma, epithelial lining, and alveolar cells of healthy subjects. Subjects received omadacycline 100 mg IV every 12 hours for 2 doses, then 100 mg IV every 24 hours for 3 doses, and concentrations were measured in pulmonary tissues during bronchopulmonarylavage [15]. At the time of bronchoscopy, a mean area under the concentration-time curve (AUC0-24) value of 17.23 mg • h /L and 302.42 mg • h /L was observed respectively in Epithelial Lining Fluid (ELF) or in alveolar cells (AC). Combining the observed mean MIC value (0.5mg/L) at 24 hours to obtain a mean intracellular growth reduction of ≥2 log10 CFU/mL, with the observed mean ELF and AC AUC0–24 values, the estimated AUC0–24/MIC ratio in ELF and AC would be ∼35 and ∼605 for tested ATCC strains of S. aureus, respectively. Results from these studies indicate potent intracellular omadacycline concentrations and confirm that omadacycline produces AUC0-24 in ELF or AC suggesting achievable level at infection site that far exceed the MICs or the potential intracellular activity for a broad variety of S. aureus including resistant isolates included in this study.

Based on the in vitro results of the study reported here, omadacycline exhibits potent extracellular and intracellular activity against MSSA or MRSA. These results combined with extensive in vitro susceptibility studies and pharmacokinetic studies demonstrating consistent systemic exposure after IV and oral dosing are consistent with results from Phase 3 studies. Omadacycline demonstrates consistent efficacy in patients hospitalized with serious infections due to acute Bacterial Skin and Skin Structure Infections (ABSSSI) and CAP caused by S. aureus and other causative pathogens [31,32].

Declarations

Acknowledgment

Editorial support in the form of development of the first draft of the manuscript was provided by Richard Perry, PharmD. Editorial support of the revised manuscript was provided by Theresa E. Singleton, PhD, of Innovative Strategic Communications.

Conflicts of Interest

The author, Jacques Dubois declare conflicts of interest relevant to this study. The authors, Maïtée Dubois, and Jean-François Martel declare no conflicts of interest relevant to this study.

Funding

This work was supported by Paratek Pharmaceuticals, Boston, MA.

Authors’ Contributions

Jacques Dubois, Maïtée Dubois, and Jean-François Martel contributed equally to this study, and to the review and revision of the manuscript. Author order was determined both alphabetically and in order of increasing seniority.

References

  1. Tong SY, Davis JS, Eichenberger E,Holland TL, Fowler VG (2015) Staphylococcus aureus infections: Epidemiology, pathophysiology, clinical manifestations, and management. ClinMicrobiol Rev 28: 603-661. [Crossref]
  2. Dryden M, Andrasevic AT, Bassetti M,Bouza E, Chastre J, et al. (2015) Managing skin and soft-tissue infection and nosocomial pneumonia caused by MRSA: a 2014 follow-up survey. Int J Antimicrob Agents 45 Suppl 1: S1-14. [Crossref]
  3. Moet GJ, Jones RN, Biedenbach DJ,Stilwell MG, Fritsche TR (2007) Contemporary causes of skin and soft tissue infections in North America, Latin America, and Europe: report from the SENTRY Antimicrobial Surveillance Program (1998-2004). DiagnMicrobiol Infect Dis 57: 7-13. [Crossref]
  4. Ray GT, Suaya JA, Baxter R (2013) Incidence, microbiology, and patient characteristics of skin and soft-tissue infections in a US. population: a retrospective population-based study. BMC Infect Dis13: 252. [Crossref]
  5. File TM Jr, Marrie TJ (2010) Burden of community-acquired pneumonia in North American adults. Postgrad Med122: 130-141.
  6. World Health Organization (2014) Antimicrobial Resistance. Global Report on Surveillance. [Crossref]
  7. Chertow DS, Memoli MJ (2013) Bacterial coinfection in influenza. JAMA 309: 275-282. [Crossref]
  8. Sandberg A, Jensen KS, Baudoux P, Bambeke FV, Tulkens PM, et al. (2010) Intra- and extracellular activities of dicloxacillin against Staphylococcus aureus in vivo and in vitro. Antimicrob Agents Chemother 54: 2391-2400. [Crossref]
  9. Sendi P, Proctor RA (2009) Staphylococcus aureus as an intracellular pathogen: the role of small colony variants. Trends Microbiol 17: 54-58.
  10. Pfaller MA, Huband MD, Rhomberg PR,Flamm RK (2017) Surveillance of omadacycline activity against clinical isolates from a global collection (North America, Europe, Latin America, Asia-Western Pacific), 2010-2011. Antimicrob Agents Chemother 61. pii: e00018-17. [Crossref]
  11. Pfaller MA, Rhomberg PR, Huband MD, Flamm RK (2017) Activities of omadacycline and comparator agents against Staphylococcus aureus Isolates from a surveillance program conducted in North America and Europe. Antimicrob Agents Chemother 61. pii: e02411-16. [Crossref]
  12. Draper MP, Weir S, Macone A,Donatelli J, Trieber CA, et al. (2014) Mechanism of action of the novel aminomethylcycline antibiotic omadacycline. Antimicrob Agents Chemother 58: 1279-1283. [Crossref]
  13. Macone AB, Caruso BK, Leahy RG,Donatelli J, Weir S, et al. (2014) In vitro and in vivo antibacterial activities of omadacycline, a novel aminomethylcycline. Antimicrob Agents Chemother 58: 1127-1135. [Crossref]
  14. Tanaka SK, Steenbergen J, Villano S (2016) Discovery, pharmacology, and clinical profile of omadacycline, a novel aminomethylcycline antibiotic. Bioorg Med Chem24: 6409-6419. [Crossref]
  15. Gotfried MH, Horn K, Garrity-Ryan L, Villano S, Tzanis E, et al (2017) Comparison of omadacycline and tigecycline pharmacokinetics in the plasma, epithelial lining fluid, and alveolar cells of healthy adult subjects. Antimicrob Agents Chemother61. pii: e01135-17. [Crossref]
  16. SmithAM, Klugman KP, Coffey TJ, Spratt BG (1993) Genetic diversity of penicillin-binding protein 2B and 2X genes from Streptococcus pneumoniae in South Africa. Antimicrob Agents Chemother37: 1938-1944. [Crossref]
  17. Sutcliffe J, Grebe T, Tait-Kamradt A, Wondrack L (1996) Detection of erythromycin-resistant determinants by PCR. Antimicrob Agents Chemother 40: 2562-2566. [Crossref]
  18. González I, Georgiou M, Alcaide F, Balas D, Linares J, et al. (1998)Fluoroquinolone resistance mutations in the parC, parE, and gyrA genes of clinical isolates of viridans group streptococci. Antimicrob Agents Chemother 42: 2792-2798. [Crossref]
  19. Clinical and Laboratory Standards Institute (CLSI) (2018) Methods for Dilution Antimicrobial Susceptibility Tests for Bacteria That Grow Aerobically; Approved Standard-Eleventh Edition. CLSI document M07-A11. Wayne, PA.
  20. Clinical and Laboratory Standards Institute (CLSI) (2019) Performance Standards for Antimicrobial Susceptibility Testing; Approved Standard – Twenty-ninth Edition. CLSI document M100-S29. Wayne, PA.
  21. CLSI (1999) Methods for Determining Bactericidal Activity of Antimicrobial Agents; Approved Guideline. CLSI document M26-A. Wayne, PA.
  22. Lemaire S, Van Bambeke F, Mingeot-Leclercq MP, Tulkens PM (2005) Activity of three {beta}-lactams (ertapenem, meropenem and ampicillin) against intraphagocytic Listeria monocytogenes and Staphylococcus aureus. J AntimicrobChemother 55: 897-904. [Crossref]
  23. Barcia-Macay M, Seral C, Mingeot-Leclercq MP,Tulkens PM, Bambeke FV (2006) Pharmacodynamic Evaluation of intracellular Activities of Antibiotics against Staphylococcus aureus in a model of THP-1 Macrophages. Antimicrob Agents Chemother 50: 841-851. [Crossref]
  24. Dubois J, Dubois M (2019) Levonadifloxacin (WCK 771) exerts potent intracellular activity against Staphylococcus aureus in THP-1 monocytes at clinically relevant concentrations. J Med Microbiol 68: 1-7. [Crossref]
  25. Lacoma A, Cano V, Moranta D, Regueiro V, Domínguez-Villanueva D, et al. (2017) Investigating intracellular persistence of Staphylococcus aureus within a murine alveolar macrophage cell line. Virulence 8: 1761-1775. [Crossref]
  26. Berg JK, Tzanis E, Garrity-Ryan L, Bai S, Chitra S, et al. (2018) Pharmacokinetics and safety of omadacycline in subjects with impaired renal function. Antimicrob Agents Chemother 62. pii: e02057-17. [Crossref]
  27. Bundrant LA, Tzanis E, Garrity-Ryan L, Bai S, Chitra S, et al (2018) Safety and pharmacokinetics of the aminomethylcycline antibiotic omadacycline administered to healthy subjects in oral multiple dose regimens. Antimicrob Agents Chemother62(2). pii: e01487-17. [Crossref]
  28. Sun H, Ting L, Machineni S, Praestgaard J, Kuemmell A, et al. (2016) Randomized, open-label study of the pharmacokinetics and safety of oral and intravenous administration of omadacycline to healthy subjects. Antimicrob Agents Chemother 60: 7431-7435. [Crossref]
  29. Tzanis E, Manley A, Villano S, Tanaka SK, Bai S, et al (2017) Effect of food on the bioavailability of omadacycline in healthy participants. J ClinPharmacol 57: 321-327. [Crossref]
  30. Lepak AJ, Zhao M, Marchillo K, VanHecker J, Andes DR(2020) In vivo Pharmacodynamic evaluation of omadacycline against Staphylococcus aureus in the neutropenic mouse pneumonia model. Antimicrob Agents Chemother 64. pii: e02058-19. [Crossref]
  31. Stets R, Popescu M, Gonong J et al (2017) A phase 3, randomized, double-blind, multi-center study to compare the safety and efficacy of IV to oral omadacycline to moxifloxacin for the treatment of adult patients with CABP (the OPTIC study). Abstr 1883, ID Week, San Diego, California, USA.
  32. O’Riordan WA, Green S, Overcash JS (2017) A phase 3 randomized, double-blind, multi-center study to compare the safety and efficacy of oral and IV omadacycline to linezolid for treating adult subjects with ABSSSI (the OASIS study). Abstr. 630. 27th European Congress of Clinical Microbiology and Infectious Diseases (ECCMID), Vienna, Austria.

A Correlational Model of Sadomasochistic Fantasies and Psychosocial Features among Male and Female Medical University Students

DOI: 10.31038/AWHC.2020332

Abstract

Background: Sadomasochistic fantasies are often stigmatized and not easily disclosed to friends and family members. Although the nature of these fantasies is still incompletely understood, more frequent unconventional sexual fantasies seem to be associated with male gender with non-heteronormative sexual orientation and with higher educational level.

Methods: This was a cross-sectional study in which subjects provided information through a self-reported questionnaire in a face-to-face interview. This tool included questions assessing sociodemographic characteristics, the Beck Depression Inventory, and the subscale “sadomasochistic fantasies” of the Wilson Sexual Fantasy Questionnaire. A total of 412 medical students aged 18 and over attending first through sixth year at a medical school were randomly selected and recruited to participate.

Results: Non-heteronormativity and illicit drug use were directly and positively correlated with higher scores on sadomasochistic sexual fantasies. In addition, non-heteronormativity was a mediator variable in the model between being male and having higher scores on sadomasochistic sexual fantasies.

Conclusion: It is possible that unconventional sexual fantasies are more frequent in certain social groups, such as non-heteronormative males with high educational level. Although the use of psychoactive substances was correlated with sadomasochistic sexual fantasies, there are scarce scientific data to support this finding.

Keywords: Sadomasochistic fantasies, University Students,Heteronormativity

Introduction

The deliberate act of mentally envisioning a sexual scenario involving a target and/or behavior is a normal part of human sexuality. The content of the mental imagery or sexual fantasy frequently reflects one’s sexual interest and is experienced as sexually arousing [1]. In fact, some studies have shown a positive correlation between the experience of arousing sexual fantasies and sexual satisfaction [2].

There are important reasons for studying the diversity of sexual fantasies. First, although sexual fantasies are universally experienced, they can affect sexual behavior; second, sexual fantasies can be influenced by what people have previously seen, read, or done; third, repetitive sexual fantasies can help to shape our sexual schema or script; fourth, as sexual fantasies are private, they may be more revealing than actual behavior [1]. In sum, sexual fantasies can reflect our sexual behavior, which in turn can reflect them.

Of the enormous variety of sexual fantasies, sadomasochistic fantasies are often stigmatized and not easily disclosed to friends and family members by the fantasizers [3,4]. In addition, individuals with ingrained sadomasochistic sexual fantasies might need to reshape their identity to cope with shame, guilt, self-labeling, and self-hatred, and might need to overcome phases of dissatisfaction and depression before assuming or even expressing these sexual fantasies [5].

In fact, sadism and masochism have also been stigmatized medically. It was only in the 1970s and 1980s that a growing body of studies from the social sciences took a non-pathological view of sadomasochistic fantasies, practices, and behaviors [6]. Studies of consensual sadomasochistic practices have shown the healthy aspects of this behavior, such as improvement of intimacy between practitioners and greater creative stimulation [7]. In addition, associations of sadomasochistic practices with mental instability, depression, anxiety, and antisocial or psychotic traits have not been supported [8, 9]. Thus, since the latest edition of the Diagnostic and Statistical Manual of Mental Disorders [10] the terms sexual sadism and sexual masochism were changed to sexual sadism disorder and sexual masochism disorder in order to draw a line between non-pathological and pathological sexual behavior. In truth, one of the most important distinctions between deviant and normal sadomasochistic behavior is the presence or lack of consent. This perspective is also assumed within sadomasochistic communities, where consensual play and sex are unbreakable principles [11]. Despite this, the nature of sadomasochism is still incompletely understood, even though many studies have applied a broad variety of qualitative and quantitative methods [12].

Despite the demedicalization of consensual sadomasochistic behaviors, we should nonetheless consider that certain psychosocial factors seem to be linked to a higher diversity of sexual fantasies and practices in general. Higher diversity of sexual practices is consistently found to be associated with male gender, non-heteronormative sexual orientation, and higher educational level [13-16]. Considering these findings, nonclinical clusters of people with more intense unconventional sexual fantasies could be grouped into certain socio-demographic profiles [17]. In a somewhat different way, some studies have suggested that, although men show more frequent sadomasochistic fantasies, there are a large number of women in sadomasochistic communities [18-20]. In addition, [21] contends that “those who are most attracted to masochism may be the women (…). The women turn to masochism to live out the humiliation, the submission that they no longer have to endure anywhere else, or to remind themselves of other realities.” Based on these contrasting assumptions, it is possible that there is a mediator variable between biological sex and sadomasochistic sexual fantasies.

Still considering differences between sadomasochistic fantasizers and non-fantasizers, drug use has been scarcely investigated. It is important to note that it is possible that some sexual fantasies or feelings may be related to urges or cravings for drugs. Many drug users become trapped in a “reciprocal relapse” pattern in which a sexual behavior precipitates relapse to drugs and vice-versa [22]. According to some sadomasochistic communities, “just as in the greater population, there are many people in these communities who identify as clean and sober, and there are many who do not” [23]. This statement demonstrates the heterogeneity of those that have sadomasochistic sexual fantasies in terms of drug use. Examining such heterogeneity, a study with 164 sadomasochistically oriented males showed that the use of psychoactive substances before or during sadomasochistic sessions is not negligible. About 26%, 17%, and 5% of the participants of this sample admitted to using alcohol, poppers, and marijuana, respectively [24]. It is important to note here that poppers (volatile nitrites) are forbidden for recreational use in Brazil by the Brazilian Health Regulatory Agency (volatile nitrites are approved for use only for industrial purposes).

Also in line with other studies linking psychological problems with unconventional sexual fantasies, an association of traumatic childhood with sadomasochism and intermittent depression has been suggested [25]. In truth, depression symptoms can consist of a phase that individuals with sadomasochistic fantasies have to overcome before accepting and expressing them. Although these mental problems, drug use and depressive symptoms, may be directly or indirectly associated with unconventional sexual fantasies and behaviors, there does not seem to be any causal nexus. That said, we understand that sexual science would benefit from more systematic assessments of sadomasochistic fantasies and behaviors in clinical and nonclinical samples.

This study aimed to investigate whether psychosocial aspects, such as male gender and non-heteronormative sexual orientation, are associated with more frequent sadomasochistic sexual fantasies. In addition, we evaluated whether drug use and depressive symptoms are correlated with these sexual fantasies in a nonclinical sample of university students.

Method

Procedure

Permission to use the Wilson Sexual Fantasy Questionnaire (WSFQ) was obtained from the instrument’s marketers (CymeonTM Research, Sydney, Australia). Prof. Glenn Wilson was also contacted by our staff, and he referred us to the CymeonTM Research team. The original version was translated using the standard processes of back translation [26]. The English version of the instrument was translated into Portuguese by a team including one professor, four psychiatrists, and two psychologists with experience in sexual disorders and competency in both English and Portuguese languages, and two independent bilingual native speakers. The staff worked collaboratively to ensure that the instrument had semantic equivalence across the languages and conceptual equivalence across cultures. The translation coordinator compared both versions and reconciled any differences. Finally, the team compiled the Portuguese version and chose the most appropriate wording for clarity and similarity to the original. The final Portuguese version was formalized after the team discussed culturally problematic issues.

The Portuguese version was then independently translated back to English by two separate translators, neither of whom had previously seen the original scale. The back-translated versions were also evaluated and discussed by the team. A pilot study was then performed on a small sample (N = 10) of healthy individuals from diverse educational levels to examine whether any items on the WSFQ were perceived as difficult. No problematic items requiring revision were found.

Subsequently, a cross-sectional study was conducted to investigate associations or correlations between some psychosocial variables, mainly among those potentially related to unconventional sexual fantasies, such as biological sex, sexual orientation, illicit drug use, and depression. The investigators were specially trained medical graduate and postgraduate students. This study was approved by the Ethics Committee of ABC Medical School, Santo André, São Paulo, Brazil.

Participants

Between November 2016 and August 2019, a total of 412 medical students aged 18 and over attending the first through sixth year at one medical school were randomly selected and recruited to participate in this study. They were assured that their participation was voluntary, that only the researchers would see the data, and that all data would be kept confidential. A financial reward was not provided because this is not allowed under Brazilian law.

Important participant outcomes were compared based on 11 variables: biological sex, age, race or ethnicity, marital status, lifetime alcohol use, lifetime illicit drug use (marijuana, poppers, and cocaine were grouped into just one group), family members with alcohol use problems, family members with illicit drug use problems, sexual orientation, scores on depression symptoms, and scores on sadomasochistic sexual fantasies. Sex was coded as male, female, and intersex. Monthly income was not coded because our participants follow a full-time course of study.

Measures

This was a cross-sectional study in which subjects provided information through a self-reported questionnaire. This tool included questions assessing sociodemographic characteristics and the following inventories: The Beck Depression Inventory and the subscale “sadomasochistic fantasies” of the Wilson Sexual Fantasy Questionnaire.

The Beck Depression Inventory (BDI)

This inventory measures behavioral responses related to depression among adults and adolescents. In this 21-item instrument, scores above 10 (score range: 0–63) indicate the presence of a depressive syndrome [27, 28]. A sensitivity of 100% and specificity of 0.83 are obtained with a cut-off score of 9/10.

The Wilson Sex Fantasy Questionnaire (WSFQ)

This questionnaire is a 40-item self-report measure of sexual fantasies comprising a range of sexual themes “from the normal to the deviant and potentially harmful” [29]. Each item is scored on a four-point scale ranging from Never (0) to Often (3) across five different contexts (e.g., Daytime fantasies, Fantasies during intercourse or masturbation, Dream while asleep, Have done in reality, and Would do in reality). When assessing the frequency of sexual fantasy use, it is considered advisable only to use responses for Daytime fantasies, since scores for the other four contexts are highly correlated with Daytime dreams [30, 31]. Four subscales are derived from this instrument, including intimate (e.g., kissing passionately, having intercourse with a loved partner, being masturbated to orgasm by a partner), impersonal (e.g., sex with strangers, watching others having sex, fetishism), exploratory (e.g., group sex, promiscuity, mate-swapping), and sadomasochistic sexual fantasies (e.g., whipping or spanking, being forced to have sex). Each subscale has 10 items and this 4-factors structure has demonstrated consistency across multiple assessments [32, 33]. In line with the aims of this study, we only used the sadomasochistic sexual fantasy subscale. The following question was constructed for the participants: How often do you fantasize about the theme below at various times?

Analysis

Univariate analyses were used to compare the sociodemographic and psychometric features between men and women and between heteronormative and non-heteronormative participants. Categorical variables were compared using the χ2 or Fisher’s exact tests, following the Monte Carlo method. Continuous variables were compared using Student’s t-test.

In order to develop a correlational model, we performed a Structural Equation Modelling (SEM). Maximum likelihood estimation was used to estimate the fit of the model. TheComparative Fit Index (CFI), Tucker-Lewis Index (TLI), Goodness of Fit Index (GFI), Adjusted GFI (AGFI), Root Mean Square Error of Approximation (RMSEA), and Standardized Root Mean Square Residual (SRMR) were used to evaluate model fit. Some standard recommendations regarding values for global model fit were followed. Specifically, CFI, TLI, GFI, and AGFI values greater than 0.90 and RMSEA and SRMR values lower than 0.08 were deemed indicative of acceptable model fit [34, 35]. As the chi-square value is dependent on the sample size, we calculated the ratio of chi-square to the degrees of freedom (c2/df), where a value of 2 or lower is an acceptable c2/df ratio [36].

Results

Of the questionnaires applied, 8 (1.94%) were discarded due to incomplete answers, leaving 402 participants. Of the participants, 200 (49.75%) were male and the mean age of the total sample was 21.45 (SD = 2.35) years old. Our sample had neither intersex nor transgender participants.

Descriptive analysis

As it is shown in Table 1, when biological male and female respondents were compared, male students showed more frequent non-heteronormative sexual orientation, and female students demonstrated higher mean scores on the BDI. There were no significant differences between the sexes in age, marital status, alcohol and illicit drug use, family members with alcohol and drug use problems, or mean scores on sadomasochistic sexual fantasies. As shown in Table 2, when heteronormative and non-heteronormative students were compared, those that admitted to non-heteronormativity demonstrated higher scores on the BDI and on sadomasochistic sexual fantasies, and more frequent family members with alcohol use problems. There were no statistically significant differences regarding the other psychosocial variables.

Table 1. Psychosocial and Psychometric features between male and female Medical University students.

Variables

Male
(n = 200)

Female
(n = 204)

Test

p

Age, mean (SD)

21.56 (2.54)

21.34 (2.16)

t = 0.90, 402df

0.90

Race, n (%)
White
Non-white

173 (86.50)
27 (13.50)

165 (80.88)
39 (19.12)

χ2 = 2.33, 1df

0.13

Marital status, n (%)
Single
Married /Common-law

198 (99)
2 (1)

200 (98.04)
4 (1.96)

χ2 = 0.64, 1df

0.43

Alcohol use, n (%)

163 (81.50)

176 (86.27)

χ2 = 1.71, 1df

0.19

Illicit drug use, n(%)

60 (30)

54 (26.47)

χ2 =0.62, 1df

0.43

Family members with alcohol use problems, n (%)

61 (30.50)

53 (25.98)

χ2 = 1.02, 1df

0.31

Family members with illicit drug use problems, n (%)

34 (17)

32 (15.69)

χ2 = 1.28, 1df

0.72

Sexual orientation, n (%)
Heteronormative
Non-heteronormative

180 (90)
20 (20)

195 (95.59)
9 (4.41)

χ2 = 4.73, 1df

0.03*

BDI, mean (SD)

5.78 (4.97)

8.36 (6.43)

t = -4.50, 402df

< 0.01**

Sadomasochistic fantasies, mean (SD)

4.01(4.01)

4.43 (3.36)

t = -1.13, 402df

0.26

Note: * p < 0.04; ** p < 0.01; BDI = Beck Depression Inventory

Table 2. Psychosocial and Psychometric features between Medical University students in accordance with the sexual orientation.

Variables

Heteronormative
(n = 375)

Non-Heteronormative
(n = 29)

Test

p

Age, mean (SD)

21.46 (2.38)

21.35 (1.97)

t = 0.25, 402df

0.81

Race, n (%)
White
Non-white

314(83.73)
61 (16.27)

24 (68.96)
5 (17.24)

χ2 = 0.19, 1df

0.80

Marital status, n (%)
Single
Married /Common-law

369 (98.40)
6 (1.60)

29 (100)
0 (0)

χ2 = 0.47, 1df

>0.99

Alcohol use, n (%)

314 (83.73)

25 (86.21)

χ2 = 0.12, 1df

0.73

Illicit drug use, n(%)

104 (27.33)

10 (34.48)

χ2 =0.61, 1df

0.44

Family members with alcohol use problems, n (%)

99 (26.40)

15 (51.72)

χ2 = 8.52, 1df

<0.01**

Family members with illicit drug use problems, n (%)

59 (15.73)

07 (24.14)

χ2 = 1.39, 1df

0.24

BDI, mean (SD)

6.89 (5.94)

9.59 (4.66)

t = -2.39, 402df

0.02*

Sadomasochistic fantasies, mean (SD)

4.11(3.58)

5.62 (4.81)

t = -2.13, 402df

0.03*

Note: * p < 0.04; ** p < 0.01; BDI = Beck Depression Inventory

SEM analysis

For the purposes of our SEM analysis, items were loaded uniquely on their respective factors and the factor loadings were fixed at 1.0. The sample was then evaluated using bootstrapping (800 bootstrap samples) with the Bollen-Stine Bootstrap statistic being calculated to verify absolute fit. As shown in Figure 1, the model fitted the data well, with c2/df= 0.69; CFI = 0.99; TLI = 0.99; GFI = 0.99; AGFI = 0.98; RMSEA = 0.012 [95% CI = 0.010-0.191]; SRMR = 0.02; and a Bollen-Stine statistic of p = 0.51.

AWHC-3-3-316-g001

Figure 1. Psychosocial and psychometric features correlated with sadomasochistic fantasies.

This model showed that non-heteronormativity and illicit drug use were directly and positively correlated with higher scores on sadomasochistic sexual fantasies. In addition, this model showed that non-heteronormativity was a mediator variable between having family members with alcohol problems and higher scores on sadomasochistic sexual fantasies. Furthermore, the variables of female sex and non-heteronormativity were directly and positively correlated with higher scores on depression. Non-heteronormativity also mediated the correlation between female sex and higher scores on depression.

Discussion

This study supports previous ones that have shown no correlation between depression symptoms and sadomasochistic fantasies, and that non-heteronormative persons have a higher frequency of these sexual fantasies. In addition, it found a correlation between illicit drug use and sadomasochistic fantasies.

Being male was not correlated with more frequent sadomasochistic sexual fantasies; however, being male was correlated with non-heteronormativity, which in turn was correlated with these unconventional sexual fantasies. We should consider that non-heteronormativity was a mediator variable between being male and having more frequent sadomasochistic fantasies in the correlational model. That said, it is possible that unconventional sexual fantasies are more frequent in certain social groups, such as non-heteronormative males with high educational level.

With regard to drug use, there is scarce evidence of an association with unconventional sexual fantasies. A few studies have investigated this use among sadomasochistically oriented people [24] and therefore it is necessary to devote greater attention to this theme, since our study shows a positive and direct correlation. It is possible that users of a variety of psychoactive substances experience strong aphrodisiac effects and disinhibition. This combination may result in obsessive pornography viewing, diverse sexual fantasies (including unconventional ones), and unsafe sexual practices [37]. Nonetheless, there is no definitive link between “kinky” sex and drug use to date.

Although comparisons between male and female and between heteronormative and non-heteronormative students in terms of depression symptoms were not the main goal of this study, the higher mean scores on depression in females than in males, mainly among young people [38-40] and in non-heteronormative persons [41-43] are widely supported in the scientific literature. Furthermore, studies have demonstrated that sexual minorities show a higher risk of having a family history of alcohol use problems than heterosexuals [44, 45]. Although the interpretation of this last association is politically sensitive [46] the fact is that this study does not show a causal relationship between sexual orientation and parental problems. It is possible to say here that non-heteronormative students may show higher self-reflection during the coming-out process or have a desire to endorse their own sexual orientation, leading them to reveal this fact more emphatically [47].

Although some authors have found significant associations between non-heteronormativity and alcohol and/or illicit drug use [48, 49] our study was not able to show this type of association. It is possible that given the notable and welcome reduction of the stigma, shame, and secrecy surrounding non-heteronormativity, the differences in the incidence of alcohol and drug use may be diminishing between heterosexuals and homosexuals/bisexuals. Also, the social context where people live can have a notable influence on the differences between heteronormative and non-heteronormative persons regarding alcohol and drug use [50] and this sample consisted of university students at a private institution.

In addition, the correlation between being male and non-heteronormative is not surprising. In Brazil, like in other diverse countries, the prevalence of homosexuals and bisexuals is higher in men, that is, almost 6% of males identify as gay and 2% identify as bisexual, while almost 3% of women identify as lesbian and 1% as bisexual [51].

This study showed that sadomasochistic fantasies in this sample of university students are more frequent in a group characterized by a non-heteronormative sexual orientation and reporting drug use. Although the first assertion has empirical support, the drug use among fantasizers needs further investigation.

There are several limitations in this study that need to be pointed out:

a) Response accuracy of research using self-response questionnaires may be less than fully satisfactory;

b) The university population is unrepresentative of the general population; and

c) The study’s cross-sectional design precludes drawing causal inferences and only provides information about population frequency and characteristics in a “snapshot” at a specific time.

References

  1. Leitenberg H, Henning K(1995) Sexual fantasy. Psychological Bulletim117: 469-496.
  2. Colon Vilar G, Concepcion E, Galynker I, Tanis T, Ardalan F, et al.(2016) Assessment of sexual fantasies in psychiatric inpatients with mood and psychotic disorders and comorbid personality disorder traits. The Journal of Sex Medicine 13:262-269.[Crossref]
  3. Bezreh T, Weinberg TS, Edgar T (2012) BDSM disclosure and stigma management: Identifying opportunities for sex education. American Journal of Sexuality Education7: 37-61.[Crossref]
  4. Wright, S. (2006). Discrimination of SM-identified individuals. Journal of Homosexuality, 50, 217-231.
  5. Kamel GWL (1983) The leather career: On becoming a sadomasochist. In T. K. Weinberg (Ed.), S and M: Studies in sadomasochism. Buffalo: Prometheus Books.
  6. Weinberg TS (2006) Sadomasochism and the social sciences: A review of the sociological and social psychological literature. Journal of Homosexuality 50: 17-40.[Crossref]
  7. Williams DJ (2009) Deviant leisure: Rethinking “the good, the bad, and the ugly”. Leisure Science31: 207-213.
  8. Connoly PH (2006) Psychological functioning of Bondage Domination Sado-Masochism (BDSM) practitioners. Journal of Psychology & Human Sexualitys 18: 79-120.
  9. Cross PA, Matheson K (2006) Understanding sadomasochism: An empirical examination of four perspectives. Journal of Homosexuality, 50: 133-166.[Crossref]
  10. American Psychiatric Association. (2013)Diagnostic and statistical manual of mental disorders (5th edn.). Washington: Author.
  11. Sagarin BJ, Cutler B, Cutler  N, Lawler-Sagarin KA, Matuszewich L (2009) Hormonal changes and couple bonding in consensual sadomasochistic activity. Archives of Sexual Behavior38: 186-200.[Crossref]
  12. Weierstall R, Giebel G (2017) The sadomasochism checklist: A tool for the assessment of sadomasochistic behavior. Archives of Sexual Behavior, 46: 735-745.[Crossref]
  13. Bhugra DRB,  Rahul B (2006) Sexual fantasy in gay men in India: A comparison with heterosexual men. Sexual and Relationship Therapy21: 197-207.
  14. Gagnon JH, Simon W (1987) The sexual scripting of oral genital contacts. Archives of Sexual Behavior16: 1-25.[Crossref]
  15. Moser C, LevittEE (1987) An exploratory-descriptive study of a sadomasochistically oriented sample. The Journal of Sex Research23: 322-337.
  16. Nordling N, Sandnabba NK, Santtila P, Alison L (2006) Differences and similarities between gay and straight individuals involved in the sadomasochistic subculture. Journal of Homosexuality50: 41-57.[Crossref]
  17. Joyal CC (2015) Defining “normophilic” and “paraphilic” sexual fantasies in a population-based sample: On the importance of considering subgroups. Sexual Medicine3: 321-330.[Crossref]
  18. Breslow N, Evans L, Langley J (1985) On the prevalence and roles of females in the sadomasochistic subculture: Report of an empirical study. Archives of Sexual Behavior 14: 303-317. [Crossref]
  19. Holvoet L, Huys W, Coppens V, Seeuws J, Goethals K, e (2017) Fifty shades of Belgian gray: The prevalence of BDSM-related fantasies and activities in the general population. The Journal of Sex Medicine14: 1152-1159.[Crossref]
  20. Rehor JE (2015) Sensual, erotic, and sexual behaviors of women from the “kink” community. Archives of Sexual Behavior44: 825-836.[Crossref]
  21. Phillips A (1998)A Defence of Masochism. London: Faber and Faber Ltda.
  22. Washton AM, Stone-Washton N (1993) Outpatient treatment of cocaine and crack addiction: A clinical perspective. Washington: National Institute on Drug Abuse (NIDA).
  23. Ortmann DM, Sprott RA (2013)Sexual outsiders: Understanding BDSM sexualities and communities.Toronto: Rowman & Littlefield Publishers.
  24. Sandnabba NK, Santilla P, Nordling N (1999) Sexual behavior and social adaptation among sadomasochistically-oriented males. Journal of Sex Research36: 273-282.
  25. Gabriel JBS (2007) Early trauma in the development of masochism and depression. International Forum of Psychoanalysis 6: 231-236.
  26. Guillemin F, BombardierC, Beaton D (1993) Cross-cultural adaptation of health-related quality of life measures: Literature review and proposed guidelines. Journal of Clinical Epidemiology46: 1417-1432.[Crossref]
  27. Beck AT, Rial WY, Rickels K (1974) Short form of depression inventory: Cross-validation. Psychological Reports 34: 1184-1186. [Crossref]
  28. Furlanetto LM, Mendlowicz MV, Romildo Bueno J (2005) The validity of the Beck Depression Inventory-Short Form as a screening and diagnostic instrument for moderate and severe depression in medical inpatients. Journal of Affective Disorder86: 87-91. [Crossre]
  29. Wilson G (1988) Measurement of sex fantasy. Sex and Marital Therapy3: 45-55.
  30. Bartels RM, Lehmann RJB, Thornton D (2019) Validating the utility of the Wilson Sex Fantasy Questionnaire with men who have sexually offended against children. Frontiers in Psychiatry10: 206. [Crossref]
  31. Wilson G (1978)The Secrets of Sexual Fantasy.Toronto: JM Dent & Sons Ltda.
  32. Plaud JJ, Bigwood SJ (1997) A multivariate analysis of the sexual fantasy themes of college men. Journal of Sex & Marital Therapy23: 221-230.[Crossref]
  33. Sierra JC, Ortega V, Zubeidat I (2006) Confirmatory factor analysis of a Spanish version of the sex fantasy questionnaire: Assessing gender differences. Journal of Sex & Marital Therapy32: 137-159.
  34. Gilson KM, Bryant C, Bei B, Komiti A, Jackson H, et al., (2013) Validation of the Drinking Motives Questionnaire (DMQ) in older adults. Addictive Behaviors38: 2196-2202.[Crossref]
  35. Hu L, Bentler PM (1999) Cutoff criteria for fit indexes in covariance structure analysis: Conventional criteria versus new alternatives. Structural Equation Modeling6: 1-55.
  36. Tabachnick BG, Fidell LS (2007)Using Multivariate Statistics.Boston: Pearson Education.
  37. Slavin MN,  Kraus SW, Ecker A, Sartor C, Blycker GR, et al., (2017) Marijuana use, marijuana expectancies, and hypersexuality among college students. Sexual Addiction & Compulsivity24: 248-256.[Crossref]
  38. lbert PR (2015) Why is depression more prevalent in women? [Editorial]. Journal of Psychiatry Neurosciences40:219-221.[Crossref]
  39. Cyranowski JM, Frank E, Young E,  Shear MK (2000) Adolescent onset of the gender difference in lifetime rates of major depression: A theoretical model. Archives of General Psychiatry57: 21-27. [Crossref]
  40. Ford DE, Erlinger TP (2004)Depression and C-reactive protein in US adults: Data from the Third National Health and Nutrition Examination Survey. Archives of Internal Medicine164: 1010-1014.[Crossref]
  41. King M, Semlyen J, Tai SS, Killaspy H, Osborn D, et al., (2008) A systematic review of mental disorder, suicide, and deliberate self harm in lesbian, gay and bisexual people. BMC Psychiatry8: 70.[Crossref]
  42. Lee C, Oliffe JL, Kelly MT, Ferlatte O (2017) Depression and suicidality in gay men: Implications for health care providers. American Journal of Men`s Health11: 910-919.[Crossref]
  43. Pompili M, Lester D, Forte A, Seretti ME, Erbuto D, et al., (2014) Bisexuality and suicide: A systematic review of the current literature. The Journal of Sexual Medicine11: 1903-1913.[Crossref]
  44. McCabe SE, West BT, Hughes TL, Boyd CJ (2013) Sexual orientation and substance abuse treatment utilization in the United States: Results from a national survey. Journal of Substance Abuse Treatment44: 4-12.[Crossref]
  45. McCabe SE, West BT, Hughes TL, Boyd CJ (2013) Sexual orientation and substance abuse treatment utilization in the United States: Results from a national survey. Journal of Substance Abuse Treatment44: 4-12.[Crossref]
  46. Roberts AL, Glymour MM, Koenen KC (2013) Does maltreatment in childhood affect sexual orientation in adulthood? Archives of Sexual Behavior42: 161-171.[Crossref]
  47. Corliss HL, Cochran SD,  Mays VM (2002) Reports of parental maltreatment during childhood in a United States population-based survey of homosexual, bisexual, and heterosexual adults. Child Abuse & Neglect 26: 1165-1178.[Crossref]
  48. Green KE,  Feinstein BA (2012) Substance use in lesbian, gay, and bisexual populations: An update on empirical research and implications for treatment. Psychology of Addictive Behaviors26:265-278.[Crossref]
  49. Hughes T, McCabe SE, Wilsnack SC, West BT, Boyd CJ (2010) Victimization and substance use disorders in a national sample of heterosexual and sexual minority women and men. Addiction105: 2130-2140.[Crossref]
  50. Duncan DT, Hatzenbuehler ML, Johnson RM (2014) Neighborhood-level LGBT hate crimes and current illicit drug use among sexual minority youth. Drug and Alcohol Dependence135: 65-70.[Crossref]
  51. Abdo C (2004)Estudo da vida sexual do brasileiro (Study on the Sexual Life of Brazilians) (1st edn.). São Paulo: Bregantini.

A comparison of external pelvic chemoradiation and high dose-rate conventional brachytherapy (BT) and image-guided adaptive brachytherapy (IGABT) in treatment of advanced cervical carcinomas

DOI: 10.31038/AWHC.2020331

Abstract

Purpose: External pelvic chemo-radiotherapy and brachytherapy were studied in a consecutive series of advanced cervical carcinomas. Conventional brachytherapy and image-guided adaptive brachytherapy were compared.

Material and Methods: From a single regional cancer center 272 consecutivepatients with advanced cervical cancer were recruited. One hundred thirty-four patients were treated with external beam radiotherapy and conventionalconformal brachytherapy (BT) and 138 patients with image-guided adaptive brachytherapy (IGABT). A comprehensive dosimetric study was performed in the IGABT-group.Predictive and prognostic factors were defined. Toxicity of the organs at risk were evaluated by the CTCAE-grading system.

Results: The mean follow-up was 59 months. Tumor size was in mean 43 mm. The mean external dose was 52 Gy and the total dose to the clinical target volume was 78 Gy. Sixty-five percent of the patients received weekly cisplatin. The mean overall treatment time was 44 days. The median number of brachytherapy fractions was four and in 86 patients in the IGABT-group interstitial needles were applied. The primary local control was 98%. The overall pelvic control was 86%. The overall recurrence rate was 29%. The overall 5-year survival rate was 65% and cancer-specific survival rate 69%. Prognostic factors were O-stage, pelvic and distant control of the disease. Late serious toxicity of the bladder and intestine were rare with only 3% in the IGABT-group.

Conclusion: The local and pelvic controls were excellent. The IGABT was an important part of the treatment schedule with regard to large tumors and adenocarcinomas. Late toxicity was significantly lower after treatment with IGABT compared with BT.

Keywords

Cervical cancer; Conventional brachytherapy (BT); Image-guided adaptive brachytherapy (IGABT); Chemo-radiotherapy; Local tumor control; Survival; Toxicity

Introduction

Cervical cancer is the fourth most frequently diagnosed cancer and the fourth leading cause of death among women worldwide [1]. Human papillomavirus (HPV) infection is an important and common risk factor for developing cervical carcinomas [2]. Other factors, e.g. immunosuppression (HIV), smoking and a higher number of full-term pregnancies also contribute to increased risk [1].

The histological subtypes are divided into three types: squamous cell carcinomas in 70-80%, adenocarcinomas in 20-25%, and other epithelial cancers the remaining cases [2].

Cervical cancer incidence has decreased during the last decades, mainly due to screening programs. In the Nordic countries, among them Sweden, screening may have prevented 40-50% of the expected cases [3]. Screening programs also detect premalignant lesions and global variation in cervical cancer in part reflects the variation for women to take part in these programs [2]. New HPV vaccines may further reduce cervical cancer incidence [2].

FIGO stage is one of the most important prognostic factors [2].Surgery is the main treatment in early stages (FGIO I-IIA). In FIGO stage IB2-IVA, considered as locally advanced disease, the standard of treatment is a combination of radiochemotherapy and brachytherapy. Cisplatin, given once-week in the dose 40 mg/m2, is the most common chemotherapy used [2]. Addition of concomitant chemotherapy has increased the survival rate [4, 5, 6].

Brachytherapy has improved management of cervical carcinomas, allowing a higher dose to the tumor without increasingtoxicity of the risk organs (bladder,recto-sigmoid and vagina).Intracavitary brachytherapy in combination with external beam therapy and concurrent chemotherapy was shown to have good results regarding local control [7]. A previous study showed an increase in overall survival rate of this combination compared to external beam therapy with an external boost [8].

Early radiation reactions were less prevalent among those treated with brachytherapy compared to those given an external boost, but late toxicity was similar [8].

While comparing image guided adaptive brachytherapy (IGABT) given with only intracavitary applicator (ring or ovoid applicators) with a combination of intracavitary and interstitial applicators, side effects regarding bladder and bowel were similar, but late vaginal side effects were slightly more prevalent among those who had received interstitial applications [9].

Among predictive factors for radiation side effects there seemed to be anassociation between the width and lateral extent of the external pelvic radiotherapy fields and early side effects, especially early symptoms from the bladder and bowel. For late side effects the same predictive factors regarding external radiotherapy was found, but also, it was shown that prior abdominal surgery increased the risk for late side effects. However, concomitant cisplatin did not increase the risk of side effects [10].

The aim of the present study was to compare an older conformal brachytherapy (BT) technique with a newer image-guided adaptive brachytherapy (IGABT) based on MRI image planning with regard to treatment outcome (local control and cancer-specific survival rate) and side effects of the organs at risk.

Material and methods

Patients and tumors

Two consecutive series of 134 (BT-group) and 138 (IGABT-group) cervical carcinomas treated with combined external (± chemotherapy) and intracavitary radiotherapy during the period January 1, 1993 and December 31, 2016 were included in this prospective series (Table 1). Patients treated with surgery or only external radiotherapy were not included in this study. In an older series (1993-2006) conventional 2-D conformal brachytherapy (BT) was used and in a later series (2010-2016) 3-D image-guided adaptive brachytherapy (IGABT). In the IGABT-group all clinical data were available for analysis together with extensive dosimetric data from the brachytherapy treatment [11]. MRI was used for dose planning with the applicators in situ. In 86 patients interstitial needles were used as part of the image-guided adaptive brachytherapy (IGABT). In 178 patients (65.4%) concurrent chemotherapy (weekly cisplatin 40 mg/m2) was administered during radiation therapy. Twenty-one patients (7.7%) received neoadjuvant chemotherapy before irradiation.

Table 1. Patient and tumor characteristics of the complete series (n = 272).

Factor

No. of patients n (%)

Mean age (years)

59.4 (range 23-90)

Prior diseases (cardiovascular, diabetes, GI, gyn)

131 (48.2)

Prior abdominal surgery (GI, urol, gyn)

123 (45.2)

FIGO stage

IB

53 (19.5)

IIA

50 (18.4)

IIB

112 (41.2)

IIIA

6 (2.2)

IIIB

33 (12.1)

IVA

11 (4.0)

IVB

7 (2.6)

Histology

Squamous cell carcinoma

223 (82.0)

Adenocarcinoma

40 (14.7)

Adenosquamous cell carcinoma

6 (2.2)

Other

3 (1.1)

Grade

Well differentiated (grade 1)

22 (8.1)

Moderately well differentiated (grade 2)

104 (38.2)

Poorly differentiated (grade 3)

132 (48.5)

Not graded

14 (5.1)

Tumor size

Maximum width at diagnosis (mm)

42.5 (range 15-80)

Nodal status (IGABT-group)

N+

37 (26.8)

Level 1 (internal, external iliac, obturator)

22 (15.9)

Level 2 (+ common iliac, aortic bifurcation)

8 (5.8)

Level 3 (+ para-aortic)

7 (5.1)

N-

101 (73.2)

Concomitant chemotherapy

Yes

178 (65.4)

No

94 (34.6)

The mean follow-up time for patients alive (n = 154) was 70.8months (range 3–229 months). In the compete series the mean follow-up time was 55.5 months (range 3-229 months).Seventy-three patients were dead of cervical cancer(26.8%) and 45 patients dead due to other diseases(16.5%) at the time of last follow-up. The schedule for follow-up was the following: 1 month after the end of radiotherapy, every 3 month the first year, every 4 months the second and third year, every 6 months the fourth year and then annually until five or for some patients until ten years.

FIGO stage distribution was stage I 53/272 (19.5%), stage II 162/272 (59.6%), stage III 39/272 (14.3%), and stage IV 18/272 (6.6%). The largest mean size of the tumors was 42.5 mm (range 15-90 mm) measured on CT or MRI image.Type of histology was squamous cell carcinoma in 223/272 (82.0%) cases, adenocarcinomas in 40/272 (14.7%) cases, adenosquamous cell carcinomas in 6/272 (2.2%) cases, and other types in 3/272 (1.1%) cases.

Nodal stage was assessed by imaging (CT or MRI) in the IGABT-group. Laparoscopic nodal staging was not used. Pathologicallymph nodes were defined as lymph nodes > 1 cm in size, loss of oval shape on imaging, or positive on PET/CT imaging.Thirty-seven patients (26.8%) had positive lymph nodes in this subgroup. Positive lymph nodes were classified into three levels, lower (22/37, 59.5%) or upper (8/37, 21.6%) pelvic and para-aortic (7/37, 18.9%) sites. Data on lymph node status was not available in the BT-group.

The mean age of the patients was 59.4 (range 23-90) years. A prior history of intercurrent diseases (cardiovascular, diabetes, gastrointestinal or other types) was recorded in 131 patients (48.2%), and prior abdominal (gastrointestinal, urological or gynecological) surgery in 123 patients (45.2%).

The study was approved by the ethics committee (Dnr 2018/482) of Uppsala-Örebro region.

External beam radiotherapy (EBRT)

The radiotherapy treatment consisted of external beam pelvic radiotherapy (EBRT) and conventional brachytherapy (BT) or image-guided adaptive brachytherapy (IGABT). A conventional (standard 3-D conformal) 4-field box-technique was used in 240 cases (88.2%), intensity modulated radiotherapy(IMRT)in 21 cases (7.7%), and volumetric modulated arc therapy (VMAT)in 11 cases (4.0%). The mean total external dose was 52.2 (range 45-68.4) Gy. The mean dose per fraction was 1.82 (range 1.8-2.3) Gy. The mean overall treatment time (OTT) was 44.1 (range 30-93) days.

Brachytherapy (BT) – the old series

A high-dose rate brachytherapy technique (Ir-192) was used (Micro-Selectron HDR; Elekta Instruments AB, Sweden) in the old series. A ring applicator set was used with 26 mm (n = 32) or 30 mm (n = 102) diameter of the ring, 20-60 mm intrauterine tandem with 60◦ angel. Absorbed doses and volumes were defined according to ICRU 38 (31-33). The reference dose (6.0 Gy per fraction) was specified as a minimum dose to the surface of the target isodose volume. The mean total brachytherapy dose was 26.3 Gy (SD 5.5 Gy). The central pelvic mass including cervix and the tumor (visualized by CT-scan) was used to define the gross tumor volume (GTV). The clinical target volume (CTVB) was equal with the gross tumor volume (GTVd) at start of radiotherapy. In case of more advanced tumors a new tumor evaluation (examination under anesthesia and pelvic CT) was done after 45-50 Gy of external irradiation for dose planning purposes. The shrunken gross tumor volume (GTVB) was then set equal to the clinical target volume (CTVB) of brachytherapy. Point doses in point A and B, at the bladder reference point (BRP), and at the rectal reference points were calculated. A bladder catheter with 7 cc contrast medium in the balloon was used to define the bladder reference point. The brachytherapy sessions were given once-a-week in parallel with the external beam therapy. In 91 patients (67.9%) five fractions (30 Gy; EQD2 = 40 Gy) were given and in 43 patients (32.1%) three fractions (18 Gy; EQD2 = 24 Gy) were administered. On the brachytherapy day both an external and an intracavitary fraction was given with a minimum of 6 hours apart. In case of smaller tumors in stage IB, IIA and early IIB five fractions of 6 Gy each were given (total EQD2 = 90 Gy for α/β = 10), and in cases with more advanced tumors (late IIB-III-IV) three fractions of 6 Gy were given in parallel with 60 Gy of external beam therapy (total EQD2 = 84 Gy for α/β = 10). A CT-based 3-D dose planning system was used for external beam therapy (TMS, Elekta Instruments AB, Sweden) and for brachytherapy planning (NPS and PLATO, Elekta Instruments AB, Sweden). MRI of the pelvis was not used for planning purposes in this series.

Brachytherapy (IGABT) – the new series

The median number of fractions was 4.0 (range 1-5). The median dose (EQD2, α/β = 10) per fraction was 8.0 (range 8.0-9.9) Gy. A ring applicator set was used in all cases. Two different ring diameters were used: 26 mm in 45 cases (33.8%) and 30 mm in 88 cases (66.2%). The length of the intrauterine tube varied between 20 and 60 mm, and the angle between the tube and the shaft of the applicator was 60°. The high-risk clinical target volume (HRCTV) was significantly larger in fractions 1-2 (55-57 cm3) compared with fractions 3-4 (48-49 cm3) (dependent t-test; p = 0.0014). In 86/138 patients (62.3%) interstitial needles were used. The number of needles varied between two and nine and the median number was six. The intracavitary / interstitial HDR brachytherapy was performed as follows: At the time of implantation an Interstitial Ring Applicator (Elekta, Stockholm, Sweden) was inserted with the ring positioned in the vaginal vault and the tube located intra-uterine. Interstitial needles were added when deemed necessary in order to cover the target volume with adequate dose. After implantation, the application was fixed by packing of the vagina. A Foley catheter was placed in the bladder and pulled towards the bladder base and fixed. The Foley catheter in the bladder also acted as a stabilization of the geometry. The patient was then transported to the MRI/CT for imaging. In the image study, High Risk Clinical Target Volume (HRCTV) was defined according to European recommendations from the GEC-ESTRO GYN working group [12]. Organs at risk (OAR), such as bladder, rectum and sigmoid were also defined. In the same image set the applicators were reconstructed and an optimized dose distribution based on the dose constraints (Table 2) for the HRCTV and OAR were created using the dose planning system OncentraBrachy (Elekta, Stockholm, Sweden). This procedure was repeated for all (four) fractions in two consecutive days, separated by two weeks. One implant was performed per fraction. The first and third fractions were based on an MRI-study, and fractions two and four were based on a CT-study. The CT-study was co-registered with the MRI-study to visualize the MRI-target in the CT-study, as was analyzed by Nesvacil et al. [13]. Before imaging and dose delivery, the bladder was emptied and refilled to a fixed liquid volume of 50 cm3and a catheter was inserted into rectum to prevent any gas filling.

Table 2. Significant background factors. BT = brachytherapy and IGABT = image-guided adaptive brachytherapy.

Factor

No. of patients n (%)


BT-group         IGABT-group            p value

n = 134            n = 138


Hemoglobin level

128.0               127.1                           0.607**


Prior abdominal surgery

  60 (44.8)         63 (45.7)                   0.885*

FIGO stage

                                                              0.130*

I-II

111 (82.8)      104 (75.4)

III-IV

  23 (17.2)        34 (24.6)

Histology

                                                               0.379*

Squamous cell carcinoma

110 (82.1)       113 (81.9)

Adenocarcinoma

  21 (15.7)          19 (13.8)

Adenosquamous cell carcinoma

    3 (2.2)               3 (2.2)

Other

    0 (0.0)               3 (2.2)

Tumor size

Maximum width at diagnosis (mm)

44.1 (mean)       41.0 (mean)             0.052**

Gross tumor volume (GTVd) (cm3)

35.4 (mean)       33.7 (mean)             0.650**

Pearson chi-square test * and t-test **

Toxicity evaluation

Late toxicity was evaluated at or after 3 months from completion of radiotherapy using the Common Toxicity Criteria v. 3.0 (CTCAE) [14].

Statistics

In the statistical analyses the Pearson chi-square test, the t-test (independent and dependent groups), binary logistic regression analysis (univariate and multivariate), Kaplan-Meier technique for survival analysis and the log-rank test,Cox F-test, or Gehan´s Wilcoxon tests (small numbers) for test of differences.Cox proportional hazard regression analysis (univariate and multivariate) was usedfor analysis of prognostic factors. A p value < 0.05 was regarded as statistically significant. The Statistica 64 (version 13.0.159.0, 2015) software package (Dell Statistica, Dell Inc.,USA) and IBM SPSS Statistics Version 25.0 (IBM Corp., Armonk, NY, USA) were used in the statistical analyses.

Results

Overall treatment time (OTT)

The mean overall treatment time of the complete series was 44.1 days (range 30-93 days). In 44 patients (16.5%) the OTT > 50 days. The OTT was not a significant predictive (local control, pelvic control, tumor recurrences) or prognostic (cancer-specific survival rate) factor in this study.In the BT-series OTT was significantly (t-test; p < 0.0001) shorter (40.2 days) than in the IGABT-group (47.9 days).

Concomitant chemotherapy

In 178 patients (65.4%) concomitant chemotherapy was given in the complete series. In the BT-group chemotherapy was given in 35.8% and in the IGABT-group in 94.2% (Pearson chi-square; p < 0.0001). In 106patients (39.0%) ≥ 5 cycles were administered. Two groups (≤ 4 cycles and ≥ 5 cycles) were compared with regard to cancer-specific survival rate and there was no significant (log-rank test; p = 0.705) difference between the survival curves. There was no significant association between the number of chemotherapy cycles administered and the total recurrence rate (p = 0.483) or the rate of distant recurrences (p = 0.349). This was true in the complete series, but also in a high-risk subgroup (FIGO-stage III-IV). Late toxicity (bladderand intestinal) was not increased with the number of chemotherapy cycles given. Neoadjuvant chemotherapy was given in 21 patients in the IGABT-group and it was associated with a significantly worse survival rate.

Overall tumor control after primary therapy

In 244/272 (89.7%) patients there were no evidence of disease (complete remission) after completed radiochemotherapy. In the BT-group complete remission was achieved in 124/134 (92.5%) and in the IGABT-group in 120/138 (87.0%) of the patients (Pearson chi-square test; p = 0.130). In the group with FIGO-stage I-III tumors the overall control rate was 232/254 (91.3%).Seventeen patients had loco-regional persistent disease and 11patients’distant disease. (Tables 3 and 4)

Table 3. Dose constraints to HRCTV and organs at risk (OAR) in the IGABT-group.

D90 HRCTV EQD210

> 85 Gy

Bladder D2cm3 EQD23

< 90 Gy

Rectum D2cm3 EQD23

< 75 Gy

Sigmoid D2cm3 EQD23

< 75 Gy

Table 4. Disease outcome and morbidity in the complete series (n = 272).

Local control after primary treatment

Percent

Overall

267/272 (98.2%)

GTVd ≤ 30 cm3

142/144 (98.6%)

GTVd> 30 cm3

119/122 (97.5%)

Stage IB-IIA

102/103 (99.0%)

Stage IIB

111/112 (99.1%)

Stage III

37/39 (94.9%)

Stage IVA

11/11 (100.0%)

Local control (at last follow-up)

Overall

258/272 (94.9%)


Pelvic control (at last follow-up)

Overall

234/272 (86.0%)


Systemic control (excluding para-aortic failures)

Overall (after primary therapy)

254/272 (93.4%)

Overall (at last follow-up)

197/272 (72.4%)


Cancer-specific survival rate (5-year)

Overall

68.5% [95% CI: 62.4-74.6]

Stage I+II

75.7% [95% CI: 69.2-82.2%]

Stage III+IVA

45.9% [95% CI: 30.0-61.2%]


Overall survival rate (5-year)

Overall

58.0% [95% CI: 51.5-64.5%]

Stage I+II

64.3% [95% CI: 57.2-71.4%]

Stage III+IVA

41.6% [95% CI: 27.1-56.1%]


Morbidity

Bladder CTCAE ≥ G1

53/272 (19.5%)

Bladder CTCAE ≥ G2

14/272 (5.1%)

Bladder CTCAE ≥ G3

6/272 (2.2%)

Rectum-sigmoid CTCAE ≥ G1

127/272 (46.7%)

Rectum-sigmoid CTCAE ≥ G2

53/272 (19.5%)

Rectum-sigmoid CTCAE ≥ G3

19/272 (7.0%)

Vaginal CTCAE ≥ G2 (IGABT-group)

30/138 (21.7%)

Vaginal CTCAE ≥ G3 (IGABT-group)

0/138 (0.0%)

Bone CTCAE ≥ G1 (IGABT-group)

12/138 (8.7%)

Bone CTCAE ≥ G2 (IGABT-group)

3/138 (2.2%)

Local control

The local control rate at the end of therapy was 98.2% (267/272). Five patients had persistent local disease. During the period of follow-up nine(3.3%) pure local recurrences occurred resulting in 258/272 (94.9%) overall local control.The local control rate in the BT-group was 95.5% and in the IGABT-groupit was 94.2%. During the same period16(5.9%) regional recurrences occurred resulting in a crude loco-regional control rate of 88.6% (241/272). Patients with loco-regionalrecurrences had synchronous distant recurrences in 5 out of 25recurrences (20.0%). The local control rate at the end of follow-up was 96.2% in stage I, 96.9% in stage II, 89.7% in stage III, and 83.3% in stage IV. Squamous cell carcinomas were locally controlled in 96.0% and adenocarcinomas and adenosquamous carcinomas in 89.8% (Pearson chi-square; p = 0.077). Local control rate was similar in grade 1-2 and grade 3 tumors. Concurrent chemotherapy had no statistically significant (Pearson chi-square test; p = 0.926) impact on local control rate.Overall treatment time (OTT) was not significantly associated with local control rate. FIGO-stage and lymph node status were significantly (p = 0.035, p = 0.001) associated with overall local control rate. Total brachytherapy dose and total external and brachytherapy dose had no significant impact on local tumor control after primary therapy.

Addition of interstitial needles (n = 93, 34.2%) had no significant effect on local control rate after end of radiotherapy or on crude local control rate (p = 0.649). The local control rate was 94.4% without needles and 95.7% with needles.

Needles were not used in the BT-group,but in 62.3% in the IGABT-group. In the latter group addition of needles significantly (t-test; p = 0.025) increased the mean HRCTV-volume from 48.1 cm3 to 58.5 cm3. The HRCTV D90 dose from all brachytherapy treatments increased in mean from 31.4 Gy to 40.3 Gy (t-test; p < 0.0001), and the total dose to the HRCTV volume from 82.5 Gy to 91.2 Gy (t-test; p < 0.0001). The bladder 2.0 cm3 dose (α/β = 3) increased from 6.3 Gy to 7.5 Gy (t-test; p = 0.006), the rectal 2.0 cm3 dose from 3.7 Gy to 4.3 Gy (t-test; p = 0.070), and the sigmoid 2.0 cm3 from 3.7 Gy to 5.4 Gy (t-test; p < 0.0001).

Pelvic control

The crude pelvic control at the end of the follow-up was 234/272, 86.0% in the complete series. In the BT-group the control rate was 82.8% and in the IGABT-group it was 89.1%. Thus, a trendto improved pelvic control, but not statistically significant (Pearson chi-square test; p = 0.134).

Systemic control

After completed primary therapy, 18 cases had distant residual disease and five cases local or loco-regional disease. Therefore, the primary systemic (distant) tumor control was 254/272 (93.4%). During the time of follow-up further 57 distant recurrences (21.0%) were recorded resulting in 197/272 (72.4%) overall distant tumor control. Distant metastases were significantly (Pearson chi-square; p = 0.004) associated with tumor stage:22.6% in stage I, 15.4% in stage II, 28.2% in stage III and 50.0% in stage IV. Among squamous cell carcinomas 19.7% distant recurrences were recorded and among adenocarcinomas and adenosquamous carcinomas 26.5% distant recurrences (Pearson chi-square; p = 0.290). Tumor grade was not significantly associated with distant recurrences. The frequency of distant recurrences was similar (21.7% vs. 20.2%) in the two brachytherapy groups.

Recurrences

The overall recurrence rate of the complete series was 78/272 (28.7%). In the two BT-groups the corresponding rates were 32.1% and 25.4%, respectively (not significant). Local recurrence was 9/272 (3.3%), regional recurrences 17/272 (6.3%), and distant recurrences 57/272 (21.0%). In 16 patients (5.9%) multiple sites of recurrences were recorded. The mean time from diagnosis to recurrence was 17.7 months (range 3-104 months). FIGO-stage and hemoglobin value at start of therapy were significant and independent predictive factors. The total brachytherapy and external doses were not significantly associated with the overall or distant recurrence rate.

Survival

There were 118 deaths (73 cases due to cancer and 45 cases due to other diseases) during the study period giving a 5-year overall survival of 58.0% [95% CI: 57.4-58.6%] and cancer-specific survival of 68.5% [95% CI: 62.3-74.7] (Figure 1). The cancer-specific survival rate was similar in the two BT-groups (68.5% vs. 68.6%) in the complete series. FIGO stage had a significant impact on both overall and cancer-specific survival rate (Figure 2). Tumor size was highly significantly (Cox proportional regression analysis; p <0.001) associated with survival in the complete series. The cancer-specific survival rate was significantly higher in patients with large tumors (GTVd > 60 cm3) in the IGABT-group than in the BT-group (log-rank test; p < 0.05).Adenocarcinomas and adenosquamous carcinomas had a worse prognosis than squamous cell carcinomas. The difference was statistically significant in the BT-group but not in the IGABT-group. Five-year cancer-specific survival was 27.1% in the BT-group but 51.2% in the IGABT-group (Cox F-test; p = 0.021) for adenocarcinomas. No significant difference was noted for squamous cell carcinomas. Overall treatment time (OTT) was not significantly associated with cancer-specific survival rate. However, concomitant chemotherapy significantly (Cox F-test; p = 0.031) improved the 5-year cancer-specific survival rate.

AWHC-3-2-317-g001

Figure 1. Cancer-specific survival rate of the complete series (n = 272). Survival probability with 95% confidence levels.

AWHC-3-2-317-g002

Figure 2. Cancer-specific survival rate of the complete series (n = 272) versus FIGO-stage. There was a statistically highly significant (chi-square test; p < 0.0001) difference between the tumor stages.

Prognostic factors

Ten significant prognostic factors for cancer-specific survival rate were identified in univariate Cox proportional regression analyses. However, of these factors only two: (1) pelvic control, and (2) distant tumor control (no distant recurrences) were significant and independent of each other in a Cox multivariate regression analysis (Table 5). In a multivariate analysis restricted only to factors available at the end of primary therapy (distant control was deleted) there were three significant and independent prognostic factors for cancer-specific survival rate:  (1) primary cure rate (HR 0.196; p < 0.001), (2) overall local control (HR 0.200; p < 0.03), and (3) pelvic control (HR 0.180; p < 0.001).GTV at diagnosis (GTVd) and total brachytherapy dose (p < 0.001) were significant and independent prognostic factors.The number of brachytherapy fractions was also significantly associated with the cancer-specific survival rate. Four to five fractions seemed to be an optimal fractionation schedule.

Table 5. Disease outcome and morbidity versus type of brachytherapy.

Brachytherapy groups

BT-group  IGABT-group  p value


n = 134  n = 138

Local control after primary treatment


Overall

133 (99.2%)             134 (97.1%)              0.186

Local control (at last follow-up)

Overall

128 (95.5%)             130 (94.2%)              0.622


Pelvic control (at last follow-up)

Overall

111 (82.8%)             123 (89.1%)              0.134


Systemic control

Overall (after primary therapy)

125 (93.3%)             124 (89.9%)               0.130

Overall (at last follow-up)

  98 (73.1%)               94 (68.1%)               0.365


Cancer-specific survival rate (5-year)

Overall

68.5% [60.3-76.7]    68.6% [59.3-77.8]   0.895


Overall survival rate (5-year)

Overall

53.4%  [45.0-61.8]    65.2% [55.6-74.8]   0.072


Morbidity

Bladder CTCAE ≥ G1

23/134 (17.2%)          24/138 (17.4%)       0.965

Bladder CTCAE ≥ G2

10/134 (7.5%)              7/138 (5.1%)          0.415

Bladder CTCAE ≥ G3

  5/134 (3.7%)              1/138 (0.7%)          0.090

Rectum-sigmoid CTCAE ≥ G1

66/134 (49.3%)         61/138 (44.2%)        0.404

Rectum-sigmoid CTCAE ≥ G2

34/134 (25.4%)         19/138 (13.8%)        0.016

Rectum-sigmoid CTCAE ≥ G3

17/134 (12.7%)           2/138 (1.5%)       < 0.001

Vaginal CTCAE ≥ G2 (IGABT-group)

NA                               30/138 (21.7%)

Vaginal CTCAE ≥ G3 (IGABT-group)

NA                                 0/138 (0.0%)

Bone CTCAE ≥ G1 (IGABT-group)

NA                               12/138 (8.7%)

Bone CTCAE ≥ G2 (IGABT-group)

NA                                 3/138 (2.2%)

Late bladder and intestinal toxicity

Bladder toxicity (CTCAE ≥ G1) was recorded in 53/272 patients (19.5%). There were no significant (p = 0.518) differences between the two brachytherapy groups.

Bladder toxicity (CTCAE ≥ G2) was recorded in 14 out of 272 patients (5.1%). In the BT-group it was 10/134 (7.5%) and in the IGABT-group it was 4/138 (2.9%) (Pearson chi-square test; p = 0.089). Bladder toxicity was highly significantly (t-test; p = 0.002) associated with the dose (EQD2,α/β = 3) to 2.0 cm3 of the bladder in the IGABT-group. However, the total external dose (EQD2, α/β = 3) was not significantly (p = 0.266) associated with toxicity of the bladder. Age was not a risk factor for late bladder toxicity (p = 0.641).A history of prior diseases was not associated (p = 0.871) with late bladder toxicity.Concurrent chemotherapy did not increase the risk of late bladder toxicity.

Bowel toxicity (CTCAE ≥ G1) was recorded in 127/272 patients (46.7%). There were no significant (p = 0.404) differences between the two brachytherapy groups. Bowel toxicity (CTCAE ≥ G2) was recorded in 53 out of 272 patients (19.5%). In the BT-group it was 34/134 (25.4%) and in the IGABT-group it was 19/138 (13.8%) (Pearson chi-square test; p = 0.016).

Bowel CTCAE ≥ G3 toxicity was noted in 19/272 (7.0%) in the complete series. In the BT-group it was noted in 17/134 (12.7%), but in the IGABT-group bowel CTCAE ≥ G3 was noted in only in 2/138 (1.5%). This difference was statistically highly significant (Pearson chi-square test; p < 0.0003).In the IGABT-group bowel toxicity (CTCAE ≥ G1) was significantly (Pearson chi-square; p = 0.005) associated with a prior history of abdominal surgery (gastrointestinal, urological or gynecological). Prior diseases (cardiovascular, diabetes, gastrointestinal and gynecological) also increased the risk of late bowel toxicity CTCAE ≥ G2 (p = 0.046).

Vaginal toxicity (only recorded in the IGABT-group)

Vaginal toxicity was significantly (Pearson chi-square; p = 0.022) associated (increased) with the number of brachytherapy fractions administered. The size of the HRCTV was also associated with the rate of vaginal toxicity (Pearson chi-square; p = 0.047).The total external dose (EQD2,α/β = 3) was only weakly (binary logistic regression analysis; p = 0.072) associated with the risk of vaginal toxicity.The rectal 2.0 cm3 dose (EQD2, α/β = 3) was not significantly (binary logistic regression; p = 0.143) associated with the risk of vaginal toxicity (grades 1-2).The vaginal 2.0 cm3 dose was not measured in this study [15]. The mean dose to the recto-vaginal reference point was 65.7 Gy (range 58-73 Gy). However, this dose was not significantly (logistic regression analysis; p = 0.468) associated with late vaginal toxicity in this series. Data of doses in this reference point was only available in 56 patients.

Vaginal toxicity (all grades) was more common (61/87, 70.1%) in the group treated with needles compared with the group without needles (30/52, 57.7%). However, the difference was not statistically significant (Pearson chi-square test; p = 0.136). Grade 2 toxicity was also more frequent in the needle group (21/86, 24.4%) than in the non-needle group (9/52, 17.3%), but still not significant (p = 0.326).The rate of vaginal toxicities was significantly higher (p = 0.007) during the later period (2013-2016) compared with the first period (2010-2013) of the study. (Tables 6 and 7)

Table 6. Prognostic factors for cancer-specific survival rate. Cox proportional regression analyses (univariate and multivariate analyses).

Factor univariate analyses

Hazard ratio (95% CI)            p value

FIGO-stage (I-II vs. III-IV)

0.300 [0.185-0.476]               < 0.0001

Histology (squamous cell vs. adenocarcinoma)

0.328 [0.203-0.531]               < 0.0001

Lymph node metastases (pelvic or para-aortic)

2.719 [1.410-5.243]               < 0.01

Primary cure (complete remission)

0.146 [0.084-0.255]               < 0.0001

Overall local control

0.308 [0.153-0.602]               < 0.001

Pelvic control

0.343 [0.206-0.571]               < 0.0001

Distant control

0.272 [0.170-0.433]               < 0.0001

Hemoglobin level at start of treatment

0.974 [0.961-0.987]               < 0.0001

Total extern dose (Gy) – negative impact

1.017 [1.017-1.106]               < 0.01

Total brachytherapy dose (Gy) – positive impact

0.903 [0.866-0.942]               < 0.0001

Factor multivariate analysis

Pelvic control

0.133 [0.044-0.402]               < 0.001

Distant control

0.088 [0.036-0.218]               < 0.0001


All other factors

Non-significant  > 0.05

Primary cure, overall local control and pelvic control were significant and independent if distant control was deleted

Table 7. Predictive factors for overall tumor recurrences. Logistic regression analyses (univariate and multivariate analyses).

Factor univariate analyses

Hazard ratio (95% CI)  p value

FIGO-stage (III-IV vs. I-II)

2.894 [1.576-5.313]               < 0.001

Lymph node metastases (pelvic or para-aortic)

2.696 [1.204-6.036]               < 0.02

Histology (adeno- vs. squamous cell carcinoma)

1.700 [0.922-3.362]               < 0.09

Hemoglobin value at start of therapy

0.970 [0.952-0.988]               < 0.002

Number of brachytherapy fractions

0.095 [0.010-0.862]               < 0.04

Total dose BT HRCTV D90 (α/β = 10) (Gy)

0.950 [0.902-1.000]               < 0.06

Total EBRT + BT-dose

0.960 [0.925-0.997]               < 0.04

Other factors

Non-significant in univariate

analysis

Factor multivariate analysis

FIGO-stage (III-IV vs. I-II)

4.076 [1.387-11.977]             < 0.01

Hemoglobin value at start of therapy

0.962 [0.935-0.989]               < 0.01

Other factors

Non-significant in multivariate

analysis

Discussion

In this study, the importance of modern 3-D image-guided brachytherapy was emphasized. Two different series of advanced cervix carcinomas were studied with regard to the type of brachytherapy used. An older series (n = 134) using conventional 2-D conformal brachytherapy (BT) was compared with a newer series (n = 138) using 3-D image-guided adaptive brachytherapy (IGABT). All patients were also treated with external pelvic beam irradiation (± chemotherapy). The external beam technique and doses (EQD2 51-52 Gy) were rather similar in the two series. Tumor stage, tumor size, gross tumor volume, and histology were comparable during the study period. Concurrent chemotherapy was used more frequently in the later study group since it was introduced as part of the standard therapy in 1999 [6].

In the conventional brachytherapy-group MRI was not used as part of the planning process and interstitial needles were not an option during this period.

The mean number of brachytherapy fractions was significantly higher in the BT-group than in the IGABTT-group. A comprehensive set of dosimetric data was only available for the IGABT-group according to the Vienna protocol [11].

In the IGABT-group the number of brachytherapy fractions and the total brachytherapy dose (D90, α/β = 10) was significantly associated with the overall recurrence rate, distant recurrences, and cancer-specific survival rate. The optimal number of fractions seemed to be 4-5. The importance of the brachytherapy dose to the high-risk clinical target volume (HRCTV) was shown, in a multivariate analysis (logistic regression analysis), to be significant and independent together with the primary cure rate (complete remission) and the hemoglobin value at start of therapy. A total brachytherapy dose greater than 45 Gy had a significantly positive impact on cancer-specific survival rate. However, the total external dose (after correction for the brachytherapy dose) was not significantly associated with treatment outcome and negatively correlated with the brachytherapy dose. Thus, an increased external pelvic dose willprobably not compensate for exclusion of brachytherapy treatment. Prior studies have also confirmed the advantage of combined external and intracavitary therapy compared with external therapy alone [8, 16, 17]. The total dose (D90) to the HRCTV (external plus intracavitary) was significantly higher in the group treated with needles. This is in agreement with the study by Fokdal et al. 2016 [9].

The most important predictive factor for tumor recurrences was the dose to the HRCTV (total and from brachytherapy) but not the size of the HRCTV or the use of needles. Increasing the external dose, and then decreasing the brachytherapy dose, had a negative prognostic impact on tumor recurrences and on cancer-specific survival rate. The crude local control rate in this series was 94.2% which was superior of that reported in the RetroEMBRACE study (90.6%), presented by Sturdza et al. 2016 [7]. However, the crude pelvic control rate was the same (87.0%, 86.9%) in both studies.

The overall recurrence rate in this series was 28.7% which is comparable with our earlier study with 30% recurrences [18]. In the RetroEMBRACE-study the overall recurrence rate was 30.4%, [7] similar to our older data. The recurrence rate in the BT-group was 32.1% and in the IGABT-group 25.4%, not significantly different.

The 5-year cancer-specific survival in our series was 69% compared to 73% in the retro-EMBRACE series [7]. The cancer-specific survival rate was similar (69%) in the BT- and the IGABT-group. In a prior study with standard brachytherapy from our institution the cancer-specific survival rate was 65% (Sorbe et al. 2010) [18]. Thus, in our institution we have had a slight improvementof the 5-year cancer-specific survival rate. In a study from the Netherlands by Rijkmans et al. 2014 [19] showed a highly significant improved 3-year overall survival in the group with image-guided brachytherapy (86%) compared with conventional brachytherapy (51%). The 3-year overall survival in our IGABT-group was 75% for comparison.

The mean overall treatment time (OTT) of the complete series was 44 days and in 16.5% of the patients the overall treatment time was longer than 50 days. The OTT was significantly shorter (40 days) in the BT-group than in the IGABT-group (48 days). The OTT was not a significant predictive or prognostic factor in our study. However, in the retro-EMBRACE study on 488 patients presented by Tanderup et al. 2016 [20], the OTT was significantly associated with local tumor control in both univariate and multivariate analyses.The recommendation was to keep OTT shorter than 50 days.

In our study 74 patients (54%) in the IGABT-group received ≥ 5 cycles of chemotherapy. In the EMBRACE I study the corresponding figure was 70% [21]. The number of chemotherapy cycles was neither a predictive nor a prognostic factor for therapy outcome in our study. In a study by Schmid et al. 2014 [22] they found the number of chemotherapy cycles to be of prognostic importance in a high-risk group (positive lymph nodes and stage III-IV) for distant recurrences. We could not confirm this finding in our study.

Bladder toxicity (CTCAE ≥ G2) was recorded in 5% and CTCAE G3 in 2%, and it was highly significantly associated with the dose to 2.0 cm3 of the bladder [23]. The CTCAE ≥ G3 toxicity was more frequent in the BT-group (3.7%) than in the IGABT-group (0.7%). (Figure 3)

AWHC-3-2-317-g003

Figure 3. Cancer-specific survival rate of the complete series (n = 272) versus type of histology (squamous cell carcinomas versus adenocarcinomas/adenosquamous cell carcinomas/other types. There was a statistically highly significant (log-rank test; p < 0.0001) difference between the histological types.

Bowel toxicity (CTCAE ≥ G2) was noted in 19.5%, and bowel CTCAE ≥ G3 in 7.0% in the complete series. A significant favor of the IGABT-group was seen with regard to CTCAE ≥ G2 toxicity (13.8% vs. 25.4%) and CTCAE ≥ G3 late recto-sigmoid toxicity (1.5% vs. 12.7%). This difference was an important finding in this study. Bowel toxicity (all grades) was significantly associated with a prior history of abdominal surgery. This is a finding we also reported in a prior study (Bohr Mordhorst et al) [10]. Prior diseases (cardiovascular disease and diabetes) also increased the risk of late bowel toxicity. The brachytherapy fraction dose also increased the risk of late intestinal reactions.On the other hand, very few serious late reactions (grade 3-4) were noted in our study. In a study by Mazeron et al. [24] including 960 patients (EMBRACE I) a dose-volume effect was noted for D2cm3 ≤ 65 Gy and D2cm3 ≥ 75 Gy regarding minor or major late rectal toxicity [23]. In a prior study published from our institution serious late intestinal reactions (grade 3-4) occurred in 14% after a combined treatment of external beam pelvic radiotherapy and conventional brachytherapy [8]. This was an important improvement in the present study using MRI-guided IGABT compared with our older data and the BT-group not using this technique [10, 19]. (Figure 4)

AWHC-3-2-317-g004

Figure 4. Cancer-specific survival rate versus number of brachytherapy fractions. There was a significant difference (chi-square test; p = 0.007) between 2-3 fractions and 4-5 fractions.

Vaginal toxicity was only registered in the IGABT-group. It was significantly associated with the number of brachytherapy fractions administered. The size of the HRCTV was also associated with the rate of vaginal toxicity. Vaginal toxicity (all grades) was more common, but not significant, in the group treated with needles compared with the group without needles. (Figure 5 and 6)

AWHC-3-2-317-g005

Figure 5. Cancer-specific survival rate in adenocarcinomas/adenosquamous carcinomas versus type of brachytherapy. IGABT = image-guided adaptive brachytherapy. BT = conventional brachytherapy. There was a significant (Cox F-test; p = 0.021) difference in
the cancer-specific survival rate between the two groups.

AWHC-3-2-317-g006

Figure 6. Cancer-specific survival rate in large tumors (GTVd < 60 cm3) versus type of brachytherapy. IGABT = image-guided adaptive brachytherapy. BT = conventional brachytherapy. There was a significant (Gehan´s Wilcoxon test; p = 0.037) difference in the cancer-specific survival rate between the two groups. GTVd = gross tumor volume at diagnosis.

The individually designed external pelvic irradiation and adaptive brachytherapy (with or without needles) is probably an explanation for this improvement. The dose to the organs at risk was carefully evaluated and limited based on the well-known tolerability of these organs. The image-guided brachytherapy technique, using MRI before and during treatment, is of importance to achieve these results. This is a significant improvement compared with older data on conventional brachytherapy both from our institution and from other centers [13].

In the IGABT-group analyses of late toxicity (CTCAE ≥ G2) of the intestine and the bladder gave a clear impression of the importance of the total dose to the HRCTV (> 90 Gy, α/β = 3) and not the HRCTV-volume. All intestinal toxicity (CTCAE ≥ G2), except three cases, and all bladder toxicity (CTCAE ≥ G2), except two cases, occurred in patients who had received a D90 dose > 90 Gy to the HRCTV-volume. Five patients had both late bladder and intestinal toxicity and all of them had received a D90 dose> 90 Gy to HRCTV. However, analysis of all late toxicity (CTCAE ≥ G1) showed another pattern where both the dose level and the volume of HRCTV seemed to be of importance.

Recently, the problem with distal parametrial and pelvic wall invasion was addressed in a two-institutial study [25] using a newly developed applicator allowing the use of both parallel and oblique needles (Vienna-II). The treatment outcome seemed to be comparable to our results (local control, recurrences and survival data) when analyzed in FIGO-stages IIB-IVB, but with a substantial higher rate of serious late side effects (20% grade 3-4 toxicity, including 4 fistulas) and acute treatment related complications (active bleeding in 27%). In a smaller series of 10 patients and total 40 fractions another new hybrid applicator (Venezia) was tested and was found to be feasible and allowed improved dose coverage and sparing organs at risk [26].

Conclusion

Data from our study showed a local control rate > 94% for a D90 dose > 95 Gy to the HRCTV. To reduce late bladder and intestinal toxicity the recommended D90 dose was < 90 Gy to the HRCTV. These results are in agreement with data presented from the retroEMBRACE study. The reported data are excellent for local and loco-regional tumor controland similar in the BT- and IGABT-groups. However, for adenocarcinomas and tumors with large GTV the cancer-specific survival rate was significantly improved in the IGABT-group. Late toxicity from the organs at risk were most favorable after treatment with modern IGABT-technique. Still, there was a problem with distant recurrences (21%) negatively influencing the cancer-specific survival rate. A more individualized and tumor-specific and biologically oriented therapy is probably needed in the future.

Declaration of competing interest

The authors declare that there were no personal financial interests or other relationships that could influence the work reported in this paper.

Acknowledgments

We acknowledge the support of Hanna Rapp, MD, for collection of missing and follow-up clinical data from part of the medical region. The oncology nurses BeritBermark and Helené Johansson also took part in data collection.

References

  1. Bray F, Ferlay J, Soerjomataram I, Siegel RL, Torre LA, et al. (2018) Global cancer statistics 2018: GLOBOCAN estimates of incidence and mortality worldwide for 36 cancers in 185 countries. CA Cancer J Clin68: 394-424.[crossref]
  2. Marth C, Landoni F, Mahner S, McCormack M, Gonzalez-Martin A, et al. (2017) Cervical cancer: ESMO Clinical Practice Guidelines for diagnosis, treatment and follow-up. Ann Oncol 28: iv72-iv83.
  3. Vaccarella S, Franceschi S, Engholm G, Lonnberg S, Khan S, et al. (2014) 50 years of screening in the Nordic countries: quantifying the effects on cervical cancer incidence. Br J Cancer 111: 965-969.[crossref]
  4. Green JA, Kirwan JM, Tierney JF, Symonds P, Fresco L, et al. (2001) Survival and recurrence after concomitant chemotherapy and radiotherapy for cancer of the uterine cervix: a and radiotherapy. Systematic review and meta-analysis. Lancet 358:781-786.[crossref]
  5. Thomas GM (1999) Improved treatment for cervical cancer–concurrent chemotherapy and radiotherapy. N Engl J Med 340:1198-1200.[crossref]
  6. Rose PG, Ali S, Watkins E, Thigpen JT, Deppe G, et al. (2007) Long-term follow-up of a randomized trial comparing concurrent single agent cisplatin, cisplatin-based combination chemotherapy, or hydroxyurea during pelvic irradiation for locally advanced cervical cancer: a Gynecologic Oncology Group Study. J ClinOncol 25:2804-2810.[crossref]
  7. Sturdza A, Pötter R, Fokdal LU, Haie-Meder C, Tan LT, et al. (2016) Image guided brachytherapy in locally advanced cervical cancer: Improved pelvic control and survival in RetroEMBRACE, a multicenter cohort study. RadiotherOncol 120: 428-433.[crossref]
  8. Karlsson J, Dreifaldt AC, Mordhorst LB, Sorbe B (2017) Differences in outcome for cervical cancer patients treated with or without brachytherapy. Brachytherapy 16:133-140.[crossref]
  9. Fokdal L, Sturdza A, Mazeron R, Haie-Meder C, Tan LT, et al. (2016) Image guided adaptive brachytherapy with combined intracavitary and interstitial technique improves the therapeutic ratio in locally advanced cervical cancer: Analysis from the retroEMBRACE study. RadiotherOncol 120:434-440.[crossref]
  10. Bohr Mordhorst L,Karlsson L, Barmark B, Sorbe B (2014) Combined external and intracavitary irradiation in treatment of advanced cervical carcinomas: predictive factors for treatment outcome and early and late radiation reactions. Int J Gynecol Cancer 24:1268-1275.[crossref]
  11. Pötter R, Georg P, Dimopoulos JC, Grimm M, Berger D, et al. (2011) Clinical outcome of protocol based image (MRI) guided adaptive  combined with 3D conformal radiotherapy with or without chemotherapy in patients with locally advanced cervical cancer. RadiotherOncol 100:116-123.[crossref]
  12. Dimopoulos JCA, Petrow P, Tanderup K,Petric P, Berger D, et al. (2012) Recommendations from Gynaecological (GYN) GEC-ESTRO working group (IV): Basic principles and parameters for MR imaging within the frame of image based adaptive cervix cancer brachytherapy. RadiotherOncol 103:113-122.[crossref]
  13. Nesvasil N, Tanderup K, Lindegaard JG, Richard Pötter, Christian Kirisits(2016) Can reduction of uncertainties in cervix cancer brachytherapy potentially improve clinical outcome? RadiotherOncol 120:390-396.[crossref]
  14. Auth B (2006) Therapy evaluation program, common terminology criteria for adverse events, version 3.0. DCTD, NCI, NIH, DHMS: 2003 (http://ctep.cancer.gov), publish date: August 9.
  15. Fidarova EF, Berger D, Schussler S, Dimopoulos J, Kirisits C, et al. (2010)Dose volume parameter D2cc does not correlate with vaginal side effects in individual patients with cervical cancer treated within a defined treatment protocol with very high brachytherapy doses. RadiotherOncol 97:76-79.[crossref]
  16. Yang J, Cai H, Xiao Z-X, Wang H, Yang P(2019) Effect of radiotherapy on the survival of cervical cancer patients. An analysis based on SEER database. Medicine98: e16421.[crossref]
  17. Delgado D, Figueiredo A, Mondonca V, Jorge M, Abdulrehman M, et al. (2019) Results from chemoradiotherapy for squamous cell cervical cancer with or without intracavitary brachytherapy. J Contemp Brachytherapy 11:417-422.
  18. Sorbe B, Bohr L, Karlsson L, Bermark B (2010) Combined external and intracavitary irradiation in treatment of advanced cervical carcinomas: predictive factors for local tumor control and early recurrences. Int J Oncol 36:371-378.[crossref]
  19. Rijkmans EC, Nout RA, Rutten IHHM,Ketelaars M, Neelis KJ, et al. (2014) Improved survival of patients with cervical cancer treated with image-guided brachytherapy compared with conventional brachytherapy. GynecolOncol 135:231-238.[crossref]
  20. Tanderup K, Fokdal LU, Sturdza A,HaieMeder C, Mazeron R, et al. (2016) Effect of tumor dose, volume and overall treatment time on local control after radiochemotherapy including MRI guided brachytherapy of locally advanced cervical cancer. RadiotherOncol 120:441-446.[crossref]
  21. Pötter R, Tanderup K, Kirisits C,Leeuw A, Kirchheiner K, et al. (2018) The EMBRACE II study: The outcome and prospect of two decades of evolution within the GEC-ESTRO GYN working group and the EMBRACE studies. ClinTranslRadiatOncol 9:48-60.[crossref]
  22. Schmid MP, Franckena M, Kirchheiner K,Sturdza A, Georg P, et al. (2014) Distant metastasis in patients with cervical cancer after primary radiotherapy with or without chemotherapy and image guided adaptiv brachytherapy. GynecolOncol 133:256-262.[crossref]
  23. Georg P, Pötter R, Georg D, Lang S, Dimopoulos J, et al. (2012) Dose effect relationship for late side effects of the rectum and urinary bladder in magnetic resonance image-guided adaptive cervix cancer brachytherapy. Int J RadiatOncolBiolPhys 82:653-657.[crossref]
  24. Mazeron R, Fokdal LU, Kirchheiner K, Georg P, Jastaniyah N, et al. (2016) Dose-volume effect relationships for late rectal morbidity in patients treated with chemoradiation and MRI-guided adaptive brachytherapy for locally advanced cervical cancer: Results from the prospective multicenter EMBRACE study. RadiotherOncol 120:412-419.[crossref]
  25. Mahantshetty U, Sturdza A, Naga CH  P, Berger D, Fortin I, et al. (2019) Vienna-II ring applicator for distal parametrial/pelvic wall disease in cervical cancer brachytherapy: An experience from two institutions: Clinical feasibility and outcome. RadiotherOncol141: 123-129. [crossref]
  26. Walter F, Maihöfer C, Schüttrumpf L, Well J, Burges A, et al. (2018) Combined intracavitary and interstitial brachytherapy of cervical cancer using the novel hybrid applicator Venezia: Clinical feasibility and initial results. Brachytherapy17:775-781.[crossref]

Latina and Black Women: Narratives on the Path to Homelessness

DOI: 10.31038/AWHC.2020325

Abstract

An increasing number of Americans are experiencing homelessness, with the latest count estimating that over one-half million people were living in the street or occupying areas not meant for human occupation in one single night. While a general portrait of the homeless population tends to highlight black or older men, almost 40 percent of the homeless population are now women. Among these are the growing numbers of Latina and Black women.

In this manuscript, we present a community based participatory research study approach designed to explore the experiences of Latina and Black women living in skid row Los Angeles, frequently recognized as the “homeless capital. Of the U.S.The finding from the mixed quantitative and qualitative study reveals similarities and salient differences on the factors that the women perceive led them on a path to homelessness. Included in the narratives are how the Black women have learned to navigate various support systems, in contrast to how the Latina women have struggled to gain entryinto the system. The women’s narratives present a portrait of structural and cultural inequities, and a need for interdisciplinary and intersectoral collaboration with diverse teams in order to develop programs the serve the needs of these new homeless populationsThe findings call for urgent need to address systems of inequity and bias, along with needed policy changes.

Keywords

Latinas, Blacks, homeless, racism, gender

Background to the Study

The first author for this study has been providing health care and allied services for underserved local and global communities for several decades; as a registered nurse and nurse practitioner, university educator and researcher, along most prominently as a clinician, community advocate, mentor, and volunteer. At times, the services were on the periphery, volunteering for services with agencies servicing farmworkers in hard to reach areas, or simply assisting with food services to homeless groups of families. Most recently, my nursing background came full circle with the opportunity to develop public health nursing projects while supervising nursing students at a major university; primarily focused in the Skid Row area of Los Angeles. Through these endeavors, the nursing student groups witnessed the changing demographics among the homeless population; including the racial/ethnic, gender, and age differences visible. The increasing number of women and “people of color” we encountered through our service projects did not fit the portrayals of homeless individuals in this country; as the faces of men are what students most frequently recalled. Instead, we encountered groups of Latina and Black women who reached out for the health education and social interaction opportunities.

The interactions with these women led to the development of this study, as the literature review suggested a gap in research as women experiencing homelessness have not been fully included in the discourse and policy arenas.

Introduction: What do we know about the homeless population?

In general, it is difficult to get a reliable estimate on the homeless individuals and family. Some of the difficulty in gathering data is the lack of consensus on how to define and measure homelessness. Additionally, how does one identify and locate “homeless” individuals? As the National Law Center on Homelessness and Poverty suggests, [1] there are different definitions of homelessness used across the U.S. For example, some of the major issues include the varying definitions used by the U.S. Department of Housing and Urban Development, or HUD, the states, and the U.S. Department of Education. In these examples, HUD relies on stricter guidelines for counting individuals located in shelters, transitional units or publicly visible places. Unlike HUD, the Department of Education guidelines includefamilies who are “doubling” or “tripling” up in the homeless count, as these families are precariously housed and are on the verge of becoming homeless.

Others have also pointed out the unreliability of the methodology used to count the number of homeless individuals, or the point-in-time homeless count conducted over one-to-two nights; and then applying these figures for service, funding, and policy development [2]. Moreover, the literature suggests a simple typology of economics, employment and lack of affordable housing as primary factors contributing to homelessness. This simple typology of job loss and lack of affordable housing may not fully explain these individual’s pathway to homelessness.

Homeless in the U.S.

In the most recent U.S. national “homeless count” conducted over one to two nights in January, slightly more than one half million people were counted as homeless (U.S. Department of Housing and Urban Development [3].Of these, a little over one-third (37%) were “unsheltered” meaning staying overnight in the streets, doorways, cars, tents, parks, under bridges, in storage or collection bins, abandoned buildings, parks, or various other places not meant for human habitation [4]. These figures suggest that four out of every ten homeless individuals are unsheltered, living in the streets; visible but mostly invisible to society.

The demographics also reveal that almost two-thirds of the individuals experiencing homelessness were men (61%), while women represented almost 39% of the population; an 8% increase between 2018 and 2019, as the numbers continue to grow. Two states had the largest numbers of individuals identified as homeless during the annual count (California and New York). Although California had over half (53%) of the unsheltered population in the nation.Almost half of the overall homeless population were white comprising over half (57%) of the unsheltered population. Yet the largest increase among the unsheltered racial/ethnic groups was foundto be among African Americans, followed by Hispanics [4].

This is a best estimate of a serious human rights and public health issue, as various reports suggest the figures may be much higher, with anywhere from 1.6 million to over three million individuals experiencing homelessness over one year’s time (National Law Center on Homelessness & Poverty [NLCHP], [5]. These are outstanding figures for a first world country as the U.S.

Homeless in Los Angeles

In Los Angeles County (LAC),estimates suggest that almost 47,000 of people were homeless in 2016. In contrast to the national data, the LAC homeless population is more diverse with widening disparities, as the majority (75%) of homeless individuals continue to be unsheltered (Los Angeles Homeless Service Authority [LAHSA] [6].

Additionally, one in three of homeless individuals were women, representing a 55% increase from the 2013 figures. Since a growing number of women are homeless and unsheltered, we can expect to see more women surviving in tents and other street make-shift encampments [6]. These are staggering figures that further compounds health risks for the female homeless population, as women experiencing homelessness suffer additional burdens when compared to homeless men; including physical and mental trauma, as well as sexual assaults [7].

Demographically, African-Americans comprise 39% of the homeless population within the greater LAC area, although they represent less than 10% of the population; while Hispanic/Latinos account for 27% of the homeless population. Additionally, almost one-fourth (18%) of the total homelesspopulation had a history of physical or sexual abuse, including domestic or intimate partner violence [6]. At the same time, a report suggests that getting overnight housing in shelters does not necessarily offer protection, as almost one-fourth of women reported they were victimized while staying in shelters [7]. Another study also suggests that women living in the streets, meaning unsheltered, were more likely to remain homeless for longer terms,had greater odds of poorer physical health, and over 12 times greater odds of poor mental health at greater risk for alcohol use, multiple sexual partners, and a history of physical assault, but less likely to access needed health services [8].

Locally and nationally, the homeless population is increasingly diversifying, yet there is a paucity of research on racial/ethnic minority women dealing with homelessness. In the parent study, we became familiar with the growing number of Latinas and Black women in skid row; but their growing presence did not fit the general characterization of Latino families. Among Latinos,familismois recognized as a core feature, where solidarity and the collectivist spirit of extended multigenerational families provide enduring support through the lifespan[9]. Earlier well recognizedstudies also suggested that intergenerational familismoplayed a protective role against poor health outcomes. This epidemiolocalparadox posits that despite disadvantages, Latinos demonstrated longevity and better health outcomesthan anticipated [10-12]. Along with familial-based support, the cohesiveness of ethnic enclaves may play a role for caregiving and maintaining wellness, despite high risk for community members [13]. Today, some core features of familismohave been associated with intergenerational caregiving, especially among foreign-born Latinos who retain their Spanish language and cultural links via ethnic enclaves and extended family ties [14].

Among Black families, as with other racial/ethnic minority populations, extended family household live-in arrangements have been found to be supportive when intergenerational solidarity- cultural orientations are aligned. Filial assistance is thus recognized as embraced by Black and Hispanic families [15]. Fictive kin, functioning as extendedsocial networks,also suggeststhat these extended social networks support collaboration, cooperation,and solidarity that nurtures and supports moving beyond simply coping in harsh environments [16-17].

The changing demographics among the homeless population and general portrayals of women cared for and supported by large networks of kin led to conceptualizing this study for exploring how race/ethnicity, gender and social class plays out among this homeless population. Because this study sampled both Latina and Black women (as a comparison group), this study will be able to note similarities and disparities for these groups of racial/ethnic minority women.

Aims

The overriding goal of this study was to explore Latina and Black women’s perceptions of factors in their lives that may have contributed to living in skid row (the “homeless capital”) in the U.S. By exploring their lived experiences in skid row and surviving in this environment, we anticipated that their narratives would provide insight on the issues faced by women necessary for expanding the narratives on homelessness so necessary for program and policy development.

Methods

Some of the data used in the analysis for this project were collected as part of a study on Older Latinos Aging in Skid Row. For that first study with an older population, the focus was on older homeless Latino men and women over 50 years of age seeking services in skid row (Ruiz & Contreras, under review). Included in the parent study were 6 self-identified Latina women. As that first study progressed, we noticed a small, but noticeable growing number of women of various ages and diverse racial/ethnic backgrounds living in skid row. The brief encounters with the “women of skid row” led us to conceptualizing the follow up study with Latina and Black women. This present study allows us to gain further insight on the intersection of race/ethnicity and gender, specifically on Latina and Black women’s experiences surviving in Skid Row.

Research team

As with the parent study that explored older Latinos path to homelessness (in review), the study team for this project included a diverse team of research assistants from multidisciplinary programs, including Chicano Studies, Anthropology, and Nursing; all spoke Spanish and identified experiences with Hispanic/Latino communities. Additionally, a doctoral nursing student focused on studies the intersection of race and healthissuescontributed to the present study, adding an additional layer of expertise and perspective.

The multidisciplinary personal and professional experiences of the authors as well as the research assistants, was instrumental for assisting the team in gathering data and capturing cultural nuances. These multiple layers of expertise added to the cross-cultural analysis for this manuscript.

Study population and recruitment of participants

The parent study was expanded; allowing us to recruit more an additional group of Latina and to add Black women over 18 years of age dependent on services in the skid row area of Los Angeles.

For this present study, the research team utilized the same study design utilized in the original study; as the mixed quantitative survey and qualitative open interview format worked well and captured the cultural nuances and findings we had not located in published studies we reviewed. Thus, this study includes 6 Latina participants from the parent study, plus an additional 6 newly recruited Latina participants (total of 12); along with 13 newly recruited Black women.

As in the parent study, participants were recruitedthrough snowball methods and assured that they could stop the survey or interview at any point of time. Participants were compensated for their time and provided an envelope with 20 dollars cash at the end of their participation. The study was approved by the University Institutional Review Board and followed guidelines for ethical research.

By focusing on Latina and Black women, the study allowed us to compare and contrast the path to homeless for these groups of marginalized women, their lived experiences pre-homeless, their perception of the pathways to becoming homeless, along with networks and family connections, as well as their recommendations for ameliorating experiences faced by groups of homeless women.

Results

Sociodemographics

The sociodemographicand health related table (Table 1) highlights some salient differences between the Latina and Black women participants. In contrast to the Latina participants, the Black U.S. born women, were all English speakers; they represented a younger cohort (mean age of 48 years) versus the Latinas (mean age of 76 years); had greater years of formal schooling (average of 12 years versus 6 years); and the majority had experienced fewer years of homelessness (less than 5 years). In contrast, all but two Latinas were born in Latino/Hispanic countries and several arrived in the U.S. unaccompanied or with limited to acquaintances, and most were primarily Spanish speakers. In regard to health matters, the majority of Latinas (85%) rated their health as fair to poor, in contrast to the majority of Black women (66%) who rated their health as good to excellent. As noted in Table 1, both groups of women reported a history of various debilitating chronic health conditions. Health issues are a major concern, as the Latinas expressed limited access to health care, including linguistic, cultural, and other biases that limited their access to resources that others benefitted from.

Table 1. Sociodemographics-Health Issues for Latina and Black Women (N=25)

Characteristics

Latinas
N=12     No. (%)

Black/African American
N=13     No. (%)

Age (years)
20-29
30-39
40-49
50-59
60-69
70-79

0
1  (8%)
0
4    (33%)
2   (17%)
5     (42%)
Range: 33-77
Mean: 76.2

2    (15%)
4    (31%)
3    (23%)
4    ((31%)
1    (.07%)
2    (1.5%)
Range: 25-70
Mean: 48.46

Country of Origin
Mexico
U.S.
El Salvador
Puerto Rico
Guatemala

4    (33%)
2    (17%)
2    (17%)
2   (17%)
1    ( 08%)

13 (100%)

Primary Language
English
Spanish
Spanish/English

3 (%)
8    (17%)
1    (08%)

13    (100%)

Education: Years completed
None
1-5 years
6-10 years
12 years
Over 12
Mean

2     (17%)
4      (25%)
2     (17%)
4     (25%)

Mean 6.2 years schooling

0
0
1      (07%)
6      (46%)
6      (46%)

Mean: 12 years

Years of Homelessness
1-5 years
6-10
11-20
over 20
Self-Rated Health
Excellent
Good
Fair
Poor

Missing

6 (50%)
4     (33%)
2      (17&)
0

0
2    (17%)
5    (42%)
4    (33%)

1

9    (69%)
3.   (23%)
1    (8%)
0

2      (16%)
6     (50%)
4      (33%)
0

1

Medical-other related Issues

High blood pressure, diabetes, heart problems, overweight, back problem, psoriasis, osteoarthritis asthma, arthritis, cataracts,
prior alcohol abuse (1), drug use (1), prison history (1).

High blood pressure,  pneumonia, overweight, hospitalization, asthma, COPD, depression, manic depressive, PTSD (1), drug use (2), youth guidance center history (1).

Generally, all of the womenexpressedhow a myriad of complex and interrelated issues contributed to them becoming homeless; including changes in family structure, dissolution of a marriage, loss of employment, limited or lack of social networks and family support contributed to ending up living in skid row. However, while the women may share some similarities in their narratives, there are some salient differences between the Latina and Black women. The women’s narratives were analyzed using content analysis allowing us to code, identify labels and categories for the development of major themes and subthemes.

Theme 1.Moving away for survival; Moving towards a better life

This theme was prominent among several Latinas only as 10 out of the 12 participants were born outside of the U.S.; while all Black women were born in the U.S. and thus did not have the immigration experience to reflect upon.  Several Latinas spent a good amount of time sharing their immigration experiences and how they had to leave their home country due to war or threats of abuse, fear, or hunger.

Their comments of “coming to the U.S. for economic necessity and to survive” and “I came for a better way of living, maybe just surviving, but you can’t starve here” exemplify their need to move away in order to survive.

For others, migrating to the U.S. was seen as necessary in order to find jobs to as a means to support themselves or families back home, or in order to find medical care not available in their home countries for physical conditions including arthritis, heart ailments, diabetes, or other several ailments. One Latina expressed that in skid row, “being around people helps with depression”, although it was not clear if she was expressing sadness, or if she suffered from depression. Also, as with other descriptive studies, researchers are not able to assess what came first; was it the state of becoming homeless that contributed to the emotional or mental status, or the reverse.

Theme 2.Learning to navigate the system: The haves versus have-nots

Depending on immigration status, language, and networks in skid row, the Latina and black women diverged on their ability to navigate the system for accessing housing, meals and other resources available.For the Latina women, their stories revealed multiple barriers, including being dependent on others to become familiar with services available, language and cultural barriers, limited social skills for gaining entry to clinics, social workers and others who could provide referrals for service access.

A Spanish speaking Latina described how she immigrated to the U.S. with her sister, so that she could serve as her babysitter. As her sister earned very little, she was paid a small mount and left the home when the brother-in-law “wanted to have sex with me, so I had to leave but nowhere to go.” This woman ended up in Olvera Street (perhaps a sanctuary church), and was able to meet with a social worker in skid row.  This Latina # 8 described how she “just follows instructions, they tell me where to go” without asking questions or saying much due to the language limitations.

Another Latina participant expressed frustration at her inability to access any health or education sessions, “they always give out flyers, with special talks, like for HIV or lots of other talks…but they’re all in English.”Another Latina shared how losing the job led to anxiety caused feelings “like depression and ended up leaving the house; “I didn’t want to be a burden for my brothers, and that’s why I decided to live in the streets.”

For the Black women participants, instead of immigration status and cultural or language impacting access to services, several of the Back women expressed frustration with some hotel and shelter managers, the limited housing available to women without children, and the “welfare system.”

One woman expressed that “there’s free clinics or minimal cost” and there’s various treatment programs for alcohol and drug abuse. Another Black woman expressed that “I went crazy after I lost my kids” and became homeless, and this led to her drug use. This woman also shared that she did not encounter any difficulty accessing resources and programs in skid row; “there’s programs here, and if they don’t have what you need, they give it to you.” The woman’s statements imply that she could easily get what she asked for, unlike the Latina participants who expressed a lack of attention and access to services or resources.

The discordant between the Latina and Black women narratives reveal varying perceptions regarding the system of services, the availability and access to basic health and service needs. This led to uncovering a subtheme for the have-and have-nots.

Subtheme 2: On being privileged-Latina women’s narratives on Non-Latinos

Some Latinas expressed that Latinos with “los papeles” (individuals holding citizenship or established residency, as Puerto Ricans), and Black people have greater support and access to services, including the ability to communicate with individuals that may help them to navigate housing, meal sources, and “better” health care (meaning out of the skid row area, as they may have health coverage as Medicaid or Medicare). As one Latina stated, “no papers, no help.” A few Latinas also expressed frustration and dislike for “the roaches, drug dealers and drug use” as they perceive that “those with benefits” may spend their money foolishly; money that is not available for those “without los papeles.”

Theme 3: Homelessness: Separation of mind from physical conditions

Among both Latina and Black women their narratives reveal a separation of mind and body; as mental health issues were not perceived as affecting the physical well-being. Although several described various chronic health conditions potentiated by the harsh homeless environment; they separated stories on their physical ailments from the mental health aspects as loss of self-esteem, loss of control, and complacency; without noting the connecting between mental and physical well-being (or not being well). Although some men in the parent study (older Latino men and women) expressed that “it’s depressing here; it’s not motivational, and you become trapped and you suffer.”

None of the women in this study expressed a similar sense of connection with the mind, body, and mental health.

Instead, a Latina blamed herself for an incident of sexual abuse. This woman expressed that she may have contributed to the abuse, as “maybe because you are a drunk and you want to be…” This woman’s discussion suggested that the physical trauma was not relevant to her mental health. At the same time, this Latina described how she needed medication for “my bones, for walking, stomach problems and other ailments.” In this case, there was no consideration for the association between physical and mental health.

Theme 4.The long road to becoming homeless-where do familismo and fictive kin fit in?

There were salient differences between the Latina and the Black participants on the path leading to becoming homeless. Among Latinas, almost all had migrated to the U.S. (11 out of 12) and each described experiences of being dependent on others for getting to the U.S., housing, employment, and various geographical moves before arriving in Los Angeles. Additionally, over half (8) described living as homeless for over 5 years (one reported being homeless over 16 years). For several of these Latinas, it was difficult for them to identify factors that led to becoming homeless. For example, many of these women had been moving into various homes; dependent on family and friends for a space to sleep in. These Latinas had been “doubling up,” meaning sharing crowded homes that were not meant to accommodate a large number of individuals. People that are “doubling up” are at high risk for becoming homeless if anyone becomes unable to contribute, or even if a slight change occurs in the household. For many individuals, this meant that they had no established residence, as they moved repeatedly until they ended up in skid row. However, “doubling up” is not recognized as a state of being homeless by the federal government, and this leads to an undercount in the homeless count. In contrast, this sample of Black women had not “lived on the edge” (meaning doubling up); and in contrast to the Latina group, only a small number of these Black women [4]reported being homeless for five years or more. The number of years for dealing with homelessness is important, as living in the harsh environment could play into worsening health conditions, along with the loss of family connections for support and emotional well-being.

The narratives from the Latina women also contributed a cultural layer for exploring the state of familismo and filial social support, as the majority described minimum contact with family members, one-half of the participants [6] could not think of anyone they could count on for help in case of emergency. Two of these women felt they could count on a “friend”, although they had not previously reported having such a friend. Interestingly, one woman reported she would count on the paramedics; thus implying she considered first responders to be the only people that she can depend on. When asked about family contact and family based networks, several Latinas expressed that they longed to at least have another woman nearby “I could talk with in Spanish.”

In contrast, with a lifelong history of living in the U.S., the majority of Black women (10 of 13) reported they had family near the city, including mothers, children, and friends they could reach out to if needed. However, the social networks both groups of women alluded to for support was not fully addressed by both the Latina and Black women, and several did not wish to provide further information. Still, one Black woman shared that her physical conditions do not affect her mental status by her remarking “physically I’m fine…we have all the food here; mentally I’m a mess.”

Overall, among the Black women, conversations with other women described as friends were mostly for navigating the system, speaking with social workers, housing managers, or simply carrying on conversations with others residing in skid row. It appears that familismo and fictive kin networks became a hardship and slowly fade with time and the impact of living in the homeless environment.

Discussion

As the demographic and findings reveal, there are salient differences between the sample of Latina and Black women. The one tying thread, or similarity is the lackof family connection and supportive networks frequently attributed to Latino and Black families; especially as social support networks are perceived as contributing to resilience and longevity among these populations. While both the Latina and Black women appeared to be resilient and surviving among the homeless, none seemed to have established functional social networks, much less a supportive network that they could count on. Although several Latinas lamented, “others get to depend on the government and available services granted to citizens” but this does not equate to having a social supportive network that they could count on.

In regard to health, both the Latina and Black women shared that they suffer from a myriad of serious debilitating chronic health conditions, including hypertension, diabetes, asthma, arthritis, previous hospitalization, along with various other debilitating conditions. Among the Black participants, conditions as chronic obstructive pulmonary disease (COPD), manic depression, and post-traumatic stress disorder (PTSD) were mentioned. This suggest that unlike the Latina participants, the Black women had access to medical and mental health services that provided these advanced diagnoses; access and follow-up care that the Latina group did not have access to.

Similar to the issue of health matters, drug use among these women warrants further exploration. For example, unlike previous studies that mention high rates of drug use among some homeless populations, the researchers noted that illicit drug use was mentioned by only one Latina and two Black women participants. This low rate of drug use among the women conflict with previous studies that most often utilize samples of homeless men.

Overall, the narrative from these women were sorrowful and call for aggressive changes and policy development. Future research would expand our lenses on the plight of women who experience homelessness. We suggest that a morecomplete portrait could be gatheredby utilizing amixed quantitative and qualitative approach, with multicultural, multilingual and multidisciplinary teams of researchers and community collaborators. If our goal is to capture the voices of thewomen left alone to live in a harsh, biased, and never ending cycle of homelessness, the changes needed require a more nuanced and social justice systemic approach for dealing with the epidemic of homelessness.

References

  1. National Law Center on Homelessness and Poverty (2017). Don’t count on it. How the HUD point-in-time count underestimates the homelessness crisis in America.
  2. Schneider M, Brisson D, Burnes D (2016) Do we really know how many are homeless?: An analysis of the point-in-time homeless count. Families in Society: The journal of Contemporary Social Services 97: 323-329.
  3. The U.S. Department of Housing and Urban Development (2020).
  4. The 2019 Annual Homeless Assessment Report (AHAR) to Congress. Part 1: Point-In-Time Estimates of the Homeless.
  5. National Law Center on Homelessness & Poverty 2019. Housing and Homelessness in the United States of America.
  6. Los Angeles Homeless Service Authority (2016) 2016 Homeless Count Result Los Angeles County and LA Continuum of Care.
  7. Wenzel S, Tucker J, Hambarsoomian K, Elliot M (2006) Toward a more comprehensive understanding of violence against impoverished women. Journal of Interpersonal Violence 21: 820-839. [Crossref]
  8. Nyamathi AM, Leake B, Gelberg L (2000) Sheltered versus nonsheltered homeless women differences in health, behavior, victimization, and utilization of care. Journal of General Internal Medicine 15: 565-572.[Crossref]
  9. Ruiz ME, Ransford HE (2012) Latino elders reframing familismo: Implications for health and caregiving support. Journal of Cultural Diversity 19: 50-57. [Crossref]
  10. Angel JL, Angel RJ (1992) Age at migration, social connections, and well-being among elderly Hispanics. Journal of Aging and Health 4: 480-499. [Crossref]
  11. Hayes-Bautista D (2004) La Nueva California, Latinos in the Golden State. London: University of California Press.
  12. Markides KS, Coreil J (1986) The health of Hispanics in the Southwestern united States: An Epidemiologic paradox. Public Health Reports 101: 253-265. [Crossref]
  13. Rote S, Angel JL, Markides KS, Hill TD (2018) Neighborhood cohesion and caregiver well-being among the Mexican-origin population. In Contextualizing Health and Aging in the Americas, Eds. WA Vega, JL, Angel LM, Gutierrez Robledo KS, Markides. 295-310.
  14. Almeida J, Morlnar BE, Kawachi I, Subramanian SV (2009) Ethnicity and nativity status as determinants of perceived social support: Testing the concept of families. Social Science & Medicine 68: 1852-1858.[Crossref]
  15. Reyes AM (2018) The economic organization of extended family households by race/ethnicity and socioeconomic status. Journal of Marriage & Family 80: 119-133.[Crossref]
  16. Cook D, Williams TJ (2015) Expanding intersectionality: Fictive kinship networks as supports for the educational aspirations of black women. Western Journal of Black Studies 39: 157-166.
  17. Taylor R, Chatters L, Woodward A, Brown E (2013) Racial and Ethnic Differences in Extended Family, Friendship, Fictive Kin and Congregational Informal Support Networks.
  18. Ruiz ME, Contreras C (in review). Older homeless Latinos: Aging in skid Row.
  19. Perez GK, Cruess D (2011) The impact of familism on physical and mental health among Hispanics in the United States. Health Psychology Review 8: 95-127.

COVID-19 Related Lung Inflammation and Oxidative Stress – a Role for Cannabidiol ?

Keywords

Cannabidiol, CBD, COVID-19, Cytokine release syndrome, Cytokine storm, SARS-CoV-2

Opinion Article

During the recent outbreak of coronavirus SARS-CoV-2,differences in susceptibilities of subjects to the infection with the virus have been observed; not all people exposed to SARS-CoV-2 become infected and not all infected patients develop severe respiratory illness. One of the biggest but still unanswered questions is why some develop severe disease, whilst others do not. Although activation of the endocannabinoid system (ECS) as well as polymorphism of the cannabinoid receptor CB2 influence susceptibility to infections with rhinoviruses [1], the role of the ECS in COVID-19 is unknown. CB2 controls the immune response and its mutant Q63R is known to be less functional and overrepresented in several populations of patients with autoimmune disease. While it increased the risk of severe acute respiratory tract infection (ARTI) in children [2], an eventually increased risk for COVID-19 is currently unknown. Age, sex and comorbidities (or comedications) seem to play a role, including medications taken early at the beginning of symptoms. Whereas risks related to comorbidities have been repeatedly described, assessments of comedications as potential risk factors are still very rare. About 60% of the subjects remain more or less asymptomatic but are carriers who can easily transmit the virus [3]. This percentage varies widely between less than 40% and up to 80% [4,5]; it reflects the lack of reliable data on asymptomatic carriers on one hand, and differences in populations concerning their sensitivity of getting diseased on the other. A minority of subjects develops apparent clinical symptoms after a mean, although variable, incubation period of about one to two weeks. A two-phase division of this clinical symptomatic stage is very important as it will influence the management of patients. The first clinical phase of roughly one week’s duration can be described as a non-severe, immune defence-based, protective phase during which the development of antibodies against the virus particles is of vital importance. This phase is characterised by fever and cough as the two main symptoms, and signs of pneumonia on both lungs. During this period, measures should try to reduce virus load and to boost immune responses or at least avoid drugs that may have a negative impact. Although respective epidemiological data are still missing for SARS-CoV-2,canonical antipyretics and antiinflammatory drugs such as paracetamol (acetaminophen) or aspirin, most of which are available without prescription and taken by patients as self medication (often as first line treatment for viral infections) must be seen with caution. A clinical benefit of these drugs for COVID-19 patients has not been demonstrated. On the contrary, preclinical studies point to an increased risk of mortality in influenza-infected animals, likely reflecting an impaired development of protective immunity [6,7,8]. In humans infected with influenza and rhinovirus, an increased duration of sickness and viral shedding, or at least no clinical benefit has been observed after intake of aspirin and paracetamol but also after a number of other medications such as COX-2 inhibitors [9,10]. Increased risks of complications of community-acquired pneumonia following prior use of non-steroidal antiiflammatory drugs (NSAIDs) have been reported also in numerous recent retrospective studies [11,12,13,14]. In addition, anticoagulants, benzodiazepines and statins which are more frequently used by an elderly population, have also been reported to reduce the virus-specific antibody response [15]. Whether ACE-inhibitors increase the risk for severe COVID-19 or not is still an ongoing debate [16,17]. Intriguingly, some patients treated for mild COVID-19 infection still had coronavirus for up to one week after symptoms disappeared, although this may be much longer in rare cases [18]. Currently, an increasing range of products with widely differing properties and mechanisms are used as experimental treatments to combat SARS-CoV-2, e.g., neuraminidase inhibitors, protease inhibitors (e.g., ritonavir, lopinavir), nucleoside inhibitors (e.g., ribavirin), inhibitors of virus replication (remdesivir), anti-sera, pegylated IFNα or (hydroxy-)chloroquine [19].

A small percentage of patients eventually progress to the second, inflammation-driven, damaging phase with a sudden deterioration around one to two weeks after symptoms onset. This phase is the most severe and characterised by an immune overreaction, with a more or less destroyed immune system, marked lymphocytopenia and an excessive, uncontrolled release of pro-inflammatory cytokines, called cytokine release syndrome or “cytokine storm”. With increasing severity, not only lungs, but multiple organs are involved, including spleen and hilar lymph nodes, heart and blood vessels, liver and gallbladder, kidney, adrenal gland, oesophagus, stomach and intestines. A potential participation of the brain and neuroinvasion of SARS-CoV-2 may easily be overlooked in this phase. According to a retrospective case series of 214 COVID-19 patients, up to 36.4% had neurological symptoms manifested as acute cerebrovascular diseases, consciousness impairment and skeletal muscle symptoms [20,21]. Less severe manifestations are anosmia or, although rarely, ageusia; smell dysfunction are observed in up to 98% of cases [22,23]. The final stage is accompanied by rapid virus replication, a large number of inflammatory cell infiltration, acute lung injury, acute respiratory distress syndrome (ARDS), extrapulmonary systemic hyperinflammation syndrome with damage of the vascular endothelium, and disseminated intravascular coagulation (DIC) which can progress to gangrene at the extremities and death. This has already been observed before in SARS and MERS [24]. At the very end, the cause of death by the virus is the body’s own immune response to the viral infection.Whereas in the first stage of disease anti-viral and supportive treatments are very important, it is evident that at some point during the progress and exacerbation of disease an anti-inflammatory and immunosuppressive intervention can save lives. Virus infection of cells induces oxidative stress: large amounts of highly reactive oxygen species (ROS) are generated in the infected cell, even in the absence of viral replication. This is a common and major pathogenic mechanism for inflammatory response and tissue injury caused by viruses but also by other infectious agents [25,26]. Oxidative stress is associated with oxidative modifications of proteins, nucleic acids and lipids by free radical chain reactions with catastrophic consequences for a normal molecular functioning within cells. Oxidative stress activates a cascade of inflammatory cytokines, notably IL-1, IL-6, IL-8, IL-12, IFN-γ, IL-18 and TNF, of which IL-6 is a protagonist since it predominately induces pro-inflammatory signalling and regulates massive cellular processes. Janus-kinases significantly contribute to this cytokine-induced pro-inflammatory signalling. Cytokines can stimulate more cytokine production and cause many more cytokine receptors to awaken. Uncontrolled, this becomes a “cytokine storm”. Many drugs are known that can interfere with steps of this inflammatory chain reaction such as corticosteroids, cyclosporine, IL-6 inhibitors or Janus-kinase inhibitors (JAK-inhibitors), each having its own mechanism.

Although corticosteroids are known for their anti-inflammatory effects since many decades and have been widely used during the SARS 2003 epidemic in the early acute phase, there is mixed evidence from case series in COVID-19 patients; actually, the WHO does not support their use. Concerns for corticosteroids are that they may delay virus clearance and/or increase the risk of secondary infections [27]. JAK-inhibitors such as baricitinib, ruxolitinib or tofacitinib inhibit autoimmune response to ease inflammation. However, they also inhibit IFN-alpha which is a naturally released cytokine to combat virus infections. A big concern is therefore the decreased resistance to infections. The most preferable treatment method is monotherapy. Among possible side effects JAK-inhibitors may cause anaemia and lymphopenia, although less likely after short exposure. Results of randomised clinical trials for COVID-19 are still lacking.IL-6 inhibitors (e.g., tocilizumab) are monoclonal antibodies that target the pro-inflammatory cytokine IL-6 which is consistently increased in severely ill COVID-19 patients. It is approved in the United States for severe life-threatening cytokine release syndrome and may be an effective treatment also in COVID-19 cytokine storm. Another potential target is the Vascular Endothelial Growth Factor (VEGF); it is responsible for pulmonary oedema and can be suppressed with bevacizumab, a drug, approved by the FDA and widely used in clinical oncotherapy. A naturally occurring substance with a distinctly different mechanism of action is cannabidiol (CBD). Similar to other experimental treatments, it has not yet been used in COVID-19 patients. After almost 50 years of research in man, CBD is recognised as a well tolerated drug with a broad spectrum of activity, and anti-inflammatory, anti-oxidant properties. This has been demonstrated in an animal models of acute lung inflammation [28,29] and in a viral model of multiple sclerosis (Theiler’s murine encephalomyelitis virus-induced demyelinating disease [30], but also in infectious disease models of prion disease [31] and malaria [32]. In another model, CBD reversed oxidative stress parameters, cognitive impairment and mortality in rats submitted to sepsis by coecal ligation and puncture [33].Instead of acting “downstream” on the cytokine cascade such as IL-6 inhibitors or JAK-inhibitors, CBD is an agonist on peroxisome-proliferator activated receptor gamma (PPARg) exerting a dual role as agonist of the nuclear factor erythroid 2 (Nrf2) which plays a key role in cytoprotection against ROS, and as antagonist of the nuclear factor NFκB which mediates the transcription of pro-inflammatory genes (e.g., those coding for inflammatory cytokines) and proteins such as COX-2 [34,35]. The induction of the Nrf2 downstream genes is able to protect the infected cells against virus-induced cellular injury. By the same Nrf2 pathway, lung inflammation induced by lipopolysaccharide (LPS) is also alleviated by activation of PPARg resulting in improved lung function [28]. CBD inhibits also the VEGF [36]. To note, some patients demonstrated a pathological autoimmune response with high titer of antiphospholipid and other auto-antibodies. At this stage, the initiation of immunosuppressive, anti-inflammation therapy is critical for reducing death rate of COVID-19 patients. Attenuation of oxidative stress and inflammation by a pharmacological measure is therefore highly beneficial for lessening a virus-induced lung injury and exacerbation of existing respiratory diseases [35].

Overall, this means that CBD normalises the physiologic redox balance which is disturbed by the virus-induced cellular injury and restores the self-defence mechanism of the cell. As CBD is a multi-target drug, direct effects on other receptors (GPR55, 5-HT1A, A2A) and on ion channels (notably TRPV1) as well as indirect effects on endocannabinoid levels (notably AEA) that interact on their turn with a number of targets, contribute to the overall restoration and normalisation of physiologic processes in cells [37]. In contrast to IL-6 inhibitors given as example, CBD does not act just on one target but protects the host cells by multiple mechanisms. Simply described, instead of interfering as mailman with receptors, CBD manages the post office.Moreover, because of its chemical structure, CBD has also an immediate direct, strong antioxidant effect exceeding vitamin E and vitamin C, capturing free radicals or transforming them into less active forms. This considerably reduces the destruction of biological molecules by highly reactive oxygen species (ROS) generated in the virus-infected cell. CBD has already been used in a daily dose of 300mg combined with standard Graft-versus-Host-Disease (GVHD) prophylaxis consisting of cyclosporine and a short course of methotrexate in the prevention of GVHD [38]. In comparison to a historic control group which did not receive CBD, acute GVHD was significantly delayed and tolerance significantly improved. Various animal models demonstrate that doses of 5mg CBD/kg and above are effective as antioxidant. Moreover, CBD easily crosses the blood-brain barrier and is able to combat a potential neuroinvasion of SARS-CoV-2 and neuroinflammation; recently, a case of a patient who was diagnosed with viral encephalitis in Beijing Ditan Hospital has already been described [39].In addition to mitigating lung inflammation, beneficial effects of CBD have been demonstrated on other aspects related to COVID-19 such as on endothelial cells (vasorelaxation [40], diabetes [41,42,43] and stress-induced hypertension [44,45]. CBD has already been proposed previously as possible treatment for individuals with post Ebola sequelae [46].All depends on a prompt diagnose and application of such therapy. CBD is safe to use, can be administered already early in the inflammatory phase and can be combined with a large number of other medications such as antibiotics. Recently, a 10% oral solution of CBD containing 7.9% ethanol has received marketing authorisation. Pharmacy preparations based on crystalline CBD can be prepared as capsules (up to 200mg) or as suppositories (up to 300mg) for those patients that need intubation and assisted breathing (e.g., >99.8% phyto-CBD, BSPG Laboratories Ltd, Sandwich, UK or CannPico Research & Marketingservice GmbH, Vienna, Austria).Based on its pharmacological effects and favourable safety profile, CBD of known purity, composition and stability should be considered as a potential treatment for individuals with SARS-CoV-2infections.

References

  1. Tahamtan A, Tavakoli-Yaraki M, Shadab A, Rezaei F, Marashi SM, et al. (2018) The role of cannabinoid receptor 1 in the immunopathology of Respiratory Syncytial Virus. Viral Immunol31: 292-298. (Crossref)
  2. Tahamtan A, Samieipoora Y, Nayerib FS, Rahbarimaneshc AA, Izadic A, et al. (2018) Effects of cannabinoid receptor type 2 in respiratory syncytial virus infection in human subjects and mice. Virulence 9: 217-230. (Crossref)
  3. Li P, Fu JB, Li KF, Chen Y, Wang HL, et al. (2020) Transmission of COVID-19 in the terminal stage of incubation period: a familial cluster. Int J Infectious Diseases. (Crossref)
  4. Javid B, Weekes MP, Matheson NJ (2020) Covid-19: should the public wear face masks? Yes—population benefits are plausible and harms unlikely. BMJ.
  5. Li G, Li W, He X, Cao Y (2020) Asymptomatic and Presymptomatic Infectors: Hidden Sources of COVID-19 Disease. Clin Infect Dis.
  6. Eyers S, Weatherall M, Shirtcliffe P, Perrin K, Beasley R (2010) The effect on mortality of antipyretics in the treatment of influenza infection: systematic review and meta-analyis.J R Soc Med103: 403-411. (Crossref)
  7. Prymula R, Esposito S, Zuccotti GV, Xie F, Toneatto D, et al. (2014) A phase 2 randomized controlled trial of a multicomponent meningococcal serogroup B vaccine (I): Effects of prophylactic paracetamol on immunogenicity and reactogenicity of routine infant vaccines and 4CMenB. Hum Vaccin Immunother10: 1993-2004. (Crossref)
  8. Saleh E, Moody MA, Walter EB (2016) Effect of antipyretic analgesics on immune responses to vaccination. Human Vaccines & Immunotherapeutics12: 2391-2402. (Crossref)
  9. Graham NMH, Burrell CJ, Douglas RM, Debelle P, Davies L (1990) Adverse effects of aspirin, acetaminophen, andibuprofen on immune function, viral shedding, and clinical status in rhinovirus-infected volunteers. J Infect Dis162: 1277-1282. (Crossref)
  10. Jefferies S, Braithwaite I, Walker S, Weatherall M, Jennings L, et al. (2015) Randomized controlled trial of the effect of regular paracetamol on influenza infection. Respirology.
  11. Basille D, Thomsen RW, Duhaut P, Andrejak C, Jounieaux V, et, al. (2018) NSAIDs-Outcomes of Community-acquired Pneumonia. American J Respiratory and Critical Care Medicine198: 128-131.
  12. Kotsiou OS, Zarogiannis SG, Gourgoulianis KI (2017) Prehospital NSAIDs use prolong hospitalization in patients with pleuro-pulmonary infection. Respiratory Medicine123: 28-33.(Crossref)
  13. Le Bourgeois M, Ferroni A, Leruez-Ville M, Varon E, Thumerelle C, et al. (2016) Nonsteroidal anti-inflammatory drug without antibiotics for acute viral infection increases the empyema risk in children: A Matched Case-Control Study. J Pediatrics175: 47-53.
  14. Voiriot G, Philippot Q, Elabbadi A, Elbim C, Chalumeau M, et al. (2019) Risks related to the use of non-steroidal anti-inflammatory drugs in community-acquired pneumonia in adult and pediatric patients. J Clin Med.
  15. Huemer HP (2015) Possible immunosuppressive effects of drug exposure and environmental and nutritional effects on infection and vaccination. Mediators Inflamm.
  16. Bean DM, Kraljevic Z, Searle T, Bendayan R, Pickles A, et al. (2020) Treatment with ACE-inhibitors is associated with less severe disease with SARS-Covid-19 infection in a multi-site UK acute Hospital Trust. (preprint).
  17. Fang L, Karakiulakis G, Roth M (2020) Are patients with hypertension and diabetes mellitus at increased risk for COVID-19 infection?. The Lancet.
  18. Shi Y, Wang Y, Shao C, Huang J, Gan J, et al. (2020) COVID-19 infection: the perspectives on immune responses. Cell Death & Differentiation 27: 1451-1454.
  19. Agrawal S, Goel AD, Gupta N (2020) Emerging prophylaxis strategies against COVID-19. Monaldi Archives for Chest Disease 90: 169-172. (Crossref)
  20. Chen N, Zhou M, Dong X, Qu J, Gong F, et al. (2020) Epidemiological and clinical characteristics of 99 cases of 2019 novel coronavirus pneumonia in Wuhan, China: a descriptive study. Lancet 395: 507-513.
  21. Mao L, Wang M, Chen S, He Q, Chang J, et al.(2020) Neurological Manifestations of Hospitalized Patients with COVID-19 in Wuhan, China: a retrospective case series study. JAMA Neurol.
  22. Lüers JC, Klußmann JP, Guntinas-Lichius O (2020) The Covid-19 pandemic and otolaryngology: What it comes down to?.Laryngo-Rhino-Otol. (Crossref)
  23. Moein ST, Hashemian SMR, Mansourafshar B, Khorram-Tousi A, Tabarsi P, Doty RL (2020) Smell Dysfunction: A Biomarker for COVID-19. Int Forum Allergy Rhinol. (Crossref)
  24. Zhang W, Zhao Y, Zhang F, Wang Q, Lib T, et al. (2020) The use of anti-inflammatory drugs in the treatment of people with severe coronavirus disease 2019 (COVID-19): The Perspectives of clinical immunologists from China. Clinical Immunology. (Crossref)
  25. Kaul P, Biagioli MC, Singh I, Turner RB (2000) Rhinovirus-Induced Oxidative Stress and Interleukin-8 Elaboration Involves p47-phox but Is Independent of Attachment to Intercellular Adhesion Molecule–1 and Viral Replication. J Infectious Diseases 181:1885–1890. (Crossref)
  26. Schwarz KB (1990) Oxidative stress during viral infection: a review. Free Radical Biology & Medicine21: 641-649.(Crossref)
  27. Russell B, Moss C, Rigg A, van Hemelrijck M (2020) COVID-19 and treatment with NSAIDs and corticosteroids: should we be limiting their use in the clinical setting?.ecancermedicalscience. (Crossref)
  28. Ribeiro A, Almeida VI, Costola-de-Souza C, Ferraz-de-Paula V, Pinheiro ML, et al. (2015) Cannabidiol improves lung function and inflammation in mice submitted to LPS-induced acute lung injury. Immunopharmacol Immunotoxicol37: 35-41. (Crossref)
  29. Vuolo F, Petronilho F, Sonai B, Ritter C, Hallak JEC, et al (2015) Evaluation of serum cytokines levels and the role of cannabidiol treatment in animal model of asthma. Mediators of Inflammation. (Crossref)
  30. Mecha M, Feliu A, Inigo PM, Mestre L, Carillo-Salinas FJ, et al. (2013) Cannabidiol provides long-lasting protection against the deleterious effects of inflammation in a viral model of multiple sclerosis: a role for A2A receptors. Neurobiol Dis.
  31. Dirikoc S, Priola SA, Marella M, Zsürger N, Chabry J (2007) Nonpsychoactive Cannabidiol Prevents Prion Accumulation and Protects Neurons against Prion Toxicity. The Journal of Neuroscience27: 9537-9544. (Crossref)
  32. Campos AC, Brant F, Miranda AS, Machado FS, Teixeira AL (2015) Cannabidiol increases survival and promotes rescue of cognitive function in a murine model of cerebral malaria. Neuroscience 289:166-180. (Crossref)
  33. Cassol OJ, Comim CM, Silva BR, Hermani FV, Constantino LS, et al. (2010) Treatment with cannabidiol reverses oxidative stress parameters, cognitive impairment and mortality in rats submitted to sepsis by cecal ligation and puncture. Brain Res1348: 128-138. (Crossref)
  34. Atalay S, Jarocka-Karpowicz I, Skrzydlewska E (2020) Antioxidative and anti-inflammatory properties of cannabidiol. Antioxidants (Basel).
  35. Lee C (2018) Therapeutic Modulation of Virus-Induced Oxidative Stress via the Nrf2-Dependent Antioxidative Pathway. Oxidative Medicine and Cellular Longevity.(Crossref)
  36. Tagne AM, Pacchetti B, Sodergren M, Cosentino M, Marino F (2020) Cannabidiol for viral diseases: hype or hope?.Cannabis and Cannabinoid Research.
  37. Nahler G, Jones T, Russo EB (2019)Cannabidiol and contributions of major hemp phytocompounds to the “Entourage Effect”; possible mechanisms.J Altern Complement Integr Med.
  38. Yeshurun M, Shpilberg O, Herscovici C, Shargian L, Dreyer J, et al. (2015) Cannabidiol for the prevention of Graft-versus-Host-Disease after allogeneic hematopoietic cell transplantation: Results of a phase II study. Biol Blood Marrow Transplant21:1770-1775. (Crossref)
  39. Li Z, Huang Y, Guo X (2020) The brain, another potential target organ, needs early protection from SARS-CoV-2 neuroinvasion. Sci China Life Sci63: 771-773.(Crossref)
  40. Stanley CP, Hind WH, O’Sullivan SE (2013) Is the cardiovascular system a therapeutic target for cannabidiol? Brit J Clinical Pharmacol75: 313-322. (Crossref)
  41. Ehud Z, Lola W L, Itamar R, Natan Y, Zhanna Y, Ruth G (2012) Islet protection and amelioration of diabetes type 2 in Psammomys obesusby treatment with cannabidiol. J Diabetes Mellitus2: 27-34.
  42. Horvath B, Mukhopadhyay P, Hasko G, Pacher P (2012) The Endocannabinoid System and Plant-Derived Cannabinoids in Diabetes and Diabetic Complications. The American Journal of Pathology180:432-442. (Crossref)
  43. Wheal AJ, Jadoon K, Randall MD, O’Sullivan SE (2017) in vivo cannabidiol improves endothelium-dependent vasorelaxation in mesenteric arteries of Zucker diabetic fatty rats. Front Pharmacol. (Crossref)
  44. Bitencourt RM, Takahashi RN (2018) Cannabidiol as a therapeutic alternative for post-traumatic stress disorder: From bench research to confirmation in human trials. Front Neurosci. (Crossref)
  45. Jadoon KA, Tan GD, O’Sullivan SE (2017) A single dose of cannabidiol reduces blood pressure in healthy volunteers in a randomized crossover study. JCI Insight. (Crossref)
  46. Reznik SA, Gardner EL, Ashby CR (2016) Cannabidiol: a potential treatment for post Ebola syndrome?.Int J Infect Diseases 52: 74-76. (Crossref)

When two pandemics meet

DOI: 10.31038/EDMJ.2020423

Abstract

The COVID-19 pandemic has emerged in the middle of another pandemic which is far from under control: the cardiometabolic syndrome pandemic. Recently published data suggests patients with obesity are at a higher risk of being hospitalized and placed on a mechanical ventilator for COVID-19 than patients with a normal body weight. We discuss the pathophysiology behind this relationship and the implications in the global fight against COVID-19.

Keywords

COVID-19; coronavirus; obesity; cardiometabolic syndrome.

No one single mechanism is responsible for disease progression into severity in COVID-19 cases as in almost all diseases -chronic or not, transmissible or not-. We as scientists are trained to observe, identify differences and similarities between cases and arrive at possible explanations called hypothesis that can help the scientific community to develop effective strategies to combat the illness.

To this day several factors have been identified and when put together they tell a storyline that sums up the pathophysiology of severity in COVID-19 shown in Figure 1.

EDMJ-4-2-405-g001

Figure 1. Schematic representation of shared pathophysiology in COVID-19 cases with underlying metabolic illness. [1]. DIC: Disseminated Intravascular Coagulation.

But how does this scenario come to be? The answer comes from a previous pandemic that has been around for many years: the Cardiometabolic Syndrome (CMS) pandemic. CMS is defined by a combination of metabolic disorders that include diabetes mellitus, systemic arterial hypertension, central obesity, and dyslipidemia. All these conditions lead to elevated heart disease risk, which in turn is the leading cause of death in first world countries and doesn´t fall far behind in the rest of the world as well. This global epidemic to some doesn´t seem so scary being that it cannot be transmitted through droplets or by touching “infected” surfaces. Thisidea, however, isn´t completely true. The first risk factor for this group of diseases is being overweight or obesity, and this is in a sense “transmitted”. Eating habits are a cultural phenomenon, and from one generation to the next, families and communities pass on grocery lists, recipes and pantry contents. As of 2019 the global mean prevalence of obesity was measured at 19.5%. This number has almost tripled since 1975 and is currently the number one risk factor associated with premature death. Obesity as a risk factor for disease usually means it leads to chronic diseases such as the ones previously mentioned, but nowadays we are observing a different consequence of being overweight. An elevated body mass index has become a high-risk factor for severity in COVID-19 cases. [2]

Table 1 shows the evidence on the previous statement. A study by Zheng et al of 214 patients in Wuhan, China with laboratory confirmed COVID-19 showed that the presence of a Body Mass Index (BMI) >25 kg/m2 was associated with a near-6 fold increased risk of severe illness, even after adjusting for age and other comorbidities. [3] Of 4,103 COVID-19 cases in New York City the chronic condition which conferred the strongest association with critical illness was obesity, with 39.8% of hospitalized patients having obesity. [4]

Table 1. Epidemiological studies on COVID-19 outcomes and obesity related risk-factors

Author, Region and Date

Subjects

Findings

Z. Wu [7]
Mainland China
Updated Feb 11, 2020

72,314 suspicious cases of COVID-19
44,672 lab-confirmed cases

2.3% Case-Fatality Rate
Mild cases 81%
Severe cases 14%
Critical cases 5%

S. Garg [8]
USA (COVID-NET)
March 1-30, 2020

1,482 hospitalized patients

89% of patients had one or more underlying conditions:
Hypertension 49.7%
Obesity 48.3%
Chronic lung disease 34.6%
Diabetes Mellitus 28.3%
Cardiovascular disease 27.88%

Among patients 18-49 years-old obesity was the most prevalent underlying condition (59%).

P. Goyal [9]
New York City, US
Mar 3-27, 2020

First 393 cases of COVID-19 adults hospitalized in New York

Patients who required invasive mechanical ventilation were more likely to be male, have obesity and elevated liver-function and inflammatory markers.

S. Richardson [10]
New York, USA
Mar 1 – Apr 4, 2020

5,700 hospitalized patients

Most common comorbidities among hospitalized patients:
Hypertension 56.6%
Obesity 41.7% – (Morbid obesity 19%)
Diabetes Mellitus 33.8%

G. Grasselli [11]
Milan, Italy
Feb 20 – Mar 18, 2020

73 patients in intensive care unit

Over 80% of patients in ICU were overweight or had obesity.
Normal weight – 19%
Overweight – 51.9%
Obesity 1 – 15.4%
Obesity 2 – 11.5%
Obesity 3 – 1.9%

Zheng [3]
Wenzhou, China
Jan 1 – Feb 29, 2020

214 patients with lab confirmed COVID-19
Ages 18-75

A BMI equal to or greater than 25 kg/m2 was associated with a 6-fold increased risk of severe illness.
This risk remained significant even after adjusting for age and other comorbidities.

Petrilli [4]
New York
Mar 1 – Apr 7, 2020

4,103 cases of COVID-19
1,999 hospitalized

The chronic condition with the strongest association to critical illness was obesity.
39.8% of hospitalized patients had obesity.

Qingxian [12]
Mainland China
Jan 11 – Feb 16, 2020

383 patients admitted to a hospital in Shenzen

After adjusting for age, sex, disease history and treatment the overweight group was 2.42 times more likely to develop severe pneumonia.

A. Simonnet [5]
Lille, France
Feb 27 – Apr 5, 2020

124 patients admitted to ICU for COVID-19.
Compared to control group from 2019

Obesity was significantly more frequent among cases of COVID-19 (47.6%) compared to control group (25.2%).
The median BMI of patients requiring intubation was 31.1 kg/m2 compared to 27 kg/m2 in the patients who did not require intubation.
In individuals with a BMI ³35 kg/m2 the odds ratio for intubation was 7.36 compared to individuals with a normal BMI.

Among 124 patients admitted for COVID-19 to a hospital in Lille, France 47.6% had obesity. Patients with a BMI of greater than 35 kg/m2 were 7.36 times more likely to require a ventilator than patients with a BMI of less than 25 kg/m2. [5] In Milan more than 80% of 73 patients treated in an ICU were overweight or had obesity, when the rates of overweigh and obesity in Italy are only 35.4% of the population. [6]

Two main explanations play a role in this complicated infectious disease in association with weight problems. The first one is the chronic inflammatory state it conveys. Recent studies have found that adipose tissue secretes extracellular vesicles that function as vectors which can modify cellular function in the recipient through the information they carry. Data suggests that this mechanism is used by fat to induce monocyte differentiation into active macrophages and high secretion of IL-1 and TNF-α among other cytokines. [13] The second one is the fact that patients with obesity have been found to have higher concentrations of pro-thrombotic factors as compared to normal-weight controls. Some of these altered parameters include higher D-dimer, fibrinogen and factor VII; as well as lower fibrinolysis because of higher plasminogen activator inhibitor-1. [14]

Besides increased inflammatory cytokines, obesity englobes several pathophysiological factors which affect the risk and outcomes of patients with COVID-19. In the respiratory tract obesity may cause pulmonary restriction, decreased pulmonary volumes and ventilation-perfusion mismatching. Patients with obesity are more likely to present diabetes mellitus and atherosclerosis which may be complicated by COVID-19. Additionally, there is limited data on the right dosing of antimicrobials in obesity and bioavailability of drugs used to treat patients with this disease may be affected by altered protein binding, metabolism and volume of distribution. [15]

On the other hand, new information is developing every day concerning COVID-19 cases and more data is suggesting that bad prognosis is linked to thromboembolic events caused by inflammation, hypoxia and coagulation abnormalities. One study by Klok et alstudied 184 Intensive Care Unit (ICU) patients with confirmed COVID-19, and found that 31% showed thrombotic complications, of which 81% was due to pulmonary embolism. [16] When we put two and two together, the relationship becomes apparent. Obesity is a clear catalyzer for severe COVID-19 cases. In a country like Mexico, where the prevalence for overweight and obesity in over 20-year-olds is 75.2%, this relationship is very threatening. [17]

It seems that the best way to prevent bad outcomes from this novel disease (as well as from infectious diseases in general) is to be in good health prior to contracting it in the first place. As for those patients who already suffer from CMS or one of its components, preventive treatment is our main recommendation. These patients should be at optimal glycemic, systemic arterial pressure and cholesterol level goals. A study by Carter et al also suggests that vitamin D deficiencies (also more common in patients with obesity) have been linked to worse cytokine storms. To this end, physical activity as well as sun exposure is effective ways to boost vitamin D levels. [18]

This sound reasonable, right? Well, reasonable doesn´t always mean achievable in all populations. Vulnerable communities around the world are struggling every day just to have access to general medical attention. These communities are also at an increased risk of exposure to COVID-19. Working from home is a privilege that is unavailable for many people from a lower socio-economic status. Social distancing is considerably more difficult for people living in overcrowded neighborhoods. Emerging epidemiological studies in the U.S. suggest a disproportionate burden of illness and higher death rates among minority groups. [9]

Currently there is no gold standard treatment for COVID-19, however, all this data suggests that global efforts need to be directed towards prevention and education. Pre-existing conditions need to be under control and lifestyle habits should be aimed towards getting enough exercise and a proper nutrition. [19,20]

References

  1. Xiong M, Liang X, Wei YD (2020) Changes in Blood Coagulation in Patients with Severe Coronavirus Disease 2019 (COVID‐19): A Meta‐Analysis. Br J Haematol.[crossref]
  2. Blüher M (2019)Obesity: global epidemiology and pathogenesis. Nat Rev Endocrinol15:288-298.
  3. Zhou F, Yu T, Du R, Fan G, Liu Y et al. (2020) Clinical course and risk factors for mortality of adult inpatients with COVID-19 in Wuhan, China: a retrospective cohort study. The Lancet.395: 1054-1062. [crossref]
  4. Petrilli CM, Jones SA, Yang J, Rajagopalan H, O’Donnell LF, Chernyak Y, Horwitz LI (2020) Factors associated with hospitalization and critical illness among 4,103 patients with COVID-19 disease in New York City. medRxiv.
  5. Simonnet A, Chetboun M, Poissy J, Raverdy V, Noulette J et al. (2020) Intensive Care COVID‐19 and Obesity study group. High prevalence of obesity in severe acute respiratory syndrome coronavirus‐2 (SARS‐CoV‐2) requiring invasive mechanical ventilation. Obesity.[crossref]
  6. Zangrillo A, Beretta L, Scandroglio AM, Monti G, Fominskiy E (2020) Characteristics, treatment, outcomes and cause of death of invasively ventilated patients with COVID-19 ARDS in Milan, Italy. Crit Care Resusc.[crossref]
  7. Wu Z, McGoogan JM (2020) Characteristics of and important lessons from the coronavirus disease 2019 (COVID-19) outbreak in China: summary of a report of 72 314 cases from the Chinese Center for Disease Control and Prevention. Jama.[crossref]
  8. Garg S (2020) Hospitalization rates and characteristics of patients hospitalized with laboratory-confirmed coronavirus disease 2019—COVID-NET, 14 States, March 1–30, 2020. MMWR. Morbidity and Mortality Weekly Report 69.
  9. Goyal P, Choi JJ, Pinheiro LC, Schenck EJ, Chen R, Jabri A, Hoffman KL (2020) Clinical Characteristics of Covid-19 in New York City. New England Journal of Medicine..[crossref]
  10. Richardson S, Hirsch JS, Narasimhan M, Crawford JM, McGinn T et al. (2020) Presenting Characteristics, Comorbidities, and Outcomes Among 5700 Patients Hospitalized With COVID-19 in the New York City Area. JAMA.[crossref]
  11. Grasselli G, Zangrillo A, Zanella A, Antonelli M, Cabrini L et al. (2020) Baseline characteristics and outcomes of 1591 patients infected with SARS-CoV-2 admitted to ICUs of the Lombardy Region, Italy. Jama. [crossref]
  12. Qingxian C, Fengjuan C, Fang L, Xiaohui L, Tao W et al. (2020) Obesity and COVID-19 severity in a designated hospital in Shenzhen, China. China.
  13. Kim A, Shah AS, Nakamura T (2018) Extracellular Vesicles: A Potential Novel Regulator of Obesity and Its Associated Complications. Children 5: 152.[crossref]
  14. De Pergola G, Pannacciulli N (2002) Coagulation and fibrinolysis abnormalities in obesity. J Endocrinol Invest25: 899-904.[crossref]
  15. R Huttunen, J Syrja¨nen (2013) Obesity and the risk and outcome of infection. International Journal of Obesity37: 333-340.[crossref]
  16. Klok FA, Kruip MJHA, van der Meer NJM, Arbous MS, GommersDAMPJ et al. (2020) Incidence of thrombotic complications in critically ill ICU patients with COVID-19. ThrombosisResearch.[crossref]
  17. Romero-Martínez M, Shamah-Levy T, Vielma-Orozco E, Heredia-Hernández O, Mojica-Cuevas J et al. (2019) Encuesta Nacional de Salud y Nutrición (Ensanut 2018): metodología y perspectivas. salud pública de México 61: 917-923.
  18. Carter SJ, Baranauskas MN, Fly AD (2020) Considerations for obesity, vitamin D, and physical activity amidst the COVID‐19 pandemic. Obesity.
  19. Smith JA, Judd J (2020) COVID‐19: Vulnerability and the power of privilege in a pandemic. Health Promotion Journal of Australia 31: 158.[crossref]
  20. Ahmed F, Ahmed NE, Pissarides C, Stiglitz J (2020) Why inequality could spread COVID-19. The Lancet Public Health5: 240.[crossref]

Treatment of Patella Infera Following Closed Trauma by a Combination of Patella Tendon Tenotomy and Tuberositas Tibia Osteotomy and Augmentation with Semitendinosus Tendon Autograft

DOI: 10.31038/IJOT.2020315

Abbreviations

ROM = Range of Motion

Keywords

Patella infera, patella baja, patella tendon tenotomy, Z-plasty, tuberositas tibia osteotomy, tendon autograft augmentation, semitendinosus.

Introduction

Patella Infera (PI) is a rare condition presenting with shortening of the patella tendon. PI can be seen as a congenital abnormality, or as a complication secondary to trauma or kneesurgery [1-5]. It was first described in 1982 by Caton et al. and was defined as a Caton-Deschamps index £ 0.66. The Caton-Deschamps index is assessed on a knee x-ray in sagittal view where the length of the patella tendon, defined as the distance from the lower patella pole to the superior part of the tibial tubercle, is divided by the length of the patella, defined as the greatest diagonal length measured[6]. A normal Caton-Deschamps index is defined as an index in the range > 0.6 or < 1.26. Clinically the condition presents with symptoms of decreased ROM, lach of knee flexion, patellofemoral knee pain and accelerated progression of patellofemoral osteoarthritis [3].

There is no consensus on treatment method of patella infera, it has been proposed that surgery is indicated, when the Caton-Deschamps index is lower than or equals 0.6(6). The two main surgical treatment modalities include a z-plasty of the patella tendon or an osteotomy of the tibial tuberositas. It has been suggested to use a z-plasty, when the Caton-Deschamps index is ≤ 0.6 and the patella tendon is < 25 mm, and to use the tuberositas osteotomy when the Caton-Deschamps index is ≤ 0.6 and the patella tendon is > 25 mm(6). Immediate postoperative mobilization and physiotherapy is required to learn to activate the quadriceps muscle, and focus on strengthening exercises of the muscle has been described to be the most important post-operative regime to prevent relapse of patella infera[5, 6]. This case describes a severe secondary developed patella infera after conservative treatment of a patella fracture. Surgical technic is done with a combination of patella tendon tenotomy and tuberositas tibia osteotomi and augmentation with semitendinosus allograft. Previous reports of surgical treatment of patella infera is done with either a z-plasty or tuberositas tibia osteotomy, no previous reports have to our knowledge described the surgical treatment of patella infera with a combination of the two treatment modalities.

Case Report

A healthy fifty-five year old woman slipped and fell onto her left knee while walking. She reported pain and difficulties in both flexion and extension of the knee. X-ray revealed a comminuted non-displaced fracture of the inferior pol of the patella (Figure 1). The knee was immobilized in full extension for 6 weeks and weight-bearing was allowed within the limits of pain. X-ray made 3 months after the injury revealed early union of the fracture. Five months following the fracture she presented with limited range of motion with reduced knee-flexion to 95 degrees despite a specialized physiotherapy rehabilitation training program. The rehabilitation program was continued but 8 months following the fracture she presented with pain, aggravation of the affected knee flexion and inability to follow her rehabilitation. Clinical examination revealed atrophy of the quadriceps muscle, knee-flexion reduced to 30 degrees, full knee-extension but inability to raise the leg in full extension. A MR-scan and x-ray showed severe patella infera with a Caton-Deschamps index of 0.3 and a patella tendon measuring only 13 mm (Figure 2a + Figure 2b ).

IJOT-3-1-306-g001

Figure 1. X-ray showing a comminute non-displaced fracture of the inferior patella pol of after closed trauma to the left knee.

IJOT-3-1-306-g002

Figure 2. A: Pre-operative x-ray of the left knee with distinct patella-infera with a Caton-index of 0.3 B: Pre-operative x-ray of the right healthy knee, no patella infera. C: X-ray of the left knee after osteotomy, Caton index = 0.56. D: X-ray after osteotomy and Z-plasty with a Caton-Deschamps index of 0.8 as a final result.

The Caton-Deschamps index was at time of injury 0,9 as well as 9 days later. After 45 days it reduced to 0,44 . After 10 months the measurement was 0,3 reduced to 0,2 after one year. Because of the severity of the patella infera it was planned to preform both a osteotomy of the tibial tuberositas and a z-plasty of the patella-tendon following augmentation with the semitendinosus-tendon. Pre-operative an Oxford 12-item Knee Score was made resulting in a score of 7.

Results

First, a osteotomy was preformed (Figure 3a + Figure 3b) and the tibial tuberositas was inserted 18 mm proximal to the origin resulting in a Caton-index of 0.56 (0.25 prior) (Figure 2c). Thereafter, the patella-tendon was extended by 1 cm to a full length of 23 mm(13 mm prior) by a z-plasty (Figure 3c) resulting in a final Caton-Deschamps index of 0.8 (Figure 2d). Finally the tendon was augmented by the semitendinosus-tendon (Figure 3d). After the procedure it was possible for the operator to flex the knee 110 degree (30 degree pre-operative). Post-operative regime was planned which included 1) mobilization with don-joy-bandage in 0-30 degree and only partial weight bearing in full extension for 2 weeks, then 0-60 degrees for 2 weeks and full weight-bearing and then  0-90 degrees for 2 weeks, 2) CMP-machine with mobilization 0-60 degrees without the bandage 4 times per day for 4 weeks, 3) early training instructed by physiotherapist and 4) EL-stimulation of the quadriceps muscle. 8 weeks after the operation she was able to perform knee flexion to 95 degrees and had a good knee stability and she was given no limitation in range of motion. 3 months after the operation she was capable of performing 100 degrees knee flexion and full extension at clinical examination. The Oxford 12-item Knee Score was repeated resulting in a score of 42 which indicates satisfactory joint function.

IJOT-3-1-306-g003

Figure 3. A and B shows the osteotomy of the tuberositas tibia. C: Illustrates the z-plasty of the patella-tendon, note the markedly sclerosis of the tendon. D: Final result after osteotomy, z-plasty and augmentation with the semitendinosus-tendon.

Discussion

This case report describes a sucessefull treatment of PI with a combination of two well established surgical methods; a tibial tubercle transfer and a Z-plasty of the patella tendon.Because of the poor quality of patella tendon after post traumatic patella infera it was decided to   reinforces  it  with the semitendinosus-tendon. It assures a safe heeling of the Z-plasty and allows  a postoperative early mobilization by ROM as well as an aggressive rehabilitation that is in this case extremely important to get a good final result.

The literature has no clear consensus on optimal treatment of PI and the rarity of PI does not allow any RCT study to be performed. To our knowledge it is the first time the two surgical approaches has been combined, and the obtained Caton-Dechampes index and high Oxford knee score confirms our theory of a succesfull combination. However our weakness could be the short follow up period mainly do to relapse as previous described in the literature. In conclusion the combined surgical methods could be an alternative in treating patella infera.

References

  1. Morshed S, Ries MD (2002) Patella infera after nonoperative treatment of a patellar fracture: A case report. J Bone Joint. Surg Am84: 1018-1021.[Crossref]
  2. Jiang X, Zhang YM, Liu JY (2013) Patella infera following patellar tendon contracture after closed trauma. ChinMed J (Engl)126: 3990-3991.[Crossref]
  3. Kennedy MI, Aman Z, DePhillipo NN, LaPrade RF (2019) Patellar tendon tenotomy for treatment of patella baja and extension deficiency. Arthrosc Tech8: 317-320.
  4. Guido W, Christian H, Elmar H, Elisabeth A, Christian F (2016) Treatment of patella baja by a modified Z-plasty. Knee Surgery, Sport Traumatol Arthrosc24: 2943-2947.[Crossref]
  5. Bruhin VF, Preiss S, Salzmann GM, Harder LP (2016)Frontal tendon lengthening plasty for treatment of structural patella baja. Arthrosc Tech5: 1395-1400.
  6. Caton JH (2010) The management of patella infera in current practice. Eur J Orthop Surg Tramatol20: 265-271.

“Thrower’s Fracture”- A Humeral Fracture

DOI: 10.31038/IJOT.2020314


A 24-year-old right dominant male threw a softball extremely hard from outfield. A loud, crackingnoise was accompanied by pain and inability to lift his right arm. Radiographs performed in ED revealed a severe displaced, comminuted fracture of the right humerus known as a “thrower’s fracture” (Figures 1,2). The patient was a healthy, recreational athlete. A blood test, bone scan, and MRI all revealed negative results for bone pathology prior to surgical open reduction internal fixation (ORIF) of the right humerus (Figure 3).

IJOT-3-1-305-g001

Figure 1. A-P Radiograph with comminuted fracture of right humerus.

IJOT-3-1-305-g002

Figure 2. IR-AP of Right humerus.

IJOT-3-1-305-g003

Figure 3. Post-surgical A-P radiograph.a

Thrower’s fracture, somewhat rare, is an acute fracture of the mid-to-distal third of the humeral diaphysis during a forceful throwing motion, usually involving an excessive torque during the cocking and acceleration phase of motion [1, 2]. The internal rotation of the latissimus dorsi, subscapularis, and pectoralis major all contribute to the strong internal rotation force. During the cocking and throwing phase, a torsional force is applied to the humeral insertion of these muscles while the distal humerus is external rotation, causing a spiral type fracture. Thrower’s fracture is seen more in ages 20s-30s or recreational athletes, who often lack cortical hypertrophy seen in professional pitchers [1, 2] rarely is the radial nerve, involved, but if injured, usually heals without surgical involvement [1, 2].

No post-op complications or radial nerve involvement were noted. A sling was worn for 2 weeks and ROM began at 4 weeks. He resumed light duty work at 2 months. Full ROM, less 3ºextension was obtained. At 3 months post-surgery, he resumed gym workouts, but no recreational softball.

References

  1. Colapinto MN, Schemitsch EH, Wu L (2006) Ball-thrower’s fracture of the humerus. Canadian Med Assc J 175:33.
  2. Miller A, Dodson CC, Ilyas AM (2014) Thrower’s fracture of the humerus. Orthop Clin North Am 45:565-569.