Archives

fig 4

Effects of Photoenhanced Thin Oil Sheens on Survival and Growth of Newly Hatched Fishes: Sheepshead Minnow (Cyprinodon variegatus), spotted seatrout (Cynoscion nebulosus), and Red Drum (Sciaenops ocellatus)

DOI: 10.31038/AFS.2022444

Abstract

The release of polycyclic aromatic hydrocarbons (PAHs), related to oil spills, can have devasting effects on the environment. In the presence of ultraviolet (UV) light, PAHs can be photoenhanced into more toxic compounds, leading to increased toxicity in aquatic organisms as measured by 24-h survival. PAHs cause a suite of physiological consequences particularly in the early stages of fish development due to increased surface area to volume ratios and nascent immune systems. This study compared the impacts of photoenhanced thin oil sheens on the survival and growth of larvae of three ecologically important coastal fish species: sheepshead minnows (Cyprinodon variegatus), red drum (Sciaenops ocellatus) and spotted seatrout (Cynoscion nebulosus). PAH + UV exposure increased the toxicity of thin oil sheens in all three species, with red drum demonstrating the highest sensitivity. An acute oil exposure at 1-2 days post hatch (dph) increased the rate of latent mortality and oxidative stress in sheepshead minnows. Non-photoenhanced oil caused a significant decrease in the growth of 1-2 dph sheepshead minnows and spotted seatrout. Results from this study reveal long-term effects of oil exposure on fish growth and survival, which could lead to better restoration and conservation outcomes for these vital estuarine species.

Introduction

Petroleum can enter waterways through large spills such as the April 2010 Deepwater Horizon (DWH) oil spill and the March 1989 Exxon Valdez shipping container oil spill [1]. More frequently, however, oil is released on smaller scales through industrial discharge, smaller vessel spills, runoff from impervious surfaces, and commercial port usage [2]. Oil pollution can cause physical and chemical changes to the coastal environment, as well as negatively impact the health of marine organisms [3].

Oil contains polycyclic aromatic hydrocarbons (PAHs), which are a group of organic molecules that are composed of fused benzene rings which allow them to be lipophilic, readily bioaccumulated, and have mutagenic and carcinogenic properties [4-7]. The effects of PAHs, especially those found in crude oil, on marine organisms have been extensively researched and the documented effects are widespread across a wide range of organisms [8-26]. Effects such as deformities, reduced growth and reproduction, genetic and behavioral changes, and altered physiological functions have been seen in invertebrates, as well as vertebrate species.

Although, PAHs alone have negative impacts on marine life, certain abiotic factors can increase the toxicity of PAHs. In particular, ultraviolet (UV) light has been shown to potentially make PAH compounds in fresh oil products up to 1000x more toxic than the original structure of the compound [27-33]. UV light can create enhanced toxicity via two mechanisms: photosensitization or photomodification [29]. Photosensitization occurs when an organism is exposed to UV light after biouptake of PAHs. PAH molecules within the organism’s tissues will absorb the UV light and promote electrons to enter an excited-state orbital. Alternatively, photomodification occurs when UV light oxidizes PAH molecules in the water column, forming more toxic molecules. The photomodified products can then be incorporated into the surrounding biota [29]. Studies of the interaction of UV light and PAHs in oil have documented increased toxicity and mortality in invertebrate and vertebrate larvae after short-term exposure [4,28,32-46]. Other documented effects of oil exposed larvae include damage to cell membranes through lipid peroxidation [30,44,47].

The present study used three larval estuarine fish, red drum, spotted seatrout, and sheepshead minnows, to examine and compare the effects of a co-exposure to PAH + UV light and PAH alone. Red drum, spotted seatrout, and sheepshead minnows are all ecologically important species, as they are prey items for larger fish, crustaceans, and wading birds [48,49]. In addition, red drum and spotted seatrout also have recreational and commercial significance among the Atlantic and Gulf of Mexico coasts [50-52]. Fish early life stages are particularly vulnerable to oil pollution because of the increased capacity for contaminant uptake due to greater surface area to volume ratios, increased metabolic rates, and less developed immune systems. In addition, many larval fish lack pigmentations and are often found at the surface making them particularly liable to UV light from sunlight, surface oil, and oil that has dispersed and dissolved in the water column [29,35,44,53,54].

Although photoenhanced oil effects on fish mortality are well known, few studies have sought to examine potential latent sublethal effects. While some research has focused on effects of water-accommodated fractions (WAF) of oil, thin oil surface sheens enhanced by UV light often are in direct contact with many newly hatched fish species. Therefore, this study’s primary aim was to compare the effects of thin oil sheens and UV light on the larval stages of red drum, spotted seatrout, and sheepshead minnows by examining endpoints of 24-hour mortality, latent mortality, growth metrics, and oxidative stress. The results of this study may be used to inform oil spill mitigation decisions and inform the assessment of impacts and ecosystem dynamics after an oil exposure.

Materials and Methods

Test Species

Red drum and spotted seatrout eggs (~12 h post fertilization (hpf)) were obtained from the Marine Resources Research Institute (MRRI), Mariculture division, of the SC Department of Natural Resources (SCDNR) in Charleston, SC during spawning months of April-May for spotted seatrout and July-October for red drum. The eggs were transferred to the NOAA National Centers for Coastal Ocean Science Charleston laboratory. After arrival, temperature, dissolved oxygen, and pH of the egg transfer water was measured, and aeration was provided. Viable eggs were transferred to four 10 -L tanks of seawater (35 ppt and 25°C) and allowed to hatch. The seawater was collected from Charleston Harbor, and polished via sand filtration, UV sterilization, and 5 µm nominal filtration. Adult sheepshead minnows were collected from a local tidal pond located on the Hollings Marine Laboratory property (N 32° 74′ 82.24”; W 79° 90′ 12.35”) using minnow traps. Adult fish were acclimated to laboratory conditions for 24 hours and then placed in spawning chambers within 75 -L aquariums (20 ppt and 25°C). Fish were fed Tetramin® fish flakes daily. Egg collection trays were used to retrieve eggs produced. Eggs were then transferred to shallow glass finger bowls and allowed to hatch. Larval sheepshead minnows were fed newly hatched brine shrimp (Artemia salina) prior to testing.

Initial PAH + UV Light Exposure

Fish larvae were used in experimental testing at 1-2 dph (Institutional Animal Care and Use Committee 2018-009). Eight to ten larvae were placed in 270 mL glass crystallizing dishes with 200 mL of 20 ppt (sheepshead minnows) or 35 ppt (red drum and spotted seatrout) seawater. Tests were run in two environmental incubators set at 25°C (Percival Scientific IntellusUltra C8) – one for PAH + UV exposures and one for PAH exposures. PAH + UV conditions were established using T5 AgroMax UV-A PLUS bulbs, whereas PAH conditions used cool-white fluorescent bulbs. PAH photoperiod was set at 16 h light:8 h dark while the PAH + UV photoperiod was set at 4 h UV:12 h light:8 h dark (red drum and seatrout) or 8 h UV:8 h light: 8 h dark (sheepshead minnow). Preliminary UV light threshold tests were conducted prior to the initial oil and UV light experiments to obtain the UV photoperiods for each fish species. Measures of irradiance (µW/cm2) of UV-A (λ= 380 nm) light exposures were taken using a miniature spectrometer (Ocean Optics Flame Series). A total integrated average dose was calculated for each 4 h and 8 h period of UV light by multiplying the average instantaneous irradiance measurements by the photoperiod in seconds.

Once placed in the incubator, fresh Louisiana Sweet Crude (LSC) oil was pipetted onto the surface of the water in the dishes containing the fish larvae to achieve an oil sheen. A range of sheen thicknesses (0.25, 0.5, 1.0, 2.0, and 4.0 µm) was tested dependent on sample number and a hypothesized estimated range that each species could tolerate. The equation (V=πr2h) was used to determine the volume (V) of oil needed to achieve the desired sheen thickness (h) using the radius (r) of the container; 1.42 µL, 2.84 µL, 5.67 µL, 11.34 µL, and 22.68 µL, respectively. Three to five replicates were used for each oil treatment and control. The test was run under static conditions with no renewal of the oil or seawater for 24 hours. After removal at the end of the test, if control fish mortality was ≤ 20%, all fish treatments were transferred for the grow-out phase. Water quality (temperature, pH, dissolved oxygen, and salinity) was measured from one replicate of each treatment at the end of the experiment.

Grow-out Phase Setup and Growth Measurements

Fish that survived the 24 h oil exposure were transferred to 200 mL of clean seawater in 237 mL polyethylene jars in the No UV incubator with a 16 h light:8 h dark light cycle. Each jar had a hole drilled in the lid for oxygen exchange. Water changes and feeding occurred daily. Spotted seatrout and red drum were initially fed rotifers followed by a mixture of rotifers and brine shrimp and then brine shrimp only. Sheepshead minnows and 12 dph spotted seatrout and red drum were fed brine shrimp ad libitum. Mortality was assessed daily, along with any behavior changes or any morphological deformities.

The fish grow out period was terminated after 30 days. Photo documentation was done utilizing Image-Pro Premier 9.2 64-bit software. Individual fish wet weight (mg) was recorded and the whole fish was frozen at -80°C for lipid peroxidation assay. Total body length (mm), total body depth (mm), and total ocular diameter (mm) were measured and recorded. The length was measured from the anterior to the posterior peduncle excluding the caudal fin. The depth was measured from dorsal to ventral behind the gill opening. The ocular diameter was measured across the maximum length of the retina.

Oxidative Stress: Lipid Peroxidation Assay

Lipid peroxidation activity was assessed using the malondialdehyde (MDA) method (modified from [55]). Whole fish tissues were kept frozen and homogenized on ice in potassium phosphate (K2PO4) buffer (1:4 wet weight to volume ratio) using a Pro Scientific model Pro 200 motor with a 20 mm x 150 mm stainless steel rod for a minimum of 30 sec. Samples were then centrifuged at 13,000 x g for 5 min at 4°C. Aliquots of 1400 µL of 0.375% thiobarbituric acid/15% trichloroacetic acid and 14 µL of 2% butylated hydroxytoluene were added to new microcentrifuge tubes along with 100 µL of the centrifuged supernatant for each sample, including 100 µL of K2PO4 buffer as a blank. A 10 mM stock solution of MDA was previously heated for 1 h at 50°C and allowed to cool to room temperature before generating standards. A secondary solution of 3200 µM MDA was used to prepare serial dilutions from 800 µM to 6.25 µM using K2PO4 buffer. All samples, standard tubes and the blank were vortexed and placed in a hot plate at 92°C for 15 minutes. Once heated, all tubes were centrifuged at room temp for 5 min at 13,000 x g. Aliquots of 300 µL supernatant for each sample, standard and a blank were loaded in triplicates in a clear Corning 96-well plate. Absorbance was measured with a Bio-Tek µQuant MQX200 microplate spectrophotometric reader at 532 nm in conjunction with Bio-Tek KC junior software. Absorbance readings for each sample and serial dilution were adjusted by subtracting from the blank value and the slope of the standard line was used to determine the amount of MDA in nmol/g (wet weight).

Chemical Analysis of Water Samples

Additional treatment containers without fish were setup for oil chemical analysis. Water samples from beneath the oil sheens (both PAH + UV and PAH) were collected via Teflon tubing siphons taped to the side of each glass crystallizing dish prior to the start of the experiment. Samples were analyzed for PAH concentrations according to methods detailed in [56]. Briefly, each sample was acidified to a pH of 2 using 18% hydrochloric acid (HCl) and then transferred to separatory funnels to undergo liquid/liquid extraction. The samples were spiked with isotopically labeled PAH internal standards, then solvent extracted three times, once with dichloromethane, once with 50:50 dichloromethane/hexane, and once with hexane. After extraction, samples were passed through GF/F paper containing anhydrous sodium sulfate, concentrated in a water bath, cleaned up using silica solid phase extraction (SPE) (Phenomenx Strata SI-1 Silica 500 mg/3 mL) and analyzed using gas chromatography/mass spectrometry (GC/MS). Samples were processed using an Agilent Technologies 6890/5973 GC/MS containing a DB17ms analytical column (Agilent J & W 60 m x 0.25 mm x 0.25 µm). Samples were introduced into the instrument through a split/splitless inlet operated in splitless mode. The mass spectrometer was operated in electron impact ionization (EI) and selected ion monitoring (SIM) modes. Samples were analyzed using Agilent Technologies MSD Chemstation Version E.02.02.1431 software. Total PAH (tPAH50) in this present study is reported as the sum of 50 parent and alkylated PAHs.

Statistical Analysis

Median lethal concentrations (LC50) and 10% lethal concentrations (LC10) were calculated from the 24 h exposures using SAS Probit Analysis (parametric data) [57] or Trimmed-Spearman Karber Analysis (nonparametric data) [58]. The lowest observable effect concentration (LOEC) values, 24 h exposure mortality, latent mortality, and all growth parameters (lengths, depths, ocular diameter, weights) were analyzed first using two-factor analysis of variance (ANOVA)(alpha=0.05) with interaction tests, the two factors being light treatment (UV or No UV) and PAH concentration. If no interactive effect was observed, a one–factor ANOVA (alpha=0.05) was used to further analyze the data. In the event that the assumptions of the parametric statistics were not met, a nonparametric Kruskall-Wallis (alpha=0.05) was used instead. Normality was assessed for all tests using histogram plots and a Shapiro Wilks test (alpha=0.05) and homogeneity of variance was assessed using a Levene’s test (alpha=0.05). Cook’s D and studentized residuals calculations were also used to determine cases of influential data within a specific endpoint. If a mortality endpoint or growth parameter measurement had a Cook’s D number > 4/n  or a studentized residual number with an absolute value >3, the data point was deemed an influential observation and removed [59,60]. Lastly, a William’s Test for a Monotonic Trend was used to evaluate if there was a significant trend among the different light treatments and PAH concentrations for calculated MDA concentrations.

Results

Fish Mortality of Red Drum, Sheepshead Minnows, and Spotted Seatrout after 24 H Oil Exposure With and Without UV Light

The mean tPAH50 concentrations for each oil sheen thickness for all three species were calculated (Table 1). There was a positive correlation between the tPAH50 concentrations obtained from analysis of the water samples and the oil sheen thicknesses used in this study. Larval 1-2 dph red drum mortality was significantly affected (ANOVA; p=0.0388) at 14.47 µg/L (4.0 µm sheen) tPAH50 without UV light, however all oil treatments showed significant mortality with UV light (Figure 1). The LC10 value with No UV light was 1.35 µg/L tPAH50. When tested with UV light, survival was affected at significantly lower oil concentrations (≥3.0 µg/L tPAH50, 0.5 µm sheen) and the LC10 value was reduced to 0.59 µg/L tPAH50 (95% C.I. = 0.0002, 1.4942). UV light alone did not significantly affect fish survival (fluorescent light seawater control versus UV light seawater control). There was a significant interaction between oil and light for the overall ANOVA model (p<0.0001) and between the treatment levels (Figure 1).

Table 1: The measured mean tPAH50 (µg/L) for each oil sheen thickness. n is the number of samples used for each oil sheen thickness.

table 1
 
fig 1

Figure 1: Percent mortality after 24 h for PAH and PAH + UV light treatments of 1-2 dph red drum (n=400) exposed to 4 hours of UV light and averaged oil sheen tPAH50 concentrations of 3.0 µg/L, 5.26 µg/L, and 14. 47 µg/L. Two influential data points were removed from the set. Asterisks and corresponding p-values for that treatment indicate a statistical significant difference from that light treatment’s control (0 µg/L).

In PAH + UV exposures, there was a significant effect (ANOVA; p=0.0095) on 1-2 dph spotted seatrout mortality at the highest concentration tested of 5.26 µg/L tPAH50 (1.0 µm sheen) (Figure 2). Additionally, for PAH and PAH + UV treatments below 5.26 µg/L, no significant effect was observed within 24 h on 1-2 dph spotted seatrout survival and there was no significant interaction between light and oil factors.

fig 2

Figure 2: Percent mortality after 24 h for the PAH and PAH + UV light treatments of 1-2 dph spotted seatrout (n=240) exposed to 4 hours of UV light and averaged oil sheen tPAH50 concentrations of 2.75 µg/L, 3.0 µg/L, and 5.26 µg/L. The asterisk and corresponding p-value indicate a statistical significant difference from the UV control (0 µg/L) treatment.

For 1-2 dph sheepshead minnows, there was a significant increase (ANOVA; p=0.0295) in mortality at the highest exposure dose, 7.45 µg/L tPAH50 (Figure 3), for the PAH + UV treatments. There was no significant effect on survival after a 24 h exposure to oil sheen thicknesses ≤ 2.0 µm (7.45 µg/L tPAH50) (Figure 3). No significant effect was observed at any oil sheen concentration in the PAH treatments. The 24h LC50 value for PAH + UV exposure was 6.80 µg/L (95% C.I. = 6.34, 7.29).

fig 3

Figure 3: Percent mortality after 24 h for the PAH and PAH + UV light treatments of 1-2 dph sheepshead minnows (n=240) exposed to 8 hours of UV light and averaged oil sheen tPAH50 concentrations of 3.0 µg/L, 5.26 µg/L, and 7.45 µg/L. The asterisk and corresponding p-value indicates a statistical significant difference from the UV control (0 µg/L) treatment.

When comparing PAH + UV effects in all three species, 1-2 dph red drum had a LOEC of 3.0 µg/L and a LC10 value of 0.59 µg/L (95% C.I. = 0.0002, 1.4942), 1-2 dph spotted seatrout had a LOEC of 5.26 µg/L and a LC10 value of 0.75 µg/L (95% C.I. = ND), and 1-2 dph sheepshead minnows had a LOEC of 7.45 µg/L and a LC10 value of 5.41 µg/L (95% C.I. = -1063.83, 6.47). Exposure to UV light increased the toxicity of oil in all species. Larval red drum were the most sensitive species tested among the three.

Latent Mortality after Initial 24 H Oil Exposure with and without UV Light

To examine the latent effects of a 24 h oil and/or UV exposure, surviving fish were moved to clean seawater and mortality was reassessed after 7 days. The number of surviving fish varied among treatments. In larval sheepshead minnows that were grown out in fresh seawater, a higher mortality was observed among the PAH + UV light treatments versus the PAH treatments compared to the controls, however, there was no significant difference calculated (Figure 4). In other larval fish examined for latent mortality, the spotted seatrout displayed 96% mortality in all treatments at and above 3.0 µg/L. In larval red drum, 100% mortality occurred in all treatments including the controls after 5 days, preventing growth measurements.

fig 4

Figure 4: Latent percent mortality at 7 days post transfer to clean seawater for the PAH and PAH + UV light treatments of sheepshead minnows (n=178) previously exposed at 1-2 dph to 24 hours of averaged tPAH50 concentrations of 3.0 µg/L, 5.26 µg/L, and 7.45 µg/L and 8 hours of UV light.

Growth of Sheepshead Minnows and Spotted Seatrout after Initial 24 H Oil Exposure with and without UV Light

Average lengths, depths, ocular diameters, and weights were determined for fish at 30-31 dph to assess effects of short-term PAH + UV light exposure on growth. An initial 24 h oil exposure at 1-2 dph yielded significant effects on sheepshead minnow growth. Average length, depth, ocular diameter and weight at 30-31 dph were all significantly reduced in PAH treatments at tPAH50 concentrations of 5.26 µg/L and greater (Table 2). Similar results were seen with the PAH + UV treatments, although ocular diameter was not significantly different from the control.

Table 2: Mean growth measurements for the PAH and PAH + UV light treatments of 30-31 dph sheepshead minnows (n=129) exposed at 1-2 dph to 24 hours of average tPAH50 concentrations of 3.0 µg/L, 5.26 µg/L, and 7.45 µg/L and 8 hours of UV light. Six influential data points were removed. Bolded numbers with an asterisk indicate a statistical significant difference from that light treatment’s control. There were significant differences from the controls among the 5.26 µg/L and 7.45 µg/L PAH concentrations in all growth measures but there was no significant interactive effect between light and PAH concentration.

table 2
 

When spotted seatrout were exposed at 1-2 dph to an initial 24 h oil exposure, significant decreases in average size (length and depth) and weight were seen after 30 days at tPAH50 concentrations of 2.75 µg/L (PAH + UV and PAH) compared to its control (Table 3). Overall, for both PAH + UV and PAH treatments, sheepshead minnows and spotted seatrout had decreased growth as PAH concentration increased with effects threshold starting at 5.26 µg/L and 2.75 µg/L, respectively. Growth measurements for red drum were unavailable due to 100% latent mortality 5 days after the transfer.

Table 3: Mean growth measurements for the PAH and PAH + UV light treatments of 30-31 dph spotted seatrout (n=31) exposed at 1-2 dph to 24 hours of average tPAH50 concentrations of 2.75 µg/L, 3.00 µg/L, and 5.26 µg/L and 4 hours of UV light. N/A indicates almost 100% latent mortality in that treatment after the initial exposure of oil and light. One influential data point was removed. Bolded numbers with an asterisk indicate a statistical significant difference the No UV control. There were differences between the controls and the 2.75 µg/L PAH concentration for No UV and UV treatments but there was no significant interactive effect of light and PAH concentration.

table 3
 

Oxidative Stress of Sheepshead Minnows after Initial 24 H Oil Exposure with or without UV Light

Oxidative stress was only assessed in larval sheepshead minnows due to the high latent motality in larval red drum and spotted seatrout. There was a significant upward trend (William’s Test; p<0.0001) of MDA concentrations in the PAH + UV light treatments of 30-31 dph sheepshead minnows exposed as larvae but none in the PAH light treatment (Figure 5).

fig 5

Figure 5: Mean MDA concentration for the PAH and PAH + UV light treatments of 30-31 dph sheepshead minnows (n=129) exposed at 1-2 dph to 24 hours of averaged tPAH50 concentrations of 3.0 µg/L, 5.26 µg/L, and 7.45 µg/L and 8 hours of UV light. Three influential data points were removed.

Discussion

Sheepshead minnows were most resilient to oil exposures with and without UV light, compared to spotted seatrout and red drum. Both of the latter species have reproductive strategies which include releasing thousands of eggs with each spawn, followed by high larval mortality [50,61]. This spawning strategy makes these species more sensitive to variable environmental factors, and made it difficult to use these species for toxicity assessment in a laboratory environment. Another factor that contributes to greater resilience in sheepshead minnows is the buoyancy of each larval species. Both red drum and spotted seatrout obtain nutrients through a yolk sac the first three days of life making them more positively buoyant than sheepshead minnows. This strategy makes the former species more likely to have an exposure to UV light at the surface. The fragility of the red drum and seatrout larvae has ecological importance, since these fishes are managed by NOAA, targeted by recreational fishers and are among the most sensitive to oil [62]. Increased large external stressor mortality, such as an oil spill, could lead to potential reductions in population size.

24 h Mortality

All three species, red drum (LC10 = 0.59 µg/L), spotted seatrout (LC10 = 0.75 µg/L), and sheepshead minnows (LC10 = 5.41 µg/L) exhibited PAH + UV light enhanced mortality in a 24 h acute exposure. The differences in species sensitivity are most likely due to life history strategies and habitat utilization. Estuaries are known to be harsh environments to extreme variation in environmental conditions and long-term accumulation of pollutants. Sheepshead minnows have adapted biological mechanisms such as the ability to withstand hypoxic and heavily contaminated conditions, as well as large temperature changes [63]. This demonstrates their tolerance to these dynamic estuarine conditions, making it the most resilient among the three. Although an LC50 value could not be calculated due to treatment mortality ≥ 50 % in red drum larvae, the significant mortality threshold (<3.0 µg/L) and LC10 value (0.59 µg/L) were similar to findings in [35]. [35], though using HEWAFs instead of oil sheens, observed an LC50 value of 3.42 µg/L for 1-2 dph red drum larvae exposed to PAH + UV, with significant mortality in PAH concentrations at and above 3.13 µg/L. This present study found an LC50 value could not be calculated for 1-2 dph spotted seatrout at the concentrations tested, however the LC10 value (0.75 µg/L) was within the range of effects reported by [35], which determined an LC50 value of 0.827 µg/L. Differences in LC50 value sensitivity and threshold mortality among the studies could be due to many different factors such as: experimental setup variance, UV exposure time, wavelength of UV light, intensity of UV, oil exposure type, concentration, and water conditions, such as temperature or salinity[42,44,64,65]. For example, preliminary UV threshold testing with red drum and spotted seatrout obtained from the SCNDR revealed <100% treatment survival at 4 hours of UV exposure (23.80 ± 17.22 µW/cm2). [35] used 6 h durations of natural UV allowing more time and UV wavelengths for photoenhancement to occur, potentially causing the mortality to be different than the mortality at 4 hours observed in this study. Additionally, the larvae used for each of these studies came from two different individual adult broodstock populations with potentially distinct environmental adaptations and sensitivities.

Latent Mortality

All species tested exhibited latent mortality after the initial exposure. Latent mortality after oil exposures is an often overlooked and underestimated endpoint despite the importance it may play in assessing development, survival, and population structure later in life [66]. [67] found a 25-77% reduction in survival of larval bay anchovies 6 days following a 24 h exposure to Macondo source oil. Similarly, larval coral reef fish exposed to low doses of PAHs in oil for 24 hours showed a significant increase in latent mortality [68]. In a pilot study performed by [69], pink salmon embryos exposed to Exxon Valdez oil, released into the wild, and then recaptured 2 years later exhibited a 15% reduction in survival. Although these three other studies did not test with an added UV factor, the findings from this present study were similar in that those fish exposed to thin oil sheens led to an increase in mortality several days to a week after exposure and decreased survival rates. With the added UV factor in this present study, it was demonstrated that fish exposed to thin oil sheens and UV light in one event could lead to a greater increased mortality rate in higher oil sheen exposures weeks later. This could potentially lead to reductions in survival rates over years like those seen in [69], and also changes in population structure.

Growth Parameters

Exposures to oil sheens for a 24 h period at and above 5.26 µg/L at 1-2 dph (UV and No UV light) had an impact on the lengths, weights, depths, and ocular diameters 30 days later in sheepshead minnows. Significant decreases in average size (length and depth) and weight were seen 30 days after exposure to tPAH50 concentrations of 2.75 µg/L (UV and No UV light) in spotted seatrout. Similar to the results found in this study, [70] found that sheepshead minnow larvae experienced significantly reduced lengths (5-13% reduction) and wet weights (13-35% reduction) with a long term exposure to LSC oil in sediment. Reduced wet weight has also been seen after a 28-day exposure to Macondo source oil in inland silversides [71].

In this present study, ocular diameter in sheepshead minnows was also affected but only in the 5.26 µg/L and 7.45 µg/L PAH treatments. Research conducted by [72] and [15] both found that the length of the retina and lens area, respectively, were smaller in oil treated larval zebrafish. [22] also found that there was a 11% and 15% decrease in lens diameter of 11 dph red drum and 8 dph sheepshead minnows, respectively, after a 24 h oil exposure prior to hatch.

No reductions in growth were observed between light treatments. This may be explained by the concentration of napthalenes and fluorenes in LSC and MC252 oil, which have low potential for phototoxicity [8,29,73]. [29] found that phototoxic compounds of oil appear to be restricted to specific PAHs with three to five fused benzene rings. LSC and MC252 oil have been shown to have a high concentration of naphthalenes and fluorenes, PAHs with only two benzene rings [8,73], suggesting the main oil components in this study have a low potential to become phototoxic. LSC contains relatively- high concentrations of phenanthrene, a compound with three benzene rings, thus, while photoenhanced toxicity was observed in the initial 24 h of LSC oil sheen exposures, the increased effect did not extend to long term effects on fish growth. Several studies, including [10,12,17,69,74], found that weathered oil, which typically contains more degradation, metabolites, and PAHs with three or more rings, is more likely to cause sublethal effects such as cardiac, ocular, and circulatory defects. Future studies should consider using crude oils containing higher proportions of PAHs with three or more rings to explore the interactive effect between PAH + UV on growth. Another potential cause of no reductions of growth after an exposure to PAH + UV light is the mechanism of action. Parent PAHs are typically those with three to four benzene rings and those that could be uptaken through bioaccumulation and photomodification mode of action and cause the associated cardiac effects. In this present study, if the mode of action that occurred was photosensitization, reactive products that were created within the larval fish’s body caused oxidative damage rather than associated growth effects. Therefore, growth may be a less relevant toxic endpoint for oil and UV exposures.

Although anecdotal, and not specifically recorded as an endpoint, throughout the grow-out phases for all species, there was noticeable swimming and behavioral impairments, such as swimming in circles and trouble maintaining position in the water column that lasted until the conclusion of the grow-out phase or became precursors to mortality. [75] saw a similar trend in larval fish which were previously exposed to oil and then removed to clean water. They started to exhibit melanosis, less mobility, reduced startle response, erratic swimming patterns, and loss of equilibrium. [21] also saw decreased swimming performance in 25 day old mahi-mahi exposed to comparable PAH concentrations (1.2 µg/L) upon hatching. Research conducted by [76] shows that these types of behaviors are indicative of narcosis and typical of high short-term naphthalene dominated oil exposures, such as MC252 oil. Fish from this present study may have dealt with the same type of narcosis. This reveals that fish that do not experience significant mortality initially may still succumb to behavioral changes later on in life with the potential to affect prey-predator dynamics [11]. Future studies may consider tracking fish behavior to support this claim.

Oxidative Stress

MDA is one of the byproducts seen from an increase in free radicals and therefore, is often used as a biomarker to measure damage due to oxygen radical formation. Mean MDA concentrations for 30-31 dph sheepshead minnows exposed to PAH + UV at 1-2 dph were higher for all UV plus oil treatments when compared to fish exposed to oil treatments alone. Moreover, the highest mean levels of MDA production occurred in the 2 µm UV exposed sheen (tPAH50 concentration of 7.45 µg/L) and there was a significant upward increasing trend of MDA concentrations in the UV treatments. Ultimately, this demonstrates that fish had undergone oxidative stress and the effects remained 30 days after the exposure was ended. Similarly, [75] found there was increased lipid peroxidation occurring in pink salmon gill tissue in fish exposed to oil, UV, and oil plus UV. [77] also found that bluegill sunfish (40-55 g) exposed to concentrations of a PAH plus UV, produced a higher concentration of MDA than any other of their treatment groups tested. PAHs accumulate in fish tissues through passive diffusion across the gills, absorption through the skin, and through ingestion [44]. Since 1-2 dph sheepshead minnows have little to no pigment, UV light is easily able to penetrate a larval body, interact with PAHs, create reactive oxygen species, and cause chain reactions with the potential to damage cell membranes through various modes of action [30,78-81]. Cell membrane damage has physiological and immune health implications, such as latent mortality and impaired growth, as observed in this present study. These effects play a role in the survival and fitness of early life-stages and consequently, could have the potential to impact community structure if population dynamics are shifted due to increased early life mortality.

Conclusions

The effects of thin oil sheens demonstrated in this study occurred at environmentally relevant concentrations and are important due to the observed associated consequences of exposure to PAHs from thin sheens rather than WAFs. LOEC concentrations ranged from 3.0 (0.5 µm) to 7.45 (2.0 µm) µg/L tPAH50 for the species tested, which are well within in the lower range of tPAH50 concentrations reported during the Deepwater Horizon oil spill and effect concentrations in other studies [35,82]. The UV-A (λ=380 nm) instantaneous light readings measured in this study ranged from 7.74 µW/cm2 to 41.55 µW/cm2 with a total average of 23.80 ± 17.22 µW/cm2 and a total integrated average dose of 685.44 mW s/cm2 for 8 hours and 342.72 mW s/cm2 for 4 hours [35]. These measurements are relatively lower when compared to other studies, but the integrated 8 hour dose still falls within the range of UV light measurements encountered in Gulf of Mexico surface waters during Deepwater Horizon oil spill [83].

The implications of larval exposure to PAH + UV related toxicity are important to understand because they may have an effect on individual fish, population changes and ultimately, community structure. As demonstrated by this study, a combination of thin oil sheens and UV can have acute mortality effects on sheepshead minnows, red drum and spotted seatrout and latent mortality effects on sheepshead minnows. Exposure to oil sheens alone can still impact physiological processes that result in oxidative stress in sheepshead minnows and decreased growth in sheepshead minnows and spotted seatrout. Small changes that decrease larval fish survival and fitness can detrimentally impact the interconnected predator- prey dynamic of an ecosystem and even impact human activities such as recreational fishing.

This present study demonstrates that some, but not all, estuarine fish acutely exposed to oil have immediate and long-term consequences for survival and growth associated with short-term exposure. Co-exposure of oil with UV light significantly increased oil toxicity for all three species tested. Short-term (24 h) oil exposures induced sublethal effects 30 days later on fish growth (reduced lengths, depths, weights, and ocular diameters) and increased oxidative stress. The oil rainbow sheens, and water concentrations used for this research are similar to environmentally relevant concentrations that can be seen in estuarine waterways and therefore, the results from this present study represent possible outcomes for larval fish exposed to combinations of UV light and oil sheens or oil sheens alone in their first few days of life.

Acknowledgements

This project would not have been possible without the generous provision of red drum and spotted sea trout eggs from Aaron Watson and staff at the SC Department of Natural Resources Mariculture Division. Graduate student support for Danielle Beers was provided by the College of Charleston and the Slocum Lunz Foundation. We appreciate the assistance of the NCCOS Ecotoxicology Branch staff who provided support for this project including Pete Key, Blaine West, and James Daugomah. The NOAA, National Ocean Service does not approve, recommend, or endorse any proprietary product or material mentioned in this publication. The use of larval fish species for this project was approved under the College of Charleston’s Institutional Animal Care and Use Committee (2018-009).

Statements and Declarations

Funding

The authors declare that no funds, grants, or other support were received during the preparation of this manuscript.

Competing Interests

The authors have no relevant financial or non-financial interests to disclose.

Declarations of Interest

The authors have no personal/financial interest or belief that would affect their objectivity.

Ethical Approval

The use of larval fish was approved under the College of Charleston’s Institutional Animal Care and Use Committee (2018-009). All authors followed ethical and professional standards in the completion of this research study.

Consent to Participate

All authors consent to participate in this research study.

Consent to Publish

All authors consent to have this manuscript published.

References

  1. Incardona JP, Swarts TL, Edmunds RC, Linbo TL, Aquilina-Beck A, et al. (2013) Exxon Valdez to Deepwater Horizon: Comparable toxicity of both crude oils to fish early life stages. Aquat Toxicol 142-143: 303-316.
  2. Transportation Research Board and National Research Council (2003) Oil in the Sea III: Inputs, Fates and Effects. Washington, DC: The National Academies Press.
  3. Yuewen D, Adzigbli L (2018) Assessing the impact of oil spills on marine organisms. J Oceanogr Mar Res 6: 1.
  4. Alloy M, Baxter D, Stieglitz J, Mager E, Hoenig R, et al. (2016) Ultraviolet radiation enhances the toxicity of Deepwater Horizon oil to mahi-mahi (Coryphaena hippurus) embryos. Environ Sci Technol 50: 2011- 2017. [crossref]
  5. Baumard P, Budzinski H, Garrigues P, Sorbe JC, Burgeot Y, et al. (1998) Concentrations of PAHs (polycyclic aromatic hydrocarbons) in various marine organisms in relation to those in sediments and to trophic level. Mar Pollut Bull 36: 951-960.
  6. Weinstein JE (1996) Anthropogenic impacts on salt marshes-A review. In: (eds) Sustainable Development in the Southeastern Coastal Zone, eds. Vernberg FJ, Vernberg WB, Siewicki T, 20:135-170. Columbia, SC: Belle W. Baruch Library of Marine Science University of South Carolina.
  7. Xue W, Warshawsky D (2005) Metabolic activation of polycyclic and heterocyclic aromatic hydrocarbons and DNA damage: a review. Toxicol Appl Pharmacol 206: 73-93. [crossref]
  8. Almeda R, Wambaugh Z, Wang Z, Hyatt C, Liu Z, et al. (2013a) Interactions between zooplankton and crude oil: toxic effects and bioaccumulation of polycyclic aromatic hydrocarbons. PLoS one 8: e67212.
  9. Almeda R, Baca S, Hyatt C, Buskey E (2014) Ingestion and sublethal effects of physically and chemically dispersed crude oil on marine planktonic copepods. Ecotoxicology 23: 988-1003.
  10. Carls MG, Rice SD, Hose JE (1999) Sensitivity of fish embryos to weathered crude oil: Part 1. Low-level exposure during incubation causes malformations, genetic damage, and mortality in larval pacific herring (Clupea pallasi). Environ Toxicol Chem 18: 481-493.
  11. Carvalho PSM, Kalil DCB, Novelli GAA, Bainy ACD, Fraga APM (2008) Effects of naphthalene and phenanthrene on visual and prey capture endpoints during early stages of the dourado Salminus brasiliensis. Mar Environ Res 66: 205-207. [crossref]
  12. Diamante G, Muller GAS, Menjivar-Cervantes N, Xu EG, Volz DC, et al. (2017) Developmental toxicity of hydroxylated chrysene metabolites in zebrafish embryos. Aquat Toxicol 189: 77-86. [crossref]
  13. Dubansky B, Whitehead A, Miller JT, Rice CD, Galvez G (2013) Multitissue molecular, genomic, and developmental effects of the Deepwater Horizon oil spill on resident gulf killifish (Fundulus grandis). Environ Sci Technol 47: 5074-5082. [crossref]
  14. Frometa J, DeLorenzo ME, Pisarski E, Etnoyer PJ (2017) Toxicity of oil and dispersant on the deep water gorgonian octocoral Swiftia exserta, with implications for the effects of the Deepwater Horizon oil spill. Mar Pollut Bull 122: 91-99.
  15. Huang L, Wang C, Zhang Y, Wu M, Zuo Z (2013) Phenanthrene causes ocular developmental toxicity in zebrafish embryos and the possible mechanisms involved. J Hazard Mater 261: 172-180. [crossref]
  16. Huang L, Zuo Z, Zhang Y, Wu M, Lin JJ, et al. (2014) Use of toxicogenmoics to predict the potential toxic effect of benzo(a)pyrene on zebrafish embryos: Ocular developmental toxicity. Chemosphere 108: 55-61. [crossref]
  17. Incardona JP, Collier TK, Scholz NL (2004) Defects in cardiac function precede morphological abnormalities in fish embryos exposed to polycyclic aromatic hydrocarbons. Toxicol Appl Pharmacol 196: 191-205. [crossref]
  18. Incardona JP, Gardner LD, Lindo TL, Brown TL, Esbaugh AJ, et al. (2014) Deepwater Horizon crude oil impacts the developing hearts of large predatory pelagic fish. Proc Nat Acad Sci U.S.A. 111: 1510-1518.
  19. Johansen JL, Esbaugh AJ (2017) Sustained impairment of respiratory function and swim performance following acute oil exposure in a coastal marine fish. Aquat Toxicol 187: 82-89. [crossref]
  20. Khursigara AJ, Perrichon P, Bautista NM, Burggren WW, Esbaugh AJ (2017) Cardiac function and survival are affected by crude oil in larval red drum, Sciaenops ocellatus. Sci Total Environ 579: 797-804. [crossref]
  21. Mager EM, Esbaugh AJ, Stieglitz JD, Hoenig R, Bodinier C, et al. (2014) Acute embryonic or juvenile exposure to Deepwater Horizon crude oil impairs the swimming performance of mahi-mahi (Coryphaena hippurus). Environ Sci Technol 48: 7053-7061. [crossref]
  22. Magnuson JT, Khursigara AJ, Allmon EB, Esbaugh AJ, Roberts AP (2018) Effects of Deepwater Horizon crude oil on ocular development in two estuarine fish species, red drum (Sciaenops ocellatus) and sheepshead minnow (Cyprinodon variegatus). Ecotoxicol Environ Saf 166: 186-191. [crossref]
  23. Rice SD, Thomas RE, Carls MG, Heintz RA, Wetheimer AC, et al. (2001) Impacts to pink salmon following the Exxon Valdez oil spill: Persistence, toxicity, sensitivity and controversy. Rev Fish Sci 9: 165-211.
  24. Whitehead A, Dubansky B, Bodinier C, Garcia TI, Miles S, et al. (2012) Genomic and physiological footprint of the Deepwater Horizon oil spill on resident marsh fishes. Proc Natl Acad Sci U.S.A. 109: 20298-20302. [crossref]
  25. Xu EG, Mager EM, Grosell M, Pasparakis C, Schlenker LS, et al. (2016) Time- and oil- dependent transcriptomic and physiological responses to Deepwater Horizon oil in mahi-mahi (Coryphaena hippurus) embryos and larvae. Environ Sci Technol 50: 7842-7851.
  26. Xu EG, Khursigara AJ, Magnuson J, Hazar ES, Hardiman G, et al. (2017) Larval red drum (Sciaenops ocellatus) sublethal exposure to weathered Deepwater Horizon crude oil: Developmental and transcriptomic consequences. Environ Sci Technol 51: 10162- 10172. [crossref]
  27. Ankley GT, Erickson RJ, Sheedy BR, Kosian PA, Mattson VR, et al. (1997) Evaluation of models for predicting the phototoxic potency of polycyclic aromatic hydrocarbons. Aquat Toxicol 37: 37-50.
  28. Arfsten DP, Schaeffer DJ, Mulveny DC (1996) The effects of near ultraviolet radiation on the toxic effects of polycyclic aromatic hydrocarbons in animals and plants: a review. Ecotoxicol Environ Saf 33:1-24. [crossref]
  29. Barron MG, Kaaihue L (2001) Potential for photoenhanced toxicity of spilled oil in Prince William Sound and Gulf of Alaska waters. Mar Pollut Bull 43: 86-92. [crossref]
  30. Landrum PF, Giesy JP, Oris JT, Allred PM (1987) Photoinduced toxicity of polycyclic aromatic hydrocarbons to aquatic organisms. In: Oil in Freshwater, eds. J.H. Vandermeulen, S. E. Hrudey. New York: Pergamon Press.
  31. Larson RA, Berenbaum MR (1988) Environmental phototoxicity: Solar ultraviolet radiation affects the toxicity of natural and man-made chemicals. Environ Sci Technol 22: 354-360.
  32. Pelletier MC, Burges RM, Ho KT, Kuhn A, McKinney RA, et al. (1997) Phototoxicity of individual polycyclic aromatic hydrocarbons and petroleum to marine invertebrate larvae and juveniles. Environ Toxicol Chem 16: 2190-2199.
  33. Sweet LE, Magnuson J, Garner TR, Alloy MM, Stieglitz JD, et al. (2017) Exposure to ultraviolet radiation late in development increases the toxicity of oil to mahi-mahi (Coryphaena hippurus) embryos. Environ Toxicol Chem 36: 1592-1598. [crossref]
  34. Alloy MM, Boube I, Griffitt RJ, Oris JT, Roberts AP (2015) Photo-induced toxicity of Deepwater Horizon slick oil to blue crab (Callinectes sapidus) larvae. Environ Toxicol Chem 34: 2061-2066. [crossref]
  35. Alloy M, Garner TR, Bridges K, Mansfield C, Carney M, et al. (2017) Co-exposure to sunlight enhances the toxicity of naturally weathered Deepwater Horizon oil to early lifestage red drum (Sciaenops ocellatus) and speckled seatrout (Cynoscion nebulosus). Environ Toxicol Chem 36: 780-785. [crossref]
  36. Almeda R, Harvey TE, Connelly TL, Baca S, Buskey EJ (2016) Influence of UVB radiation on the lethal and sublethal toxicity of dispersed crude oil to planktonic copepod nauplii. Chemosphere 152: 446-458. [crossref]
  37. Barron MG, Carls MG, Short JW, Rice SD (2003) Photoenhanced toxicity of aqueous phase and chemically dispersed weathered Alaska North Slope crude oil to pacific herring eggs and larvae. Environ Toxicol Chem 22: 650-660. [crossref]
  38. Boese BL, Lamberson JO, Swartz RC, Ozretich RJ (1997) Photoinduced toxicity of fluoranthene to seven marine benthic crustaceans. Arch Environ 32: 389-393. [crossref]
  39. Bridges KN, Lay CR, Alloy MM, Gielazyn ML, Morris JM, et al. (2018a) Estimating incident ultraviolet radiation during the Deepwater Horizon oil spill. Environ Toxicol Chem 37: 1679-1687. [crossref]
  40. Cleveland L, Little EE, Calfee RD, Barron MD (2000) Photoenhanced toxicity of weathered oil to Mysidopsis bahia. Aquat Toxicol 49: 63-76. [crossref]
  41. Damare LM, Bridges KN, Alloy MM, Curran TE, Soulen BK, et al. (2018) Photo-induced toxicity in early life stage fiddler crab (Uca longisignalis) following exposure to Deepwater Horizon Ecotoxicology 27: 440-447. [crossref]
  42. Diamond SA, Milroy NJ, Mattson VR, Heinis LJ, Mount DR (2003) Photoactivated toxicity in amphipods collected from polycyclic aromatic hydrocarbon-contaminated sites. Environ Toxicol Chem 22: 2752-2760. [crossref]
  43. Finch BE, Stefansson ES, Langdon CJ, Pargee SM, Stubblefield WA (2018) Photo-enhanced toxicity of undispersed and dispersed weathered Macondo crude oil to Pacific (Crassostrea gigas) and eastern oyster (Crassostrea virginica) larvae. Mar Pollut Bull 133: 828-834. [crossref]
  44. Finch BE, Stubblefield WE (2016) Photo-enhanced toxicity of fluoranthene to Gulf of Mexico marine organisms at different larval ages and ultraviolet light intensities. Environ Toxicol Chem 35: 1113-1122. [crossref]
  45. Little EE, Cleveland L, Calfee R, Barron MG (2000) Assessment of the photoenhanced toxicity of a weathered oil to the tidewater silverside. Environ Toxicol Chem 19: 926-932.
  46. Sweet LE, Revill AT, Strzelecki J, Hook SE, Norris JM, et al. (2018) Photo-induced toxicity following exposure to crude oil and ultraviolet radiation in two Australian fishes. Environ Toxicol 37: 1359-1366.
  47. Vaca CE, Wilhelm EJ, Harms-Ringdahl M (1988) Interaction of lipid peroxidation products with DNA: A review. Mutat Res 195: 137-149. [crossref]
  48. Frederick PC, Loftus WF (1993) Responses of marsh fishes and breeding wading birds to low temperatures: A possible behavioral link between predator and prey. Estuaries 16: 216-222.
  49. Kushlan J (1980) Prey choice by tactile-foraging wading birds. Colon Waterbird 3: 133-142.
  50. Atlantic States Marine Fisheries Commission (2020) Red Drum. Accessed 28 January 2020.
  51. NOAA Fisheries (2020) Science & Data. Accessed 28 January 2020.
  52. Swingle WE (1990) Status of the commercial and recreational fishery. In: Red Drum Aquaculture. College Station, Texas: Texas A&M Sea Grant Program.
  53. Hunter JR, Kaupp SE, Taylor JH (1980) Assessment of effects of UV radiation on marine fish larvae. In: The Role of Solar Radiation in Marine Ecosystems, ed. J. Calkins. New York: Plenum Press.
  54. Roberts AP, Allo MM, Oris JT (2017) Review of the photo-induced toxicity of environmental contaminants. Comp Biochem Physiol 191: 160-167. [crossref]
  55. Ringwood AH, Houget J, Keppler CJ, Gielazyn ML, Ward BP, et al. (2003) Cellular Biomarkers (lipid destabilization, glutathione and lipid peroxidation) in three common estuarine species: A methods handbook. Marine Resource Institute, South Carolina Department of Natural Resources: Charleston, SC.
  56. May LA, Burnett AR, Miller CV, Pisarski E, Webster LF, et al. (2020) Effect of Louisiana sweet crude oil on a Pacific coral, Pocillopora damicornis. Aquat Toxicol 200: 105454.
  57. Newman MC (1995) Quantitative methods in aquatic ecotoxicology. In: Advances in Trace Substances Research. Boca Raton, Florida: Lewis Publishers.
  58. Hamilton MA, Russo RC, Thurston RV (1978) Trimmed Spearman-Karber method for estimating median lethal concentrations in bioassays. Environ Sci Technol 12: 417.
  59. Belsley DA, Kuh E, Welsch RE (1980) Regression Diagnostics: Identifying Influential Data and Sources of Collinearity. Hoboken, New Jersey: John Wiley & Sons.
  60. Cook R (1977) Detection of influential observations in linear regression. Technometrics 19: 15-18.
  61. Sea Grant Louisiana (2019) Louisiana Fisheries. Biological Info: Red Drum. Accessed 24 February 2020.
  62. NOAA Data Integration and Visualization Exploration and Reporting (DIVER). 2020. Deepwater Horizon DRDA Data, NOAA’s Deepwater Horizon Trustee Toxicity Testing Program Results.
  63. Bennett WA, Beitinger TL (1997) Temperature tolerance of the sheepshead minnows, Cyprinodon variegatus. Copeia 1: 77-87.
  64. Diamond SA, Mount DR, Burkhard LP, Ankley GT, Makynen EA, et al. (2000) Effect of irradiance spectra on the photoinduced toxicity of three polycyclic aromatic hydrocarbons. Environ Toxicol Chem 19: 1389-1396.
  65. Hodson PV (2017) The toxicity of fish embryos of PAH in crude and refined oils. Arch Environ Contam Toxicol 73: 12-18. [crossref]
  66. Pasparakis C, Esbaugh AJ, Burggren W, Grosell M (2019) Physiological impacts of Deepwater Horizon oil on fish. Comp Biochem Physiol Part-C: Toxicol 224: 1-29.
  67. Duffy TA, Childress W, Portier R, Chesney EJ (2016) Responses of bay anchovy (Anchoa mitchilli) larvae under lethal and sublethal scenarios of crude oil exposure. Ecotoxicol Environ Saf 134: 264-272. [crossref]
  68. Johansen JL, Allan BJM, Rummer JL, Esbaugh AJ (2017) Oil exposure disrupts early life-history stages of coral reef fishes via behavioural impairments. Nat Ecol Evol 1: 1146-1152. [crossref]
  69. Heintz RA, Short JW, Rice SD (1999) Sensitivity of fish embryos to weathered crude oil: Part 2. Increased mortality of pink salmon (Oncorhynchus gorbuscha) embryos incubating downstream from weathered Exxon Valdez crude oil. Environ Toxicol Chem 18: 494-503.
  70. Raimondo S, Hemmer BL, Lilavois CR, Krzykwa J, Almario A, et al. (2015) Effects of Louisiana crude oil on the sheepshead minnow (Cyprinodon variegatus) during a life-cycle exposure to laboratory oiled sediment. Environ Toxicol 31: 1627-1639. [crossref]
  71. Echols B, Smith A, Gardinali PR, Rand GM (2016) Chronic toxicity of unweathered and weathered Macondo oils to mysid shrimp (Americamysis bahia) and inland silversides (Menidia beryllina). Arch Environ Contam Toxicol 71: 78-86.
  72. de Soysa TY, Ulrich A, Friedrich T, Pite D, Compton S, et al. (2012) Macondo crude oil from the Deepwater Horizon oil spill disrupts specific developmental processes during zebrafish embryogenesis. BMC Biol 10: 40. [crossref]
  73. Overton EB, Wade TL, Radovic JR, Meyer BM, Miles MS, et al. (2016) Chemical composition of Macondo and other crude oils and compositional alterations during oil spills. Oceanography 29: 50-63.
  74. Brette F, Shiels HA, Galli GLJ, Cros C, Incardona JP, et al. (2017) A novel cardiotoxic mechanism for a pervasive global pollutant. Sci Rep 7: 41476. [crossref]
  75. Barron MG, Carls MG, Short JW, Rice SD, Heintz RA, (2005) Assessment of the phototoxicity of weathered Alaska North Slope crude oil to juvenile pink salmon. Chemosphere 60: 105-110. [crossref]
  76. Rice SD, Short JW, Brodersen CC, Mecklenburg TA, Moles DA, et al. (1976) Acute toxicity and uptake-depuration studies with Cook Inlet crude oil, Prudhoe Bay crude oil, No. 2 fuel oil, and several subarctic marine organisms. Processed Report. Northwest Fisheries Center Auke Bay Fisheries Laboratory, Juneau, AK.
  77. Choi J, Oris JT (2000) Evidence of oxidative stress in bluegill sunfish (Lepomis macrochirus) liver microsomes simultaneously exposed to solar ultraviolet radiation and anthracene. Environ Toxicol Chem 9: 1795-1799.
  78. McCloskey JT, Oris JT (1993) Effect of anthracene and solar ultraviolet radiation exposure on gill ATPase and selected hematologic measurements in the bluegill sunfish (Lepomis macrochirus). Aquat Toxicol 24: 207-218.
  79. Oris JT, Giesy JPJr (1986) Photoinduced toxicity of anthracene to juvenile bluegill sunfish (Lepomis macrochirus Rafinesque): Photoperiod effects and predictive hazard evaluation. Environ Toxicol Chem 5: 761-768.
  80. Oris JT, Giesy JP Jr (1987) The photo-induced toxicity of polycyclic aromatic hydrocarbons to larvae of the fathead minnow (Pimephales promelas). Chemosphere 16: 1395-1404.
  81. Weinstein JE, Oris JT, Taylor DH (1997) An ultrastructural examination of the mode of UV-induced toxic action of fluoranthene in the fathead minnow, Pimephales promelas. Aquat Toxicol 39: 1-22.
  82. Diercks AR, Highsmith RC, Asper VL, Joung D, Zhou Z, et al. (2010) Characterization of subsurface polycyclic aromatic hydrocarbons at the Deepwater Horizon Geophys Res Lett 37: L20602.
  83. Bridges KN, Krasnec MO, Magnuson JT, Morris JM, Gielazyn ML, et al. (2018b) Influence of variable ultraviolet radiation and oil exposure duration on survival of red drum (Sciaenops ocellatus) larvae. Environ Toxicol 37: 2372-2379. [crossref]
fig 1

Maternal Satisfaction with Childbirth Services in Health Facilities in Nigeria: A Systematic Review of Literature and Recommendations

DOI: 10.31038/IGOJ.2022522

Abstract

Background: Maternal deaths in developing countries are quite high accounting for as much as 14 percent of global maternal deaths. One of the global strategies to reduce these deaths requires utilization of health facilities manned by skilled birth attendants for childbirth. Although 67% of women attend ANC in Nigeria, only 39% utilize health facilities for delivery. Thus, this review seeks to ascertain maternal satisfaction with delivery services which will influence childbirth in health facilities in Nigeria.

Methods: Literature search was done using different databases and search engines including goggle, PubMed/Medline, Google scholar, web of science, EMBASE, Cochrane library. The search on articles published in English on maternal satisfaction with delivery services in health institutions between 2000 and 2021 yielded 108 articles that were screened for eligibility out of which 44 underwent full text review. Thirteen (13) articles were included in the final analysis.

Results: Eight (61.5%) of the studies reported the prevalence of women’s satisfaction with delivery services to be over 90%. Dissatisfaction was reported in lack of availability and adequacy of electricity, water, equipment, space for consultation/admission and cleanliness of toilets in 5(62.5%) out of the eight studies that reported on physical environment. This was same with, availability of adequate staffing, cost, medicines and supplies. Five (62.5%) of studies reported dis-satisfaction with interpersonal relationship issues; courtesy, respect, privacy, promptness, perceived health worker competency and emotional support. There was report on preference for un-orthodox care centers in some instances.

Conclusions: Although overall satisfaction with health facility delivery services was fair, there was some dis-satisfaction expressed by the women in certain domains. There is need to improve on interpersonal attitudes, provision of medicines and supply as well as infrastructural upgrade and environmental cleanliness. A digitalized feedback system and periodic audits should be made compulsory.

Keywords

Maternal satisfaction, Mother’s perception, Associated factors, Quality of care, Health facility deliveries, Nigeria

Introduction

It is reported worldwide that approximately 800 women die daily from preventable causes which are pregnancy and childbirth related and 99% of all these maternal deaths occur in less developed nations of the world [1-4]. In some parts of the African continent Maternal Mortality Ratios (MMR) are as high as 686 per 100,000 live births which is very abysmal [2,3,5]. The World Health Organization (WHO) estimates put MMR in Nigeria at 814 per 100,000 live births. The lifetime risk of a Nigerian woman dying during pregnancy, childbirth, postpartum or post-abortion is said to be 1 in 22, in contrast to the lifetime risk in developed countries estimated at 1 in 4900 [6].

Utilization of delivery services at the hospital is believed to reduce these unacceptably high maternal complications and deaths especially in sub-Saharan Africa [7]. This is due to the fact that the hospital environment is expected to have the minimal medical standards that will guarantee clean delivery as well as a result of availability of equipment, medicine/supplies and skilled birth attendants [3,4,7,8]. Worldwide, statistics showed that about 2.5 million neonates died within the first 28 days of delivery [7]. It is reported that 2 in 3 neonates died within the first day of birth as a result of inadequate care during labour and delivery [7]. In low and middle income countries where neonatal mortality statistics are abysmal, achieving perinatal survival devoid of morbidity will guarantee maternal satisfaction [7].

Although the report of 2018 Nigeria Demographic Health Survey (NDHS) suggests that as much as 67% of women utilize Antenatal Care (ANC) services, only 39% of then deliver in a health facility where there is a Skill Birth Attendant (SBA) [9]. The poor rate of institutional deliveries shows that not all the women who are booked and attending antenatal care opt for institutional delivery [5]. A good proportion of registered antenatal attendees have alternative place of delivery and some even practice medical pluralism which entails utilizing Traditional Birth Attendants (TBAs), home deliveries and maternity homes at the same time [4,9].

A lot of reasons have been proffered as explanation to this irregular utilization of maternal health care services by women in Nigeria. These include; the high cost of services, cultural barriers, religious inclinations, attitude of health workers, distance from health facilities among others [4,8,10,11]. Childbirth experience of women will determine their future utilization and recommendation of hospital delivery to other women and yet not many studies have been conducted in Nigeria on maternal satisfaction with services [9,12].

Worldwide there have been constructive efforts to assess and subsequently improve the quality of maternal healthcare in health facilities in the last two decades which has led increase in importance being given to opinions, aspirations, expectations and actual experiences of women that use these facilities [13]. Although, assessing for maternal satisfaction may not be easy due to its multidimensional nature; because clients may be satisfied with some selected aspects of care and not minding others, maternal satisfaction is critical for quality assurance in maternal health care service delivery [14]. Hence the World Health Organization (WHO) recommends the evaluation of satisfaction by the women so as to help improve quality and effectiveness of maternity care services [10,15-17].

It is for this reason that this assessment is considered germane in Nigeria, a developing nation. The findings of the study were to provide informed recommendations and public health policy formulation, strategies and interventions that will eventually enhance institutional deliveries in Nigeria thereby not only improving maternal and child health but also reducing maternal deaths.

Methodology

Study Design

Systematic review of Literature that were peer reviewed or grey literature that was relevant to the study theme. The review followed the PICO model or frame work for systematic reviews. The population studied was women who delivered in health facilities in Nigeria whether at primary, secondary or tertiary level of care. Intervention was the delivery process which entails treatment, information, interpersonal relationship, and impact of infrastructure. The reports of women who delivered in health facilities were compared with those who delivered in un-orthodox centers. Outcome measures were the satisfaction of the women using the domains studied which included; physical environment, interpersonal issues, availability of drugs and supplies, access to health facilities.

Study Setting

It was focused on studies conducted on satisfaction of women with delivery services in health facilities in Nigeria. The country which is located in West Africa is the most populous black nation in the world with a population of about 200 million people. Maternal and child health services are offered at primary, secondary and tertiary levels. This service includes antenatal care, intra-partum care and post-partum care, family planning, child immunization and other reproductive health services.

Inclusion and Exclusion Criteria

Cross-sectional or cohort studies, some quantitative and others qualitative conducted on maternal satisfaction with delivery services in Nigerian health facilities. Therefore, the population was Nigerian women of reproductive age that had a birthing experience at primary, secondary or tertiary facility. They were also compared with those who delivered elsewhere. All included studies were published in English language. Those with no abstract or full text, editorials, anonymous authors, conference papers, lecture notes and incomplete data were excluded. Also excluded were those done on non-Nigerian population, focused on antepartum care and non-English. Also, those that did not test the outcome measures of physical environment, interpersonal issues, accessibility and availability of drugs and supplies were excluded.

Search Strategy

This was an extensive electronic literature search using different databases and search engines including Google, PubMed/Medline, Google scholar, web of science, EMBASE, Cochrane library. Report types considered were journal articles, book chapters, grey literature reports and academic theses provided that they reported a full account of either quantitative or qualitative research methods. Search terms used were “Maternal satisfaction with delivery services”, OR “Women’s satisfaction with childbirth services” AND “delivery in Nigerian health facilities”, OR “Women’s perception of satisfaction with hospital Childbirth experiences in Nigeria”, AND “satisfaction with maternity services”, “factors affecting satisfaction with child birth”. Other ways were; the manual search and review of reference lists of the included studies. Hand searching of the journals was also done as well as grey literature and interviews of experts. The period of these studies was restricted to between 2000 and 2021 to ensure that the findings were recent.

Quality and Eligibility Assessment

This was a diligent check through the full-text articles to further evaluate the quality and eligibility of the studies. Consideration was given to journal articles published by reputable publishers as high-quality research, and therefore they were included in the review: Thus, reliability of data was checked for and repetitions were also rejected.

Study Selection Process

This was a two-stage process in which the first stage involved screening of abstracts of identified studies by the researcher for relevance to the topic, based on the inclusion and exclusion criteria. In the second stage, full-text papers were reviewed for relevance and inclusion in the review work. Where there were doubts, the researcher referred the concerned abstracts/full texts to the two other researchers and decision to accept the articles were based on the inputs of the other researchers.

Risk of Bias in Assessment of Articles

Each article selected was considered to be of high, moderate or low quality. Articles were not rejected due to the study design limitations that could have existed. The priority was the achievements of the aim and objective of the study which was adjudged to have addressed the study questions and the hypotheses. So the overall interpretation became more important than technical criteria used for data collection and analysis. It was also important to take into cognizance the difficulty of research methodology for assessing the likelihood of publication or dissemination bias in qualitative studies or mixed studies even though such biases are well known to exist.

Outcome Measurement of Interest

The outcome data was satisfaction with delivery services and factors related to satisfaction with delivery services. Satisfaction was considered along the lines of prompt attention to patients, environmental issues (cleanliness, how tidy and organized, good toilets), interpersonal issues (politeness, respect and regards to patients, privacy, orientation, emotional support) and information (treatment, counselling, results of exams, hygiene, breast feeding etc.).

Data Extraction and Analysis

Data extraction was done from the included studies in Word document using a table. It included the first author, year of publication, study setting, study design, data collection method, and sample size, prevalence of satisfaction, study region, outcome measure and associated factors for satisfaction.

Table 1: Description of included studies for systematic review

S/N

Authors/year

Study setting

Study design

Data collection method

Sample size

Prevalence of maternal satisfaction (%)

Town/state

Outcome

Factors associated with satisfaction

1 Somade & Ajao,

2020

PHC Cross-sectional Structured

Questionnaire

380

66.7%

Ogun Maternal satisfaction Communication skill, Accessibility of care, Midwives’ availability and professionalism, Cost of services
2 Timane et al,

2017

PHC Cross-

Sectional

Structured

Questionnaire

250

96.7%

Sokoto Client

satisfaction

Waiting time, environment, cleanliness of toilets, availability of water, treatment and outcome
3 Lawali & Lamide

2020

Teaching hospital Cross-

Sectional

Structured

Questionnaire

158

97.7%

Sokoto Maternal

satisfaction

Waiting time, courtesy, privacy, competence, treatment given, support, sex of health worker
4 Okonofua et al

2017

Teaching

Hospitals

Cross-

sectional

FGD

40

Low

Zaria, Mina, Abuja, Oyo, Benin, Kano, Abeokuta, Ibadan Women’s

satisfaction

Staffing, electricity, water, attitude of staff, waiting time, availability of drugs, attention, support
5 Uzochuckwu et al, 2014 Community Cross-

sectional

Structured

Questionnaire

405

90.6%

Enugu Maternal

satisfaction

Availability of drugs, physical condition of facilities
6 Sayyadi et al,

2021

Hospitals Cross-

sectional

Structured

Questionnaire

438

67.6%

Kano Maternal

satisfaction

Supplies, competence of staff
7 Ilesami &

Akinmeye,

2018

PHC Cross-

Sectional

Questionnaire

66

98.5%

Ibadan Mother’s

satisfaction

Waiting time, staffing, attitude of staff, environment, water, supplies, distance to facility, competence
8 Ajayi, 2019 Teaching

Hospital

Cross-

Sectional

Questionnaire

57

66.7%

Ibadan Mother’s

satisfaction

Infrastructure, staffing, medicine, equipment
9 Anikwe et al,

2019

Hospitals Cross-

sectional

FGD

Interviews

1227

97.1%

Ondo, Ekiti,

Nasarawa

Maternal

satisfaction

Cleanliness of health facility, attitude of staff, privacy, supplies and medicine
10 Oyo-Ita et al,

2007

Teaching

Hospital

Cross-

sectional

Questionnaire

250

59.3%

Abakaliki Women’s

satisfaction

Environment, attitude of staff, communication, care
11 Odetola &

Fakorede,

2018

Hospital Cross-

sectional

Questionnaire

144

97.2%

Calabar Mother’s

satisfaction

Sanitation of facility, attitude of staff, basic amenity
12 Nnebue et al,

2021

PHC Cross-

sectional

Questionnaire

280

93.2%

Nnewi Maternal

satisfaction

Waiting time, cost, attitude of staff
13 Yakubu et al, 2020 UDUTH Cross-sectional Questionnaire

158

90.0%

Sokoto Maternal satisfaction Medical supplies/drugs, delivery beds, waiting rooms, toilets/showers, number of health workers, lab services.

Ethical Clearance

Ethical clearance was not applicable in this study being a literature review work.

Results

Search Outcome

A total of 108 journal articles were retrieved after the search and out of these, 33 were eliminated due to repetitions and not been directly related to the topic. Amongst the ones retained, 31 were dropped because they were studies done for maternal satisfaction in developing countries and not limited to Nigeria. Forty four (44) journal articles were eventually picked for the review but after further screening only 13 satisfied the eligibility criteria set for the study while those that do not qualify due to a slightly different approach in methodology were discarded (Figure 1).

fig 1

Figure 1: Flow diagram summarizing searches

Characteristics of Studies Selected for Review

All selected articles were studies that focused on maternal/mother’s or client satisfaction with delivery services in Nigerian health institutions. Some were conducted in primary health care centers, others secondary health facilities or teaching hospitals. They were all cross-sectional, questionnaire based, with in-depth interviews and some focused group discussions. They cut across the entire regions of the country in fact one particularly involved all the six geopolitical regions of Nigeria. They were all published in reputable journals with complete data and English language (Figure 2).

fig 2

Figure 2: Conceptual frame work for maternal satisfaction

Women’s Overall Satisfaction with Care

Eight (8) of the studies reported the prevalence of women’s satisfaction with delivery services to be over 90%. Three (3) reported slightly over 60%, one less that 60% and one did not report prevalence but documented a low satisfaction. From this report, there was an overall good satisfaction with the quality of care rendered in the health facilities studied.

Factors Associated with Maternal Satisfaction

A large spectrum of factors influencing maternal satisfaction emerged from this review. They are summarized here according to the Donabedian framework of structure, process and outcome, besides access, socioeconomic concerns and other factors.

Physical Environment of the Health Facilities

Eleven (11) of the studies have women’s assessment of the physical environment as a perceived factor that was associated with their satisfaction. Five (5) of them reported satisfaction of the women with environment of the facilities while six reported to be dissatisfactory by the women’s perception [18-25]. Two studies from Sokoto (North-west), one from Ibadan( South-west) and one from Abakaliki (South-east) and one from Calabar (south-south) reported that the women were satisfied with the cleanliness of the consulting rooms, waiting rooms, toilets and water supply [19,20]. However the others reported substandard facilities with dirty environment, irregular electricity, inadequate water supply, bad toilets, bad bathrooms and inadequate infrastructures [25].

The study done in secondary and tertiary health institutions in six geopolitical zones with cities such as – Zaria, Mina, Abuja, Oyo, Benin, Kano, Abeokuta, Ibadan involving a cross-section of women through in-depth interviews and focused group discussions reported that in almost all the cities women were not satisfied with facility based delivery services due to substandard infrastructure, unclean environment, lack of privacy, inadequate water supply and electricity supply [9]. They said these deficiencies in health institutions is what discourage most of them from utilizing orthodox facilities for delivery but rather prefer traditional facilities [9].

Availability of Human Resources or Manpower

In almost all the studies including those that reported satisfactory quality of care as perceived by the women there was a consistent dissatisfaction with the adequacy of the number of staffing. Inadequate manpower was considered to be responsible for long waiting time, poor attention to patients, lack of social support, poor attitude, inadequate education and information provided to the patients when needed. A study done in Sokoto reported that the women were dissatisfied with the sex of the health worker who attended to them [20].

Availability of Medicines, Supplies and Services

Only four (4) studies reported satisfaction by the women’s assessment for the supply of drugs and other medical provisions for their treatment. Most of them were not satisfied but complained of inadequacy or absence of basic medications and commodities and lamented of the high cost of the available drugs. A study in Kano reported that the women in rural compared with urban communities were more dissatisfied particularly with finance, shortage of drugs, hospital equipment, manpower deficiency and transportation difficulties [26].

Interpersonal Relationship

Out of eight (8) of the studies that reported on attitude of health workers towards the women, five (5) of them carried the report that the women were dissatisfied with the interpersonal relationship that exist between the medical personnel and their clients. Some women have reported verbal and physical insult against them [9]. Lack of respect and courtesy toward the women. The focused group discussions in the regional study revealed women complaining of maltreatment either before, during or after delivery. For instance in Edo a participant complained of harassment even when patients asked questions about their care [9]. However, two reported that hospital staff were respectful, gave orientation to patients, explained treatment procedures, sought for the opinion of the patients during treatment and gave the patients support.

Discussion

The general trend of maternal satisfaction with delivery services in Nigerian health facilities suggest a high satisfaction in most of the studies reviewed. The report is similar to those from southern Ethiopia (95%), multi-regional study in Ghana, Guinea, and Myanmar 88.4% but higher than reports from central Ethiopia (3.6%) and South Africa 55% [27].

However, the reported studies showed that a deeper and critical interrogation of the women through in-depth interviews and focused group discussions on maternal care following recommendations by the world health organization (WHO) and elaborated by Donabedian tool, revealed the obvious gaps in the health care system [21]. This probably suggests that the women may have not appreciated what their rights and privileges are due to lack of personal awareness and knowledge, although Nnebue et al. (2014), reported otherwise [28].

However, the regional study by Okonufua et al. (2017) showed so much knowledge and information that had been gathered by the women overtime. They were able to elucidate the challenges in the health sector and proffered solutions and recommendations which included; the improvement and expansion of hospital facilities, better organization of clinical services to reduce delays and mis-management, the training and re-orientation of health workers and the education/counseling of women [9]. These recommendations for rectification are consistent with previous recommendations reported in other studies in developing nations such as Ethiopia [2,29,30].

Physical Environment

Although some of the studies like the ones in PHCs in Ogun state suggested that mothers were satisfied with the physical condition of the environment, most of the reviewed studies reported dissatisfaction. In Sokoto, Kano, Minna, Ibadan and Enugu there were lack of satisfaction with electricity supply, adequacy of clean water, toilet facilities, bathrooms, waiting areas, consulting rooms and bed spaces for admission [16,19,20].

In some reports, women were said to sit on vehicles of doctors awaiting consultation because of inadequate chairs in the waiting area, some had delivered on the floor, and other situations patients bring water from home for their treatment [9,16,20]. The situation was found to be worse in the report that compared urban and rural health care service delivery as reported by Sayyad et al. (2021) in Kano [16]. These findings are typically synonymous to what is reported in other developing nations like Ethiopia, Ghana and Tanzania [31]. Women were prompt to say these were some of the reasons they do not want to utilize health facilities for delivery [17,32].

A qualitative study in Ghana in which in-depth interviews were conducted revealed some women complaining bitterly of the delivery conditions being grossly below their expectations. One women said; “I was not comfortable with the condition of the bed there, especially the mattress I slept on. The mosquito nets also need to be changed because they were not good enough for people to sleep inside them” [33]. In a study by Darebo et al. (2016) in Southern Ethiopia, some women were very unhappy with ward cleanliness. A 33-year-old woman from Soddo said: “… though I was very satisfied with the care all the way through, I felt embarrassed when I had to sleep on a couch which was left unclean from a previous birth, with some blood and secretions visible on top of the bed”. A shortage of water and dirty toilets was the main source of dissatisfaction for several women. This was particularly exacerbated by a disaster that led to interruption in power supply in the area for several days.

These are well known challenges that confront the health sector in developing countries like Nigeria. The issue of bed shortage was also a big problem in the public hospitals. According to the women surveyed, they were discharged as quickly as possible due to lack of beds or broken beds. The health sector leadership in developing nations should make more efforts in improving on the sanitary conditions of the hospitals and meeting the infrastructural needs and provision of basic amenities [2,17].

Interpersonal Relationship

The study in selected areas in Ogun State showed that the main perceived factor influencing quality of health care service was staff conducts and practice (94.6%). The women were satisfied with communications skill of the health personnel (67.6%) that attended to them [18]. This is contrary to the report from a study in Erbil City in Iraq by Ahmed (2020). The study in Sokoto [20] also, reported satisfaction with health worker attitude. Similarly, in Ondo, Ekiti and Nasarawa states where user fee removal policy was practiced, the women were also satisfied with health worker attitude [22]. High satisfaction rate was also seen in the survey of PHC centers in Ibadan which showed that 95.6% of the women were satisfied with the attitude of health workers whom they described as respectful and courteous, while 86.4% were happy with pain management [34].

However, further review of the studies show that although few reported satisfaction with conduct and practice of health workers, most were dissatisfied. Mothers reported maltreatment, disrespect and lack of courtesy by health workers [11]. In the study at Enugu south-eastern Nigeria, a lot of the participants complained of the unfriendly attitudes of the health workers [35]. Although they opined that the health personnel differs in character with some being courteous while some were not [35]. In the view of one of the client, “I think the attitude of our nurses is bad because they have no respect or mercy for a patient and they insult patients without been provoked” [35].

The clients went ahead to offer some explanations why staff behavior might be bad. Some participants felt that “easy fatigability as a result of stress on the few staff makes then easily irritable, coupled with the uncoordinated and misguided behavior of the patients who argue and jump queues” [11,35]. However, the most common explanation was that the health workers who are used to seeing illness and deaths have become insensitive to patient needs [35].

These findings were worse with the regional studies reported by Okonofua et al. (2018). In one of the narrative by a patient during the focused group discussion, in Kano the participant lamented: “they do not give enough attention to women in labour, some women will be shouting and crying and they still will not attend to them”. Several studies done in different parts of Nigeria report a lot of maltreatment [11,36]. Several women reported unfriendly, insensitive, poor and negative attitude towards them in their last deliveries by a range of 11.3% to 70.8% of women in eight cross-sectional surveys in Enugu , South-east, Nigeria [37] some in Benue State, North-central Nigeria (Orpin et al. 2018). Studies have shown that women who were maltreated are less likely to be satisfied [38,39].

A multi-country community based study done in Ghana, Myanmar, Guinea and Nigeria which reported verbal and physical abuse against the women showed that they were more likely to report less satisfaction with care [39] and this makes so many women prefer delivery at TBAs whom they say are more compassionate and supportive [40]. The same has been reported in Nigeria; for instance in Ota, Ogun State in South-western Nigeria [6]. This perhaps clearly shows the difference between actual qualities of care provided and perceived quality of care by the women [4].

Another study done in Lagos comparing satisfaction with the quality of care between faith-based and public facility care reported the women were more satisfied with the faith based health care services due to perceived effectiveness [41]. What this means is that, even if the modern health facilities in Ota have expert practitioners with internationally recognized good practice, the maternal deaths might unfortunately still be on the rise due to poor utilization, because women’s perception of ‘quality’ influences health service utilization[4,6,42].

Similarly, in Northern Nigeria, the practice of Purdah (female seclusion) is very common. In this practice, women are isolated and encouraged to give birth at home [6]. Many in these settings believe that allowing an outsider help with delivery could be disrespectful [6,42]. Thus, even if maternal health institutions exist in this region, it might not improve health outcomes because of people’s beliefs and culture [6,42].

Moreover, raising awareness on the existence of a maternal health facility, making it accessible and affordable does not always result to its utilization [6]. This has been shown for example, in Giwa Local Government Area (LGA) of Kaduna State North-western Nigeria. Despite living close to a health facility with free maternal health services, majority of the women were not utilizing the facility for child delivery [6]. One of the reasons for the poor use of formal health system in that community is the belief that health care providers have a negative attitude; consequently, many women would rather give birth at home or at a traditional health center [6].

Thus, even though the evidence towards reducing maternal mortality through access to skilled pregnancy care are largely relevant, it remains inadequate in ensuring a substantial decline in maternal deaths in Nigeria [6]. Improving the quality of health services goes beyond assessing only the supply aspect of care [4,6]. Some authors noted that even if the standard of services in Nigerian primary, secondary or tertiary health facilities is improved, maternal mortality may still be high [6]. This is because an increase in the quality of care provided at a health institution does not always translate to an increase in utilization of the health services by women [6].

Availability of Drugs and Supplies

Nnebue et al. (2014) reported the satisfaction with drugs availability and other supplies in a survey in PHCs in Nnewi amongst 78% of participants [28]. Odetola and Fakorede, 2018 reported that 93.3% of the women in Ibadan were satisfied with supplies, although 68% of the nurses were said to have complained of lack of certain instruments to work with [34]. This finding is similar to that of the report from Ethiopia by Asres et al. (2018) [43]. The challenge in developing nations is that of “out of stock” syndrome. The few inequitably distributed health centers are usually not well equipped and lack basic supplies for efficient service delivery.

Studies have shown that the private health facilities do have better supplies than public facilities [44], however the latter is usually not within the capacity of the not well to do people when it comes to the issue of affordability [44].

Accessibility to the Health Facilities

The satisfaction of the women was indirectly connected to how close the facility was to their places of residence [32,41]. A study had demonstrated that women who live closer to the health facility in which case it will take just about 30 minutes to locate the facility and do also have a means of transportation are more likely to deliver in the facility than those it will take an hour or more and do not have easy access by means of transportation [17,32,45]. On arriving the hospital, promptness of care was judged to be a criteria for satisfaction by the women while increase waiting time was a determinant for dissatisfaction as was reported by a study in Ethiopia [29,32,45]. A study done in Kenya reported that private facilities do have a lesser waiting time compared with public facilities. The report has it that a higher proportion of clients from private facility 98.1% were attended within 0 ± 30 minutes of arrival to the facility as compared to 87% from public facility [41,44].

Biosocial Factors and Maternal Satisfaction

Although majority of the studies for the assessment of perceived satisfaction with care by the women did not include biosocial factors, two particularly done in Kano by Sayyadi et al. (20210 and Ibadan by Otedola and Fakorede (2018) reported on the impact of level of education and economic status on satisfaction [26,34]. They opined that, most of the studies reporting high satisfaction were amongst women with relatively lower levels of education and economic status. Dis-satisfaction with maternity care services were seen more among women with higher socio-economic status and level of education. This could be as a result of the exposure and higher expectations of care among the higher class women. Coasta et al. (2019) in Brazil reported that the women’s birth satisfaction was positively associated with age, number of children, education level and income [46]. They found out that those who had more personal control during childbirth, lower labour pains, no underlying medical problems during delivery and more social support or labour companionship showed higher birth satisfaction levels [46].

Cultural Diversity in Childbirth Interplay

One prominent area that affects satisfaction of clients with maternal health care services that was not adequately focused on in the reviews but is worthy of mentioning is the diversity of cultures across ethnic divide in Nigeria [6,42]. Globally, it has been reported that the culture of the skill birth attendant and profession, client and the practice setting affects perceived quality of care [6,42]. There are about 374 ethnic groups, in Nigeria with different cultures which creates a challenge to the healthcare provider because these cultural variations are believed to affect the birth process [6,42]. This explains why for instance the clients could prefer certain sex of the healthcare giver to attend to them, patronage of either health facility or un-orthodox facility, interpersonal disagreements, pain coping/management issues and place of birth etc. [6,42]. It is therefore crucial for birth attendants to have a good knowledge of culturally bound behaviors in order to facilitate a satisfying birthing experience by the culturally diverse women of Nigeria. In the light of this assertion, it will be appropriate to train skill birth attendants on cultural interplay mechanism that affects client’s satisfaction with delivery services in health facilities.

Conclusion

Although overall satisfaction with health facility delivery services was good, there was some dis-satisfaction expressed by the women in certain domains. These factors that the women identified as causes of dissatisfaction with maternal care included; dirty hospital environment, inadequate and dirty toilets, inadequate water supply, and poor interpersonal relationship with health care givers in which patients have been verbally or physically maltreated. Also location/distance of health facilities, increased cost of some services and lack of drugs. For these reasons some women prefer to deliver outside orthodox health facilities. A digitalized feedback system, strict patient care pathways as well as periodic audits are compulsory. More regional research on maternal satisfaction is however recommended to capture particularly factors such as culture and place of residence whether urban or rural to appreciate their influence on maternal satisfaction.

Recommendations

To improve on the health care delivery system, the following recommendations become critical.

Physical Environment

  1. Health facilities should be kept clean and tidy. Environmentalist and cleaners as staff or contractors should be engaged for this responsibility of continuous maintenance of a decent hospital environment.
  2. Availability of adequate and clean toilets and water should be ensured regularly by health facility staff. A dedicated electricity line will guarantee regular supply of electricity to power equipment and machines for uninterrupted service delivery.
  3. Provision of sufficient seats in waiting areas for the clients as they await consultations as well as enough beds for admission should be ensured.
  4. Interpersonal Relationships

    1. Employment of more staff of different cadre to reduce burn out syndrome. Hopefully this could reduce the tension, irritability and anger exhibited by health workers towards patients as a result of stress of work.
    2. Deliberate training and retraining of health workers at maternal health care centers to improve their performance and quality of care devoid of maltreatment to patients. They should rather be able to counsel, inform and request for patient’s input into their care.
    3. There is need for continuous upgrading and refinement of patient care communication skills of staff in order to make them friendlier, more prompt and responsive to patients.
    4. There should be improvement on the hospital organization so as to reduce delays and long waiting time for consultations. Appointments to patients in batches could be considered as a strategy in this regards. Also computerization of hospital records and at every department of service delivery.
    5. Continuous monitoring of clients’ satisfaction with all aspects of care could aid in improvement of the quality of services.
    6. Provision of adequate compensation packages and appropriate incentives to health personnel to increase their commitment and motivation to work.
    7. Maintenance of adequate monitoring and supervision of health personnel to ensure the proper delivery of services.
    8. Digitalized feedback system and periodic audit is critical.
    9. Availability of Drugs and Supplies

      1. The Ministry of Health at both the federal, state and local governments should consistently provide adequate supplies, equipment and drugs for providing maternal healthcare services in all the health facilities.
      2. The drugs and cost of services should be made more affordable. Maternal health free services could be considered. The national health insurance scheme (NHIS) could also help in this regard.
      3. Accessibility to Health Services

        1. Creation of awareness through mass media, religious gatherings and social functions about the need to utilize institutional maternal health services, and about the dangers associated with using traditional birth attendance.
        2. The government, NGOs, community development efforts should be stepped up in the provision and equitable distribution of health facilities that are well manned by skill birth attendants and optimally equipped for efficient service delivery.
        3. Infrastructural development such as in provision of access roads and means of affordable transportation should be given priority to enable women access care.
        4. Funding of the health sector in Nigeria should as a matter of urgency is improved upon through legislation.
        5. Finally, Caregivers need to fully understand the expectations that patients have for their care, and provide service that is consistent with those expectations.

        Study Strength and Limitations

        The cross-sectional studies done through interviews with the use of questionnaires might have influenced the responses from the participants due to the fact that in most cases the care givers administer them to the clients. Although it was mentioned that, in the training of research assistants it was ensured that efforts were made by these research assistants to assure respondents of confidentiality of their responses. Qualitative data were also used to cross-check the quantitative results obtained from the questionnaires. Even the in-depth interviews through focused group discussion could have been biased for some form of conflict of interest. There were variation in the use of parameters and overall assessment of satisfaction and this non uniformity could have affected the general reporting of findings. The overall satisfaction of hospital delivery services in these studies was found to be suboptimal. Caregivers need to fully understand the expectations that patient have for their care, and provide care that is consistent with those expectations. Future studies should consider gathering more data from a more diverse sample to address the generalizability issue.

        Acknowledgement

        We acknowledge the advices offered by Jonah Musa, Audu Onyewoicho and Emmanuel Adegbe during the preparation of this manuscript.

        References

        1. Babure ZK, Assefa JF, Weldemarium TD (2019) Maternal Satisfaction and Associated Factors towards Delivery Service among Mothers Who Gave Birth at Nekemte Specialized Hospital, Nekemte Town, East Wollega Zone, Oromia Regional State, Western Ethiopia, 2019: A Cross-sectional Study Design. J Women’s Health Care 9: 489.
        2. Darebo TD, Abera M, Abdulahi M, Berheto TM (2016) Factors Associated with Client Satisfaction with Institutional Delivery Care at Public Health Facilities in South Ethiopia”. J Med Physiol and Biophysics 25: 19-28.
        3. Edaso AU, Teshome GS (2019) Mothers’ satisfaction with delivery services and associated factors at health institutions in west Arsi, Oromia regional state, Ethiopia”. MOJ Women’s Health 8: 110-119.
        4. Chizoba N, Tobiloba O, Chigozie N (2017) Factors Influencing the Choice of Health Care Provider during Childbirth by Women in Ibadan, Oyo State, Nigeria. Int J Caring Sc 10: 511-521.
        5. Bitew K, Ayichiluhm M, Yimam K (2015) Maternal Satisfaction on Delivery Service and Its Associated Factors among Mothers Who Gave Birth in Public Health Facilities of Debre Markos Town, Northwest Ethiopia. BioMed Res Int 1-6. [crossref]
        6. Ope BW (2020) Reducing maternal mortality in Nigeria: addressing maternal health services perception and experience. J Global Health Reports 4: e2020028.
        7. Demis A, Getie A, Wondmieneh A, et al. (2020) Women’s satisfaction with existing labour and delivery services in Ethiopia: a systematic review and meta-analysis. BMJ Open 10: e036552.
        8. Adegbe OE (2021) Factors that determine the place of Childbirth in Lagos State, Nigeria’. Walden Dissertations and Doctoral Studies 10628: 2021.
        9. Okonofua F, Ogu R, Agholor K, Okike O, Abdus-Salam R, et al. (2017) Qualitative assessment of women’s satisfaction with maternal health care in referral hospitals in Nigeria. Reprod Health 14: 44. [crossref]
        10. Oikawa M, Sonko A, Faye EO, Ndiaye P, Diadhiou M, et al. (2014) Assessment of Maternal Satisfaction with Facility-based Childbirth Care in the Rural Region of Tambacouda, Senegal. Afr J Reprod Health 18: 95-104.
        11. Bohren AM, Vogel JP, Tunçalp O, Fawole B, Titiloye MA, et al. (2017) Mistreatment of women during childbirth in Abuja, Nigeria: a qualitative study on perceptions and experiences of women and healthcare providers. Reprod Health 14: 9. [crossref]
        12. Babalola TK, Okafor IP (2016) Client satisfaction with maternal and child health care services at a public specialist hospital in a Nigerian Province. Turk J Public Health 14: 117-127.
        13. Amu H, Nyarko SH (2019) Satisfaction with Maternal Healthcare Services in the Ketu South Municipality, Ghana: A Qualitative Case Study”. BioMed Research International 2019: 2516469. [crossref]
        14. Mocumbi S, Högberg U, Lampa E, Sacoor C, Valá A, et al. (2019) Mothers’ satisfaction with care during facility-based childbirth: a cross-sectional survey in southern Mozambique”. Pregnancy and Childbirth 19: 303. [crossref]
        15. Panth A, Kafle P (2018) Maternal Satisfaction on Delivery Service among Postnatal Mothers in a Government Hospital, Mid-Western Nepal. Obstet Gynaecol Int 2018: 1-11. [crossref]
        16. Sayed W, ElAal DEM, Mohammed HS, et al. (2018) Maternal satisfaction with delivery services at tertiary university hospital in Upper Egypt, is it actually satisfying? Int J Reprod Contracept Obstet Gynaecol 7: 2547-2552.
        17. Debela AB, Mekuria M, Kolola T, Bala ET, Deriba BS (2021) Maternal Satisfaction and Factors Associated with Institutional Delivery Care in Central Ethiopia: a Mixed Study. Patient Preference and Adherence 15: 387-398. [crossref]
        18. Somade EC, Ajao EO (2020) Assessing Satisfaction with Quality of Maternal Healthcare among Child Bearing Women in Selected Primary Healthcare Centers in Ogun State, Nigeria. Int J Acad Res Bus Arts Sc 2: 200-210.
        19. Timane AJ, Oche OM, Umar KA, et al. (2017) Clients’ satisfaction with maternal and child health services in primary health care centers in Sokoto metropolis, Nigeria. Edorium J Matern Child Health 2: 9-18.
        20. Lawali Y, Lamide A (2020) The Health Workers and Delivery Process Related Maternal Satisfaction with Delivery Services at UDUTH Sokoto, Nigeria. Perception in Reprod Med 3: 256-260.
        21. Ilesami RE, Akinmeye JA (2018) Evaluation of the quality of postnatal care and mothers’ satisfaction at the university college hospital Ibadan, Nigeria. Int. J Nurs Midwifery 10: 99-108.
        22. Ajayi AI (2019) I am alive; my baby is alive”: Understanding reasons for satisfaction and Dissatisfaction with maternal health care services in the context of user fee removal policy in Nigeria. PLoS ONE 14: e0227010. [crossref]
        23. Anikwe CC, Egbuji CC, Ejikeme BN, Ikeoha CC, Egede JO, et al. (2019) The experience of women following caesarean section in a tertiary hospital in Southeast Nigeria. Afr Health Sci 19: 2660-2669. [crossref]
        24. Oyo-Ita AE, Etuk SJ, Ikpeme BM, Ameh SS, Nsan EN (2007) Patients perception of Obstetrics practice in Calabar Nigeria. Nig J Clin Pract 10: 224-228. [crossref]
        25. Yakubu L, Muhammad F, Zulkiflu MA, et al. (2020) Health Facility Related Maternal Satisfaction with delivery Services at UDUTH Sokoto. World J Pharma Med Res 6: 04-08.
        26. Sayyadi BM, Gajida AU, Garba R, Ibrahim UM (2021) Assessment of maternal health services: a comparative study of urban and rural primary health facilities in Kano State, Northwest Nigeria. Pan Afri Med J 38: 1-13. [crossref]
        27. Oosthuizen SJ, Bergh A-M, Pattinson RC, Grimbeek J (2017) It does matter where you come from: mothers’ experiences of childbirth in midwife obstetric units, Tshwane, South Africa. Rep Health 14: 1-11. [crossref]
        28. Nnebue CC, Ebenebe UE, Adinma ED, Iyoke CA, Obionu CN, et al. (2014) Clients’ knowledge, perception and satisfaction with quality of maternal health care services at the primary health care level in Nnewi, Nigeria. Niger J Clin Pract 17: 594-601. [crossref]
        29. Fikre R, Eshetu K, Berhanu M, Alemayehu A (2021) What determines client satisfaction on labor and delivery service in Ethiopia? Systematic review and meta-analysis. PLoS ONE 16: e0249995. [crossref]
        30. Amdemichael R, Tafa M, Fekadu H (2014) Maternal Satisfaction with the Delivery Services in Assela Hospital, Arsi Zone, Oromia Region. Gynecol Obstet (Sunnyvale) 4: 257.
        31. Gashaye KT, Tsegaye AT, Shiferaw G, Worku AG, Abebe SM (2019) Client satisfaction with existing labor and delivery care and associated factors among mothers who gave birth in university of Gondar teaching hospital; Northwest Ethiopia: Institution based cross-sectional study. PLoS ONE 14: e0210693. [crossref]
        32. Ayamolowo LB, Odetola TD, Ayamolowo SJ (2020) Determinants of choice of birth place among women in rural communities of south-western Nigeria. Int J Afr Nursing Sc 13: 1-7.
        33. Amu H, Nyarko SH (2019) Satisfaction with Maternal Healthcare Services in the Ketu South Municipality, Ghana: A Qualitative Case Study. BioMed Research International 2019: 2516469. [crossref]
        34. Odetola TD, Fakorede EO (2018) Assessment of Perinatal Care Satisfaction amongst Mothers Attending Postnatal Care in Ibadan, Nigeria. Annals of Global Health 84: 36-46. [crossref]
        35. Uzochukwu BSC, Onwujekwe OE, Akpala CO (2004) Community Satisfaction with the quality of Maternal and Child Health Services in Southeast Nigeria. East Afr Med J 81: 293-299. [crossref]
        36. Dahiru T, Oche MO (2013) Determinants of antenatal care, institutional delivery and postnatal care services utilization in Nigeria. Pan Afr Med J 21: 321. [crossref]
        37. Ishola F, Owolabi O, Filippi V (2017) Disrespect and abuse of women during childbirth in Nigeria: A systematic review. PLoS ONE 12: e0174084. [crossref]
        38. Orpin J, Puthussery S, Davidson R, Burden B (2018) Women’s experiences of disrespect and abuse in maternity care facilities in Benue State, Nigeria. BMC Pregnancy and Childbirth 18: 1-9.
        39. Maung TM, Mon NO, Mehrtash H, et al. (2021) Women’s experiences of mistreatment during childbirth and their satisfaction with care: findings from a multi-country community-based study in four countries. BMJ Global Health 5: e003688.
        40. Ebuehi OM, Akintujoye IA (2012) Perception and utilization of traditional birth attendants by pregnant women attending primary health care clinics in a rural Local Government Area in Ogun State, Nigeria. Int J Women’s Health 4: 25-34. [crossref]
        41. Ogunyemi AO, Ogunyemi AA, Olufunlayo TF, Odugbemi TO (2019) Patient satisfaction with services at public and faith based primary health centers in Lagos State: A comparative study. J Clin Sci 16: 75-80.
        42. Esienumoh EE, Akpabio II, Etowa JB et al. (2016) Cultural Diversity in Childbirth Practices of a Rural Community in Southern Nigeria. J Preg Child Health 3: 280.
        43. Asres GD (2018) Satisfaction and Associated Factors among Mothers Delivered at Asrade Zewude Memorial Primary Hospital, Bure, West Gojjam, Amhara, Ethiopia: A Cross Sectional Study. Prim Health Care 8: 293.
        44. Okumu C, Oyugi B (2018) Clients’ satisfaction with quality of childbirth services: A comparative study between public and private facilities in Limuru Sub-County, Kiambu, Kenya. PLoS ONE 13: e0193593. [crossref]
        45. Tadesse BH, Bayou NB, Nebeb GT (2017) Mothers’ Satisfaction with Institutional Delivery Service in Public Health Facilities of Omo Nada District, Jimma Zone. Clin Med Res 6: 23-30.
        46. Costa DDOO, Ribeiro VS, Ribeiro MRC, Esteves-Pereira AP, Sá LGC, et al. (2019) Psychometric properties of the hospital birth satisfaction scale: Birth in Brazil survey. Cad Saúde Pública 35: e00154918. [crossref]
fig 3

Accountability for SRHR Under Universal Health Coverage

DOI: 10.31038/AWHC.2022524

Introduction

Accountability describes a relationship between a duty holder and a person or organization to whom a duty is owed. Accountability is constituted of three different elements: engagement of citizens with power holders in shaping responsibilities, answerability of power holders to citizens, and enforcement of action on power holders who fall short on their duties (Figure 1) [1].

FIG 1

Figure 1: Different elements of accountability

WHO states SRHR “encompasses efforts to eliminate preventable maternal and neonatal mortality and morbidity, to ensure quality sexual and reproductive health services, including contraceptive services, and to address Sexually Transmitted Infections (STI) and cervical cancer, violence against women and girls, and sexual and reproductive health needs of adolescents” [2].

Accountability for sexual and reproductive health and rights (SRHR) in the context of Universal Health Coverage (UHC) entails:

  • Power holders engaging citizens and SRHR organizations while framing UHC legislation, policies, plans, financing arrangements and budgets; as well citizens and SRHR organizations influencing these processes from outside,
  • Citizens/clients, rights-based organizations, professional bodies and research institutions holding Ministries of Health, other relevant Ministries, and private health sector answerable for implementing SRHR sensitive UHC plans. It also entails the state holding private health sector and its own functionaries answerable internally, and
  • The state or/and citizens enforcing sanctions when power holders are not able to ensure comprehensive SRHR universally and without catastrophic expenditure.

Accountability for SRHR in the context of UHC is important if Sustainable Development Goal (SDG) target 3.8 and 5.6 are to be achieved. SDG target 3.8 states “Achieve universal health coverage, including financial risk protection, access to quality essential health-care services and access to safe, effective, quality and affordable essential medicines and vaccines for all”. SDG 5.6 specifically refers to SRHR. It emphasizes “Ensure universal access to sexual and reproductive health and reproductive rights as agreed in accordance with the Programme of Action of the International Conference on Population and Development and the Beijing Platform for Action and the outcome documents of their review conferences”. In the context of these international commitment, this paper fleshes out concepts in accountability, and show cases accountability strategies, interventions, tools, systems and mechanisms from different countries. It then pulls out lessons on making accountability for SRHR work in the context of UHC.

Unpacking Accountability

It is possible to distinguish between an accountability strategy, accountability intervention, accountability tool, accountability system, and accountability mechanism [3]. The first three are discussed in the context of SRHR, while the last two are outlined with reference to SRHR and its social determinants. “Accountability strategy” for SRHR in the context of UHC is an overarching set of interventions of governments, rights-based organizations, professional bodies, marginalized sector etc. to ensure accountability of power holders from national to local level. An “accountability intervention” refers more narrowly to the implementation of components of accountability strategy. Examples including, holding public hearings on unsafe abortions or strengthening village health committees to encourage men to adopt contraception, institutional delivery and expand access of women to iron tablets. An “accountability tool” is the use of particular accountability tool within the context of a given intervention. Examples include community scorecards of SRH services in facilities to assess qualities and public interest litigation to find out what kind of SRH services has been covered under public health insurance. Several different tools may feed into an accountability intervention. An “accountability system” for SRHR in the context of UHC may involve a “larger system” of accountability to gender and equity in general, beyond SRHR. Gender based violence protection committees, land and housing rights movement are examples. Accountability mechanisms explain what accountability strategy, instrument and tool works or does not work in what contexts.

The principle of participation, transparency & democracy, citizenship & human rights and substantive equality are crucial to any accountability process, including for SRHR in the context of UHC (Figure 2). These principles are elaborated below.

  • Participation: Participation can range from being “informed” to “influencing”, “agenda setting” or “decision making” on SRHR in the context of UHC. The higher order of participation is important.
  • Citizenship and human rights: Citizenship refers to the state of being a member of a particular country and having rights because of it. It is distinct from the term patient or client in the context of SRH services, in that one is referring to a rights holder vis a vis the state who may make demands even when healthy. The concept of citizenship is linked to the concept of human rights inherent to all human
  • Transparency and democracy: Transparency means placing all financial and public information and data including on SRHR in UHC in an easy-to-use and readily accessible manner. This allows citizens to see clearly how public servants are spending tax money and gives citizens the ability to hold their elected officials accountable. A vibrant democracy is central to transparency.
  • Substantive equality: Substantive equality recognizes that everybody is not the same and the specific needs of marginalized people have to be taken into account while framing SRHR in UHC plans and delivering services. Substantive equality financing packages will allow women to access abortion facilities anywhere within a district or province to allow for privacy.

fig 2

Figure 2: Principles underpinning accountability

Stakeholders in Accountability for SRHR in UHC and Their Roles

Several stakeholders need to be involved in accountability processes. These include policy makers, planners, service providers, health research institutes, health economists’ donors, professional bodies, local government, private health sector, marginalized groups, unions, organizations working on SRHR, lawyers collective etc. (Figure 3).

fig 3

Figure 3: Stakeholders in accountability for SRHR

Policy makers, and planners can bring the national perspective on SRHR in UHC into accountability, monitoring, evaluation and review. Donors can harness their international and regional perspectives. Involvement of professional bodies- doctors to village nurses- in accountability mechanisms ensures that technical perspectives and practical constraints that have a bearing on SRH are examined, and also ensures self-regulation towards SRHR in the context of UHC. Involvement of professional associations/unions of health workers is also important to ensure that there is no backlash against them through accountability processes. Involving health research institutes and health economists is crucial to use available research on SRHR for fostering accountability. Further, they may help to strengthen accountability interventions and tools itself from a SRHR in UHC lens. Groups working with a legal perspective on SRHR, may highlight legal measures that are required to make SRHR in UHC effective, or even go beyond like address social determinants of health. Involvement of private-not for profit health sector may also point to innovative ways of approaching SRHR in UHC.

From the bottom up, groups representing marginalized groups in terms of SRHR help to ensure that intersecting disadvantages and needs related to SRHR have been addressed the UHC and hold power holders to account in its translation. Citizens groups often draw up their own charter and could monitor the inclusion of SRHR in UHC plans and examine issues of quality of care and affordability. Local, national, and regional level SRHR organizations help generate qualitative data outside the health management information system on SRHR in UHC which can strengthen accountability. If these SRHR organizations are invited by the national government for review of progress on UHC they may help analyses public data from the vantage view of most marginalized. They can also create shadow reports before the official national level health reviews or before the Voluntary National Report on SDGs, and promote accountability from the bottom up.

Accountability with Respect to What SRHR Indicators?

There are four set of indicators that could be used in accountability system for SRHR in the context of UHC (Figure 4).

First, the extent to which comprehensive SRH services are covered under UHC, in a progressive manner (that is, with most marginalized being given priority).

Second, the extent to which financing arrangements prevent catastrophic expenditure on these services, again with a focus on the most marginalized groups [4]. The expenditure could be on getting to the service delivery point, accessing services, accessing drugs and supplies, and (direct/indirect costs of) adherence to treatment.

Third, inequalities in access to services under UHC, in health expenditure as a percentage of total household income and inequities in SRH and RR outcomes Inequities could be across class, caste, race, ethnicity, religion, migration status, marital status, spatial location, gender orientation, sexual identity, national identity etc.

Fourth, is around quality of SRHR services and promotional activities.

All four aspects- SRH service coverage, financing arrangements, quality of care, and inequities- can be discussed in terms of input, outputs and outcomes and related indicators, leading to a matrix of indicators (Nigel et al. 2016). Figure 4 gives an illustration of such a matrix, though it cannot claim to be a comprehensive list of indicators on SRHR in UHC. Data for inputs can be collected from qualitative and quantitative studies by health research institutions and SRHR groups. Data for process indicators can be gathered through review of policy documents, facility readiness assessment and client feedback at service delivery points. Outputs require review of policy documents, interviews with clients back home of different identities and in different locations and, health financing data.

fig 4

Figure 4: Accountability for SRHR in UHC – Examples of Indicators

Some sub-indicators to be looked into while focusing on service coverage and financial protection is what SRH services are covered and protected, what are not and for whom. It is important to examine if culturally sensitive services like safe and legal abortion and male sterilization, and low priority but expensive ones like sex realignment surgery are included, and whether services for adolescent girls, never married women, transwomen and transmen, women in sex work etc. are available.

Country Case Studies

Using Universal Progress Reviews to Advocate SRHR in the Context of UHC: The Case of Philippines

The Universal Progress Reviews (UPRs) were institutionalized in 2008 by the UN General Assembly as a mechanism for countries to report on their countries’ progress on human rights. The outcome of the review by reviewing countries includes a set of recommendations form the reviewing states, response of the national government and any voluntary commitment by the state on follow up of the recommendations. A total of 21,956 recommendations and voluntary commitments were made between 2008 and 2012, of which 5,720 (26%) pertained to SRHR and gender equality [5]. Seventy-seven of these were formally accepted by the states. There were 12 sessions held during this period, and the proportion of recommendations and voluntary commitments on SRHR and gender equality increased form 20% in the first session to 33% in the last session. Issues of lifting of reservations, gender-based violence, discrimination based on sexual orientation, maternal mortality, female genital mortality, and morbidity received attention in the UPRs [5].

The potential and challenges in using the UPR to promote SRHR is illustrated by the case of Philippines, wherein Family Planning Organization of the Philippines and Sexual Rights Institute lobbied in the UPR, 2012 for a comprehensive SRH law and policy, legalization of abortion age appropriate sexuality education, better contraceptive services, sexuality education, posting adequate number of midwives, and conduct of maternal death reviews [6]. The reviewing countries recommended passing of Reproductive Health law, legislation protecting rights of sexual and gender minorities, access to universal SRH services, enrolling poor in health insurance, addressing gender-based violence, strengthening family planning services and providing abortion for rape, incest, and risk to life of mothers [7]. A Reproductive Health Bill was passed by the Assembly of Philippines in 2012, but it has been as the pressure from the Church which is high in some provinces, and implementation is devolved. Contraception for adolescent is far from reality. Further, budget for contraception has been reduced and but parental/spousal consent is still required in some provinces, and emergency contraception is not easily available [8].

National Health Insurance: Weaving in SRH and Progressive Coverage in Zambia

The government of Zambia established UHC as a priority in its most recent National Health Strategic Plan (NHSP 2017-2021). In September 2017, the government developed a 10-year national health financing strategy and the mandatory National Health Insurance Scheme (NHIS). A National Health Insurance Act was then in April 2018 and a National Health Insurance Authority (NHIA) with a board was formed to manage the insurance scheme with an ambitious target of 100% coverage. In the early stages of designing the scheme there was little participation of SRHR groups. It is in this context that Population Action International and national organization Center for Reproductive Health Education came together in 2018 to organize a two-day workshop for 20 advocacy and service delivery civil society organizations, academicians, and representatives of medical associations. The objective of the workshop was to understand Zambia’s UHC financing policy reforms, their implications for SRH services, drugs and supplies and to develop an advocacy strategy for constructive engagement of civil society actors with the Ministry of Health and National Health Insurance Authority. A Ministry of Health official and a Zambian legal expert participated in the workshop, helping to understand Zambia’s health financing and legal landscapes, and timelines and functioning of the National Health Insurance Authority governing body and fund. Population Action International provided technical inputs as health financing and National Health Insurance Scheme was new to the civil society groups. It was also able to harvest relevant experience from other countries. The workshop examined whether National Health Insurance Scheme protects the existing National Health strategy – which prioritizes maternal health, adolescent sexual health education, contraception, Sexually Transmitted Infections, human immunodeficiency virus, and acquired immunodeficiency syndrome, cervical cancer screening and health services for survivors of violence. Three advocacy agendas emerged through the workshop: a) gather evidence on of out of pocket spending on SRH services and commodities and to advocate that comprehensive SRH is included in the essential service package b) include a civil society representative in the board of National Health Insurance Authority and its technical committees c) Help achieve communications objectives of National Health Insurance Scheme, in particular to reach information to women and girls in the informal sector, While the exact impact is not known of this advocacy, sexual and reproductive health organizations are being consulted by the government in deciding service package and they are represented in the National Health Insurance Authority committees, though not Board. Information is reaching women and girls in the informal sector on the scheme [9]. Population Action International is also intervening in India, Ghana, Ethiopia, Kenya and Uganda on UHC to strengthen integration of SRHR into package and financing.

Political Accountability to SRH through Interparliamentary Forums: The Case of Eswatini

Southern and Eastern African Parliamentary Alliance of Committees of Health (SEAPACOH) acts as a forum to strengthen political accountability to SRH in the region. Not only Parliamentarian, but also civil society and regional organizations attend the meetings of SEAPACOH to exchange information, facilitate policy dialogue, and identify concrete actions to advance health equity and sexual and reproductive health in the region. One of the countries that presented in the 2011 meeting of SEAPACOH was Swaziland (now called Eswatini). The Parliamentarian form Swaziland observed that the country had put in place an SRH strategic plan (2008-2015), a National Condom Strategy for men and women and a strategy to integrate SRH and HIV interventions. Nevertheless, he/she observed that implementation has been constrained by absence of SRH Policy, difficulty in mobilizing financial support and over prioritization of HIV over other SRH needs [10]. Comments then followed from the larger SEAPCOH forum on the need for the country to put in place overarching comprehensive SRH policy, strategies to accelerate reduction in maternal mortality, strengthen maternity waiting huts or homes near the hospital. Information on how far these comments have been acted on is not clear, and whether integrated into essential service packages and financing under UHC plans.

The UHC Card: The Case of Argentina

Argentina, an upper-middle-income country, has a well-developed health system, particularly comparing to standards of low- and middle-income countries. Although all inhabitants of Argentina are entitled to receive health carefree of charge in public facilities, UHC is still aspirational rather than actual. Quality of care is still an issue and inequalities in access and outcomes between rich and poor provinces. Variations in infant mortality rate, maternal mortality rate and cervical cancer screening and treatment prevail. To bridge such gaps officials from the Ministry of Health evolved a dashboard of key indicators that would be used to monitor UHC, called the UHC score card. Sixty-five indicators at primary health care level were selected of a total of 166 indicators identified initially. These UHC indicators were classified into five domains: system, inputs, service delivery, results and impact. Of the 65 indicators the ones that could have a bearing on SRH in the context of UHC are given in Table 1 below.

Table 1: Indicators across domains pertaining to SRH in Argentina UHC scorecard

Domains Indicators
1. System • Proportion of people with exclusive public coverage that have access to basic health services

• Proportion of people with exclusive public coverage assigned to a primary care facility

• Proportion of primary care facilities with geographical responsibility defined

• Proportion of primary care facilities that bill to social security

• Current primary health-care expenditure per capita

Inputs  Nurse density (per 10 000 population)

• Primary care doctor density (per 10 000 population)

• Health-care facility density (per 100 000 population)

• Vaccine supply according to risk groups

• Essential drugs availability according to target population

Service delivery • Barriers to access due to cost of treatment

• Barriers to access due to distance

• Dropout rate of treatment

Success rate of treatment


Results • Rate of women aged 25–64 years with cervical cancer screening

• Women aged 25–64 years that have started treatment for high-grade squamous intraepithelial lesions or invasive cervical cancer


Impact • Adult mortality from non-communicable diseases

• Maternal mortality

• Neonatal mortality

• Rate of hospitalization for primary-care-sensitive conditions

These indicators could be more SRH and RR aware, like availability of essential drugs related to SRH morbidity could be included under inputs, barriers to access due to health providers attitude (like on provision of safe and legal abortion) could be included under ‘service delivery’, rate of adolescents who get contraception on demand could be included under results and indicators like reduction in anemia amongst women of reproductive age could be included under impact.

Near Miss Maternal Case Review: Armenia, Georgia, Latvia, Republic of Moldova and Uzbekistan

WHO has been advocating “near miss maternal case reviews” since 2004, and guidelines were evolved in 2015. As there are less legal implications of near miss maternal case reviews than maternal death audits, the reviews will lead to more honest analysis and recommendations. Further the user’s views can potentially be secured unlike the case of maternal deaths. The WHO 2015 checklist for near miss maternal case reviews consisted of 50 items, grouped in 11 domains (internal organisation, ground rules, case identification, case presentation, inclusion of users’ views, case analysis, recommendations, follow up, documentation and diffusion and ensuring quality of near miss maternal case reviews). This checklist was used in the review of near miss maternal case reviews in the five countries. The sources of information for the assessment include direct observation of one or more near miss maternal case reviews sessions, discussion with participants, coordinators and managers and review of documents [11]. The findings from the review suggest that the quality of the near miss maternal case reviews implementation was heterogeneous among different domains, different countries, and within the same country. Overall, the first part of the audit cycle (from case identification to analysis) was performed on most indicators. However, users’ views were rarely secured. The second part (developing recommendations, implementing them and ensuring quality) was poorly performed- in particular implementation. There were inter country and intra country variations. In the ex-Soviet countries, hierarchies prevailed and even midwives were not involved. The tendency was for the doctors to affix blame on one staff, rather than look at health system issues and coming with organizational solutions. There were intra country variations too. Each country had at least one champion facility, where quality of the near miss maternal case reviews cycle (around one and a half years) was well completed from analysis to implementing recommendations. In the context of UHC, the implication of health financing policies needs to be examined in maternal health service access, utilization and outcomes.

Monitoring of Insurance Schemes from an SRH Lens: Mexico and India

In Mexico, the maternal mortality rate is 60 per 100,000 live births. While this is lower than many African counties, these deaths are concentrated among rural indigenous women and Afro-descendant women living in extreme poverty. The World Bank-funded “Coverage Extension Program” target marginalized communities and include maternal health among their priorities. In addition, there is the “Fair Start in Life” (APV) program which was specifically designed to address maternal and infant health. Fundar (an independent and interdisciplinary organization devoted to research issues) and its partners’ analysis of fund allocation of APV revealed that the maternal health budget was insignificant and that per capita expenditures were lowest in the regions of the country with the highest concentration of poverty. Furthermore, targeted programs did not improve health infrastructure or provide emergency obstetric care and mainly focused on prenatal care. Fundar and its partners also examined the government ‘s Seguro Popular or popular health insurance. On the positive side, the insurance program receives the majority of its funding from the federal government, with small contribution from the states. This reduces inequalities across states and between employed and unemployed. However, detailed budget information that had been previously available became hidden within huge budget categories. Seguro Popular did not initially include emergency obstetric care services. The coalition working on maternal mortality undertook the task of pricing the provision of basic and comprehensive emergency obstetric care and demonstrated its viability and life-saving relevance. As a result, a series of emergency obstetric care-related services and interventions were ultimately included in the program. Other areas the coalition advocated was utilisation of budget earmarked for infrastructure between 2004 to 2007, as 70% of funds for infrastructure was unspent. Through the analysis and advocacy strategies of Fundar and its partners, the profile of maternal mortality has been raised, and it is had become a public issue related social justice, gender, class and race. Allies in the Ministry of Health and Gender Equality Commission in Congress helped push emergency obstetric care. On the other hand, budget transparency varied across regimes and posed challenges [12].

Private Health Sector Accountability to Reproductive, Maternal, Newborn, and Child Health

The government policies in India seek to engage the private sector through public-private partnerships, insurance, and other schemes, including for reproductive, maternal, new-born, and child health (RMNCH). Through the USAID supported Vriddhi project, John Snow Inc (JSI), India conducted an assessment of RMNCH service delivery in the private sector [13]. Using a mixed-methods approach, the assessment gathered information from over 300 respondents, including facility-based private providers; professional associations; pregnant women and mothers with children under five years of age; government representatives at the national, state, and district levels; and social enterprises in 7 districts across 6 states, namely Delhi, Himachal Pradesh, Jharkhand, and Uttarakhand. The study revealed that only 37 of 87 Inpatient Departments had legal registration to provide medical services. Very few facilities were accredited under recognized systems. None of the facilities provided all RMNCH services as per global or national guidelines. There were gaps in knowledge of contemporary treatment guidelines. The study also found that only 20 of 67 of facilities provided the entire range of RMNCH services. The most commonly provided service was delivery care. The number of reported caesarean sections was much higher than expected, and many did not provide newborn care services. Private providers had reservations about participating in a government-supported health insurance program for the poor, citing that the program does not cover actual costs and that reimbursement is often delayed. In contrast, government representatives suspected that private providers submitted inflated bills and wrongful claims under the program. At the same time the study found that pregnant women often prefer to seek treatment from private providers. Almost all clients highlighted ease of access, time given by providers, better nursing facilities and cleanliness as top reason for private sector preference. However, clients revealed a preference for government facilities if doctors were accessible around-the-clock, as better counselling services were provided on RMNCH. The results of the assessment and recommendations were discussed at a national consultation with public and private sector stakeholders in 2017. The recommendations include establishing public-private partnerships cells at state level and building capacities of private medical professionals on RMNCH and government-endorsed RMNCH guidelines and protocols. Seven thousand medical practitioners were trained through the process.

Community and Service Provider Accountability to SRHR

SRHRs are co-produced/fulfilled by health providers and communities- comprising of marginalized citizens and gate keepers. The Center for Health and Social Justice (CHSJ), an Indian health rights-based organization, formed father’s groups and adolescent boys’ groups with the objective of fostering them to be responsible partners and caring fathers/brothers. The larger goal was to promote women’s rights. As of 2018 this initiative of CHSJ was operational in five states of India. In the state of Jharkhand, marginalized men and women (form indigenous groups, Dalits, women headed households) came together with local government representations, front line health and nutrition workers and interested schoolteachers to prioritize problems related to health and its social determinants through a secret ballot. On the basis of this participatory exercise, a citizen’s charter was evolved in 30 villages in three districts of the state of Jharkhand. A unique feature was that the charter was on what men would do to foster women and children’s health and empowerment. The charter included men’s commitment to monitor health and nutrition services and public distribution system along with women’s groups, encourage women and children to make use of the anganwadi centers (centers for early childhood development and care of pregnant and breast feeding mothers) centers and health sub centers, accompany pregnant women go to health facilities for ANC and institutional delivery, taking children for immunization, (men) adopting contraceptive methods, ending child marriage, and preventing acts of violence on women and children. The charter is hung in prominent places like tea shops, anganwadi centers and schools. However, the use of the chart for actually strengthening accountability of men or service providers varies across villages, dependent on vibrancy of women’s and fathers’ groups. In some villages, there were reports of reduction in domestic violence, men helping in housework, and accompanying women and children to facilities. However, issues like access to safe abortion, screening of reproductive cancers, health referral in instances of gender-based violence or adolescent access to SRH services did not appear in the charter [14-17]. Neither did issues of health financing and monitoring expenditure on health as a percentage of total health expenditure.

Key Lessons and Messages

  1. Accountability for SRHR in UHC (SDG 3.8) needs to be seen along with accountability to SRHR in general (SDG 5). When SRHR policy and legislation is weak, like the case of Philippines, accountability to SRHR in UHC cannot be promoted.
  2. Accountability for SRHR in the context of UHC entails attention to SRHR in essential service package, access to marginalized, quality of SRH services, and issues of health financing and avoidance of catastrophic expenditure. The case study on health insurance in Mexico is a good illustration of this lesson.
  3. Examples of accountability for SRHR as answerability are more common than as enforcement and engagement (Table 2).
  4. There are many accountability interventions and instruments for SRHR. These include involvement of international to local women’s groups in monitoring, implementing UHC score cards and near miss maternal reviews, using UPRs to press for accountability, analysis of health expenditure and financing data, getting into health insurance committees and consultations. No one size fits all situations, and a strategy/system combining mix of interventions and instruments need to be adopted.
  5. Few of the examples of strengthening accountability for SRHR are in the context of UHC. This is particularly true at the community level. There is a need to demystify UHC and take it to community level, like what is happening in Mexico.
  6. There are few examples of ways in which controversial or sensitive SRH services were brought into the UHC through accountability strategies, interventions and instruments. This includes safe and legal abortion, treatment for violence etc. There are more examples related to maternal and child health. However, the Mexico case study illustrates how even emergency obstetric care was not included till it was provided “financially” viable.
  7. There are examples of UHC plans reaching MCH services to the poor, but few to stigmatized groups like sex workers, sexual and gender minorities. The Argentina scorecard is an example.
  8. There are more examples of citizens groups monitoring or holding state accountable on SRH in the context of UHC but few on strengthening private sector accountable to SRHR in the context of UHC. The Vriddhi project example from India is an exception. This is also true of holding private insurance and pharmaceutical industries to account for SRHR.
  9. SRHR in the context of UHC requires that gender and social norms in society change too. Men, community leaders and local governments need to be held accountable as well. The CHSJ example from India illustrates this.
  10. Many of the examples pertain to “surrogates” for marginalized – civil society actors or donors- holding national governments and service providers to account, but not the marginalized. The challenge is to reverse this.
  11. Higher middle-income countries are able to afford services in essential service package which some of the lower income/lower middle-income countries cannot. It is hence important to track donor funding to SRHR. Further it is crucial to monitor funding to health by government as part of GDP, and not just SRHR in UHC. The politics of budget allocation is crucial.
  12. Democratic framework a must to strengthen accountability for SRHR in UHC. It cannot be implemented from top (Eastern Europe/Central Asia case study). At the same time while working with local elected government is important, they also hold discriminatory views, and need to be challenges (the Philippines case study).

Table 2: Examples of accountability for SRHR sector

Country/focus

Accountability as engagement

Accountability as answerability

Accountability as enforcement

Mode of accountability

Instruments

1Philippines- Weaving SRH Legislation and policy Engagement of civil society with Universal Progress Reviews to advocate legal abortion, contraception and sexuality education Monitoring provision of contraception and abortion budget allocated Intervention Lobbying at Universal Progress Reviews


Monitoring


2 Accountability in SRH sector through interparliamentary forums


Southern and Eastern African Parliamentary Alliance of Committees of Health monitoring implementation of SRH plan and condom strategy. Intervention Monitoring by Inter Parliamentary Committee on Health
3.Zambia- Weaving SRH and progressive coverage insurance


Engagement of SRHR groups with national health insurance authority (NHIA) to prioritize SRH services for informal sector SRHR groups represented in NHIA committees Intervention Lobbying nationally


Capacity building of SRHR groups on health financing


Representation in NHIA committee

4. Mexico – Monitoring health insurance schemes


Evaluation of Fair start programmed and health insurance programmed; highlighting poor attention to EmOC, outreach to indigenous Evidence to show viability of EmOC in insurance; and its subsequent inclusion Intervention


Cost Benefit analysis


Lobbying

5. Argentina- SRH integrated UHC scorecard


Monitoring inputs, service delivery, results and impact- includes maternal health and reproductive cancer Instrument UHC score card
6. Armenia, Georgia, Latvia, Republic of Moldova and Uzbekistan –

Near miss maternal case review


Evaluation of “Near miss maternal care reviews” using checklist revealed the tendency to fix blame, not involve midwives and users, and not draw systemic lessons” Instrument Evaluation


Check list

7. India: Private health sector reproductive, accountability in maternal, newborn, and child health (RMNCH)


An assessment of RMNCH service in private facilities, capacity building of private providers based on findings – including on protocols on RMNCH[1] Intervention Review


Capacity building


8. India: Men’s and service providers’ accountability in SRHR


Implementation of citizen’s charter on men’s role in MCH, contraception, reducing gender-based violence (GBV) and monitoring inter sectoral services Intervention


Eco system


Implementing charter on men’s responsibility for care of women and children, making local providers accountable and preventing GBV

To sum up this paper argues that accountability for SRHR and accountability for UHC are both important. Further, accountability for addressing social determinants of SRHR is also crucial, including in the context of disasters, conflicts and pandemics. Accountability for SRHR to policy makers and planners is more common than to marginalized (in addressing intersectional barriers). Accountability for sensitive SRHR issues is less like accountability to provide safe and legal abortion services and health services for gender-based violence and making sure these are part of essential service package. On the other hand, accountability to bring down fertility is higher. Accountability for SRH Services within UHC for controversial groups like adolescents, sex workers, transgenders, religious minorities, and migrants is limited. Accountability systems, strategies, interventions and tools can be seen more for answerability, than enforcement of sanctions (for lack of accountability) and somewhere in between for engagement of citizens in policy making, planning and budgeting. Few examples exist of accountability of private health services and insurance for SRHR. Democracy, active citizenship and resources are a must for accountability for SRHR in the context of UHC. Ultimately accountability to SRHR in the context of UHC is about the tilting the balance of power towards marginalised, public health sector and front-line workers.

References

  1. Caseley J (2003) Blocked Drains and open minds: multiple accountability relationships and improved service delivery performance in Indian city. Institute of Development Studies (IDS) Working Paper 211.
  2. World Health Organisation (2014), Sexual and reproductive health and rights: a global development, health and human rights priority, Comment, Lancet 384: e30-1. [crossref]
  3. Belle Van Sara, Vicky Boydell, Asha S George, Derrick W Brinkerhof, Rajat Khosla (2018) “Broadening Understanding of Accountability Ecosystems in Sexual and Reproductive Health and Rights: A Systematic Review” edited by J. P. van Wouwe 13: e0196788. [crossref]
  4. O’Neill K, Viswanathan K, Celades E, Boerma T (2016) Monitoring, evaluation and review of national health policies, strategies and plans. Strategizing national health in the 21st century: a handbook. Geneva: World Health Organization 1-39.
  5. Gilmore K, Mora L, Barragues A, Mikkelsen IK. (2015) The universal periodic review: A platform for dialogue, accountability, and change on sexual and reproductive health and rights. Health & Hum. Rts. J 17: 167. [crossref]
  6. Family Planning Organisation of the Philippines and Sexual Reproductive Rights Institute, 2012
  7. (2012) UPR of the Philippines 2nd Cycle 13th Session, Matrix of Recommendations https://www.ohchr.org/EN/HRBodies/UPR/Pages/PHindex.aspx Last accessed 20th February, 2020.
  8. Lloyd, Cristyn 2018, Whatever happened to The Philippines’ reproductive health law.
  9. Population Action International, (2019) Seizing the Moment: How Zambian Sexual and Reproductive Health Advocates are Accelerating Progress on Universal Health Coverage Finanicng.
  10. Ministry of Health, 2011, Presentation of the portfolio health committee from the parliament ofSwaziland, SEAPACOH meeting Kampala, Uganda.
  11. Bacci A, Hodorogea S, Khachatryan H, et al. (2018) What is the quality of the maternal near-miss case reviews in WHO European Region? Cross-sectional study in Armenia, Georgia, Latvia, Republic of Moldova and Uzbekistan. BMJ Open 8: e017696. [crossref]
  12. International Budget Partnership and the International Initiative on Maternal Mortality and Human Rights (2009), THE MISSING LINK Applied budget work as a tool to hold governments accountable for maternal mortality reduction commitments, USA.
  13. John Snow Inc, (2019) News and Stories: Engaging the Private Sector to Improve Reproductive Maternal and Reproductive Health in India.
  14. Murthy RK (2018) New Frontiers in working towards gender equality and child rights? Evaluation of the project.
  15. UPR Submission on the Right to Sexual and Reproductive Health in the Philippines 13th Session of the Universal Periodic Review – Philippines – June 2012.
  16. Population Action International, 2019 UHC Country Level Action, Last accessed 20th February, 2020.
  17. Rubinstein, Adolfo Mariela Barani, Analía S Lopez c2018) Quality first for effective universal health coverage in low-income and middle-income countries 6: e1142-e1143. [crossref]

Mind-Set Based Signage: Applying Mind Genomics to the Shopping Experience

DOI: 10.31038/NRFSJ.2022523

Abstract

The paper presents a new approach to optimizing the shopper experience, combining easy-to-implement tools for understanding shopper mind-sets at the granular, specific level (Mind Genomics; www.BimiLeap.com) with a simple, rapid way which assigns any shopper or prospective shopper to the relevant mind-set for that granular topic (www.PVI360.com). The approach begins with a simple study of the motivating power of relevant messages, and thus uncovers mind-sets or groups of respondents showing similar patterns of what motivates them. Then, using the same data, the approach creates a simple questionnaire comprising six questions taken from the original study, the pattern of answers to which assign a new person to a mind-set. Once the mind-set of the shopper is ‘identified’ for the granular topic using the PVI (personal viewpoint identifier) it is a matter of giving the shopper the appropriate motivating message, either at the time of shopping in brick and mortar store or e-store, or sending the message on the Internet in the form of an advertisement or individualized coupon.

Introduction

The past two decades have seen an explosion of knowledge about the consumer, the knowledge emerging from the speed and affordability of internet-based surveys, the sophisticated analysis of masses of cross-sectional data known as Big Data, and the application of artificial intelligence to uncover patterns. What continues to emerge is that nature is simultaneously tractable and intractable. As the macro level we know what to expect in terms of purchase patterns and expected time to repurchase, some of which knowledge may transfer to the level of the individuals, only for the general pattern just exposed to be disrupted by the idiosyncrasies of each individual.

The world at the time of this writing (Fall, 2022) is quite different from the world of just a decade ago, and most certain far different from the earlier decades. The notion that one could change advertisements is well-accepted, easily and widely done. Outdoor advertisements and LED technology assault us everywhere we go. We are accustomed to see large billboards with attention-grabbing sequences advertisements, the modern day evolution of signage of decades ago, once static, now plastic, and changeable at will. Now technology makes it possible to individualize the messaging for an individual, much as is done on a cell phone. This paper presents one approach.

The organizing nature of this paper is how one might advertise to a single customer, using science to uncover the ‘mind’ of that customer ahead of time. The objective of this study was to understand the different types of messages which might appeal to shoppers of cereal in the middle isle, and shoppers of yogurt in the refrigerated dairy section. Could the technology of 2022 be set up to deliver the proper messages to an individual who is walking along the store and could the approach be set up to be done at scale, affordably, quickly, with scientific precision rather than with guessing about what the person wants based upon who the person is. This latter condition is important. It means that the messages must be delivered to the person most likely to respond to the specific messages.

The studies reported here were done with the intention of testing out the possibility that one could create a knowledge-based system about messaging for simple, conventional, familiar products. The paper does not deal with new to the world products which have their own mystique, and both positive and negative messaging attached. Rather, the paper deals with what one might call ‘tired, old, utterly familiar’ products that may not be susceptible to the romance of the new and different.

A Short Historical Overview to ‘Messaging the Shopper’

The notion that one can influence the shopper by proper messaging is decades old, and the subject of numerous experiments. Indeed, the real-world behaviors of shoppers and the change in behavior resulting from the proper messaging opens up the topic to anyone interested in messaging, whether the interest be theory such as experimental psychology, to applied science such as consumer psychology, and of course the world of business applications. As a consequence, there have been a number of different studies focusing specifically on shopping [1-8].

  1. Schumann et al. (1991) reported only modest effectiveness of signage in shopping cart. To summarize their results: “Findings from both studies reflect that over 60% of the 2 samples… noted the presence of the signs in their carts. When Ss were questioned about their awareness of cart advertising on a specific occasion, only 3.0–6.5% recalled the product. There was no evidence that cart signage acts in a subliminal fashion that results in the purchase of the brand.” It may well be the signage in the cart was general information about the product, not necessarily information that would tug at the heartstrings of the shopper.
  2. Dennis et al. (2012) confirmed the efficacy of digital signage but argued for emotional content. They noted that the typical content of digital signal is ‘information-based’ whereas digital signage might be more effective if it were to comprise emotional messaging as well, or even instead of simple information. Results are limited as the DS (digital signage) screens content was information based, whereas according to LCM, (Limited Capacity Model of Mediate Messaging) people pay more attention to emotion-eliciting communications. The results have practical implications as DS appeals to active shoppers.
  3. Buttner et al., (2013) proposed at two types of shopping orientations (mind-sets), task focused and experiential shopping, respectively. They report that “Activating a mindset that matches the shopping orientation increases the monetary value that consumers assign to a product. …. marketers and retailers will benefit from addressing experiential and task-focused shoppers via the mindsets that underlie their shopping orientation.
  4. Chang and Chen (2015) reported that mind-sets are important, and that the communication should consider the different mind-sets. Their notion was that people may or may not be skeptical to advertising. Those who have a ‘utilitarian orientation’ and an ‘individualistic’ mind-set tend to be skeptical about advertising, and need messages which are different from those individuals who have a ‘hedonic’ and a ‘collectivistic’ mind-set. Chang and Chen bring this topic into discussions about CRM and donating, but their notions can be easily extended to the right type of messaging for digital signage.

The Contribution of Mind Genomics to the Solution

Mind Genomics is an emerging science which grew out of the need to understand how people make decisions about the issues of the ‘everyday’. Mind Genomics rests on the realization that the ‘everyday’ situations are compounds of different stimuli. To study these stimuli requires that the respondent, the test subject, be confronted by compound test stimuli which comprise different aspects of everyday situation, stimuli that the respondent ‘evaluates’, such as rating the combination. Through statistics, applied after the researcher properly sets up the blends, it becomes possible to understand just exactly what features ‘drive’ the rating. Properly executed, this seeming ‘roundabout way’, testing mixtures, ends up dramatically revealing the underlying mind of the respondent. (Gere et al., 2020; Moskowitz et al., 2019).

The foregoing process, testing systematically created mixtures and deconstructing through statistics, stands in striking opposition to the now-hallowed approach of ‘isolate and study.’ The traditional approach requires that the features of the everyday be identified, and separately evaluated, one feature at a time. Typically the evaluation ends up presenting each of the features separately, getting a rating, analyzing the pattern of ratings across people, and then identifying the key variables which a difference.

Attractive as the traditional methods may be, the one-at-a-time is severely flawed for several reasons:

  1. Combinations of features are more natural. It may be that a feature will receive a different score when evaluated alone compared to the evaluation of the feature as part of a mixture. And it may be that the feature will receive different scores when evaluated against backgrounds provided by a variety of other features. Thus, the wrong answer may emerge.
  2. People may change their criterion of judgment when presented with an array of different types of features, such as features dealing with product safety versus features dealing with branding, with benefits, and so forth. All too often the researcher AND the respondent fail to recognize the underlying shifts in these criteria.
  3. It becomes very difficult to ‘game the system’ when the test stimulus comprise a combination. Often, and perhaps even without knowing it, the respondent tries to assign the ‘correct’ or ‘socially appropriate’ answer. Such effort to ‘be right’ is doomed to failure when the respondent is presented with a combination. Often the respondent asks the researcher or interviewer for ‘help’, such as asking ‘what do I pay attention to in this combination?’

Mind Genomics works with the response to combination of text messages, called vignettes. The vignettes comprise specified combinations of elements, viz., verbal messages. Table 1 below (left part of table) shows these messages. The messages are sparse, to the point, paint a word picture. The vignettes are created according to an underlying plan called an experimental design. The experimental design may be thought of as a set of different combinations, different recipes, combining the same messages, the same elements, in different ways.

Table 1: Positive elements for cereal, viz., those elements which drive the rating of a vignette towards definitely buy/probably buy). All elements shown have positive coefficients of +2 or higher.

table 1(1)

table 1(2)

A key difference between Mind Genomics and conventional research is how Mind Genomics considers variability among people and how it deal with that variability. We start the comparison by considering conventional research, which often considers variability in the data to be error, usually unwanted error which masks the ‘signal’. Occasionally the variability can be traced to some clear factor, such as the nature of the respondent, in which case this irritating variation hiding the signal is actually a signal itself. For the most part, however, researchers consider variability to be unwanted, and either suppress it by meticulous control of the test stimulus/situation, or average out the variability by working with a lot of respondents, and assuming that the variability is random, and so will cancel out.

In the world of Mind Genomics variability is considered in a different light. Certainly there is the appreciation of error, but there is also the acceptance of the fact that people differ from each, and that these differences may be important. The differences between people are not necessarily random error, but rather point to potential profound differences among people, albeit differences which exist in a small, granular aspect of daily life. In other words, sometimes the differences are important, and sometimes the differences are merely random noise.

Explicating the Research Process

For the project reported here, the researcher selected two products (cereal, yogurt), asked six questions about the product, questions that could be used to create consumer-relevant messages, and then developed the database of 36 possible consumer messages for each product.

Thus far, the process is quite simple, requiring only that the researcher do a bit of thinking about what types of messages might be relevant to consumers. One of the in-going ‘constraints’ from the perspective of marketing and the trade was that the messages had to be of the type which drive purchase. It was not an issue of building one’s brand through advertising. Rather, the messages were chosen so that they could be put on a coupon, or flashed on an LCD panel as the respondent ‘walked by.’

The actual process of developing the raw materials can be daunting for those who are not professionals. In the two studies reported here, a significant effort was expended to develop the six ideas which tell a ‘product story’. One the six ideas are developed, the most intellectually intense part of the effort, the creation of six messages for each idea becomes much easier. Recently, the creation of these basic ideas (or questions), and the elements (or answers) has been improved by a process called Idea Coach, which provides different options, using artificial intelligence (www.BimiLeap.com). The data reported here were collected before the Idea Coach system was incorporated into Mind Genomics.

  1. The actual selection of messages generated six groups of six message, one set of 36 such messages for cereal (Table 1), and another set of comprising different messages, for yogurt (Table 2).When looking at the table, the reader should keep in mind that the elements either pain a simple word picture, or specify a specific a specific claim that could be turned into ‘copy.’
  2. When creating the messages and assigning them to groups, The only requirement for the researcher is to ensure that all of the messages in a single idea (viz., all the answers given to a single question) remain together. For example, messages about ‘calories’ must all be put into one group or idea, and not split across two groups or questions. The rationale for this requirement comes from the fact that the underlying experimental design will need to combine elements from different questions (described below). When the researcher puts a calorie message in one group, and another calorie messages in a second group, there is the likelihood that the underlying experimental design may put these mutually incompatible messages into the same combination.
  3. Once the elements are created, comprising the question and the six answers, as shown in Tables 1 and 2, the next step is to use the basic experimental design, which specifies 48 combinations, each combination comprising either three or four elements. Each combination or vignette contains at most one element from any question. The vignettes are by design incomplete, since there are six questions, but a vignette can only have three or four answers, one from three or four questions. As noted above, each respondent evaluates a unique set of 48 combinations. The underlying mathematics remains the same. What changes is the assignment of a message to a code. For example, for one person, element A1 may be assigned as A1, whereas for another person a permutation is done, so the former A1 becomes A2, A2 becomes A3, et. the experimental design is maintained, but the combinations change (Gofman & Moskowitz, 2010).
  4. The final steps comprise the introductory message and the rating scale. In Mind Genomics studies most of the judgment must be driven by the individual elements, and not by the introductory statement. It is better to be vague about the product, and let the individual elements drive the reaction, rather than to specify too much in the general introduction. For this study, the introduction was simply ‘Please read this description of cereal and rate it on the 5-point scale below. For yogurt the introductory statement was virtually the same ‘please read this description of yogurt and rate it on the 5-point scale below’
  5. The five-point rating of purchase is anchored: 1=definitely not buy, 2 = probably not buy, might not/might buy, 4= probably buy, 5 = definitely buy. The anchored five point purchase intent scale has been used for many decades in the world of consumer research, both because the scale is sensitive to differences and because managers understand the scale, and generally look at the percentage of responses that are 4 and 5 on the 5-point scale. These two rating scale points are probably buy and definitely buy. The scale is often transformed to a binary scale, as was done here. Ratings of 4 and 5 were transformed to 100. Ratings of 1, 2 and 3 were transformed to 0. Managers who use the data more easily understand a yes/no scale, buy/not buy.
  6. Following the evaluation of 48 vignettes, the respondent completed a short self-profiling questionnaire, providing information about gender and age.
  7. Respondents were sent one of two links, the first appropriate to the cereal study, the second appropriate to yogurt. Approximately 70% of the individuals who were invited ended up participating. The high completion rate can be traced to the professionalism of the on-line research ‘supplier’. As a general point of view, it is almost always better to work with companies specializing in on-line research. Trying to recruit the respondents oneself ends up with a completion rate much low, often lower than 15%.

Table 2: Strong performing elements for cereal, for divisions of respondents into two complementary mind-sets, and then into four complementary mind-sets. All elements shown have positive coefficients of +10 or higher.

table 2

Creating the Database and Analyzing the Data for a Study

Each respondent ended up evaluating 48 different combinations, called vignettes, assigning each vignette a rating on an anchored 5-point scale. The next step creates a ‘model’ or equation showing how each of the 36 elements about the product ‘drives’ purchase intent. Recall that all 48 vignettes of a respondent differed from respondent to respondent, although the mathematical structure was the same. This ‘permutation’ strategy allows the research to cover a large percent of the possible combinations (Gofman & Moskowitz, 2010).

In order to uncover the impact of the elements, the key variables, it is necessary to create an equation relating the presence/absence of the 36 text elements about the product to the rating. This can be easily done. The data are easily analyzed, first by OLS (ordinary least-squares regression) and then by clustering. OLS regression shows how the 36 elements ‘drive’ the response (purchase). Clustering identifies groups of respondents with similar patterns of coefficients groups that we will call ‘mind-sets.’

  1. The OLS regression, applied to either the individual data, or to group data, is expressed by the following: Positive Intent to Purchase = k0 + k1(A1) + k2(A2)… k36(F6).
  2. For regression analysis to work, the dependent variable, the transformed variable (either 0 or 100) must show some small variation across the different 48 ratings for each individual respondent. Often, respondents confine their ratings to one part of the scale (e.g. 1-2; 4-5, etc.). To avoid a ‘crash’ of the OLS regression program, and yet not affect the results in a material way, it is a good idea to add a vanishingly small random number (e.g. around 10-4) to every transformed rating. The random number ensures variation in what will be the dependent variable, but does not affect the magnitude of the coefficients which emerge from the OLS regression.
  3. The underlying experimental design for each individual respondent makes it straightforward to quickly estimate the equation, either for individuals or for groups. The coefficient, whether for individual or for group, shows the degree to the element drives the response the rating of ‘definitely or probably purchase.’ The individual coefficients, viz., for the hundreds of respondents, are typically ‘noisy’, but when the coefficients become stable and reproducible when the corresponding coefficients are averaged across dozens of respondents, or when the equation is estimated from the raw data of dozens of respondents.
  4. The additive constant (k0) shows the estimated proportion of responses that will be 4 or 5 (viz., definitely purchase or probably purchase), in the absence of elements. Of course the underlying experimental design dictated that all 48 vignettes evaluated by any respondent would comprise a maximum of four elements (at most one element from a group) and a minimum of three elements (again, at most one element from a group, not more).
  5. The 36 individual coefficients (A1-F6) represent the contribution of each element to the expected interest in purchasing. When an element is inserted into a vignette, we can estimate its likely contribution by adding together the additive constant and the coefficient for the element. The sum is the percent of the respondents who would assign a rating of 4 or 5 to that newly constructed vignette.
  6. One of the ingoing tenets of Mind Genomics is that there exist groups in the population which think about the same topic, but in different ways. The information to which these respondents react may be the same but these groups use the information in different ways. Some respondents may value the information so that the information appears to covary with their rating of purchase the product. In contrast, other respondents may completely ignore the information. These differences reflect what Mind Genomics calls ‘mind-sets’, viz groups of individuals with clearly defined and different ways of processing the same information.
  7. The mind-sets emerge through the well-accepted statistical analysis called clustering (Likas et al., 2003.) Briefly, the clustering algorithm computes the Pearson correlation between pairs of respondents, based upon their 36 pairs of corresponding coefficients. Respondents with similar patterns (high positive correlation) are assigned to the same mind-set. Respondents with dissimilar patterns (negative or low positive correlations) are assigned to different mind-sets.
  8. For this study the ideal number of mind-sets is as few as possible. The paper reports the results emerging from dividing the respondents into two mind-sets, and then into four mind-sets, to show the effect of making the clustering more granular. The focus will be on interpreting the results from the two mind-set solution, and creating a tool to assign a new person to the one of the two mind-sets.

Applying the Learning – Cereal

Our data with 328 respondents provides us a wealth of information about to say, what not to say, and to whom. Table 1 shows the results for cereal. The table is organized with the key subgroups of respondents across the top and the messages down the side. In order to make the table easier to read, and allow the patterns to emerge, the table only shows positive coefficients of 2 or higher. The other coefficients were estimated, but are not relevant to the presentation since they do not drive positive interest in purchase. Furthermore, Table 1 shows strong performing elements as shaded cells. Strong performing is defined as a coefficient of + 10 or higher. Table 1 is rich in detail. The table shows the results from running the aforementioned linear equation using the data from all respondents (total), then the data by gender, then by age.

    1. The additive constants differ, not by gender nor age. Again and again Mind Genomics studies reveal that for the most part, conventional methods dividing people fail to show dramatic differences in how these divisions generate groups which think differently. It is eternally tempting to divide people by who they are, and presume that because people are different they think differently.
    2. The total panel of 328 respondents shows very few positive elements, and no strong elements. That is, knowing nothing else we cannot find elements which strongly drive purchase intent. Most of the elements are blank, meaning that the coefficients for those elements are either around zero or negative. In effect, ‘doing the experiment,’ viz. evaluating different messages, fails to uncover strong performing elements. No matter what experts might think, there are no apparent ‘magic bullets’ for cereal.
    3. A first effort to divide groups looks at gender. The additive constant is the same, but the females have a few more positive than do the males. Yet, none of the elements are strong drivers purchase when evaluated in the body of a vignette.
    4. The second effort divides the respondents by age. In terms of the additive constant, the younger respondents (ages 18-39) show a slightly higher additive constant than do the older respondents (age 40+; constants of 58 vs 53). The only strong performer (coefficient >1= 10) is S4 for the younger respondents: The same great taste of cereal… only better.

The third effort divides the full set of respondents into exactly two mind-set and then into exactly four mind-sets using k-means clustering (Likas et al., 2003). To save space and make it easier for patterns to emerge, Table 2 shows the only those elements which perform strongly in at least one mind-set of the six created (two mind-sets + four mind-sets = six mind-sets). ‘Performing strongly’ is again operationally defined as a coefficient of +10 or higher. The groups with fewer strong performing elements will be harder to reach.

      1. Focusing just on the two mind-set solution, Mind-Set 2 is more primed than Mind-Set to be interested in buying the cereal (additive constant of 68 for Mind-Set 2, additive constant of 38 for Mind-Set 1). However, Mind-Set 1 shows two elements which excite its members:

O2: A tasty breakfast choice makes it easy to maintain a healthy body weight

O4: Ideal choice for those concerned about eating too much sugar

Applying the Learning – Yogurt

Our second study, this time with 307 respondents, shows similar patterns. Table 3 shows the data for the total panel, gender, and age. Table 4 shows the strong performing elements for the mind-sets, viz., those with coefficients of +10 or higher.

      1. The total panel again does not show strong performing elements (coefficient >= +10).
      2. The additive constants differ dramatically by gender. Recall that the additive constant is the basic level of purchase intent estimated in the absence of elements. Males shows a higher basic intent, females show a lower basic interest (74 vs 54). This is a dramatic difference.
      3. Closer inspection of Table 3 reveals that the coefficients for the males are around 0 or lower whereas there are a number of coefficients for females which are moderately positive. Males have a basic higher acceptance, but do not show any strong performing elements. In contrast, females show the lower basic acceptance, but are more selective. The two elements which drive their purchase intent are:

F4: So flavorful… it will satisfy your sweet taste

F5: Made with natural flavoring

        1. The second effort divides the respondents by age. In terms of the additive constant, the younger respondents (ages 18-39) show a lower additive constant, the older respondents show a higher additive constant (50 vs 62).

The younger respondents find five elements to drive purchase:

E6                    Great taste with none of the guilt 

F4                    So flavorful… it will satisfy your sweet taste

O3                    A refreshing healthy snack the whole family love

C1                    Ready to eat when you are

F6                    Flavor which sweetens

In contrast, the older respondents find only one element to drive purchase.

F5                    Made with natural flavoring

          1. The results emerging from clustering show the two mind-sets (MS1 of 2, MS2 of 2) to have dramatically different additive constants (39 for MS1 of 2; 72 for MS2 of 2). Mind-Set 2 is prepared to purchase, even without messaging, whereas Mind-Set 1 must be convinced. Fortunately, eight of the 36 elements for yogurt perform strongly, two performing quite strongly (F4, F5):

F5:            Made with natural flavoring

F4:            So flavorful… it will satisfy your sweet taste

C2:            Comes in snack size…great for packed lunches

B2:            Less sugar, less calories

C5:            A hassle free healthy snack – goes where you go

B4:            It’s good because IT’S REAL

C1:            Ready to eat when you are

F2:            Uses flavors to sweeten for a healthier you

Table 3: Positive elements for yogurt, viz., those elements which drive the rating of a vignette towards definitely buy/probably buy). All elements shown have positive coefficients of +2 or higher.

table 3(1)

table 3(2)

Table 4: Strong performing elements for yogurt, for divisions of respondents into two complementary mind-sets, and then into four complementary mind-sets. All elements shown have positive coefficients of +10 or higher.

table 4

Part 2– Messaging the Shopper

One thing we learn from Tables 1 and 3 versus Tables 2 and 4 is that when we look for a strong message for the total panel, we will not find any strong message for Total Panel, for either food. Tables 2 and 4 tell us that when we divide the shoppers in two mind-sets, the one mind-set for each food is ready to buy the food, whereas the other, complementary mind-set can be persuaded to buy, but only when the correct messages are ‘beamed’ to this second group of shoppers. It is to the task of finding this group of shoppers and then sending them the correct messages in the store to which the paper now turns.

One of the perplexing problems of knowing mind-sets is the difficulty of assigning a random individual to a mind-set. The reason is simple, but profound. The mind-sets emerge out of the granularity of experience, and are based on the response of people to small, almost irrelevant pieces of communication. We are not talking about issues which are critical to the shopper, issues such as health, income, and so forth, and the decisions one makes about them. Those topics are sufficiently important to people to merit studies by academics and by interested professionals. A great deal of money is spent defining the preferences of a person, so that the sales effort can be successful. Not so with topics like cereal and yogurt, where there is knowledge, but little in the way of knowing the preferences of a particular shopper. Companies which manufacturer cereal and yogurt ‘know’ what to say, but the revenue to be made by knowing the preferences a randomly selected individual is too little to warrant deep investment.

To understand the preferences of a randomly selected individual may require one of two things. The first is extensive information about that individual, and a way to link that knowledge to one’s preference about what to say about cereal or about yogurt. That exercise could happen, at least for demonstration purposes, although it does not lend itself to being scaled, at least with today’s technology. Another way is to present the person, our shopper, with the right messages for that shopper. This latter approach requires a way to identify the shopper, and to assign the shopper to the proper mind-set, with low investment, in a way that can be done almost automatically. This second approach has to reckon with practicalities, such as the reluctance of the shopper to provide personal information, the potential disruption of the knowledge-gathering step to the shopping experience, and of course the need to find the appropriate motivation. The proposed process has to be simple, quick, easy to implement. Most of all, the process should motivate the shopper to participate.

The answer to the question of ‘how to assign a shopper to a mind-set’ comes from the use of a simple questionnaire called the PVI (personal viewpoint identifier; Gere et al., 2020; Moskowitz et al., 2019.) The PVI uses the data from the Tables 2 and 4, to create a set of six questions having two answers (no/yes; not for me/for me, etc.) The questions come from the 16 elements, and are chosen to best differentiate between the two (or among the three) mind-sets. The important thing to keep in mind is that the PVI emerges directly from reanalysis of the data used to create the mind-sets. It will be the pattern of answers to the PVI which will assign a person to one of the mind-sets. With two products, and thus 12 questions, the PVI ‘step’ should take about a minute. The motivation might be lowered price for participants for some products, such as cereal and yogurt.

Figure 1 show the PVI, completed by the shopper at the start of the shopping effort or even ahead of visiting the store. Figure 2 shows a screen shot of the database, in which each shopper who participated is assigned to one of the two mind-sets for cereal, and one of the two mind-sets for yogurt.

fig 1(1)

fig 1(2)

Figure 1: The PVI (personal viewpoint identifier) for the cereal and yogurt, completed before the shopper begins, or completed at home. The website used to acquire the information is: https://www.pvi360.com/TypingToolPage.aspx?projectid=2317&userid=2

fig 2

Figure 2: Example of a database attached to the PVI which records the mind-set to which the respondent belongs and the recommended types of messages for that mind-set.

Here is a sequence of four proposed steps to test the approach.

          1. At the start of the shopping the individual could be invited to participate, by completing a short questionnaire on a computer, the PVI tool shown in Figure 1. The incentive could a special ‘participant’s pricing’ for the cereal or the yogurt. The objective is to get the shopper to participate, discover the shopper’s membership in a mind-set (in return for the promise of a lower price), and have the shopper interact, with the program assigning the shopper to the correct mind-set for one or several products. The opportunity further remains to engage the shoppers off-line, ‘type’ their preferences for dozens of products, and place ‘intelligent’ signage with the proper message for the two or three mind-sets emerging for each product. Thus the data would be granular, by person, and by product..
          2. Once the data has been acquired and put into the database, the shopper should be furnished a device linked to the database, with the shelf location linked both to the database, and to the shopper’s portable device.
          3. When the shopper reaches the appropriate store location, an ad for the product should be flashed on to the screen of the device, the ad possibly paid for by a vendor of yogurt or cereal. The ad should be the name of the vendor, the product type, and the appropriate message for the shopper, based upon the shopper’s assignment to the mind-set.
          4. The performance of the system can be measured by comparing the purchases of cereals and/or yogurt, comparing those who participated versus those who did not.

Selecting the Specific Messages to Show to the Shopper

Up to now we have focused on the science of the effort, figuring out the existence of mind-sets, the messages about cereal and yogurt to which they are most responsive, and then the creation of a simple tool, the PVI, to assign a person to a mind-set. We now face the most important task, selecting the messages that will be flashed to the shopper at the right time (e.g., when the shopper is passing the specific product, and the objective is to get the shopper to select the product).

Keep in mind that up to now the effort to learn about the mind-set of the shopper has been brand-agnostic. That is, the objective has been to identify what messages differentiate the two kinds of cereal shoppers and the two kinds of yogurt shopper. In the real world, it is necessary to drive the shopper towards the appropriate brand, using the appropriate message.

If we remain with two mind-sets, and concentrate on shopping, we need not worry about Mind-Set 2. Mind-Set 2 for cereal has an additive constant of 68. They are ready to buy. They should be directed to the ‘brand’. It is Mind-Set 1 which must be convinced, since Mind-Set 1 has an additive constant of 38. They need motivating messages. Here are the two strongest messages for Mind-Set 1

O2 A tasty breakfast choice makes it easy to maintain a healthy body weight        15

O4 Ideal choice for those concerned about eating too much sugar                     10

The same dynamics hold for yogurt. The additive constant is 72 for Mind-Set2, and 39 for Mind-Set 1. Mind-Set 2 is already primed to buy yogurt, and again should be directed to the ‘brand’. Mind-Set 1 with a low additive constant of 39 needs motivating messages, along with the brand. They have eight messages which score well in expected motivating power, and of those eight, three which score very well with coefficients 14 or higher.

F5 Made with natural flavoring                    17

F4 So flavorful… it will satisfy your sweet taste          16

C2 Comes in snack size…great for packed lunches            14

B2 Less sugar, less calories                          12

C5 A hassle free healthy snack – goes where you go        12

B4 It’s good because IT’S REAL             11

C1 Ready to eat when you are           11

F2 Uses flavors to sweeten for a healthier you                   10

Discussion and Conclusions

One need only read the trade magazines about the world of retail to recognize that the world is becoming increasing aware of the potential of ‘knowledge’ to make a difference to growth and to profits. Over the past half century, knowledge of the consumer has burgeoned in all areas of business, with the knowledge often making the difference between failure and success, or more commonly today, the magnitude of success.

We are no longer living in a business world dominated by the opinions of one person in the management of a consumer-facing effort. Whereas decades ago it was common for the key executives to proclaim that they had a ‘golden tongue’ which could predict consumer behavior, today just the opposite occurs. Managers are afraid to decide without the support of consumer researchers, or as they title themselves, ‘insights professionals.’

At the level of shopping, especially when one buys something, ore even searches for something, there are programs which ‘follow’ the individual, selling the data to interested parities who use that information to offer their own version of that for which the individual was shopping. The tracking can be demonstrated by filling out a form or a product or service, not necessarily buying such a product. The outcome is a barrage of advertisements on the web for that product, from a few different vendors offering their special version.

The Mind Genomics approach presented here differs from the current micro-segmentation on the basis of previous behaviors demonstrated on the internet. Rather than watching what a person does to put the person into a specific grouping, or rather than applying artificial intelligence to the text material produced by the person, Mind Genomics moves immediately to granularity. The basic science of the topic (viz., messages for cereal, or messages for yogurt) is established at a convenient time, using language that the product manufacturer selects as appropriate for a customer. The important phrases and the relevant mind-sets are developed inexpensively, and rapidly, perhaps within a day. The PVI is part of that set-up. The next steps involve the shopper herself or himself. What emerges is a system wherein the shopper plays a simple but active role, and through a few keystrokes identifies the relevant group(s) to which she or he belongs. Once the shopper encounters the appropriate location, it is only a matter of sending the shopper the appropriate message. The ‘appropriate location’ can be the store shelf where the product is displayed, or on the web at an e-store, or even when the prospective shopper searches for the item. Both the item and the relevant motivating messages can be sent to the shopper, as long as the shopper’s membership in the appropriate mind-set can be determined.

References

        1. Büttner OB, Florack A, Göritz AS (2013) Shopping orientation and mindsets: How motivation influences consumer information processing during shopping. Psychology & Marketing 30: 779-793.
        2. Chang CT, Cheng ZH (2015) Tugging on heartstrings: shopping orientation, mindset, and consumer responses to cause-related marketing. Journal of Business Ethics 127: 337-350.
        3. Dennis C, Michon R, Brakus JJ, Newman A, Alamanos E (2012) New insights into the impact of digital signage as a retail atmospheric tool. Journal of Consumer Behaviour 11: 454-466.
        4. Gere A, Harizi A, Bellissimo N, Roberts D, Moskowitz H (2020) Creating a mind genomics wiki for non-meat analogs. Sustainability 12: 5352.
        5. Gofman A, Moskowitz H (2010) Isomorphic permuted experimental designs and their application in conjoint analysis. Journal of Sensory Studies 25: 127-145.
        6. Likas A, Vlassis N, Verbeek JJ (2003) The global k-means clustering algorithm. Pattern recognition 36: 451-461.
        7. Moskowitz H, Gere A, Moskowitz D, Sherman R, Deitel Y (2019) Imbuing the supply chain with the customer’s mind: today’s reality, tomorrow’s opportunity. Edelweiss Applied Sci Tech 3: 44-51.
        8. Schumann DW, Grayson J, Ault J, Hargrove K (1991) The effectiveness of shopping cart signage: Perceptual measures tell a different story. Journal of Advertising Research 31: 17-22.

Factors Affecting the Attitude of Students towards TVET Education in Bedesa Town, Western Harerge Zone, Oromia Regional State

DOI: 10.31038/PSYJ.2022445

Abstract

The general objective of this study were to assess factors which impact Student’s attitude towards Technical and Vocational Education and Training of Bedesa Town, Oromia regional state, Ethiopia. To this end, Descriptive survey research design was employed in carrying out this study. The target population for this study consisted of 175 students, 25 teachers and 1 Dean of TVET College and in total 201 in the selected TVET college of Bedesa town. 134 samples were taken from 201 targeted populations. 71 male and 63 female respondents were selected through using stratified random sampling technique. The required data were collected through questionnaire. Descriptive and inferential statistics were used to analyze the quantitative data that have been collected through close ended questionnaires. The findings of the study revealed that 48.6% of the variation in the attitude of students towards TVET education can be explained by changes in Socioeconomic factors, parental influence, quality of technical and vocational education and training education and peer influence whereas 51.4% were unexplained variables that affect the attitude of students towards TVET education. The study therefore concludes that that ‘Socioeconomic factors, Parental influence, Quality of TVET education and Peer influence’ were the stronger predictor of attitude of students towards TVET education sequentially. It is recommended that government, head of TVET and TVET board members should arrange and provide a serious campaign on the importance of TVET in the development of the country, financial, material and human resources should be provided to strengthen and enhance the quality of education imparted at TVET institutions, guidance and counselling services should be strengthen in larger community to influence their children towards TVET education.

Keywords

Attitude, Factor, TVET, Vocational education

Introduction

One of the most important responsibilities in any education system is to train skilled and specialized staff of various sections of society. It can be done through learning areas such as technical education and employment and training. Technical education and vocational training play a vital role in the development of society. Technical and vocational skills are essential tools for economic development. Well educated and well trained people are essential to the acquisition, use, construction and dissemination of knowledge and skills that enhance productivity and economic growth. TVET are now increasingly important on the global and national policy agenda. UNESCO, for example, promotes TVET, claiming that technology education driven by market demand is very effective in improving employment and income for the disadvantaged. Therefore, all developing and developed countries place a high priority on this problem and strive to equip its producers with complementary science and technology in various fields such as agriculture, industry and services [1,2].

According to Ozioma (2011) believes, technical training and job training is to prepare students for specific skills, occupation, industry, agriculture, business to gain self-confidence and is generally linked to practical and manual skills and often excludes scientific skills. Billet (2011), Azeem and Omar (2019) also define TVET as a formal, informal and non formal study that provides young people with the necessary knowledge and skills in the world of work. As one of the developing countries in the world, with 33% of its population living on less than $ 1.25 a day, the Ethiopian Government (GoE) also needs the TVET program to participate in its active participation, in a global competitive market economy that requires technical and technical citizens who are trained in learning ability and get into a particular profession. Ethiopia’s TVET strategy proves that TVET programs seek to create capable and confident citizens to contribute to global economic development, thereby improving the quality of life of all Ethiopians and further reducing poverty [3-8].

The National TVET Qualification Framework (NTQF) also emphasizes the TVET program to be self-sufficient and self-sufficient, driven by demand and results-based, and appropriate to address the needs of Ethiopia’s sustainable economic development [9]. The level of skills and jobs of the country is critical to the transformation and productivity of its workforce. Skilled workers and professionals improve the quality and efficiency of production and maintenance and direct and train employees with minimal skills. This can be achieved by making crafts into education.

On the other hand, Ali (2013) in his study of determining the reluctance of female students to continue studying in vocational schools cited individual, family, economic, social, and cultural factors. Ozioma (2011) investigated whether the socioeconomic status of parents, gender and the lack of career counselors at school influenced students’ choice in terms of Technical and Vocational Education. Ohiwerei and Nwosu (2009) found that the country’s political and economic situation, high paying work and peer pressure were factors that influenced students’ attitudes towards Technical Education and Vocational Education. The result of equality in Technical and Vocational Education with general education, social status and content use are key factors in attracting students. This study will be fully utilized to understand the factors that influence students’ attitudes towards Technical Education and Vocational Education and to further develop policies to address this issue [10,11].

Statement of the Problem

Technical and vocational skills are essential tools for economic development. Well educated and well trained people are essential to the acquisition, use, construction and dissemination of knowledge and skills that enhance productivity and economic growth. Globally, governments and other stakeholders expect TVET to address a number of development and economic priorities, from poverty reduction, food security and social cohesion to economic growth and competitiveness. It also plays an important role in education programs around the world. In developed countries such as Australia, Germany, Great Britain, and South Korea, TVET is the key to economic prosperity and in developing countries TVET is seen as the key to economic independence [12,13].

Unemployment remains a very important issue that needs to be addressed, in many countries around the world including Ethiopia. In addition, it poses a significant challenge to economic development. TVET plays a key role in reducing unemployment, as its aim is to provide trained staff in the various fields covered, to provide technical knowledge and technical skills and competencies. However, the enrollment rate and graduation rate in technical and technical institutions will be lower day by day leading to a decline in well trained staff (ICBEM, 2015) According to the report many young people currently graduating from the official TVET programs are unemployed. Young people are interested in white collar work and feel embarrassed at work, related to working or working in factories. In Ethiopia, as in many African countries, TVET suffers from a negative public image. TVET is often associated with low employment, low wages and a lack of self-development opportunities, in part due to the low level of previous TVET programs that did not permit TVET graduates to successfully struggle in the labor market. TVET is seen as a place of counseling for those students who have failed to enter higher education [14].

To assess the attitudes of students and parents towards TVET education, various studies were conducted in Ethiopia and abroad. For example, a study by Tsehay (2014) shows that student’s attitude toward technical and skills education is not good. As the study states students were more interested in attending the preparatory program than in technical and vocational education. Nursiah et al. (2020) claimed that enrolment in Malaysia’s technical and vocational education and training programme has remained low since the implementation of TVET education. Similarly, in Nigeria, Akanbi (2017) announced that there was less than three per cent of overall enrolment in technical and vocational education programs as of 2016. In contrast to the above study, according to the (Esrael 2018) study, students perceive that TVET provides quality education; TVET training provides access to current resources and teacher skills. However, it was not clear to students whether TVET was enable technical and vocational students to pursue university studies over time. Choosing TVET is perceived as limiting one’s educational attainment, which in turn reduces lifetime upward mobility [15-18].

Even though efforts have been made by those researchers to identify the attitudes of students towards TVET education, as well as the enrolment rate in TVET education; it was limited to assessing student’s attitude towards TVET education. Therefore, the gap in both studies was that they did not take into account the factors that contributed to the negative attitudes of the students. Those studies focus on investigating the student’s status only in relation to TVET. Besides there is no any research conducted in the study area with the same topic. Therefore, in order to fill those research gaps, this study was assess and found out those factors that affect the student’s attitude towards TVET education in the town of Bedesa, Western Harerge Zone, Ethiopia.

Objectives of the Study

The general objective of this study were to assess factors which impact Student’s attitude towards Technical and Vocational Education and Training of Bedesa town. The specific objectives of the study were intended to:

  1. Determine the impacts of quality of TVET education on the attitude of students towards TVET education.
  2. Determine the impacts of parents influence on the attitude of students on the study of TVET education.
  3. Determine the impacts of socioeconomic influence on the attitude of students towards TVET education.
  4. Determine the impacts of peer influence on the attitude of students towards TVET education.

Literature Review

Factors that Affect Students Attitudes towards TVET

Various scholars such as Igbinedion and Ojeaga (2011) identified some of the major causes of low student participation in technical and vocational education including, among other things, the low social ratio of technical and vocational education such as basic education, basic education, to people of; low intelligent quotient, low achievement and sedation and lack of job awareness. Igbinedion and Ojeaga (2011) [19], explained that, some of the factors affecting student participation in TVE in Nigeria include; a negative public opinion; poor entry level; a negative attitude towards society; lack of recognition; discrimination against TVET graduates and elitism.

In addition, academics and various international organizations have reported similar issues affecting student participation in general education and technical education in particular. However, in Africa, the Caribbean and South Asia factors affecting student participation in TVET programs include: parental views on the costs / benefits of educating girls (this mainly affects low-income families in particular); ancestry (practices of separation of women and premature marriage); discriminatory practices in labor markets; TVET masculinity portrayed in textbooks, media and popular thinking; substandard facilities, including teacher provision, teacher quality and equipment; the nature of TVET activities that are not easily linked to child rearing and child care; lack of role models and career counseling aspects of community functioning within and outside the classroom; shortage of TVET female teachers and lack of role models; TVET gender bias curriculum; misconceptions made about male TVET teachers; peer pressure; first marriage; girls’ privacy; as well as location, physical properties and hours of instruction; direct costs; the need for women to care for their siblings, houses and farms. Factors affecting woman’s participation in vocational education programs according to Ayonmike (2010); Igbinedion and Ojeaga (2011) are negative perceptions in society, poor entry rates, invisibility and discrimination against graduates of technology education (TVE). Several researchers (see Azeem and Omar, 2019; Cheong and Lee, 2016; Dania et al., 2014) also contributed to the investigation of factors contributing to student participation in TVET and provided outstanding findings with critical views. Investigators have established issues related to student enrollment under TVET including job losses, discrimination against TVET graduates, dislike of the government for TVET, student dissatisfaction, lack of resources / infrastructure, and adequate job counseling [20-22].

Quality of TVET Educations

Quality can be described as standards of something as compared to other things that is the degree of Excellence. Good quality education is very necessary in the total development of the student, which ensures proper development, job prospects and the realization of academic goals and objectives. Quality technical and vocational education training refers to input and output of the program, the expressions of standard by which certain goals can be achieved. There are varied factors contributes for realization of quality of technical and vocational education in colleges. Some of them are qualified TVET teachers or trainers, and TVET infra structures.

Qualified TVET Trainers

One of the important principles used to define the quality of a TVET program is related to the preparation of adequately trained teachers and other professionals who shoulder the responsibility of preparing students with quality marketable skills for the dynamically changing world of work. According to this principle, quality TVET programs are distinguished by having a highly trained, experienced, technically competent, and enthusiastic staff including the coordinators, teachers, counselors, and all others who assist them in the instructional process [23]. TVET’s strategic documents acknowledge that the shortage of teachers / educators is one of the barriers to the expansion of TVET in Ethiopia. Due to the low profile of this work, the quality of TVET’s teaching dam is poor. The obstacle to the provision of TVET educators is particularly severe at the higher levels of TVET. Currently identifying and training TVET instructors is done through the following program. Students who complete TVET Level 4 and are tested have the opportunity to receive additional teaching training. After receiving this training, they are ready to teach TVET level 1 and 2. Such instructors are called C level instructors. After graduating as a Level C coach, a person can move on to specialized teacher training institutions for 3 to 4 years to become a B level trainer. The highest level of Teacher is A, and these teachers are ready to teach at any level. Clearly, exploring the issues here should be part of a comprehensive strategy to improve TVET education in Ethiopia [24].

The TVET program in Ethiopia is currently expanding rapidly. The government believes that low productivity is currently due to a skills gap, and that if left unchecked, the industry will provide less training than is fair to the public. Therefore, public vocational training is seen by the government as a means of closing the skills gap. Ethiopian government views community TVET as key to improving business productivity and increasing their competitiveness in the global market. Government involvement is more than just the provision of TVET. The Department of Education conducts moderate examinations at the end of primary school, and the scores on this test determine whether a student is continuing with preparatory school or being placed on a TVET track. This is a national test and determines what level of TVET a person can join. In this regard, the TVET program in Ethiopia is actually driven by mandate, even though the government recognizes the importance of ensuring that the program is flexible and responsive to the needs of the industry. In general highly competent, qualified, motivated, flexible and creative TVET teachers and instructors are the backbone of any TVET system, capable of adjusting to changing technological environments and creating conducive learning environments for different target groups.

TVET Infrastructure

Physical facilities are important for the proper functioning of training institutions. A functional as well as pleasant working environment may contribute a great deal to training. Thus, considerable thought should go into the planning and construction of physical facilities in order to create the appropriate environment. Among the important elements of these facilities are lecture rooms with good lighting and acoustics; classrooms designed for the particular function they will serve; small rooms for study groups and seminar work; space for individual work, e.g. study cubicle, best placed in library; well-organized library facilities conducive to individual research work and study; conference room; staff rooms; and of course, well-planned and equipped workshop facilities. The creation of appropriate physical facilities is not just a matter of providing the necessary funds and materials. They should be planned and designed by experienced specialized architects in conjunction with teacher educators in order to best serve the education process.

The goal of TVET is to improve practical skills for students, and acquiring the right building, design and maintenance skills requires efficient infrastructure and equipment to ensure effective, efficient and sustainable skills that can be employed by students. Conversely, the lack of such institutions can affect the enrollment of students in employment institutions. For example, the lack of infrastructure continued to affect the full potential of TVET in South Africa (Powell and Mcgrath, 2013), Nigeria (Ogbuanya, 2014), Bangladesh (Alam and Forhad, 2020), Chile (Rojas et al., 2019) and Kenya (Reuben et al., 2020). In addition, inadequate educational institutions, teaching and learning services, inconsistencies in curriculum compliance to meet business needs and a lack of industrial integration lead to lower enrollment. Therefore as we can understand from the above literature infrastructure of the technical and vocational education and training have impacts on students towards choosing TVET educations [25-29].

Socioeconomic Factors

As mentioned in another study in Papua New Guinea (PNG), integrated educational or TVET courses are required to be used or considered at the high school level. The students’ approach will improve further learning and training, as well as in the workplace and in improving their social life in Papua New Guinea. Communities and cultures can influence people’s choices and circumstances. In Nigeria, their people mostly choose a job because of their social status and status in their community and want to satisfy their friends and colleagues under the mines for their academic qualifications. People often view vocational and technical education as disabilities, school dropouts and undergraduate students. The issue of apprenticeships can be even worse in a country if there is a community that affects the community. The lower social groups have less confidence in TVET programs. This is because they themselves have always seen themselves at the lower level of social management, and therefore do not believe that TVET programs can help improve their job prospects than at a higher social level [30,31].

Parental Factor

The findings of the Ayub (2017) study indicate that parental influence is statistically significant and influences students’ decision regarding TVET choice. Bukantaite et al. (2006) investigated in their study that 77.9 percent of fourth-grade students responded that their desire to “learn anywhere” contributed to special choices. This figure can be explained by the fact that these students have failed to enter universities or colleges and have chosen vocational schools so that they do not spend a year. TVET students excel in their own decisions in education and especially strongly follow the decisions of their peers; this is because parents and their families have to fight for the resources needed to make the right educational decisions for their children. Most previous research has also found that parents’ attitudes toward technical and vocational education are strongly influenced by student choice. Most of the research findings have shown that student approach to TVET is influenced by their guardians. The majority of responding parents have a low level of economic, educational and social background [32-34].

A Peer Factor

In addition to parents, peers also influence student behavior in daily life as they are second only to parents in close association with students. In Ghana; another study found that generally no negative perception was attached to skills training as a separate occupation of student education. The results showed that concern for student program staff has a significant effect on enrollment, better communication with teaching high school colleagues and encouraging colleagues to interact with students in the area, could help increase enrollment. The study has stated, “Local institutions should emerge as friendly places with many opportunities to meet young people, and should also attend certain social events to help deal with change. To end the divisions of the elders, they may be tempted to make new friends.

Research Methods

Design

Descriptive survey research design was employed in carrying out this study to assess and understand the factors that affect the attitudes of students towards TVET education in Bedesa town because this method helps to describe the characteristics of objects, people, group or environment.

Population, Sample Size and Sampling Technique

The target population for this study consisted of 175 students, 25 teachers and 1 Dean of TVET College and in total 201 in the selected TVET college of Bedesa town. 134 samples were taken from 201 targeted populations. 71 male and 63 female respondents were selected through using stratified random sampling technique because firstly, there were different subdivisions in the targeted population which are important to be considered. Secondly, there were also variations in population sizes of different strata in this case (occupation, and sex). Moreover, the researcher used systematic random sampling to take the sample that has already been identified through stratification.

Instruments of Data Collection

A three-section questionnaire was used to collect relevant data. Section-I consisted of information about demographic data; section-II consisted of Factors affecting the attitude of students towards TVET education; section-III consisted of items focusing on attitude of students towards TVET education.

The tool was developed on five-point Likert scales ranging between strongly agree (5) to strongly disagree (1). It contains 20 items. Those items are divided into each construct of factors affecting the attitude of students towards TVET education in which for Quality of TVET education 5 items, for Parental influence 5 items, for Socioeconomic influence 6 items and 4 of them for Peer influence. The last instrument was the attitude of students towards TVET education, which consists of 10 items and it has five point likert scales from strongly agree to strongly disagree. A pilot study was conducted on 32 individuals (18 males and 14 females) who represented the population character but not the sample to check the reliability and validity of the items by using Cronbach Alpha and experts respectively. Accordingly, the researcher was able to decide the characteristics of the questionnaire that needed to be adjusted or remained or to be changed in some technical words or phrases that seemed to be technical for these respondents. The reliability of the questionnaire was, therefore calculated as 0.80, and 0.83 for the 2nd, and 3rd sections of the questionnaire which were highly reliable respectively. Therefore, it was safe to use them with a little modification. The validity was tested by expert and well-experienced teachers over the area. The questionnaire was administered on face to face basis so that the distributed questionnaires were collected from these respondents after they were completed filling them.

Data Analysis

For proper understanding and evaluating of the purpose of the research questions raised and to ultimately achieve the research objectives, different techniques of data analysis were employed. The researcher used descriptive statistics (percentages and frequency) to describe the characteristics of the respondents. Furthermore, inferential statistics (Multiple Regression) were used to show and determine the effects of influencing factors on the attitude of students towards TVET education. This result was statistically significant at α = 0.05 level.

Results

This chapter has two parts: the first part deals with the characteristics of the respondents; and the second part presents the analysis and interpretation of the main idea in the body. To this end, quantitative data were gathered through questionnaire. The data gathered through. Questionnaire was distributed to 134 respondents out of which 130 (97%) copies were returned back. The respective quantitative data were analyzed quantitatively using descriptive and inferential statistics.

Respondents Characteristics

Under these sub-topics, respondents’ characteristics by sex, age and level of education were critically described (Tables 1-4).

Table 1: Respondents’ Demographic Characteristics by Sex

Sex

Frequency

Percent


Valid

Male

68

52.3

Female

62

47.7

Total

130

100

As the Table 1 shows, the majorities (68, 52.3%) of the total sampled respondents were males whereas the rest (62, 47.7%) of them were females. From this, one can imply that there was no a big gap of sex disparities among respondents in these selected samples under the study.

Table 2: Respondents’ Demographic Characteristics by Age

Age in years

Frequency

Percent


Valid

15-20

34

26.1

20-25

61

47

25-30

35

26.9

Above 30

Total

130

100.0

As it can be seen from table 2, the majorities, 61 (47%) of the respondents were between 20-25 years old; 35 (26.9 %) of them were between 25-30 years old; 34 (26.1%) of them were found between 15-20 years old. This indicates that almost the sampled respondents were young peoples who can be the resources for any educational systems.

Table 3: Respondents’ Demographic Characteristics by Level of Education

 Age in years

Frequency

Percent


Valid

TVET education

114

87.7

First Degree

15

11.5

Master’s Degree

1

0.8

Total

130

100.0

As it can be seen from Table 3, the majorities (114, 87.7%) of the respondents were holder of TVET education; (11.5%) of them were first degree holders; (0.8%) of them were Master’s Degree holders.

Table 4: Respondents’ Demographic Characteristics by Occupation

Age in years

Frequency

Percent


Valid

Student

81

62.3

Teacher

16

12.3

Employee

18

13.9

Unemployed

15

11.5

Total

130

100.0

As it can be seen from Table 4, the majorities, 81 (62.3%) of the respondents were student; 18 (13.9 %) of them were employee; 16 (12.3%) of them were teachers and the rest 15 (11.5%) of them were unemployed.

Factors Affecting the Attitude of Students toward TVET Education

These parts of the data analyses were mainly dealing with those independent variables (quality of TVET education, parental influence, socioeconomic factors and peer influence) that have been contributing to affect the attitude of students on the study of TVET education under the study area. Therefore, the researcher tried to organize, present, analyze and interpret quantitative data that he collected through questionnaire as follows.

Impacts of Quality of TVET Education, Parental Influence, Socioeconomic Factors and Peer Influence on the Attitude of Students on the Study of TVET Education

To determine the impact, regression analysis were conducted. A multiple-linear regression model of the form Y= β0+β1X1+β2X2+β3X3 + β4X4 was used to determine the effect of the independent variables on dependent variable. In this model β0 was a constant, while β1, β2, β3 and β4 are regression coefficients and X1, X2, X3 and X4 are quality of TVET education, parental influence, socioeconomic factors and peer influence respectively. The results of the model are shown in Table 5.

Table 5: Multiple Regression Model Summary (ni = 130, p <0.05)

Model Summaryb

Model

R

R Square

Adjusted R Square

Std. Error of the Estimate

1

697a

.486

.525

4.289

aPredictors: (Constant), Socioeconomic factors, Parental influence, Quality of TVET education and Peer influence
bDependent Variable: Attitude of student towards TVET education

The R square value of .486 shown in the above Table 5 indicates that 48.6% (R2*100%) of the variation in the attitude of students towards TVET education can be explained by changes in Socioeconomic factors, Parental influence, Quality of TVET education and Peer influence whereas 51.4% (1- R2)*100% were unexplained variables that affect the attitude of students towards TVET education.

As it is indicated in Table 6, the independent variable ‘socio economic factors’ has the strong impact (β=.137) on the dependent variable ‘Attitude of students towards TVET education’, and this is statistically significant (the column ‘Sig.’ indicates that the level of significance, at 0.002); the independent variable ‘parental influence’ has strong impact (β=.135) on the dependent variable ‘Attitude of students towards TVET education’ and this is statistically significant (the column ‘Sig.’ indicates that the level of significance, at 0.003); the independent variable ‘Quality of TVET education’ has a positive predictive power (β=.063) on the dependent variable ‘Attitude of students towards TVET education’, and this is statistically significant (the column ‘Sig.’ indicates that the level of significance, at 0.007); the independent variable ‘peer influence’ has positive impact (β=.050) on the dependent variable ‘Attitude of students towards TVET education’, and this is statistically significant (the column ‘Sig.’ indicates that the level of significance, at 0.000).

Table 6: Multiple Regression Coefficients

Model 1

USC

SC

t

Sig.

B

SE

Beta

(Constant)

22.006

2.618

 8.405

.000

Socioeconomic factor

.144

.056

.137

2.533

.002

Parental influence

.143

.057

.135

2.509

.003

Quality of TVET education

.069

.059

.063

2.175

.007

Peer influence

.067

.072

.050

4.928

.000

a. Dependent Variable: Attitude of student towards TVET education

Even-though all independent variables have a statistically significant impact on the dependent variable, the beta weighting of the independent variable ‘socio economic factors’ (β=.137) is much higher than that of the independent variable ‘parental influence’ (β=.135) on the dependent variable ‘Attitude of students towards TVET education’; the beta weighting of the independent variable ‘parental influence’ (β=.135) is much higher than that of the independent variable ‘Quality of TVET education’ (β=.063) on the dependent variable ‘Attitude of students towards TVET education’; and the beta weighting of the independent variable ‘Quality of TVET education’ (β=.063) is much higher than that of the independent variable ‘peer influence’ (β=.050) on the dependent variable ‘Attitude of students towards TVET education’, this means that ‘Socioeconomic factors, Parental influence, Quality of TVET education and Peer influence’ are a stronger predictor of ‘Attitude of students towards TVET education sequentially.

Discussion of Findings

This section of the study presents the discussions of findings regarding Factors Affecting the Attitude of Students towards TVET Education in Bedesa Town, Western Harerge Zone, Oromia Regional State. The findings were discussed as follows:

Impacts of Socioeconomic Factor

The findings of this study reveal that socioeconomic factors have strong impact on the attitude of students towards TVET education. Socioeconomic status of their parents in their community was highly affecting the attitude of students in choosing technical and vocational education as a field for their future career. In line with this findings Chris (2016), noted that students with rich families have certain physical and sociological needs which then contribute positively to their education choice. Gemechu [35] identified that family’s socioeconomic status in one way or another affects students’ academic choice at any level of education. Moreover, the findings of Ayub (2017) confirmed that socioeconomic status of family have significant impact on student’s attitude towards Technical and Vocational Education and training. Furthermore, Awang et al. (2011) and Ozioma (2011) asserted that students have perception that Technical and Vocational education is for students from poor socioeconomic background. Mills and Lavender (2011) find out that parents place of living impact on their children for selection of TVET as a career. Therefore, it was identified that people mostly choose a course because of their socioeconomic status and their status in their community.

Impacts of Parental Influence

Parental influence was found to have statistically significant positive effect on the attitude of students towards technical and vocational education and training. This implies that if the attitude of parents towards TVET education is positive and good, the better the students can be enrolled in the TVET education and vice versa. Student’s decisions in education are highly influenced by their parents and especially strongly follow the decisions of their family while choosing where to join and what to learn. This indicates that most students have no or less chance to make the right educational decisions for themselves. This findings are supported by what Bukantaite et al. (2006) investigated in their study that 77.9 percent of students responded that their desire to “learn anywhere” is made by the family of students. Mills and Lavender asserted that most of the research findings have shown that student approach to TVET is influenced by their guardians. Otula [36] also supported by stating that families involvement determines the emotional and material input that further determined the motivation level in students towards education choice.

Impacts of Quality of TVET Education

Quality of TVET education was found to have a statistically significant positive impact on the attitude of students towards TVET education. This imply that poor quality TVET education lower the choice of students. Lack of adequately trained vocational teachers, technically incompetent staff, lack of infrastructure, poor Instructional materials and hours of instruction, at technical and vocational education and training colleges highly affects the attitudes of students towards choosing TVET courses.

In line with these finding, many researchers supported the results. For example, the lack of infrastructure continued to affect the full enrollment of TVET students in South Africa (Powell and Mcgrath, 2013), Nigeria (Ogbuanya, 2014), Bangladesh (Alam and Forhad, 2020), Chile (Rojas et al., 2019) and Kenya (Reuben et al., 2020). Moreover, inadequate teaching and learning services, inconsistencies in curriculum compliance to meet market needs and a lack of industrial integration lead to lower enrollment to technical and vocational education (Nursiah et al., 2020). Therefore, it was identified that quality of TVET education have impacts on student’s attitude towards choosing TVET educations.

Impacts of Peer Influence

Peer influence was found to have a statistically significant impact on the attitude of students towards TVET education. The data analyses showed us that In addition to parents, peers also influence student attitudes in the choice of TVET education. In support of this finding, Indoshi et al. [37] investigated that peers influence has most impact for selection of subjects. Some students select that subjects which their friends chose. Some peer group belongs to any social class who share same values so peers group influence to their peer in the choice of vocational education. In Ghana, another study found that generally no negative perception was attached to Technical and vocational training as a separate occupation of student education, but the results showed that concern for student program choice has a significant effect on technical and vocational school enrollment. Therefore, better communication with teaching high school colleagues and encouraging colleagues to interact with students in the area could help to increase the enrollment rate of students in to TVET education.

Conclusion

Based on the results of the current study, the following conclusions were drawn. First, it was indicated that there were no high sex disparities among respondents in the study area. The majority of the respondents were below 25 years, which suggests that most of the respondents were young adults who have great opportunities for further technical and vocational educational attainment for the future generations of the country. On the other hand, the results of the study revealed that 48.6% of the variation in the attitude of students towards TVET education can be explained by changes in Socioeconomic factors, parental influence, quality of technical and vocational education and training education and peer influence whereas 51.4% were unexplained variables that affect the attitude of students towards TVET education.

Even-though all independent variables (Socioeconomic factors, Parental influence, Quality of TVET education and Peer influence) have a statistically significant impact on the dependent variable, the impact of socioeconomic factors is much higher than that of parental influence on the attitude of students towards TVET education’; the independent variable ‘parental influence’ is much higher than that of the ‘Quality of TVET education on the attitude of students towards TVET education’; and the independent variable ‘Quality of TVET education’ is much higher than that of the independent variable ‘peer influence’ on the attitude of students towards TVET education’, The study therefore concludes that that ‘Socioeconomic factors, Parental influence, Quality of TVET education and Peer influence’ were the stronger predictor of Attitude of students towards TVET education sequentially.

Recommendations

Based on the major findings of the study and conclusions drawn, the following recommendations are forwarded:

  1. The government, Head of TVET and TVET board members should arrange and provide a serious and consistence campaign on the importance of TVET in the development of the country.
  2. Governments, communities and NGOs at local levels should provide financial, material and human resources to strengthen and enhance the quality of education imparted at TVET institutions.
  3. Guidance and counselling services should be strengthen in larger community in general and for parents in particular on the importance of TVET to influence their children towards Technical and vocational education and training.

References

  1. Adams AV (2011) The role of skills development in overcoming social disadvantage: Background paper prepared for the education for all global monitoring report 2011, paper commissioned for the EFA Global Monitering Report 2011.
  2. Ali Sh (2013) Evaluation of the factors contributing to the lack of interest of female students in studying in vocational schools in Tehran in 2011-2012.
  3. Ozioma C, Azubuike (2011) Influential Factors Affecting the Attitude of Students Towards vocational/Technical Subjects in Secondary Schools in Southeastern Nigeria. Journal of Educational and Social Research Vol 1: 2
  4. Billet S (2011) Vocational Education: Purposes. Traditions and Prospects. Journal of Vocational Education & Training.
  5. Azeem N, Omar MK (2018) Exploring Teacher Performance: A Review of Concepts and Approaches. [crossref]
  6. World Bank (2015) Small and Micro Enterprises, World Bank Group Review of Small Business activities: Washington, DC.
  7. Ministry of Education (2015) Education Sector Development Program V (ESDP V): Addis Ababa.
  8. Ministry of Education (2008) National Technical and Vocational Education and Training (TVET) Strategy. Addis Ababa, MoE,
  9. MoE (2010) Federal Democratic Republic of Ethiopia, Ministry of Education, Education Statistics Annual Abstract 2003 E.C (2010-11 G.C): Education Management Information System, Addis Ababa.
  10. Ohiwerei F, Nwosu B (2009) Vocational Choices among Secondary School Students: Issues and Strategies in Nigeria. Asian Journal of Business Management 1: 1-5. [crossref]
  11. Awang H, Sail R, Alavi K, Ismail I (2011) Image and Students’ Loyalty Towards Technical And Vocational Education And Training. Journal of Technical Education and Training (JTET) 3: 1.
  12. UNESCO (2012) Third International Congress on Technical and Vocational Education and Training Shanghai, People’s Republic of China.
  13. Chris Z, Lindsey M (2016) Vocational and Technical Education Oxford University Press.
  14. ICBEM (2015) International Conference on Business, Economics and Management.
  15. Tsehay F (2014) Gender Role Perception and Vocational Choice of Trainees in Tvet Colleges/Institutions. Thesis. Addis Ababa University.
  16. Nursiah ES, Azhar WCN, Mansor M, Maarof S (2020) The Role of Intellectual, Emotional and Spiritual Intelligence towards Entrepreneurial Intention among TVET Student Indonesia and Malaysia 2: 117-123. [crossref]
  17. Akanbi GO (2017) Prospects for technical and vocational education and training (TVET) in Nigeria: Bridging the gap between policy document and implementation. International Education Journal 16: 1-15.
  18. Esrael W (2018) Attitude of Students Towards Technical Vocational Education and Training (TVET) at Yeka Sub-city Government TVET Colleges.
  19. Igbinedion V (2011) Perception of Factors That Influence Students’ Vocational Choice of Secretarial Studies In Tertiary Institutions In Edo State Of Nigeria. European Journal of Educational Studies 3: 325-337.
  20. Ayonmike SC (2010) Skill training in Nigerian Technical Colleges: Benefits and challenges. Journal of Qualitative Education 6: 75-86.
  21. Cheong K, Lee K (2016) Malaysia’s Education Crisis – Can TVET Help ? 53: 115-134.
  22. Dania J, Bakar AR, Mohamed S (2014) Factors influencing the acquisition of employability skills by students of selected technical secondary school in Malaysia. International Education Studies 7: 117-124.
  23. Antonios F (2006) The Implementation of the Middle Level TVET Program in Addis Ababa.
  24. Irina S, Pramila K (2013) Technical and Vocational Education and Training in Ethiopia.
  25. Powell L, Mcgrath S (2013) Why students enroll in TVET – The Voices of South African FET College Students. Journal of Vocational Education and Training (JVET) 23.
  26. Ogbuanya TC (2014) Workshop equipment and facilities as critical factors for sustainable skill acquisition through TVET in Nigeria. JORIND 12: 2.
  27. Alam GM, Forhad MAR (2020) Roadblocks to university education for diploma engineers in Bangladesh.
  28. Rojas MP, Tapia PB, Kemper JM, Maldonado MK (2019) Country Case Study: on Technical Vocational Education and Training (TVET) in Chile.
  29. Reuben R, WanyekiPaul, Hebert D (2020) Influence of Occupational Stereotyping on Enrolment in Technical Courses: A Case of Female Students in Technical Training Institutions in North Rift Region, Kenya.
  30. Okello B (2013) Factors influencing the attitude towards technical education and training in Uganda. Kenyatta University.
  31. Eurobarometer (2011) Attitudes towards Vocational Education and Training.
  32. Ayub H (2017) Parental Influence and Attitude of Students towards Technical Education and Vocational Training. International Journal of Information and Education Technology 7: 7.
  33. Bukantaite D, Laužackas R, Sabaliauskas T (2006) Motivation for vocational education and training choice in Lithuania. In ECER 2006: Paper presented at the European Conference on Educational Research Post Graduate and New Researcher Pre-Conference [Elektroninis išteklius], University of Geneva, 11 September 2006. Switzerland: University of Geneva, 2006.
  34. Mills TA, Lavender T (2011) Advanced maternal age. Obstetrics, Gyna Ecology & Reproductive Medicine 21: 107-111.
  35. Gemechu A (2018) Family Socio-economic Status Effect on Students’ Academic Achievement at College of Education and Behavioral Sciences, Haramaya University, Eastern Ethiopia. Journal of Teacher Education and Educators 7: 207-222
  36. Otula PA (2007) Mastery of modern school administration.
  37. Indoshi F, Wagah M, Agak J (2010) Factors that determine students’ and teachers’ attitudes towards art and design curriculum. International Journal of Vocational and Technical Education 2: 9-17.
FIG 1

Astrocyte, Lipid Metabolism in Alzheimer’s Disease and Glioblastoma

DOI: 10.31038/JCRM.2022555

Abstract

The brain is a central key organ of the body containing the second highest lipid content only after adipose tissue. Lipids as the main structural components of biological membranes play important roles in a vast number of biological processes within the brain such as energy homeostasis, material transport, signal transduction, neurogenesis and synaptogenesis, providing a balanced cellular environment required for proper functioning of brain cells. Lipids and their metabolism are of great physiological importance in view of the crucial roles of lipids in brain development and function. Astrocytes are the most abundant glial cells in the brain and involved in various processes including metabolic homeostasis, blood brain barrier maintenance, neuronal support and crosstalk. Disturbances in lipid metabolism and astrocytic functions may lead to pathological alterations associated with numerous neurological diseases like Alzheimer’s Disease (AD) recognized as the most frequent cause of dementia leading to major progressive memory and cognitive deficits as well as Glioblastoma (GBM) known as the most aggressive malignant brain tumor with a poor prognosis. Herein, we not only review the level and role of altered lipid metabolism in correlation with astrocytic function and astrocyte-neuron crosstalk in AD and GBM, but also discuss important lipid-related metabolites and proteins participating in possible mechanisms of pathologically dysregulated lipid metabolism, offering potential therapeutic targets in targeted molecular therapies for AD and GBM.

Keywords

Astrocyte, Lipid metabolism, Alzheimer’s disease, Glioblastoma

Introduction

The brain is a central and pivotal organ highly enriched in lipids (constituting 50% to 60% of brain dry weight) [1], the major biomacromolecules characterized with poor water-solubility and good solubility in non-polar organic solvent, and is regarded with the second highest lipid content next to the adipose tissue [2]. Lipids are a class of fatty substances differing in overall structure, molecular weight, head group configuration, carbon-carbon bond formation and other factors, among which fatty acids, phospholipids, sphingolipids, sterol lipids and triglycerides are the five main brain lipid classes [3], serving as basic structural components of biological membranes and participating in a broad variety of physiological events, including chemical energy generation and storage, substance transport, cellular signaling, neural differentiation, axonal regeneration, synaptogenesis, synaptic plasticity and brain development [4-14].

The brain consists of neurons and non-neuronal cells such as glial and vascular epithelial cells, of which astrocytes represent the most abundant glial cells [15,16]. Astrocytes mediate diverse biological activities under physiological conditions, including structural and energy support for neurons [17,18], neuronal development and maintenance [19,20], formation, function and plasticity of synapses [21,22], modulation of synaptic transmission [22], metabolomic homeostasis [23] as well as integrity of the Blood-brain Barrier (BBB) [24,25] which is a semipermeable membrane regulating solute exchange between blood and brain parenchyma to maintain CNS homeostasis and function and partially separating local lipid metabolism of the brain from that of the body [25-33]. Apart from the well-known enzymatic capacity of glycogenesis and glycolysis [34-38], equipment of lipid metabolism also exists in astrocytes, providing membrane components for neurons and other glial cells [39,40] and playing fundamental roles in astrocyte function including membrane fluidity, energy generation and intercellular signaling. Emerging evidence has shown that astrocytic usage of lipids stored in droplets via mitochondrial β-oxidation fulfills crucial energy-providing and neuroprotective roles in the brain [18,41], whereby disruption in lipid metabolism, structure and function of astrocytes may lead to pathogenic mechanisms underlying an array of neurological diseases.

Lipid Classification in the Brain

Fatty Acids

As one of the most well-known lipid class, Fatty Acids (FAs), the essential monomeric constituents of all lipids, account for almost 20% of the energy source through oxidation, for which astrocytes as the major provider of fatty acid β-oxidation may be the essential place [42-44]. Additionally, fatty acids can also be utilized by astrocytes for producing ketone bodies under particular conditions (e.g. ischemia), serving as a substrate for neuronal energy production-related Tricarboxylic Acid (TCA) cycle [45]. Fatty acids permeate the Blood-brain Barrier (BBB) via passive (dissociation from albumin carriers, binditheng to luminal membrane which belong to endothelia cells, ATP-independent release and entrance into the cytosol) and/or protein-mediated transport (e.g. Fatty Acid Transport Proteins (FATPs), fatty acid translocase/CD36 (FAT/CD36), Fatty Acid Binding Proteins (FABPs) and caveolin-1) [46,47]. Fatty acids can be further divided into unsaturated and saturated fatty acids, from which the former subclass contains Monounsaturated Fatty Acids (MUFAs) and Polyunsaturated Fatty Acids (PUFAs), while the latter comprises palmitic acid, stearic acid and others [48,49]. PUFAs are highly enriched in the brain, with 3- to 4-fold level over other tissues [50,51]. What’s more, essential PUFAs play key roles in brain activity and development [52,53], in which the ω-3 Docosahexaenoic Acid (DHA) are particularly involved in synaptogenesis, neurogenesis and neuroprotection in the brain [54-57].

Phospholipids

As the most abundant constituent of major categories of membrane lipids [58,59], Phospholipids (PLs) generally consist of two hydrophobic tails of fatty acids differing in length and a backbone-attached hydrophilic phosphate group [60-62].

Phospholipids, which are synthesized in the mitochondria and Endoplasmic Reticulum (ER) tracing from diacylglycerol and phosphatidic acid, spontaneously aggregate into the formation of bimolecular layers in aqueous environments on account of configuration and amphipathic property [63]. Phospholipids can be classified into glycerophospholipids and phosphosphingolipids, of which glycerophospholipids are the prominent glycerol-based class of lipid molecules which can be further subclassified into subtypes such as Phosphatidic Acid (PA), Phosphatidylcholine (PC), Phosphatidylethanolamine (PE), Phosphatidylglycerol (PG), Phosphatidylinositol (PI) and Phosphatidylserine (PS) on the basis of variation in hydrophilic head groups and participate in a variety of physiological activities in the brain [59,64,65]. Moreover, fates of brain cells are influenced by exposure to different phospholipids, such as differentiation of neural cells into astrocytes was promoted and inhibited with PE and PC treatment, respectively [66].

Sphingolipids

Sphingolipids containing sphingoid bases (also known as long-chain bases) and a set of aliphatic amino alcohols that includes sphingosine are mainly synthesized in Endoplasmic Reticulum (ER). Sphingolipids comprise a large group of lipid molecules through compounding with different functional groups, such as ceramide (functional group of single hydrogen atoms) and Sphingomyelin (SM) (functional groups including phosphocholine) with regards to structural composition, functioning as building blocks of membranes (e.g. lipid rafts) [67] and playing fundamental roles in formation and regulation of synapse structure and function [68], cell recognition, signal transmission and inflammatory regulation of astrocytes [69-72]. Besides, sphingolipid metabolites have also been discovered to exert regulatory roles in autophagy, cancer cell growth, response to DNA damage and inflammation [73-75].

Sterol Lipids

Sterol lipids include numerous organic molecules, of which cholesterol with four hydrocarbon rings is the main part. Cholesterol can be synthesized in ER by all nucleated cells, while over 70% of total body cholesterol are provided by the diet [76], namely the cholesterol absorbed in the gut transfers into the liver and then spreads through the body. What is noteworthy is that the brain, unlike other organs, makes its own cholesterol because of effective prevention of peripheral cholesterol exchange between brain tissue and plasma cholesterol-carrying lipoproteins by the BBB [77-79]. In brain tissue, de novo synthesis of cholesterol is mainly performed in astrocytes which are considered as the main cholesterol producer in the brain [80], though the majority of sterol is synthesized in oligodendrocytes in developing brain and has an association with myelination [81] and oligodendrocytes, besides, cholesterol can also be synthesized in many other cell types [82-84]. Apart from de novo synthesis [85], brain cells are able to acquire cholesterol from neighboring cells through the absorption of cholesterol-laden lipoproteins (e.g. Apolipoprotein E (APOE)) in a receptor-mediated way [86,87], in which lipoprotein synthesis for cholesterol transport occurs in astrocytes [88]. With abundant existence in myelin and lipid membranes [81], cholesterol fulfills vital roles in the brain, including BBB integrity, organization of lipid rafts (discrete microdomains present in the external leaflet of plasma membrane), regulation of cell membrane flexibility (through interaction with neighbouring phospholipids) and localization and activity of diverse membrane proteins (e.g. membrane receptor and transporter proteins), axonal guidance, formation and maintenance of synapses and dendrites, synaptic membranerelated fluidity and ion channel function, glucose transport, intracellular signaling and other important neuronal functions [84,89-103].

Triglycerides

As the major form of FA deposition and the optimal form of FA triesters of glycerol, Triglycerides (TGs) are essential ingredients of glycerolipid synthesis by assembling with other glycerol molecules [104]. Triglycerides mainly generated in the adipose tissue and liver can reach other tissues with the package into lipoproteins containing a hydrophilic exterior and a hydrophobic lipid core, including chylomicrons, Very-lowdensity Lipoproteins (VLDL), low-density lipoproteins (LDL), very-high-density lipoproteins (VHDL) and high-density lipoproteins (HDL) only which can cross the BBB [105-108]. Additionally, apolipoprotein E (ApoE) and apolipoprotein J (ApoJ), the most abundant apolipoproteins synthesized in astrocytes, serve as receptor ligands on HDL [109-111] and play fundamental roles in lipid metabolism-associated structural support, enzyme activity and substrate delivery [110,112-114].

Astrocyte-Neuron Coupling of Lipid Metabolism

In humans, the brain representing, on average, merely 2% of total body weight consumes approximately and over 20% of energy substrates during quiet waking and diverse tasks, respectively [115,116], which depends on relatively efficient metabolic coupling between astrocytes and neurons. Physiologically, astrocytes are considered primarily as glycolytic cells with a large enzymatic capacity for glycolysis [115,117,118], whereas neurons are predominantly oxidative [119-121]. Besides the glucose metabolism in which astrocytes participate in the delivery of blood-derived glucose to neurons as an obligatory energy fuel, glycogen storage and activitydependent L-lactate production as a metabolic substrate for neurons during aerobic glycolysis [115,122-124], astrocytes-neuron coupling of lipid metabolism has also been suggested to occur as a response to neuronal activity in protection of neurons from lipotoxicity [125,126]. This is a mechanism proposing that L-lactate-derived de novo synthesis of free fatty acids (FFAs) in overstimulated neurons is triggered during astrocyte-neuron L-lactate shuttle (ANLS), resulting in excess FFAs in association to lipotoxicity-related reactive oxygen species (ROS) and lipid peroxidation chain reaction [127], peroxidized FAs with devastating effects [127] are then transferred from hyperactive neurons to astrocytes via apolipoprotein E-positive lipid particles, where they are directly stored in lipid droplets (LDs) [125,126,128] which are dynamic organelles possessing a core of neutral lipids (e.g. cholesterol esters (CEs) and triacylglycerides (TAGs)), influencing fatty acid breakdown for energy production [129] and buffering excess FFAs to prevent lipid accumulation [130] as well as utilized as an energy substrate in β-oxidation [126] (Figure 1).

FIG 1

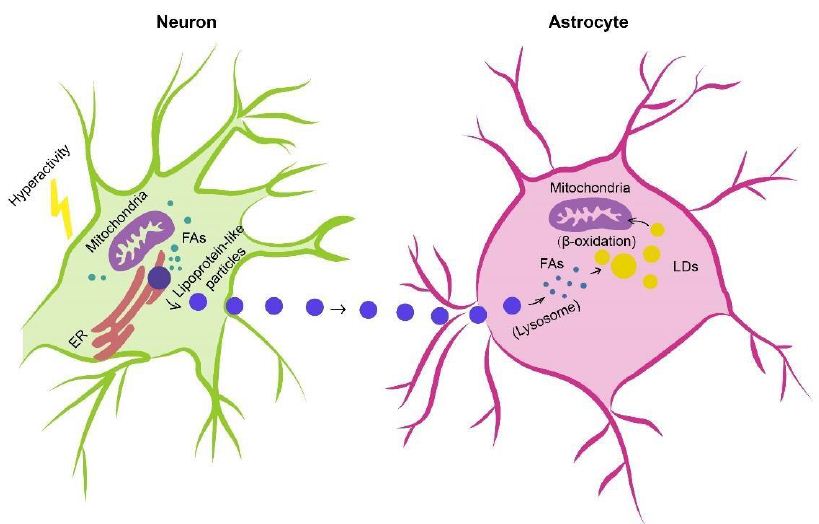
Figure 1: Astrocyte-Neuron coupling of lipid metabolism. Excess fatty acids produced in hyperactive neurons are transferred via lipid particles associated with APOE to astrocytes, where fatty acids are delivered to lipid droplets after endocytosis of neuron-derived lipid particles, detoxified as a means of neuron protection under conditions of enhanced activity as well as consumed by mitochondrial oxidation (e.g. β-oxidation). FAs, fatty acids; APOE, apolipoprotein E; LDs, lipid droplets.

AD

With the worldwide increase in longevity, Alzheimer’s disease (AD) as the most common form of senile dementia is rapidly becoming a major health problem [131,133]. AD is a devastating irreversible neurodegenerative disease clinically defined by memory loss, neuropsychiatric abnormalities, cognitive impairment, behaviour deficits and progressive decline of self-care capacity [134-136] as well as pathologically characterized by extracellular amyloid-ß (Aβ) plaques and intracellular neurofibrillary tangles (NFTs) composed of hyperphosphorylated microtubuleassociated protein tau [137-139]. Moreover, accumulation of lipid granules in glia, besides notorious Aβ deposition and tau aggregates, was noticed with the examination of Auguste Deter’s brain (the first described AD patient), initially establishing a possible involvement of perturbations of lipid metabolism in AD pathology [140,141]. Altered lipid metabolism has also been further described with important roles in AD pathogenesis [142-151].

Recent AD pathology-related lipidome studies have demonstrated changes in content of numerous lipids (Table 1). Substantial differences in fatty acid levels were observed in AD brain tissues [152,153], including a decrease in levels of docosahexaenoic acid (DHA) present in frontal cortex gray matter [154] and hippocampus [155] to which damage correlates with impaired learning and memory [156], suggesting a dysregulation of fatty acid metabolism and may potentially marking this neurodegenerative disease [157]. Cholesterol accumulation observed in senile plaques and influenced brain regions from AD patients [158] has been reported in association with region-specific synapse loss [159]. A causal relationship between hypercholesterolemia and dysfunctional cholinergic system, cognitive impairments and pathology of amyloid and tau protein has been also demonstrated [160,161], further supporting important roles of disturbed cholesterol metabolism in AD. What’s more, detection of elevated cholesterol esters was performed in lipid raft-like mitochondria-associated ER membranes (MAMs) [162] of which hyperactivity leads to cholesterol retention and synapse loss and correlates with cognitive deficits [163] and in which accumulated cleaved products of Amyloid Precursor Protein (APP) cause mitochondrial dysfunction, interruption of cellular lipid homeostasis and membrane lipid alterations generally observed in AD pathogenesis [164,165]. Mitochondrial dysfunction, accompanied with increased oxidative stress, in neurons induces a lipid transfer to nearby astrocytes in which lipid droplets accumulate, in turn, mitochondrial dysfunction in glial cells can be caused by accumulation of peroxidated lipids and oxidative stress, contributing to neurodegenerative processes [166-168]. Growing evidence has supported nonnegligible roles of phospholipids and sphingolipids in AD pathogenesis and progression, with studies reporting that phospholipids and sphingolipids, together with acylglycerols, fatty acids and sterol lipids, present significant content changes in AD brain tissues [154,169-175].

Table 1: Summary of lipid changes in AD

Lipids Tissue Changes in AD Ref
Fatty acids Omega-3 fatty acids DHA Brain; CSF; Circulation [176-180]
MFG [179]
FCx [181]
EPA Brain; Circulation [180]
MFG [179]
DPA Brain [182]
ALA Plasma [183]
Omega-6 fatty acids AA Brain; CSF

[177,184,1

85]

MFG [179]
HPC [186]
LA Brain; Plasma [179,187]
Saturated fatty acids Brain; CSF [176]
Eicosanoids PG Brain [188]
Phospholipids Phosphatidylcholine (PC) Total PC lipids Brain [189]
PC-EPA CSF [190]
PC-DHA Plasma [191]
PC-EPA Plasma [191]
Phosphatidylethanolamine (PE) Total PE lipids HPC [186]
PE-SA HPC [192]
PE-OA HPC [192]
PE-AA HPC [192]
PE-DHA HPC [192]
Phosphatidylserine (PS) Total PS lipids Occipital lobe; Inferior parietal [193]
lobule
Sphingolipids Ceramides (CM) Total CM lipids Brain [194]
Sphingomyelin (SM) Total SM lipids CSF [195]
Triglycerides Total TG lipids Serum [196]
Polyunsaturated TG Brain [197]
Sterol lipids Cholesterol Brain [198]
Cholesterol precursors Brain [198]
Total oxidized cholesterol Brain [199]

PC, phosphatidylcholine; PE, phosphatidylethanolamine; PS, phosphatidylserine; CM, ceramides; SM, sphingomyelin; TG, triglyceride; AA, arachidonic acid; ALA, alpha-linolenic acid; DHA, docosahexaenoic acid; DPA, docosapentaenoic acid; EPA, eicosapentaenoic acid; LA, linoleic acid; OA, oleic acid; SA, stearic acid; PG, prostaglandin; CSF, cerebral spinal fluid; FCx, frontal cortex; HPC, hippocampus; MFG, medial frontal gyrus;↑; increased from control ↓; decreased from control.

APOE

In comparison with early-onset familial AD (EOFAD), late-onset AD (LOAD) accounts for approximately 95% of all AD cases [200,201], in which genetic predisposition, after aging, plays major roles in the onset of AD. As the strongest risk factor for LOAD, apolipoprotein E (APOE) is the main lipoprotein in the brain and plays pivotal roles in brain lipid metabolism, membrane remodelling and neuronal growth and repair [202-206]. APOE mainly produced by astrocytes is released into extracellular space where essential lipids (e.g. cholesterol) are delivered to neurons adopting APOE-bound cargo through APOE receptors expressed on the neuronal surface [202]. In addition to the capacities of Aβ binding and influencing Aβ aggregation and clearance [204,207], APOE participates in indirect regulation of Aβ metabolism through interactions with receptors (e.g. low-density lipoprotein receptorrelated protein 1 (LRP1)) [206,208-213]. Critical and isoform-specific role of APOE has also been demonstrated in formation of intraparenchymal Aβ deposits in amyloid precursor protein (APP) transgenic mice [214-217]. APOE exists with 3 different alleles namely APOEε2, APOEε3 and APOEε4, translating to 3 protein isoforms termed APOE2, APOE3 and APOE4, of which APOE4 present in approximately 14% of worldwide populations [205,218] is the most prevalent genetic risk factor for AD [219-222]. A single amino acid difference between APOE3 and APOE4 (Cys 112 Arg) brings about a conformational change influencing the binding to Aβ, lipids and apolipoprotein receptors [223]. APOEε2 considered as a protective genetic factor associated with reduced risk for AD and late age at onset [219,224] has been reported to orchestrate differences in lipidome and transcriptome profiles of postmortem AD brain [218,225]. Conversely, APOEε4 markedly elevates AD risk [219,224], in which heterozygous and homozygous APOEε4 allele may increase AD risk by 3 and 12 times, respectively [223], accelerates disease course and worsens brain pathology [226-228]. A correlation between APOE4 genotype and increased expression of Serpina3n, a gene expressed by astrocytes and considered as a strong marker of reactive and aged astrocytes in the brain [229,230], has been reported with a possible contribution to the pathogenic role of APOE4 in AD [231]. Higher APOE4 level in Cerebral Spinal Fluid (CSF) of AD patients compared with that of control individuals has been connected to accelerated Aβ oligomer accumulation [232]. APOE4 may retard Aβ clearance and favour Aβ deposition via binding to Aβ after specific fragmentation [205,223]. APOE4 was reported to trap ATP-binding cassette transporters A1 (ABACA1) (a regulator of APOE4 lapidation in protection from lipidpoor ApoE4 aggregation) in late rather than recycling endosomes and alter ABACA1 membrane trafficking in astrocytes, which might result in reduced Aβ degradation [233]. Insufficient Aβ clearance also affects accumulation in synaptic cleft, contributing to disruption of hippocampal long-term synaptic plasticity related to learning and memory abilities [234]. APOE4 is internalized in APOE receptors such as low-density lipoprotein receptor-related protein 1 (LRP1) which is also a member of Aβ receptors including very low-density lipoprotein receptor (VLDLR) and apolipoprotein E receptor 2 (APOER2) [209]. Additionally, APOE4-induced reduction of dendritic spine density in mice [234,235] is consistent with pathological changes (dendritic spine density reduction and synapse loss) observed in brain tissues from AD APOEε4-carriers [236]. APOE4 causes widespread AD phenotypes-associated cellular and molecular alterations in brain cells derived from human induced pluripotent stem cells (iPSCs), among which increased Aβ secretion as well as impaired Aβ uptake and cholesterol accumulation occurred in neurons and astrocytes, respectively [237]. Astrocytic lipid metabolism is influenced by APOE4 [237,238], in which increased fatty acid unsaturation and lipid droplet (LD) accumulation were found in APOE4-expressing human iPSC-derived astrocytes, which can be restored to basal state through supplementation of culture medium with choline (a soluble phospholipid precursor) [238]. Furthermore, APOE4 can also impair astrocyte-neuron coupling of fatty acid metabolism via decreased fatty acid (FA) sequestering in LDs, reduced LD transport efficiency and lowered FA oxidation, resulting in lipid accumulation in astrocytes and hippocampus, diminished abilities of astrocytes in neuronal lipid elimination and FA degradation, accelerated lipid dysregulation and increased AD risk [239].

ACSBG1 and ACSL6

Cellular accumulation and activation of fatty acids (FAs) either synthesized de novo or taken up from diets require the ATP-dependent reaction catalyzed by acyl-CoA synthetases (ACSs), a family of enzymes initiating FA metabolism-related reactions through ligation to coenzyme A (CoA) [240]. ACS enzyme family contain various members differing in distribution and fatty acid substrate preference [241], among which only two show specific enrichment in the brain, ACSBG1 and ACSL6 [242,243], suggesting their potentially particular roles in modulation of brain fatty acid metabolism. ACSBG1, almost exclusively expressed in astrocytes, have preferences for a wide range of substrates containing long-chain saturated and unsaturated fatty acids [244,245]. ACSBG1 knockdown in vitro results in decreased ACS enzymatic activity and FA oxidation [245], indicating its participation in astrocytic FA oxidation, however, clear roles of ACSBG1 in brain function and/or dysfunction still remain poorly understood. ACSL6 showing high expression in the brain was reported to be downregulated in age-related neurodegenerative diseases [246,247] and in direct correlation with neurite outgrowth [248-252]. With high substrate preference for docosahexaenoic acid (DHA) of which low levels are associated with AD pathophysiology [253], ACSL6 has been revealed with key roles in regulating DHA incorporation into neuronal membranes using Acsl6 deficient mice with significant reduction in DHA-containing phospholipids and impaired memory [254,255]. Critical roles of ACSL6 in brain DHA retention and neuroprotection are further supported by findings that ACSL6 depletion led to markedly reduced levels of brain membrane phospholipid DHA, spatial memory deficits, hyperlocomotion, increased cholesterol biosynthesis and age-related neuroinflammation [256]. What’s noteworthy is that astrocyte-specific depletion had minimal influence on membrane lipid composition [256] in consideration of ACSL6 enrichment in astrocytes [240,257-261], possibly due to the expression of a DHA-nonpreferring variant [251,262-267] and enrichment of Y-gate domain rather than DHA-preferring F-gate domain in astrocytes [251].

ATAD3A

ATPase family AAA-domain containing protein 3A (ATAD3A), a nuclear-encoded mitochondrial membrane-anchored protein belonging to the AAA+-ATPase protein family and simultaneously interacting with inner and outer mitochondrial membranes, is implicated in a variety of biological processes including stability maintenance of mitochondrial DNA (mtDNA), regulation of mitochondrial dynamics and cholesterol metabolism [268-270]. ATAD3A deficiency led to neurodegenerative phenotypes in association with cholesterol elevation, downregulated expression of cholesterol metabolism-related genes [269], optic atrophy and axonal neuropathy [271]. Oligomerization and accumulation of ATAD3A at MAMs, lipid raft-like ER subdomain rich in sphingomyelin and cholesterol [272] and associated with diverse metabolic functions such as lipid metabolism, mitochondrial function and calcium homeostasis [273-277], have been discovered in both mouse models and postmortem human brain tissues of Alzheimer’s disease [278]. Aberrantly oligomerized ATAD3A leads to cholesterol accumulation via expression inhibition of cholesterol clearancemediating cytochrome P450 family 46 subfamily A member 1 (CYP46A1) located on MAMs of which deficiency correlates with cholesterol disturbance, amyloid aggregation and cognitive impairments [279], AD-like MAM hyperconnectivity (e.g. impaired MAM integrity) [277] as well as synapse loss [278]. MAM-resident cholesterol imbalance facilitates amyloidogenic APP cleavage [165], in turn, retention of APP proteolytic fragments at MAMs interrupts cholesterol trafficking and homeostasis [280]. Additionally, blocking ATAD3A oligomerization by heterozygous knockout or pharmacological inhibition treated with DA1 peptide has been reported in causal relationship with cholesterol turnover normalization, MAM integrity enhancement, APP processing suppression, synapse loss mitigation and ultimate reduction of AD-like neuropathology and cognitive impairments [278], further revealing a role of ATAD3A in AD pathology and suggesting a potential therapeutic strategy of retarding AD progression through manipulation of abnormal ATAD3A oligomerization.

FoxO3

Forkhead box O transcription factor 3 (FoxO3) belonging to the forkhead box (FOX) family sharing an evolutionarily conserved forkhead DNA-binding domain composed of 80 to 100 amino acids [281]and possessing single nucleotide polymorphisms (SNPs) associated with human longevity [282,283] functions as a mediator of biological processes promoting lifespan and preventing aging-related diseases [284,285], of which alterations are involved in carcinoma, cardiovascular and neurodegenerative diseases [283,286-289]. FoxO3 plays a pivotal role in quiescence maintenance of neural stem cells (NSCs) in the brain, removal of which induces NSC differentiation and consequent NSC pool reduction [290-293]. Apart from capacities for neuronal survival promotion or neuronal apoptosis mediation [294,295], FoxO3 has also been shown with astrocyte proliferation controlling through inhibiting inflammatory cytokines (e.g. TNF-α and IL-1β) mediating reactive astrogliosis in neurodegenerative diseases [296-299]. Conditional knockout of FoxO3 in astrocytes was reported to impair consumption of excess fatty acids [300] which are cytotoxic and destructive to mitochondrial function [301]. FoxO3 reduction in aged mice was found to be specific to the cortex rather than the hippocampus, where FoxO3 deficiency caused cortical astrogliosis and dysregulated lipid metabolism [300]. In addition, lipid dysregulation, mitochondrial dysfunction together with Aβ uptake impairment were also observed in cultured astrocytes deficient in FoxO3, which could be reversed by astrocytic FoxO3 overexpression [300], potentially supporting the concept that FoxO3 elevation in astrocytes may retard or restore cortical astrogliosis and AD-associated impairments.

GSAP

Under typical conditions, Amyloid-β (Aβ) peptides as the products of body’s cholesterol disturbance are cleaved from amyloid precursor protein (APP) which may occur in two cellular pools, namely lipid raft-associated pool preferentially favouring APP cleavage by β- and γ-secretase as well as non-raft pools where cleavage is performed by α-secretase in a non-amyloidogenic pathway [302] and rapidly eliminated to maintain normal Aβ levels [303]. γ‐secretase activating protein (GSAP) was first reported for its regulatory roles in γ-secretase activity and specificity and its significant and selective enhancement of Aβ production through interactions with γsecretase and amyloid precursor protein carboxy‐terminal fragment (APP-CTF) [304]. Significantly upregulated GSAP level has been demonstrated in both AD mouse models and postmortem brain tissues from AD patients [305-307]. Single-nucleotide polymorphisms (SNPs) at the GSAP locus have been shown association with AD diagnosis [308,309], of which one SNP was found to correlate with GSAP expression and AD risk [310]. Genetic knockdown and pharmacological inhibition of GSAP suppress Aβ generation and deposition and tau phosphorylation in AD mouse models [304,305,311]. Apart from the promotion of APP-CTF partitioning into Aβ production-favoring lipid rafts, GSAP has also been shown to be enriched in mitochondria-associated membranes (MAMs), an intracellular domain where amyloidogenic APP processing responsible for dysregulated lipid metabolism is performed [312,313]. GSAP depletion lowers APP-CTF accumulation in lipid rafts, reduces ER-mitochondrial contacts elevated in AD [313-316], and alters lipid profiles in a direction opposite to AD pathogenesis (e.g. GSAP depletion-raised levels of phosphatidylethanolamine (PE) and phosphatidylinositol (PI) showing consistent reduction in human AD brain) [310,317]. What’s more, interactions between GSAP and multiple components related to ER-associated degradation (ERAD) regulating mitochondrial function through MAM and participating in AD pathogenesis have also been revealed, further supporting crucial roles of GSAP in attenuating AD-associated pathogenic process.

Glioblastoma

Glioma as a malignant primary brain tumor originating from astrocytes or other glial cells accounts for approximately 80% of all malignant brain tumors [318], of which glioblastoma (GBM) is the most aggressive type of brain tumor known with a 5-year survival rate below 5% [319-321]. Metabolic reprogramming has been recognized as a fundamental hallmark for carcinogenesis and progression of multiple tumors including GBM [322-324], through which tumor cells meet the high-energy demands of rapid proliferation [325]. Except for the representative metabolic feature named the Warburg effect, a phenomenon in which GBM cells rely on glycolysis for energy production under oxygen-sufficient and oxygen-insufficient conditions [323,325-327], GBM cells can also be fueled by fatty acid oxidation (FAO) as an alternative crucial energy resource to meet high-energy consumption in GBM aggressiveness [328-332], of which inhibition negatively impacted GBM proliferation and progression [333]. Oxidation of fatty acids is achieved by two major pathways, namely enzymatic oxidation mediated by peroxidases (e.g cyclooxygenase (COX), cytochrome P450 (CYP450), lipoxygenase (LOX) and phospholipase A2 (PLA2)) [334] as well as nonenzymatic self-catalyzed peroxidation (Figure 2A) of which 4-hydroxynonenal (4HNE) is an end-product showing elevated expression proportional to the grade of brain tumor malignancy [335-337]. Moreover, lipid metabolism reprogramming in association with numerous pathophysiological processes such as tumor proliferation and development [338-343] has been further evidenced with the observation of large amounts of lipid droplets (LDs) in GBM [344-346] and other tumors [347-354]. Neutral lipid core of a single LD includes cholesteryl esters and triglycerides (TGs) composed of glycerol molecules with triple hydroxyl groups esterified by fatty acids [355-358]. TGs have been demonstrated to serve as an important energy reservoir for supporting GBM cell survival, in which LDs were rapidly broken down by GBM cells via autophagy, a pivotal cellular process degrading damaged organelles and protein aggregates and recycling nutrients via hydrolysis of cytoplasmic components to ultimately maintain cellular homeostasis [359-362], to release stored fatty acids for producing energy upon energetic stress like glucose deprivation (Figure 2B), in turn, inhibition of FAO or autophagy led to LD retention and significant potentiation of GBM cell death [363], suggesting that LDs may play critical roles in regulating GBM growth and limitation of LD usage might be indispensable in GBM treatment. What’s more, cholesterol metabolism in GBM is different from that in healthy brain tissues where nearly all brain cholesterol is synthesized de novo [364-366]. Contrary to normal astrocytes mainly synthesizing cholesterol from glucose or glutamine [367,369] and converting excess cholesterol to oxysterol as an endogenous ligand of liver X receptors (LXRs) to consequently trigger efflux of surplus cholesterol via ATPbinding cassette transporter A1 (ABCA1) and suppression of cholesterol uptake by low-density lipoprotein receptors (LDLRs) [370-374], GBM cells are insufficient to de novo synthesize cholesterol and thus dependent on exogenously supplied cholesterol for survival through upregulated LDLR expression [364,375] (Figure 2C), in which LXR agonists could induce GBM cell death by lowering intracellular cholesterol content via ABCA1-dependent cholesterol efflux and LDLR inhibition [364]. Additionally, intracellular cholesterol level has been revealed to be involved in resistance against GBM cell death induced by temozolomide (TMZ), a blood-brain barrier (BBB) penetrant chemotherapy agent currently used in the standard therapy for patients with GBM [376,377]. Furthermore, sphingomyelins (SMs), an important group of phospholipids in cell membranes, together with their hydrolysis by sphingomyelinases (SMase) are crucial to effects of radio- and chemotherapy [378,381]. Ceramides which are generated by SMase-mediated SM hydrolysis caused by TMZ and radiation can induce cell apoptosis [382-384], which can be evaded through conversion of ceramides to sphingosine-1-phosphate (S1P) (Figure 3) [385-387] linked to tumor grade and implicated in GBM aggressive phenotypes [383,388].

FIG 2

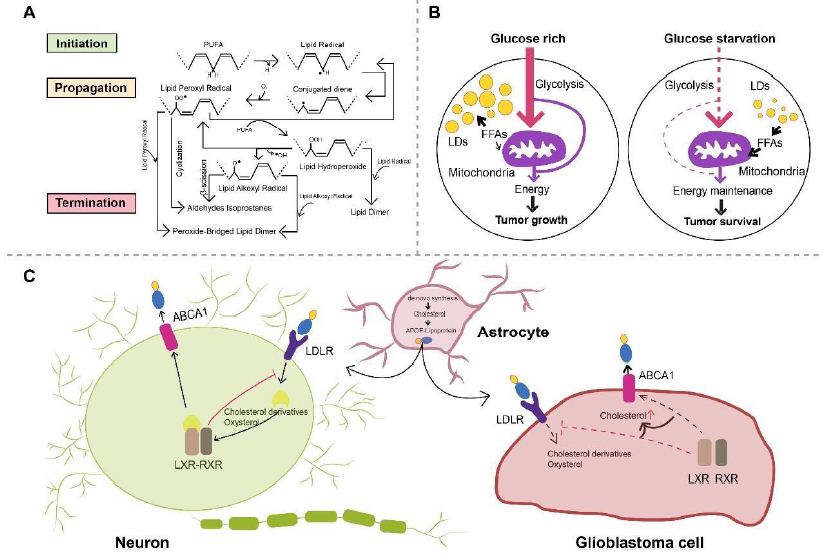
Figure 2: A. Scheme of non-enzymatic self-catalyzed lipid peroxidation. Abstraction of allylic hydrogen from PUFA induces lipid radical formation and initiates a chain reaction of lipid peroxidation, which is followed by conjugated diene-yielding molecular rearrangement. Conjugated dienes, in presence of molecular oxygen, are transformed to lipid peroxyl radical abstracting allylic hydrogen from another PUFA, forming lipid hydroperoxide and another lipid radical. Lipid hydroperoxide can be further catalyzed and transformed to lipid alkoxyl radical and lipid peroxyl radical. Lipid peroxidation is terminated when non-radical products are formed because of interaction with antioxidants. Reaction between two lipid peroxyl radicals or two lipid alkoxyl radicals will consequently form a peroxide-bridged lipid dimer, while lipid dimers can be formed by reaction between lipid hydroperoxides and lipid radicals. PUFA, polyunsaturated fatty acids. B. Schematic model of LDs hydrolysis maintaining GBM cell survival. GBM cells mainly utilize glucose to produce energy under glucose-rich conditions, while LDs can be rapidly broken down after autophagy activation upon glucose starvation, released FAs then enter mitochondria for energy production. FAs, fatty acids; LDs, lipid droplets; GBM, glioblastoma. C. Astrocytes are relied upon by neurons and GBM cells to provide de novo synthesized cholesterol. Neurons and GBM cells take up astrocyte-secreted cholesterol in APOE-containing lipoproteins. Following cholesterol uptake mediated by LDLR, oxysterol and cholesterol derivatives produced in neurons are physiological agonists for LXR of which activation leads to dimerization with RXR and subsequent elevation in ABCA1 expression. LXR activation also inhibits LDLR expression, resulting in decreased cholesterol uptake and regulating intracellular cholesterol level. On the contrary, mechanisms surveilling and regulating cholesterol are disrupted in GBM cells, in which oxysterol and cholesterol derivatives cannot activate LXR inducing intracellular cholesterol accumulation. ABCA1, ATP-binding cassette transporter A1; APOE, apolipoprotein E; GBM, glioblastoma; LDLR, low-density lipoprotein receptor; LXR, liver X receptor; RXR, retinoid X receptor.

FIG 3

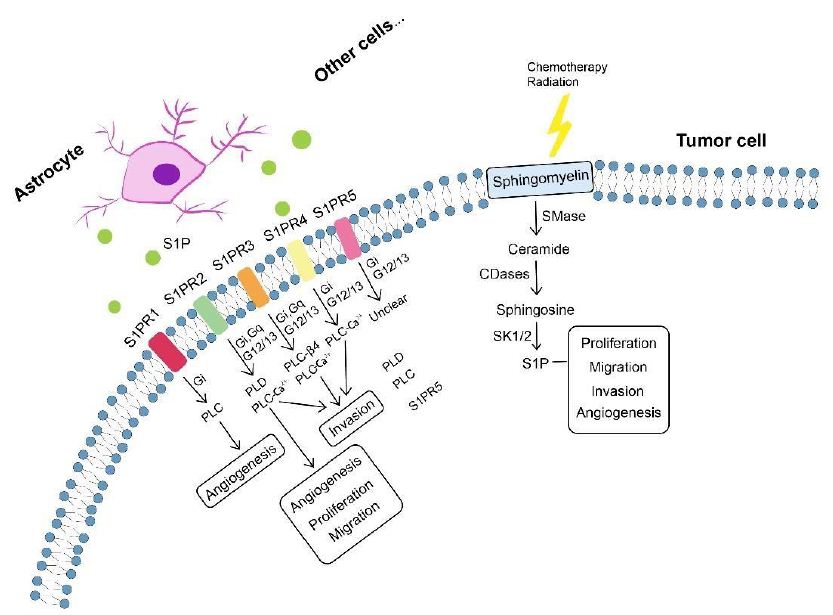
Figure 3: Sphingolipid metabolism in tumor progression. Sphingomyelin, after chemotherapy and radiation, is broken down into ceramide involved in blocking tumor progression. Ceramide can be converted by tumor cells to S1P (S1P can also be produced by astrocytes and other cells) exerting protumor effects including tumor proliferation, migration, invasion and angiogenesis. Involvement of S1P in tumor progression is specifically mediated by S1PRs (S1PR1-S1PR5) which can signal through phospholipase mechanisms. Each S1PR can couple to one or more GPCRs to signal through different phospholipases and induce phenotypes (e.g. angiogenesis, proliferation, migration and invasion). CDase, ceramidase; GPCRs, G protein-coupled receptors; SMase, sphingomyelinase; S1P, sphingosine-1-phosphate; S1PRs, S1P receptors.

S1PRs

GBM cells utilize exogenous source of S1P synthesized and exported by astrocytes and neuronal cells [389] and endogenous S1P production [390] for tumor progression. Involvement of S1P in tumor growth, migration, invasion, survival and angiogenesis [391-394] is specifically mediated by the family of G-protein coupled receptors named S1P receptors (S1PRs, S1PR1-S1PR5) [395-400]. S1PR1, S1PR2, S1PR3 and S1PR5 are expressed in human GBM cells [401-403], and elevated levels of S1PR1, S1PR2, and S1PR3 have been detected in brain tissues from GBM patients compared with healthy tissues, while only S1PR1 and S1PR2 showed significant association with GBM survival rates [401,402]. S1PRs are essential for mediating diverse S1P functions, whereas orientations in which they influence cell phenotypes still remain unclear. S1PR1 inhibition was reported to promote GBM cell proliferation, which collides with studies suggesting increased GBM proliferation by S1PR1-3, of which S1PR1 showed the strongest effects [402,404]. S1PR2 was shown to both reduce GBM migration through Rho/Rho kinase signaling pathway and participate in promoting GBM invasion [405,406]. In addition, S1PR5 has also been identified as an independent prognostic factor of GBM patients’ survival, aligning with reported role of S1PR5 in proliferation promotion [404,407]. Pharmacologically altered S1PR expression by fingolimod (FTY720), a sphingosine analogue leading to S1PR1 internalization, has been revealed to suppress astrocyte activation and change astrocytic secretion of C-X-C motif chemokine 5 (CXCL5) known to promote GBM proliferation and migration [408-410]. Furthermore, functions of individual S1P receptor subtypes are dependent upon activation of diverse downstream effector proteins, especially coupling to different G-proteins [399], such as binding of S1PR1, S1PR2 and S1PR5 with Gi, activation of Gq by S1PR2 and S1PR3 as well as signaling of S1PR2, S1PR3, and S1PR5 via G12/13 (Figure 3) [411], which alters signaling of phospholipases (particularly phospholipase C (PLC) cleaving proximal phosphodiester bonds of glycerophospholipids in production of phosphorylated headgroups and diacylglycerols [399,400]) and further activates downstream signaling molecules (e.g. extracellular signal-regulated kinase (ERK), phosphoinositide 3-kinase (PI3K) and mitogen-activated protein kinase (MEK)) (Table 2). What’s noteworthy is that a S1PR-targeted liposomal drug delivery system, named S1P/JS-K/Lipo, capable of blood-brain tumor barrier (BBTB) penetration and enhanced tumor-targeted delivery has recently been described, efficiently delivering a nitric oxide (NO) prodrug (JS-K, O2-(2,4-dinitrophenyl) 1-[(4-ethoxycarbonyl) piperazin-1-yl] diazen-1-ium-1,2-diolate) to GBM tissues via specific interactions with S1PRs highly expressed on GBM cells [412], representing a promising targeted approach for GBM therapy.

Table 2: Summary of S1PR-mediated effects in GBM

Models Involved S1PRs Signaling Pathways Findings Ref
LN18 GBM cells;

U87MG GBM cells.

S1PR1 ↑

S1PR2 ↑

S1PR3 ↑

PI3K/AKT1 pathway Demonstrated association between S1P1 and S1P2 with GBM patient’s [413]
survival. S1PR1/2 inhibition reduces GBM migration.
U373MG GBM cells S1PR1 ↑

S1PR2 ↑

S1PR3 ↑

MAPK/ERK and PI3Kβ pathway S1P promotes glioma cell proliferation. [414]
U373MG GBM cells;  GBM6 cells;  GBM12 cells. S1PR2 MEK1/2 and Rho/ROCK S1P induces mRNA and protein expression of PAI-1 and uPAR, which are important for GBM invasiveness. [415]
U373MG GBM cells; U118MG GBM cells. S1PR1↑

S1PR2

S1PR3

MAPK-ERK

Rho/ROCK

S1PR, S1PR2 and S1PR3 all positively contribute to S1P-stimulated glioma cell proliferation, of which S1PR1 makes the major contribution. [416]
C6 glioma cells S1PR2 MAPK/ERK, PKC, PLC, PLD and Ca2+ signaling S1PRs are linked to at least two signaling pathways (i.e. PTX-sensitive Gi/Go-protein pathway and toxin- insensitive Gq/G11-PLC pathway). [417]
C6 glioma cells; 1321-N1 astrocytoma cells. S1PR2 PI3K/Cdc42/p38MAPK and PI3K/Rac1/JNK S1PR2 mediates S1P-induced negative regulation of glioma cell migration. [418]
U373MG GBM cells; U87MG GBM cells; M059K cells; U-1242 cells; A172 cells. S1PR1 ↑

S1PR2 ↑

S1PR3 ↑

MAPK/ERK and PI3K S1P potently enhances glioma cell motility by signaling through coupling of S1PRs to Gi proteins. [419]
T98G glioma cells; G112 glioma cells. S1P1, S1P2, S1P3 and S1P5 PTEN/AKT/Egr S1PR1 is a significant prognostic factor for glioma; [420]
Downregulated S1PR1 expression increases glioma cell proliferation and enhances glioma malignancy.
Human GBM specimens; U87 glioma cells; U251 glioma cells; T98G glioma cells; G112 glioma cells. S1PR1↓ Downregulated S1PR1 expression in GBM patients with a poor survival. S1PR1 signaling negatively controls glioma cell proliferation. [421]

AKT, v-akt murine thymoma viral oncogene homolog; Cdc42, cell division control protein 42 homolog; ERK, extracellular signal-regulated kinase; JNK, c-Jun Nterminal kinase; MAPK, mitogen-activated protein kinase; MEK, mitogen-activated protein kinase; PI3K, phosphoinositide 3-kinase; PLC, phospholipase C; PLD, phospholipase D; PTEN, phosphatase and tensin homolog; PTX, pertussis toxin; Rac1, Ras-related C3 botulinum toxin substrate 1; ROCK, Rho-associated protein kinase.

FABP7

Fatty acid binding protein 7 (FABP7), a member of the multi-gene FABP family comprised of structurally related proteins with expression patterns specific to cell, tissue and development, binds to very long chain polyunsaturated fatty acids (VLCPUFAs) such as docosahexaenoic acid (DHA) with high affinity [422,423]. FABP7 abundant in astrocytes [424-426] is a lipid chaperone mediating cellular uptake, intracellular trafficking and subsequent oxidation of fatty acids (FAs), whose expression was reported to be elevated in GBM and GBM stem-like cells forming neurospheres (NS) and might accounting for GBM aggressiveness [427,428] and recurrence as well as associated with proliferation, migration and invasion of GBM cells, GBM histology and reduced survival time [429-434]. Under metabolic stresses (e.g. hypoxia), fatty acids are stored as lipid droplets (LDs) and subsequently oxidized in a FABP-dependent manner for energy production in GBM cells [435]. Slowcycling cells (SCCs), a subpopulation of GBM cells preferentially utilizing mitochondrial oxidative phosphorylation (OXPHOS), showing elevated lipid contents specifically metabolized under glucose deprivation and displaying enhanced capabilities of migration, invasion and chemoresistance, have been revealed with the characterization of higher FABP expression and larger LD amounts in cultured conditions of normal oxygen levels or nutrients [436]. Additionally, resistance of SCCs against deprived glucose or inhibited glycolysis could be restrained by FA uptake blocking via genetic deletion or pharmacological inhibition of FABP7 [436].

Moreover, promotion effects of FABP7 on GBM cell migration can be mitigated with DHA supplementation through specific and dramatic inhibition of DHA supplementation in culture medium on plasma membrane lipid order of FABP7expressing GBM cells which positively correlates with GBM cell migration as well as DHA supplementation-mediated disruption of nanodomains formed by FABP7 on GBM cell membranes [437], further suggesting a critical role of FABP7 in lipid metabolism in GBM cells.

SCD

Stearoyl-CoA desaturase (SCD) is an endoplasmic reticulum (ER)-localized delta-9 fatty acid desaturase forming carbon-carbon double bonds at the 9th to 10th position from the COOH-terminus of saturated fatty acids (SFAs), stearic acid and palmitic acid and thus generating monounsaturated fatty acids (MUFAs), oleic acid and palmitoleic acid, respectively [438,439], whose expression correlates with the ratio of MUFA to SFA in which a disequilibrium contributes to alterations in cell growth and differentiation [438-441]. SCD has 4 isoforms in mice (SCD1, SCD2, SCD3 and SCD4), while only two paralogs are expressed in human, namely SCD sharing approximately 85% amino acid identity with mouse SCDs and SCD5 unique to primates [440,442]. SCD has been described as a hypermethylated gene member contributing to the CpG island methylator phenotype which defines a distinct glioma subgroup [443]. SCD expression in GBM, in contrast to SCD upregulation often observed in multiple human tumors [444-447], was reported to be lower than normal brain tissues because of hypermethylation and monoallelic deletion together with phosphatase and tensin homolog (PTEN) frequently deleted in GBM [448] in a subset of GBM patients [449]. In addition, GBM cells without epigenetic and genetic changes mentioned above were revealed to express elevated SCD levels on which tumor cells rely for their survival [449]. SCD inhibition by CAY10566, an inhibitor with a modest BBB penetration ability, has been demonstrated to not only significantly suppress intracranial GBM growth, but also obviously affect tumor vasculature including nearly complete blocking of intratumoral bleeding and possible normalization of blood vessels, potentially allowing enhanced delivery of combinedly used antitumor drugs such as temozolomide (TMZ) [449,450].

Conclusions

The brain is highly enriched in lipids where they are crucial for multiple physiological processes ranging from maintenance of structural integrity and metabolic homeostasis to brain function and development. Metabolism of lipids is a complicated process in which a wide range of lipid-related effector proteins are involved and whose alteration is strongly associated with brain dysfunctions and diseases such as Alzheimer’s disease (AD) and glioblastoma (GBM). In this review, we throw light upon basic classes of lipids including fatty acids, phospholipids, sphingolipids, sterol lipids and triglycerides, of which dysregulated metabolism can be regarded as disease biomarkers. We also briefly discuss the role of lipids within the brain and altered lipid profile correlated with astrocytic function and astrocyte-neuron crosstalk in AD and GBM. Moreover, we have discussed lipid-related metabolites and proteins critical for disease-associated lipid dyshomeostasis and how these proteins together with lipids in correlation with astrocytic functions modulate disease pathogenesis and development, enlightening their therapeutic potential in preventing onset and progression of AD and GBM. However, there are still several lipids whose association with AD and GBM and availability as clinically valuable biomarkers for disease detection at early stages need further evaluation, which can be performed by newly-developed and improved techniques of gradually matured lipidomic platforms. What’s more, there remains much to be discovered about benefits and risks of manipulation of compounds affecting effector proteins involved in lipid metabolism, and further characterization of pathways in which important lipid-related proteins participate along with clinical studies will aid the understanding of pathogenesis mechanisms behind AD and GBM and identification of novel therapeutic targets to help ameliorate disease courses, facilitate disease treatments and consequently benefit patients.

References

  1. Mita R, Coles JE, Glubrecht DD, Sung R, Sun X, et al. (2007) B-FABP-expressing radial glial cells: The malignant glioma cell of origin? Neoplasia 9: 734-744. [crossref]
  2. Mita R, Beaulieu MJ, Field C, Godbout R (2010) Brain fatty acid-binding protein and omega-3/omega-6 fatty acids: Mechanistic insight into malignant glioma cell migration. J Biol Chem 285: 37005-37015. [crossref]
  3. Antonella DR, Serena P, Marco R, Patrizia T, Letizia M, et al. (2012) A radial glia gene marker, fatty acid binding protein 7 (FABP7), is involved in proliferation and invasion of glioblastoma cells. Plos One 7: e52113. [crossref]
  4. (2020) 2020 Alzheimer’s disease facts and figures. Alzheimer’s & Dementia 16: 391-460.
  5. Brookmeyer R, Evans DA, Hebert L, Langa KM, Heeringa SG, et al. (2011) National estimates of the prevalence of Alzheimer’s disease in the United States. Alzheimer’s & Dementia 7: 61-73. [crossref]
  6. Rlhh A, Cagw A, Pa A, Maj B, Frjv A, Jls C (2014) Diagnosing Alzheimer’s disease: A systematic review of economic evaluations. Alzheimer’s & Dementia 10: 225-237.
  7. Wilfling F, Haas JT, Walther TC, Jr R (2014) Lipid droplet biogenesis. Curr Opin Cell Biol 59: 88-96.
  8. Olzmann James A, Carvalho P (2019) Dynamics and functions of lipid droplets. Nat Rev Mol Cell Biol 20: 137-155. [crossref]
  9. Liu L, Zhang K, Sandoval H, Yamamoto S, Jaiswal M, et al. (2015) Glial lipid droplets and ROS induced by mitochondrial defects promote neurodegeneration. Cell 160: 177-190.
  10. Yoon H, Shaw JL, Haigis MC, Greka A (2021) Lipid metabolism in sickness and in health: Emerging regulators of lipotoxicity. Mol Cell 81: 3708-3730. [crossref]
  11. Ioannou MS, Jackson J, Sheu SH, Chang CL, Liu Z (2019) Neuron-Astrocyte Metabolic Coupling Protects against Activity-Induced Fatty Acid Toxicity. Cell 177: 1522-1535.
  12. Liu L, Mackenzie KR, Putluri N, Maleti-Savati M, Bellen HJ (2017) The Glia-Neuron lactate shuttle and elevated ROS promote lipid synthesis in neurons and lipid droplet accumulation in glia via APOE/D. Cell Metab 26: 719-737. [crossref]
  13. Magistretti PJ, Allaman I (2018) Lactate in the brain: From metabolic endproduct to signalling molecule. Nat Rev Neurosci 19: 235-249. [crossref]
  14. Magistretti PPJ (1994) Glutamate uptake into astrocytes stimulates aerobic glycolysis: A mechanism coupling neuronal activity to glucose utilization. Proceedings of the National Academy of ences of the United States of America 91: 10625-10629. [crossref]
  15. Alexei, Verkhratsky, Vladimir, Parpura, Nina, Vardjan, et al. (2019) Physiology of astroglia. Adv Exp Med Biol 1175: 45-91.
  16. Afridi R, Kim JH, Rahman MH, Suk K (2020) Metabolic regulation of glial phenotypes: Implications in neuron-glia interactions and neurological disorders. Front Cell Neurosci 14: 20. [crossref]
  17. Sharma K, Schmitt S, Bergner CG, Tyanova S, Kannaiyan N, et al. (2015) Cell type- and brain region-resolved mouse brain proteome. Nat Neurosci 18: 1819-1831. [crossref]
  18. Zhang Y, Chen K, Sloan SA, Bennett ML, Scholze AR, O Keeffe S, et al. (2014) An RNA-Sequencing transcriptome and splicing database of glia, neurons, and vascular cells of the cerebral cortex. J Neurosci 34: 11929-11947. [crossref]
  19. Abe T, Takahashi S, Suzuki N (2006) Oxidative metabolism in cultured rat astroglia: Effects of reducing the glucose concentration in the culture medium and of D-aspartate or potassium stimulation. Journal of Cerebral Blood Flow & Metabolism J Cereb Blood Flow Metab 26: 153-160. [crossref]
  20. Goyal MS, Hawrylycz M, Miller JA, Snyder AZ, Raichle ME (2014) Aerobic glycolysis in the human brain is associated with development and neotenous gene expression. Cell Metab 19: 49-57. [crossref]
  21. Dienel GA (2019) Brain glucose metabolism: Integration of energetics with function. Physiol Rev 99: 949-1045. [crossref]
  22. Dienel GA, Cruz NF (2016) Aerobic glycolysis during brain activation: Adrenergic regulation and influence of norepinephrine on astrocytic metabolism. J Neurochem 138: 14-52. [crossref]
  23. Ramasamy Indra (2014) Recent advances in physiological lipoprotein metabolism. Clin Chem Lab Med 52. [crossref]
  24. Filou S, Lhomme M, Karavia EA, Kalogeropoulou C, Theodoropoulos V, et al (2016) Distinct roles of apolipoproteins a1 and e in the modulation of High-Density lipoprotein composition and function. Biochemistry 55: 3752-3762 [crossref]
  25. Bolanos-Garcia VM, Miguel RN (2003) On the structure and function of apolipoproteins: More than a family of lipid-binding proteins. Prog Biophys Mol Biol 83: 47-68. [crossref]
  26. Ito JI, Nagayasu Y, Miura Y, Yokoyama S, Michikawa M (2014) Astrocytes endogenous apoE generates HDL-like lipoproteins using previously synthesized cholesterol through interaction with ABCA1. Brain Res 1570: 1-12. [crossref]
  27. Center M, Francisco S Introduction to lipids and lipoproteins.
  28. Pitas RE, Boyles JK, Lee SH, Foss D, Mahley RW (1987) Astrocytes synthesize apolipoprotein E and metabolize apolipoprotein E-containing lipoproteins. Biochim Biophys Acta 917: 148-161. [crossref]
  29. Balazs Z, Panzenboeck U, Hammer A, Sovic A, Quehenberger O, et al. (2010) Uptake and transport of high-density lipoprotein (HDL) and HDLassociated alpha-tocopherol by an in vitro blood-brain barrier model. J Neurochem 89: 939-950. [crossref]
  30. Braun V, Hantke K (2019) Lipoproteins: Structure, function, biosynthesis. Subcell Biochem 92: 39-77. [crossref]
  31. Hoofnagle AN, Heinecke JW (2009) Lipoproteomics: Using mass spectrometry-based proteomics to explore the assembly, structure, and function of lipoproteins. J Lipid Res 50: 1967-1975. [crossref]
  32. Alaupovic P (1996) Significance of apolipoproteins for structure, function, and classification of plasma lipoproteins. Method Enzymol 263: 32-60. [crossref]
  33. Ghosh S, Strum JC, Bell RM (1997) Lipid biochemistry: Functions of glycerolipids and sphingolipids in cellular signaling. FASEB journal : official publication of the Federation of American Societies for Experimental Biology 11: 45. [crossref]
  34. Zhu X, Owen JS, Wilson MD, Li H, Griffiths GL, et al. (2010) Macrophage ABCA1 reduces MyD88-dependent Toll-like receptor trafficking to lipid rafts by reduction of lipid raft cholesterol. J Lipid Res 51: 3196-3206. [crossref]
  35. Woller SA, Choi S, An EJ, Low H, Schneider DA, Ramachandran R, et al. (2018) Inhibition of neuroinflammation by AIBP: Spinal effects upon facilitated pain states. Cell Rep 23: 2667-2677. [crossref]
  36. Zhang J, Li Q, Wu Y, Wang D, Xu L, Zhang Y, et al. (2019) Cholesterol content in cell membrane maintains surface levels of ErbB2 and confers a therapeutic vulnerability in ErbB2-positive breast cancer. Cell Commun Signal 17. [crossref]
  37. Banach-Orowska M, Wyszyska R, Pyrzyska B, Maksymowicz M, et al. (2019) Cholesterol restricts lymphotoxin receptor-triggered NF-B signaling. Cell Commun Signal 17. [crossref]
  38. Luchtman DW, Song C (2013) Cognitive enhancement by omega-3 fatty acids from child-hood to old age: Findings from animal and clinical studies. Neuropharmacology 64: 550-565. [crossref]
  39. Hamilton JA, Hillard CJ, Spector AA, Watkins PA (2007) Brain uptake and utilization of fatty acids, lipids and lipoproteins: Application to neurological disorders. J Mol Neurosci 33: 2-11. [crossref]
  40. Dawson G 1999 Basic Neurochemistry, 6th Edition. J Neurosci Res
  41. Subramaniam S, Fahy E, Gupta S, Sud M, Byrnes RW, et al. (2011) Bioinformatics and systems biology of the lipidome. Chem Rev 111: 6452-6490. [crossref]
  42. Han X (2016) Lipidomics for studying metabolism. Nat Rev Endocrinol 12: 668-679. [crossref]
  43. Li M, Yang L, Bai Y, Liu H (2014) Analytical methods in lipidomics and their applications. Anal Chem 86: 161-175. [crossref]
  44. Cermenati G, Mitro N, Audano M, et al. (2015) Lipids in the nervous system: From biochemistry and molecular biology to patho-physiology. Biochim Biophys Acta 1851: 51-60. [crossref]
  45. Qiuhui X, Chunxiu H, Di Y, Melcangi RC, Crestani M, et al. (2018) Development of a high coverage pseudotargeted lipidomics method based on UltraHigh performance liquid Chromatography-Mass spectrometry. Anal Chem 90: 7608-7616. [crossref]
  46. Wood PL, Cebak JE (2018) Lipidomics biomarker studies: Errors, limitations, and the future. Biochem Biophys Res Commun 504: 569-575. [crossref]
  47. Rustam YH, Reid GE (2017) Analytical challenges and recent advances in mass spectrometry based lipidomics. Anal Chem 90: 374-397. [crossref]
  48. Chaves ED, Rusinol AE, Vance DE, Campenot RB, Vance JE (1997) Role of lipoproteins in the delivery of lipids to axons during axonal regeneration. J Biol Chem 272: 30766-30773. [crossref]
  49. Fester L, Zhou L, Bütow A, Huber C, von Lossow R, et al. (2009) Cholesterol promoted synaptogenesis requires the conversion of cholesterol to estradiol in the hippocampus. Hippocampus 19: 692-705. [crossref]
  50. Sang N, Chen C (2006) Lipid signalling and synaptic plasticity. Neuroscientist 12: 425-434. [crossref]
  51. Hussain G, Wang J, Rasul A, et al. (2019) Role of cholesterol and sphingolipids in brain development and neurological diseases. Lipids Health Dis 18: 1-2. [crossref]
  52. Jorge C, Farez MF (2015) The role of astrocytes in multiple sclerosis progression. Front Neurol 6: 180. [crossref]
  53. Joe EH, Choi DJ, An J, et al. (2018) Astrocytes, microglia, and parkinson’s disease. Exp Neurobiol 27: 77-87. [crossref]
  54. Almad A, Maragakis NJ (2018) A stocked toolbox for understanding the role of astrocytes in disease. Nat Rev Neurol 14: 351-362. [crossref]
  55. Belanger M, Allaman I, Magistretti PJ (2011) Brain energy metabolism: Focus on astrocyte-neuron metabolic cooperation. Cell Metab 14: 724-738. [crossref]
  56. Ullian EM, Sapperstein SK, Christopherson KS, et al. (2001) Control of synapse number by glia. Science 291: 657-661. [crossref]
  57. Varcianna A, Myszczynska MA, Castelli LM, et al. (2018) Micro-RNAs secreted through astrocyte-derived extracellular vesicles cause neuronal network degeneration in C9orf72 ALS. Ebiomedicine 40: 626-635. [crossref]
  58. Chung WS, Allen NJ, Eroglu C (2015) Astrocytes control synapse formation, function, and elimination. Cold Spring Harb Perspect Biol 7: a020370. [crossref]
  59. Sofroniew MV, Vinters HV, Vinters HV (2013) REVIEW Astrocytes: Biology and pathology. Acta Neuropathol 119: 7-35. [crossref]
  60. Deitmer JW, Theparambil SM, Ruminot I, et al. (2019) Energy dynamics in the brain: Contributions of astrocytes to metabolism and pH homeostasis. Front Neurosci-Switz 13: 1301. [crossref]
  61. Ballabh P, Braun A, Nedergaard M (2004) The blood-brain barrier: An overview: Structure, regulation, and clinical implications. Neurobiol Dis 16: 1-13. [crossref]
  62. Abbott NJ, Patabendige AAK, Dolman DEM, et al (2010) Structure and function of the blood–brain barrier. Neurobiol Dis 37: 13-25. [crossref]
  63. Edmond J (2001) Essential polyunsaturated fatty acids and the barrier to the brain. J Mol Neurosci 16: 181-193. [crossref]
  64. Mitchell RW, Hatch GM (2011) Fatty acid transport into the brain: Of fatty acid fables and lipid tails. Prostaglandins Leukot Essent. Fatty Acids 85: 293-302. [crossref]
  65. Saunders NR, Ek CJ, Habgood MD (2008) Barriers in the brain: A renaissance? Trends Neurosci 31: 279-286. [crossref]
  66. Bradbury MW (1984) The structure and function of the blood-brain barrier. Federation Proceedings 43: 186-190.
  67. Betsholtz C (2014) Physiology: Double function at the blood brain barrier. Nature 509: 432-433.
  68. Daneman R, Prat A (2015) The Blood鈥揃rain Barrier. Csh Perspect Biol 7: 32-34.
  69. Ferreira L (2019) What human blood-brain barrier models can tell us about BBB function and drug discovery? Expert Opin Drug Dis 14: 1113-1123. [crossref]
  70. Moura RP, Martins C, Pinto S, et al. (2019) Blood-brain barrier receptors and transporters: An insight on their function and how to exploit them through nanotechnology. Expert Opin Drug Del 16: 271-285. [crossref]
  71. Dienel GA, Cruz NF (2016) Aerobic glycolysis during brain activation: Adrenergic regulation and influence of norepinephrine on astrocytic metabolism. J Neurochem 138: 14-52. [crossref]
  72. Goyal MS, Hawrylycz M, Miller JA, et al. (2014) Aerobic glycolysis in the human brain is associated with development and neotenous gene expression. Cell Metab 19: 49-57. [crossref]
  73. Abe T, Takahashi S, Suzuki N (2006) Oxidative metabolism in cultured rat astroglia: Effects of reducing the glucose concentration in the culture medium and of D-aspartate or potassium stimulation. J Cereb Blood Flow Metab 26: 153-160. [crossref]
  74. Cataldo AM, Broadwell RD (1986) Cytochemical identification of cerebral glycogen and glucose-6-phosphatase activity under normal and experimental conditions. II. Choroid plexus and ependymal epithelia, endothelia and pericytes. J Neurocytol 15: 511-524. [crossref]
  75. Pfeiffer-Guglielmi B, Fleckenstein B, Jung G, et al. (2010) Immunocytochemical localization of glycogen phosphorylase isozymes in rat nervous tissues by using isozyme-specific antibodies. J Neurochem 85: 73-81. [crossref]
  76. Camargo N, Goudriaan A, Deijk ALFV, et al. (2017) Oligodendroglial myelination requires astrocyte-derived lipids. Plos Biol 15: e1002605. [crossref]
  77. Van Deijk ALF, Camargo N, Timmerman J, et al. (2017) Astrocyte lipid metabolism is critical for synapse development and function in vivo. 65: 670-682. [crossref]
  78. Ioannou MS, Jesse J, Shu-Hsien S, et al. (2020) Neuron-Astrocyte Metabolic Coupling Protects against Activity-Induced Fatty Acid Toxicity. Cell 177: 1522-1535. [crossref]
  79. Ebert D, Haller RG, Walton ME (2003) Energy contribution of octanoate to intact rat brain metabolism measured by 13C nuclear magnetic resonance spectroscopy. J Neurosci 23: 5928-5935. [crossref]
  80. Chang CY, Ke DS, Chen JY (2009) Essential fatty acids and human brain. Acta Neurol Taiwan 18: 231-241. [crossref]
  81. Edmond J, Robbins RA, Bergstrom JD, et al. (2010) Capacity for substrate utilization in oxidative metabolism by neurons, astrocytes, and oligodendrocytes from developing brain in primary culture. J Neurosci Res 18: 551-561. [crossref]
  82. Takahashi S, Iizumi T, Mashima K, et al. (2014) Roles and regulation of ketogenesis in cultured astroglia and neurons under hypoxia and hypoglycemia. Asn Neuro 6: [crossref]
  83. Simard JR, Pillai BK, Hamilton JA (2008) Fatty acid flip-flop in a model membrane is faster than desorption into the aqueous phase. Biochemistry 47: 9081-9089. [crossref]
  84. Mitchell RW, On NH, Bigio MRD, et al. (2011) Fatty acid transport protein expression in human brain and potential role in fatty acid transport across human brain microvessel endothelial cells. J Neurochem 117: 735-746. [crossref]
  85. Marianne Haag (2003) Essential fatty acids and the brain. Can J Psychiatry 48: 195-203.
  86. Tracey TJ, Steyn FJ, Wolvetang EJ, et al. (2018) Neuronal lipid metabolism: Multiple pathways driving functional outcomes in health and disease. Front Mol Neurosci 11: 10. [crossref]
  87. Crawford MA, Casperd NM, Sinclair AJ (1976) The long chain metabolites of linoleic and linolenic acid in liver and brain in herbivores and carnivores. Comparative biochemistry and physiology. Comp Biochem Physiol B 54: 395-401. [crossref]
  88. Crawford MA, Broadhurst CL, Guest M, et al. (2013) A quantum theory for the irreplaceable role of docosahexaenoic acid in neural cell signalling throughout evolution. Prostaglandins Leukot Essent Fatty Acids 88: 5-13. [crossref]
  89. Bazinet RP, Lay S (2014) Polyunsaturated fatty acids and their metabolites in brain function and disease. Nat Rev Neurosci 15: 771-785. [crossref]
  90. Luchtman DW, Song C (2013) Cognitive enhancement by omega-3 fatty acids from child-hood to old age: Findings from animal and clinical studies. 64: 550-565. [crossref]
  91. Denis I, Potier B, Vancassel S, et al (2013) Omega-3 fatty acids and brain resistance to ageing and stress: Body of evidence and possible mechanisms. Ageing Res Rev 12: 579-594. [crossref]
  92. Igarashi M, Santos RA, Cohen-Cory S (2015) Impact of Maternal n-3 Polyunsaturated Fatty Acid Deficiency on Dendritic Arbor Morphology and Connectivity of DevelopingXenopus laevisCentral NeuronsIn Vivo. J Neurosci 35: 6079-6092. [crossref]
  93. Lim GP, Calon F, Morihara T, et al. (2005) A diet enriched with the omega-3 fatty acid docosahexaenoic acid reduces amyloid burden in an aged alzheimer mouse model. J Neurosci 25: 3032-3040. [crossref]
  94. Michael A, Crawford (2006) Docosahexaenoic acid in neural signaling systems. Nutrition & Health
  95. Hamilton JA, Hillard CJ, Spector AA, et al. (2007) Brain uptake and utilization of fatty acids, lipids and lipoproteins: Application to neurological disorders. J Mol Neurosci 33: 2-11. [crossref]
  96. Farooqui AA, Horrocks LA, Farooqui T (2000) Glycerophospholipids in brain: Their metabolism, incorporation into membranes, functions, and involvement in neurological disorders. Chem Phys Lipids 106: 1-29. [crossref]
  97. Van Meer G, Voelker DR, Feigenson GW (2008) Membrane lipids: Where they are and how they behave. Nat Rev Mol Cell Bio 9: 112-124. [crossref]
  98. Harayama T, Riezman H (2018) Understanding the diversity of membrane lipid composition. Nat Rev Mol Cell Biol 19: 281-296. [crossref]
  99. Li J, Wang X, Zhang T, et al. (2015) A review on phospholipids and their main applications in drug delivery systems. Asian J Pharm Sci 10: 81-98. [crossref]
  100. Ross BM, Moszczynska A, Blusztajn JK, et al. (1997) Phospholipid biosynthetic enzymes in human brain. Lipids 32: 351-358. [crossref]
  101. Paltauf F, Hermetter A (1990) Phospholipids natural, semisynthetic, synthetic: Phospholipids 1-12. [crossref]
  102. Tracey TJ, Steyn FJ, Wolvetang EJ, et al. (2018) Neuronal lipid metabolism: Multiple pathways driving functional outcomes in health and disease. Front Mol Neurosci 11: 10. [crossref]
  103. Montaner A, da Silva Santana TT, Schroeder T, et al. (2018) Author correction: Specific phospholipids regulate the acquisition of neuronal and astroglial identities in Post-Mitotic cells. Sci Rep 9: 20222. [crossref]
  104. Sonnino S, Prinetti A (2012) Membrane domains and the lipid raft concept. Curr Med Chem. 20: 4-21. [crossref]
  105. West RJ, Briggs L, Perona Fjeldstad M (2018) Sphingolipids Regulate Neuromuscular Synapse Structure and function in Drosophila. J Comp Neurol 526: 1995-2009. [crossref]
  106. Vance Dennis E (2008) Biochemistry of lipids, lipoproteins and membranes (Fifth edition).:v-vi
  107. Hannun YA, Obeid LM (2018) Author Correction: Sphingolipids and their metabolism in physiology and disease. Nat Rev Mol Cell Bio 19: 673. [crossref]
  108. Schnaar Ronald L (2016) Gangliosides of the vertebrate nervous system. J Mol Biol 428: 3325-3336. [crossref]
  109. Novgorodov SA, Voltin JR, Wang W, et al. (2019) Acid sphingomyelinase deficiency protects mitochondria and improves function recovery after brain injury. J Lipid Res 60: 609-623. [crossref]
  110. Hartmann D, Lucks J, Fuchs S, et al. (2012) Long chain ceramides and very long chain ceramides have opposite effects on human breast and colon cancer cell growth. Int J Biochem Cell Biol 44: 620-628. [crossref]
  111. Xu R, Wang K, Mileva I, et al. (2016) Alkaline ceramidase 2 and its bioactive product sphingosine are novel regulators of the DNA damage response. Oncotarget 7: 18440-18457. [crossref]
  112. Gomez-Mu Oz A, Presa N, Gomez-Larrauri A, et al. (2016) Control of inflammatory responses by ceramide, sphingosine 1phosphate and ceramide 1-phosphate. Prog Lipid Res 61: 51-62. [crossref]
  113. Blom T, Somerharju P, Ikonen E (2011) Synthesis and biosynthetic trafficking of membrane lipids. Cold Spring Harb Perspect Biol 3: a4713. [crossref]
  114. Björkhem I, Meaney S (2004) Brain cholesterol: Long secret life behind a barrier. Arterioscler Thromb Vasc Biol 24: 806-815. [crossref]
  115. Kang S, Kim CH, Jung H, et al. (2017) Agmatine ameliorates type 2 diabetes induced-Alzheimer’s disease-like alterations in high-fat diet-fed mice via reactivation of blunted insulin signalling. Neuropharmacology 113: 467-479. [crossref]
  116. Saeed AA, Genove G, Li T, Lutjohann D, Olin M, et al. (2014) Effects of a disrupted Blood-Brain barrier on cholesterol homeostasis in the brain. J Biol Chem [crossref]
  117. Reinhart MP, Billheimer JT, Faust JR, Gaylor JL (1987) Subcellular localization of the enzymes of cholesterol biosynthesis and metabolism in rat liver. J Biol Chem 262: 9649. [crossref]
  118. Muse ED, Jurevics H, Toews AD, Matsushima GK, Morell P (2010) Parameters related to lipid metabolism as markers of myelination in mouse brain. J Neurochem 76: 77-86. [crossref]
  119. Zarrouk, Amira, Debbabi, Meryam, Bezine, Maryem, et al. (2018) Lipid biomarkers in alzheimer’s disease. Curr Alzheimer Res 15: 303-312. [crossref]
  120. Genaro-Mattos TC, Anderson A, Allen LB, Korade Z, Mirnics K (2019) Cholesterol biosynthesis and uptake in developing neurons. Acs Chem Neurosci [crossref]
  121. Deijk V, Anne-Lieke F, Camargo, Nutabi, Timmerman Jaap, et al. (2017) Astrocyte lipid metabolism is critical for synapse development and function in vivo. Glia 65: 670-682. [crossref]
  122. Wang H, Eckel RH (2014) What are lipoproteins doing in the brain? Trends in Endocrinology & Metabolism Tem 25: 8-14. [crossref]
  123. Orth M, Bellosta S (2012) Cholesterol: Its regulation and role in central nervous system disorders. Cholesterol 2012: 292598. [crossref]
  124. Pitas RE, Boyles JK, Lee SH, Hui D, Weisgraber KH (1987) Lipoproteins and their receptors in the central nervous system. Characterization of the lipoproteins in cerebrospinal fluid and identification of apolipoprotein B,E (LDL) receptors in the brain. J Biol Chem 262: 14352-14360. [crossref]
  125. Jing C, Zhang X, Kusumo H, Costa LG, Guizzetti M (2013) Cholesterol efflux is differentially regulated in neurons and astrocytes: Implications for brain cholesterol homeostasis. Biochim Biophys Acta 1831. [crossref]
  126. Rushworth JV, Hooper NM (2010) Lipid rafts: Linking alzheimer’s amyloidbeta production, aggregation, and toxicity at neuronal membranes. International Journal of Alzheimer’s Disease 2011: 603052. [crossref]
  127. Kabouridis PS, Janzen J, Magee AL, Ley SC (2015) Cholesterol depletion disrupts lipid rafts and modulates the activity of multiple signaling pathways in T lymphocytes. Eur J Immunol 30: 954-963. [crossref]
  128. Pike LJ (2003) Lipid rafts bringing order to chaos. J Lipid Res 44: 655-667. [crossref]
  129. Hussain G, Wang J, Rasul A, Anwar H, Imran A, et al. (2019) Role of cholesterol and sphingolipids in brain development and neurological diseases. Lipids Health Dis 18. [crossref]
  130. Mauch DH, Ngler K, Schumacher S, Gritz C, Miller E, Otto A, et al. (2001) CNS synaptogenesis promoted by Glia-Derived cholesterol. Science 294. [crossref]
  131. Fukui K, Ferris HA, Kahn CR (2015) Effect of Cholesterol Reduction on Receptor Signaling in Neurons. J Biol Chem 290: 26383-26392. [crossref]
  132. Chaves ED, Rusinol AE, Vance DE, Campenot RB, Vance JE (1997) Role of lipoproteins in the delivery of lipids to axons during axonal regeneration. J Biol Chem 272: 30766. [crossref]
  133. Xue-Shan Z, Juan P, Qi W, Zhong R, Li-Hong P, et al. (2016) Imbalanced cholesterol metabolism in Alzheimer’s disease. Clin Chim Acta 456: 107-114. [crossref]
  134. Kandimalla R, Thirumala V, Reddy PH (2016) Is Alzheimer’s disease a Type 3 Diabetes? A Critical Appraisal. Biochimica et Biophysica Acta 1863: 1078-1089. [crossref]
  135. S Sonnino, A Prinetti (2013) Membrane domains and the “lipid raft” concept. Curr Med Chem [crossref]
  136. Caliceti C, Zambonin L, Prata C, Sega F, Hakim G, et al. (2012) Effect of plasma membrane cholesterol depletion on glucose transport regulation in leukemia cells. Plos One 7. [crossref]
  137. Group BMJP (2009) Alzheimer’s disease. BMJ 338.
  138. Mattson MP (2016) Pathways towards and away from Alzheimer’s disease. Nature 430: 631-639. [crossref]
  139. Vishal S, Sourabh A, Harkirat S (2011) Alois Alzheimer (1864-1915) and the Alzheimer syndrome. Journal of Medical Biography 19: 32-33. [crossref]
  140. D’Errico P, Luehmann MM (2020) Mechanisms of pathogenic tau and a protein spreading in alzheimer’s disease. Front Aging Neurosci 12: 265. [crossref]
  141. Braak H, Braak E (1991) Neuropathological stageing of Alzheimer-related changes. Acta Neuropathol 82: 239-259. [crossref]
  142. El Kadmiri, Said N, Slassi Ilham, Moutawakil BE, Nadifi S (2018) Biomarkers for alzheimer disease: Classical and novel candidates’ review. Neuroscience 370: 181-190. [crossref]
  143. Foley P (2010) Lipids in Alzheimer’s disease: A century-old story. BBA – Molecular and Cell Biology of Lipids 1801: 750-753. [crossref]
  144. Alzheimer A (1907) Uber eine eigenartige Erkrankung der Hirnride. Allg.z.psychiatr
  145. Kim M, Nevado-Holgado A, Whiley L, Snowden SG, Soininen H, et al. (2016) Association between plasma ceramides and phosphatidylcholines and hippocampal brain volume in late onset alzheimer’s disease. Journal of Alzheimers Disease 60: 809-817. [crossref]
  146. González-Domínguez R, García-Barrera T, Vitorica J, Gómez-Ariza JL (2015) Metabolomic screening of regional brain alterations in the APP/PS1 transgenic model of Alzheimer’s disease by direct infusion mass spectrometry. J Pharmaceut Biomed 102: 425-435. [crossref]
  147. Bennett S, Valenzuela N, Xu H, Franko B, Fai S, et al. (2013) Using neurolipidomics to identify phospholipid mediators of synaptic (dys)function in Alzheimer’s Disease. Front Physiol 4: 168. [crossref]
  148. Kao YC, Ho PC, Tu YK, Jou IM, Tsai KJ (2020) Lipids and alzheimer’s disease. Int J Mol Sci 21: 1505. [crossref]
  149. Grimm MO, Michaelson D, Hartmann T (2017) Omega-3 fatty acids, lipids and apoE lipidation in Alzheimer’s disease: A rationale for multi-nutrient dementia prevention. J Lipid Res 58: 2083-2101. [crossref]
  150. Wood PL (2012) Lipidomics of Alzheimer’s disease: Current status. Alzheimers Research & Therapy 4: 5. [crossref]
  151. Bales KR (2010) Brain lipid metabolism, apolipoprotein E and the pathophysiology of Alzheimer’s disease. Neuropharmacology 59: 295-302. [crossref]
  152. Ledesma MD, Martin MG, Dotti CG (2012) Lipid changes in the aged brain: Effect on synaptic function and neuronal survival. Prog Lipid Res 51: 23-35. [crossref]
  153. Sultana R, Perluigi M, Allan Butterfield D (2013) Lipid peroxidation triggers neurodegeneration: A redox proteomics view into the Alzheimer disease brain. Free Radical Biology & Medicine 62: 157-169. [crossref]
  154. Tian-Bi, Zhu, Zhao, Zhang, Piao, Luo, et al. (2018) Lipid metabolism in Alzheimer’s disease. Brain Res Bull
  155. Nasaruddin ML, Holscher C, Kehoe P, Graham SF, Green BD (2016) Wideranging alterations in the brain fatty acid complement of subjects with late Alzheimer’s disease as detected by GC-MS. Am J Transl Res 8: 154-165. [crossref]
  156. Nasaruddin ML, Pan X, Mcguinness B, Passmore P, Kehoe PG, et al. (2018) Evidence that parietal lobe fatty acids may be more profoundly affected in moderate alzheimer’s disease (AD) pathology than in severe AD pathology. Metabolites 8: 69. [crossref]
  157. Wood PL, Barnette BL, Kaye JA, Quinn JF, Woltjer RL (2015) Non-targeted lipidomics of CSF and frontal cortex grey and white matter in control, mild cognitive impairment, and Alzheimer’s disease subjects. Acta Neuropsychiatr 27: 270-278. [crossref]
  158. Belkouch M, Hachem M, Elgot A, Van AL, Picq M, et al. (2016) The pleiotropic effects of omega-3 docosahexaenoic acid on the hallmarks of Alzheimer’s disease. J Nutr Biochem 38: 1-11. [crossref]
  159. Sarrafpour S, Ormseth C, Chiang A, Arakaki X, Harrington M, et al. (2019) Lipid Metabolism in Late-Onset Alzheimer’s Disease Differs from Patients Presenting with Other Dementia Phenotypes. Int J Env Res Pub He 16: 1995. [crossref]
  160. Wong MW, Braidy N, Poljak A, Pickford R, Thambisetty M (2017) Dysregulation of lipids in Alzheimer’s disease and their role as potential biomarkers. Alzheimer’s & Dementia 13: 810-827. [crossref]
  161. Xiong H, Callaghan D, Jones A, Walker DG, Lue LF, et al. (2008) Cholesterol retention in Alzheimer’s brain is responsible for high – and secretase activities and a production. Neurobiol Dis 29: 422-437. [crossref]
  162. Pfrieger FW (2003) Cholesterol homeostasis and function in neurons of the central nervous system. Cellular & Molecular Life Sciences 60: 1158-1171. [crossref]
  163. Chang TY, Yamauchi Y, Hasan MT, Chang C (2017) Cellular cholesterol homeostasis and Alzheimers J Lipid Res 58: 2239-2254. [crossref]
  164. Scala CD, Chahinian H, Yahi N, Garmy N, Fantini J (2014) Interaction of alzheimer’s-Amyloid peptides with cholesterol: Mechanistic insights into amyloid pore formation. Biochemistry 53: 4489-4502. [crossref]
  165. Area-Gomez E, Maria DCLC, Tambini MD, Guardia-Laguarta C, De Groof AJC, et al. (2012) Upregulated function of mitochondria-associated ER membranes in Alzheimer disease. Embo J 31: 4106-4123.
  166. Area-Gomez E, Schon EA (2016) Mitochondria-associated ER membranes and Alzheimer disease. Curr Opin Genet Dev 38: 90-96. [crossref]
  167. Pera M, Larrea D, Guardia Laguarta C, Montesinos J, Velasco KR, Agrawal RR, et al. (2017) Increased localization of APP C99 in mitochondria associated ER membranes causes mitochondrial dysfunction in Alzheimer disease. The EMBO Journal 36: 3356-3371. [crossref]
  168. Pera M, Montesinos J, Larrea D, Agrawal RR, Area-Gomez E (2020) MAM and C99, key players in the pathogenesis of Alzheimer’s disease. Int Rev Neurobiol 154: 235-278. [crossref]
  169. Andrew P Bailey, Grielof Koster, Christelle Guillermier, Hirst EMA, Macrae JI, et al. (2015) Antioxidant role for lipid droplets in a stem cell niche of drosophila. Cell 163: 340-353. [crossref]
  170. Liu L, Zhang K, Sandoval H, Yamamoto S, Jaiswal M, et al. (2015) Glial lipid droplets and ROS induced by mitochondrial defects promote neurodegeneration. Cell 160: 177-190. [crossref]
  171. Liu L, Mackenzie KR, Putluri N, Maleti-Savati M, Bellen HJ (2017) The Glia-Neuron lactate shuttle and elevated ROS promote lipid synthesis in neurons and lipid droplet accumulation in glia via APOE/D. Cell Metab 26: 719-737. [crossref]
  172. Wong MW, Braidy N, Poljak A, Sachdev PS (2017) The application of lipidomics to biomarker research and pathomechanisms in Alzheimer’s disease. Curr Opin Psychiatr 30: 136-144. [crossref]
  173. Zhamg AH, Ma MZ, Kong L, Gao HL, Sun H (2020) High-throughput lipidomics analysis to discover lipid biomarkers and profiles as potential targets for evaluating efficacy of an against APP/PS1 transgenic mice based on UPLC S. Biomed Chromatogr 34: 4724. [crossref]
  174. Barupal DK, Baillie R, Fan S, Saykin AJ, Kaddurah-Daouk R (2019) Sets of coregulated serum lipids are associated with Alzheimer’s disease pathophysiology. Alzheimer s & Dementia Diagnosis Assessment & Disease Monitoring 11: 619-627. [crossref]
  175. Kim J, Basak JM, Holtzman DM (2009) The role of apolipoprotein e in alzheimer’s disease. Neuron 63: 287-303. [crossref]
  176. Monteiro-Cardoso VF, Oliveira MM, Melo T, Domingues MRM, Videira RA (2015) Cardiolipin profile changes are associated to the early synaptic mitochondrial dysfunction in alzheimer’s disease. Journal of Alzheimers Disease 43: 1375-1392. [crossref]
  177. Basu Ball W, Neff JK, Gohil VM (2017) The role of nonbilayer phospholipids in mitochondrial structure and function. Febs Lett 592: 1273-1290. [crossref]
  178. Calzada E, Onguka O, Claypool SM (2016) Phosphatidylethanolamine metabolism in health and disease. Int Rev Cel Mol Bio 321: 29-88. [crossref]
  179. Fonteh AN, Cipolla M, Chiang J, Arakaki X, Harrington MG (2014) Human cerebrospinal fluid fatty acid levels differ between supernatant fluid and Brain Derived nanoparticle fractions, and are altered in alzheimer’s disease. Plos One 9: 100519. [crossref]
  180. Giudetti AM, Shu G, Vergara D, Fonteh AN (2020) Polyunsaturated fatty acid composition of cerebrospinal fluid fractions shows their contribution to cognitive resilience of a pre-symptomatic alzheimer’s disease cohort. Front Physiol 11: 1-14.
  181. Wilde MD, Vellas B, Girault E, Yavuz AC, Sijben JW (2017) Lower brain and blood nutrient status in Alzheimer’s disease: Results from meta-analyses. Alzheimers & Dementia: Translational Research & Clinical Interventions 3: 416-431. [crossref]
  182. Snowden SG, Ebshiana AA, Hye A, An Y, Thambisetty M (2017) Association between fatty acid metabolism in the brain and Alzheimer disease neuropathology and cognitive performance: A nontargeted metabolomic study. Plos Med 14: 1002266. [crossref]
  183. Mh A, Apab C, Nb A, Jc A, Psa D (2020) Blood fatty acids in Alzheimer’s disease and mild cognitive impairment: A meta-analysis and systematic review. Ageing Res Rev 60: 101043. [crossref]
  184. Wood PL, Barnette BL, Kaye JA, Quinn JF, Woltjer RL (2015) Non-targeted lipidomics of CSF and frontal cortex grey and white matter in control, mild cognitive impairment and Alzheimer’s disease subjects. Acta Neuropsychiatr 27: 270-278. [crossref]
  185. Dyall SC (2015) Long-chain omega-3 fatty acids and the brain: A review of the independent and shared effects of EPA, DPA and DHA. Front Aging Neurosci 7: 52. [crossref]
  186. Di Iorio, Benedetta Bartali, Annamaria Corsi, Stefania Bandinelli, Mark P Mattson, et al. (2007) Low plasma N-3 fatty acids and dementia in older persons: The InCHIANTI study. J Gerontol A Biol Med 62: 1120-1126. [crossref]
  187. Thomas MH, Pelleieux S, Vitale N, Olivier JL (2016) Dietary arachidonic acid as a risk factor for age-associated neurodegenerative diseases: Potential mechanisms. Biochimie: 168-177. [crossref]
  188. Goozee K, Chatterjee P, James I, Shen K, Sohrabi HR, Asih PR, et al. (2017) Alterations in erythrocyte fatty acid composition in preclinical Alzheimer’s disease. Sci Rep-Uk
    7.
  189. Prasad MR, Lovell MA, Yatin M, Dhillon H, Markesbery WR (1998) Regional membrane phospholipid alterations in alzheimer’s disease. Neurochem Res 23: 81-88. [crossref]
  190. Cunnane SC, Schneider JA, Tangney C, Tremblay-Mercier J, Morris MC (2012) Plasma and brain fatty acid profiles in mild cognitive impairment and alzheimer’s disease. Journal of Alzheimer’s disease: JAD 29: 691-697. [crossref]
  191. Iwamoto N, Kobayashi K, Kosaka K (1989) The formation of prostaglandins in the postmortem cerebral cortex of Alzheimer-type dementia patients. J Neurol 236: 80-84. [crossref]
  192. Wood PL (2012) Lipidomics of Alzheimer’s disease: Current status. Alzheimers Research & Therapy 4: 5. [crossref]
  193. Fonteh AN, Chiang J, Cipolla M, Hale J, Diallo F, et al. (2013) Alterations in cerebrospinal fluid glycerophospholipids and phospholipase A2 activity in Alzheimer’s disease. J Lipid Res 54: 2884-2897. [crossref]
  194. A LW, A AS, B JH, A PP, C DG, et al. (2014) Evidence of altered phosphatidylcholine metabolism in Alzheimer’s disease. Neurobiol Aging 35: 271-278. [crossref]
  195. Guan Z, Wang Y, Cairns NJ, Lantos PL, Gustav D, et al. (1999) Decrease and structural modifications of phosphatidylethanolamine plasmalogen in the brain with alzheimer disease. J Neuropathol Exp Neurol 58: 740-747. [crossref]
  196. Farooqui AA, Horrocks LA (1998) Plasmalogen-selective phospholipase A2 and its involvement in Alzheimer’s disease. Biochem Soc T 26: 243-246. [crossref]
  197. Filippov V, Song MA, Zhang K, Vinters HV, Duerksen-Hughes PJ (2012) Increased ceramide in brains with alzheimer’s and other neurodegenerative diseases. J Alzheimers Dis 29(3):537-547. [crossref]
  198. Alfred N Fonteh, Cora Ormseth, Jiarong Chiang, Cipolla M, Arakaki X, et al. (2015) Sphingolipid metabolism correlates with cerebrospinal fluid Beta amyloid levels in Alzheimer’s disease. Plos One 10: 0125597. [crossref]
  199. Lepara O, Valjevac A, Alajbegovi A, Zairagi A, Nakas-I indi E (2009) Decreased serum lipids in patients with probable Alzheimer’s disease. Bosnian Journal of Basic Medical ences 9: 215-220. [crossref]
  200. Bernath MM, Bhattacharyya S, Nho K, Barupal DK, Saykin AJ (2018) Serum triglycerides in Alzheimer’s disease: Relation to neuroimaging and CSF biomarkers. Neurology 94: 2088-2098. [crossref]
  201. Hascalovici JR, Vaya J, Khatib S, Holcroft CA, Schipper HM (2009) Brain sterol dysregulation in sporadic AD and MCI: Relationship to heme oxygenase-1. J Neurochem 110: 1241-1253. [crossref]
  202. Heverin M, Bogdanovic N, Lutjohann D, Bayer T, Bjrkhem I (2004) Changes in the levels of cerebral and extracerebral sterols in the brain of patients with Alzheimer’s disease. J Lipid Res 45: 186-193. [crossref]
  203. Tanzi T RE (2018) The genetics of alzheimer disease.
  204. Guerreiro RJ, Gustafson DR, Hardy J (2012) The genetic architecture of Alzheimer’s disease: Beyond APP, PSENs and APOE. Neurobiol Aging 33: 437-456. [crossref]
  205. Holtzman DM, Herz J, Bu G (2012) Apolipoprotein e and apolipoprotein e receptors: Normal biology and roles in alzheimer disease. Csh Perspect Med 2: a6312. [crossref]
  206. RW Mahley (1988) Apolipoprotein E: Cholesterol transport protein with expanding role in cell biology. Science 240: 622-630. [crossref]
  207. Kim J, Basak JM, Holtzman DM (2009) The role of apolipoprotein e in alzheimer’s disease. Neuron 63: 287-303. [crossref]
  208. Serrano-Pozo A, Das S, Hyman BT (2021) APOE and Alzheimer’s disease: Advances in genetics, pathophysiology, and therapeutic approaches. The Lancet Neurology 20: 68-80. [crossref]
  209. Tachibana M, Holm ML, Liu CC, Shinohara M, Kanekiyo T (2019) APOE4mediated amyloid-beta pathology depends on its neuronal receptor LRP1. J Clin Invest 129. [crossref]
  210. Castellano JM, Kim J, Stewart FR, Jiang H, Demattos RB, et al. (2011) Human apoE isoforms differentially regulate brain amyloid-beta peptide clearance. Sci Transl Med 3: 57r-89r. [crossref]
  211. Verghese PB, Castellano JM, Garai K, Wang Y, Hong J, Shah A, et al. (2013) ApoE influences amyloid-{beta} (A{beta}) clearance despite minimal apoE/A{beta} association in physiological conditions. Neuroscience 110: E1807-1816. [crossref]
  212. Basak JM, Verghese PB, Yoon H, Kim J, Holtzman DM (2012) Low-density lipoprotein receptor represents an apolipoprotein E-independent pathway of a uptake and degradation by astrocytes. J Biol Chem 287: 13959-13971. [crossref]
  213. Kanekiyo T, Zhang J, Liu Q, Liu CC, Bu G (2011) Heparan sulphate proteoglycan and the Low-Density lipoprotein Receptor-Related protein 1 constitute major pathways for neuronal amyloid- uptake. The Journal of Neuroscience : The Official Journal of the Society for Neuroscience 31: 1644-1651. [crossref]
  214. Sagare A, Deane R, Bell RD, Johnson B, Hamm K, Pendu R, et al. (2007) Clearance of amyloid-beta by circulating lipoprotein receptors. Nat Med 13: 1029-1031. [crossref]
  215. Castellano JM, Deane R, Gottesdiener AJ, Verghese PB, Stewart FR, et al. (2012) Low-density lipoprotein receptor overexpression enhances the rate of brain-to-blood clearance in a mouse model of-amyloidosis. P Natl Acad Sci Usa 109: 15502. [crossref]
  216. Deane ASBV (2008) The role of the cell surface LRP and soluble LRP in blood-brain barrier Abeta clearance in Alzheimer’s disease. Curr Pharm Design 14. [crossref]
  217. Bales KR, Verina T, Dodel RC, Du Y, Altstiel L, Bender M, et al. (1997) Lack of apolipoprotein E dramatically reduces amyloid |[beta]|-peptide deposition. Nat Genet 17: 263-264. [crossref]
  218. Fryer JD (2005) Human apolipoprotein e4 alters the amyloid-? 40:42 ratio and promotes the formation of cerebral amyloid angiopathy in an amyloid precursor protein transgenic model. J Neurosci 25: 2803-2810. [crossref]
  219. Holtzman DM (2000) Apolipoprotein E isoform-dependent amyloid deposition and neuritic degeneration in a mouse model of Alzheimer’s disease. Proceedings of the National Academy of Sciences 97: 2892-2897. [crossref]
  220. Fagan AM, Watson M, Parsadanian M, Bales KR, Holtzman DM (2002) Human and murine ApoE markedly alters a beta metabolism before and after plaque formation in a mouse model of Alzheimer’s disease. Neurobiol Dis 9: 305-318.
  221. Shadlen MF (1998) Effects of Age and Ethnicity on the Link Between APOE4 and Alzheimer Disease. JAMA [crossref]
  222. Corder EH, Saunders AM, Strittmatter WJ, Schmechel DE, Pericak-Vance MA (1993) Gene dose of Apolipoprotein E type 4 allele and the risk of Alzheimers disease in late onset families. Science 8: 41-43. [crossref]
  223. Saunders AM, Strittmatter WJ, Schmechel D, George-Hyslop PHS, et al. (1993) Association of apolipoprotein E allele epsilon 4 with late-onset familial and sporadic Alzheimer’s disease. Neurology (8). [crossref]
  224. Roses AD (1996) Apolipoprotein E alleles as risk factors in Alzheimer’s disease. Annu Rev Med 47: 387-400. [crossref]
  225. Mahley RW, Huang Y, Rall SC (1999) Pathogenesis of type III hyperlipoproteinemia (dysbetalipoproteinemia): Questions, quandaries, and paradoxes. J Lipid Res 40: 1933-1949. [crossref]
  226. Liu CC, Kanekiyo T, Xu H, Bu G (2013) Apolipoprotein E and Alzheimer disease: Risk, mechanisms and therapy. Nat Rev Neurol 9: 106-118. [crossref]
  227. Strittmatter WJ, Weisgraber KH, Huang DY, Dong LM, Salvesen GS, Pericak-Vance M, et al. (1993) Binding of human apolipoprotein E to synthetic amyloid beta peptide: Isoform-specific effects and implications for late-onset Alzheimer disease. Proc Natl Acad Sci U S A 90: 8098-8102. [crossref]
  228. Lefterov I, Wolfe CM, Fitz NF, et al. (2019) APOE2 orchestrated differences in transcriptomic and lipidomic profiles of postmortem AD brain. Alzheimer’s Research and Therapy 11: 1-6. [crossref]
  229. Juva K, Verkkoniemi A, Viramo P, Polvikoski T, Kainulainen K, et al. (2000) Apolipoprotein e, cognitive function, and dementia in a general population aged 85 years and over. Int Psychogeriatr 12: 379-387. [crossref]
  230. O’Donoghue MC, Murphy SE, Zamboni G, Nobre AC, Mackay CE (2018) APOE genotype and cognition in healthy individuals at risk of Alzheimer’s disease: A review. Cortex 104: 103-123. [crossref]
  231. Trachtenberg AJ, Filippini N, Cheeseman J, et al. (2012) The effects of APOE on brain activity do not simply reflect the risk of Alzheimer’s disease. Neurobiol Aging. 33: 618.e1-618.e13. [crossref]
  232. Boisvert MM, Erikson GA, Shokhirev MN, Allen NJ (2018) The aging astrocyte transcriptome from multiple regions of the mouse brain. Cell Rep 22: 269-285. [crossref]
  233. Zamanian JL, Xu L, Foo LC, Nouri N, Zhou L, et al. (2012) Genomic analysis of reactive astrogliosis. J Neurosci 32: 6391-6410. [crossref]
  234. Zhao N, Ren Y, Yamazaki Y, Qiao W, Li F, et al. (2020) Alzheimer’s risk factors age, APOE genotype, and sex drive distinct molecular pathways. Neuron 106: 727-742. [crossref]
  235. Dulewicz M, Kulczyska-Przybik A, Sowik A, Borawska R, Mroczko B (2021) Fatty acid binding protein 3 (FABP3) and apolipoprotein e4 (ApoE4) as lipid Metabolism-Related biomarkers of alzheimer’s disease. J Clin Med 10: 3009. [crossref]
  236. Rawat V, Wang S, Jian S, Bar R, Liraz O, et al. (2019) ApoE4 alters ABCA1 membrane trafficking in astrocytes. J Neurosci 39: 9611-9622. [crossref]
  237. Qiao F, Gao XP, Yuan L, Cai HY, Qi JS (2014) Apolipoprotein e4 impairs in vivo hippocampal Long-Term synaptic plasticity by reducing the phosphorylation of CaMKII伪 and CREB. Journal of Alzheimers Disease Jad 41: 1165-1176. [crossref]
  238. GA Rodriguez, MP, Burns, Weeber EJ, Rebeck GW (2013) Young APOE4 targeted replacement mice exhibit poor spatial learning and memory, with reduced dendritic spine density in the medial entorhinal cortex. Learn Memory 20: 256-266. [crossref]
  239. Terrisse L, Poirier J, Bertrand P, Merched A, Visvikis S, et al. (1998) Increased levels of apolipoprotein d in cerebrospinal fluid and hippocampus of alzheimer’s patients. J Neurochem 71: 1643-1650. [crossref]
  240. Lin YT, Seo J, Gao F, Feldman HM, Wen HL, et al. (2018) APOE4 causes widespread molecular and cellular alterations associated with alzheimer’s disease phenotypes in human iPSC-Derived brain cell types – ScienceDirect. Neuron 98: 1141-1154. [crossref]
  241. Sienski G, Narayan P, Bonner JM, Kory N, Boland S, et al. APOE4 disrupts intracellular lipid homeostasis in human iPSC-derived glia. Sci Transl Med 13: eaaz4564. [crossref]
  242. Qi G, Mi Y, Shi X, Gu H, Brinton RD, et al. (2021) ApoE4 impairs Neuron-Astrocyte coupling of fatty acid metabolism. Cell Rep 34: 108572. [crossref]
  243. Zhang Y, Chen K, Sloan SA, Bennett ML, Scholze AR, et al. (2014) An RNA-Sequencing transcriptome and splicing database of glia, neurons, and vascular cells of the cerebral cortex. J Neurosci 34: 11929-11947. [crossref]
  244. Watkins PA (1997) Fatty acid activation. Progress in lipid research 36: 55-83.
  245. Uhlén M, Fagerberg L, Hallström BM, Lindskog C, Oksvold P, et al. (2015) Tissue-based map of the human proteome. Science 347: 1260419. [crossref]
  246. Ellis JM, Frahm JL, Li LO, Coleman RA (2010) Acyl-coenzyme a synthetases in metabolic control. Curr Opin Lipidol 21: 212. [crossref]
  247. Steinberg SJ, Morgenthaler J, Heinzer AK, Smith KD, Watkins PA (2000) Very long-chain Acyl-CoA synthetases HUMAN “BUBBLEGUM” REPRESENTS a NEW FAMILY of PROTEINS CAPABLE of ACTIVATING VERY LONG-CHAIN FATTY ACIDS. J Biol Chem 275: 35162-35169. [crossref]
  248. Pei Z, Oey NA, Zuidervaart MM, Jia Z, Li Y, et al. (2003) The Acyl-CoA synthetase \”bubblegum\” (Lipidosin): FURTHER CHARACTERIZATION and ROLE in NEURONAL FATTY ACID? -OXIDATION. J Biol Chem 278: 47070-47078. [crossref]
  249. Li MD, Burns TC, Morgan AA, Khatri P (2014) Integrated multi-cohort transcriptional meta-analysis of neurodegenerative diseases. Acta Neuropathol Com 2: 1-23. [crossref]
  250. Jun G, Ibrahim-Verbaas CA, Vronskaya M, Lambert JC, Chung J, et al. (2016) A novel Alzheimer disease locus located near the gene encoding tau protein. Mol Psychiatry 21: 108-117. [crossref]
  251. Ellis JM, Bowman CE, Wolfgang MJ (2015) Metabolic and Tissue-Specific regulation of Acyl-CoA metabolism. Plos One 10: e0116587. [crossref]
  252. Marszalek JR, Kitidis C, Dararutana A, Lodish HF (2004) Acyl-CoA synthetase 2 overexpression enhances fatty acid internalization and neurite outgrowth. J Biol Chem 279: 23882-23891. [crossref]
  253. Klett EL, Chen S, Yechoor A, Lih FB, Coleman RA, et al. (2017) Long-chain acylCoA synthetase isoforms differ in preferences for eicosanoid species and long-chain fatty acids. J Lipid Res 58: 884-894. [crossref]
  254. Horn CGV, Caviglia JM, Li LO, Wang S, Granger DA, et al. (2005) Characterization of recombinant long-chain rat acyl-CoA synthetase isoforms 3 and 6: Identification of a novel variant of isoform 6. Biochemistry-Us 44: 1635-1642 [crossref]
  255. Kim HC, Lee SW, Cho YY, Lim JM, Ryoo ZY, et al. (2009) RNA interference of long-chain acyl-CoA synthetase 6 suppresses the neurite outgrowth of mouse neuroblastoma NB41A3 cells. Mol Med Rep 2: 669-674. [crossref]
  256. Wang X, Zhu M, Hjorth E, Cortés-Toro V, Eyjolfsdottir H, et al. (2015) Resolution of inflammation is altered in Alzheimer’s disease. Alzheimer’s & Dementia 11: 40-50. [crossref]
  257. Fernandez RF, Kim SQ, Zhao Y, Foguth RM, Weera MM, et al. (2018) Acyl-CoA synthetase 6 enriches the neuroprotective omega-3 fatty acid DHA in the brain. Proc Natl Acad Sci 115: 12525-12530. [crossref]
  258. Chouinard-Watkins R, Bazinet RP (2018) ACSL6 is critical for maintaining brain DHA levels. P Natl Acad Sci Usa 115: 12343-12345. [crossref]
  259. Fernandez RF, Pereyra AS, Diaz V, Wilson ES, Litwa KA, et al. (2021) Acyl-CoA synthetase 6 is required for brain docosahexaenoic acid retention and neuroprotection during aging. JCI Insight 6: e144351. [crossref]
  260. Fernandez RF, Ellis JM (2020) Acyl-CoA Synthetases as regulators of brain phospholipid acyl-chain diversity. Prostaglandins, Leukotrienes and Essential Fatty Acids. 161: 102175. [crossref]
  261. Sharma K, Schmitt S, Bergner CG, Tyanova S, Kannaiyan N, et al. (2015) Cell type- and brain region-resolved mouse brain proteome. Nat Neurosci 18: 1819-1831. [crossref]
  262. Atlas AMB (2009) Allen brain atlas. Neuron
  263. Orre M, Kamphuis W, Osborn LM, Melief J, Kooijman L, et al. (2014) Acute isolation and transcriptome characterization of cortical astrocytes and microglia from young and aged mice. Neurobiol Aging 35: 1-4. [crossref]
  264. Cahoy JD, Emery B, Kaushal A, Foo LC, Zamanian JL, et al. (2008) Transcriptome database for astrocytes, neurons, and oligodendrocytes: A new resource for understanding brain development and function. J Neurosci 28: 264-278. [crossref]
  265. Soupene E, Kuypers FA (2008) Mammalian Long-Chain Acyl-CoA synthetases. Experimental Biology & Medicine 233: 507-521. [crossref]
  266. Hale BJ, Fernandez RF, Kim SQ, Diaz VD, Jackson SN, et al. (2019) Acyl-CoA Synthetase 6 enriches seminiferous tubules with the omega-3 fatty acid DHA and is required for male fertility in the mouse. J Biol Chem 294: 14394-14405. [crossref]
  267. Soupene E, Kuypers FA (2006) Multiple erythroid isoforms of human longchain acyl-CoA synthetases are produced by switch of the fatty acid gate domains. Bmc Mol Biol 7: 1-2. [crossref]
  268. Lee EJ, Kim HC, Yong YC, Byun SJ, Lim JM, et al. (2005) Alternative promotion of the mouse acyl-CoA synthetase 6 (mAcsl6) gene mediate the expression of multiple transcripts with 5′-end heterogeneity: Genetic organization of mAcsl6 variants. Biochem Biophys Res Commun 327: 84-93. [crossref]
  269. Malhotra KT, Malhotra K, Lubin BH, Kuypers FA (1999) Identification and molecular characterization of acyl-CoA synthetase in human erythrocytes and erythroid precursors. Biochem J 3441: 135-143. [crossref]
  270. Soupene E, Dinh NP, Siliakus M, Kuypers FA (2010) Activity of the acylCoA synthetase ACSL6 isoforms: Role of the fatty acid Gate-domains. Bmc Biochem 11: 1-3. [crossref]
  271. Gilquin B, Taillebourg E, Cherradi N, Hubstenberger A, Gay O, et al. (2010) The AAA+ ATPase ATAD3A controls mitochondrial dynamics at the interface of the inner and outer membranes. Molecular & Cellular Biology 30: 1984-96. [crossref]
  272. Desai R, Frazier AE, Durigon R, Patel H, Jones AW, et al. (2017) ATAD3 gene cluster deletions cause cerebellar dysfunction associated with altered mitochondrial DNA and cholesterol metabolism. Brain 140: 1595-1610. [crossref]
  273. Zhao Y, Sun X, Hu D, et al. (2019) ATAD3A oligomerization causes neurodegeneration by coupling mitochondrial fragmentation and bioenergetics defects. Nat Commun 10: 1-20.
  274. Harel T, Yoon WH, Garone C, Gu S, Coban-Akdemir Z, et al. (2016) Recurrent de novo and biallelic variation of ATAD3A, encoding a mitochondrial membrane protein, results in distinct neurological syndromes. Am J Hum Genet 99: 831-845. [crossref]
  275. Janikiewicz J, Szymański J, Malinska D, Patalas-Krawczyk P, Michalska B, et al. (2018) Mitochondria-associated membranes in aging and senescence: Structure,function, and dynamics. Cell Death Dis 9: 1-2. [crossref]
  276. Hayashi T, Rizzuto R, Hajnoczky G, Su TP (2009) MAM: More than just a housekeeper. Trends Cell Biol 19: 81-88. [crossref]
  277. Rusiol AE, Cui Z, Chen MH, Vance JE (1994) A unique mitochondria associated membrane fraction from rat liver has a high capacity for lipid synthesis and contains pre-Golgi secretory proteins including nascent lipoproteins. J Biol Chem 269: 27494-27502. [crossref]
  278. Vance JE (2003) Molecular and cell biology of phosphatidylserine and phosphatidylethanolamine metabolism. Prog Nucleic Acid Res Mol Biol 75: 69-111. [crossref]
  279. Mitsuo Tagaya, Kohei Arasaki (2017) Regulation of mitochondrial dynamics and autophagy by the Mitochondria-Associated membrane. Advances in Experimental Medicine & Biology 997: 33-47. [crossref]
  280. Csords G, Vrnai P, Golenr T, Roy S, Purkins G, et al. (2010) Imaging interorganelle contacts and local calcium dynamics at the ER-mitochondrial interface. Mol Cell 39: 121-132. [crossref]
  281. Zhao Y, Hu D, Wang R, Sun X, Ropelewski P, et al. (2022) ATAD3A oligomerization promotes neuropathology and cognitive deficits in Alzheimer’s disease models. Nat Commun 13: 1-20. [crossref]
  282. Fathia Djelti, Braudeau J, Hudry E, Dhenain M, Varin J, et al. (2015) CYP46A1 inhibition, brain cholesterol accumulation and neurodegeneration pave the way for Alzheimer’s disease. Brain 138: 2383-2398. [crossref]
  283. Montesinos J, Pera M, Larrea D, Guardia-Laguarta C, Agrawal RR, et al. (2020) The Alzheimer’s disease associated C99 fragment of APP regulates cellular cholesterol trafficking. The EMBO Journal 39: e103791. [crossref]
  284. Weigel D, J Ckle H (1990) The fork head domain: A novel DNA binding motif of eukaryotic transcription factors? Cell. 63: 455-456. [crossref]
  285. Flachsbart F, Caliebe A, Kleindorp R, Blanché H, von Eller-Eberstein H, et al. (2009) Association of FOXO3Avariation with human longevity confirmed in German centenarians. Proceedings of the National Academy of Sciences 106: 2700-2705. [crossref]
  286. Willcox BJ, Portion TA, He Q, Chen R, Grove JS, et al. (2008) FOXO3A genotype is strongly associated with human longevity. Proceedings of the National Academy of Sciences 105: 13987-13992. [crossref]
  287. Shimokawa I, Komatsu T, Hayashi N, Kim SE, Kawata T, et al. (2015) The life-extending effect of dietary restriction requires Foxo3 in mice. Aging Cell 14: 707-709. [crossref]
  288. Chiacchiera F, Simone C (2010) The AMPK-FoxO3A axis as a target for cancer treatment. Cell cycle (Georgetown, Tex.) 9: 1091-1096. [crossref]
  289. Armando V, Burgering B (2007) Stressing the role of FoxO proteins in lifespan and disease. Nat Rev Mol Cell Biol 8: 440-450. [crossref]
  290. Beekman M, Nederstigt C, Suchiman H, Kramer D, Breggen R, et al. (2010) Genome-wide association study (GWAS)-identified disease risk alleles do not compromise human longevity. Proceedings of the National Academy of Sciences 107: 18046-18049. [crossref]
  291. Zettergren A, Kern S, Ryd茅n L, Blennow K, Zetterberg H, et al. (2018) Genetic variation in FOXO3 is associated with Self-Rated health in a Population-Based sample of older individuals. J Gerontol A Biol Med 73: 1453. [crossref]
  292. Soerensen M, Nygaard M, Dato S, Stevnsner T, Christiansen L (2015) Association study of FOXO3A SNPs and aging phenotypes in Danish oldest-old individuals. Aging Cell 14: 60-66. [crossref]
  293. Paik J, Ding Z, Narurkar R, Ramkissoon S, Muller F, et al. (2009) Fox Os cooperatively regulate diverse pathways governing neural stem cell homeostasis. Cell Stem Cell 5: 540-553. [crossref]
  294. Renault VM, Rafalski VA, Morgan AA, Salih DA, Brett JO, et al. (2009) FoxO3 regulates neural stem cell homeostasis. Cell Stem Cell 5: 527-539. [crossref]
  295. Schffner I, Minakaki G, Khan MA, Balta EA, Schlötzer-Schrehardt U, et al. (2018) FoxO function is essential for maintenance of autophagic flux and neuronal morphogenesis in adult neurogenesis. Neuron 99: 1188-1203. [crossref]
  296. Yeo H, Lyssiotis CA, Zhang Y, Ying H, Asara JM, et al. (2013) FoxO3 coordinates metabolic pathways to maintain redox balance in neural stem cells. Embo J 32: 2589-2602. [crossref]
  297. Caballero‐Caballero A, Engel T, Martinez‐Villarreal J, Sanz-Rodriguez A, Chang P, et al. (2013) Mitochondrial localization of the Forkhead box class O transcription factor FOXO3a in brain. J Neurochem 124: 749-756. [crossref]
  298. Lehtinen MK, Yuan Z, Boag PR, Yang Y, Villén J, et al. (2006) A conserved MST-FOXO signaling pathway mediates oxidative-stress responses and extends life span. Cell 125: 987-1001. [crossref]
  299. Sriram K (2006) Deficiency of TNF receptors suppresses microglial activation and alters the susceptibility of brain regions to MPTP-induced neurotoxicity: Role of TNF-Faseb J 20: 670-682. [crossref]
  300. Woiciechowsky C, Sch枚ning B, Stoltenburg-Didinger G, Stockhammer F, Volk HD (2004) Brain-IL-1 beta triggers astrogliosis through induction of IL-6: Inhibition by propranolol and IL-10. Med Sci Monit 10: 325-330. [crossref]
  301. Buffo A, Rolando C, Ceruti S (2010) Astrocytes in the damaged brain: Molecular and cellular insights into their reactive response and healing potential. Biochem Pharmacol 79: 77-89. [crossref]
  302. Cui M, Huang Y, Tian C, et.al (2011) FOXO3a inhibits TNF– and IL-1-induced astrocyte proliferation: Implication for reactive astrogliosis. Glia 59: 641-654. [crossref]
  303. Du S, Jin F, Maneix L, et al. (2021) FoxO3 deficiency in cortical astrocytes leads to impaired lipid metabolism and aggravated amyloid pathology. Aging cell 20: e13432. [crossref]
  304. Cui M, Huang Y, Tian C, Zhao Y, Zheng J (2011) FOXO3a inhibits TNF– and IL-1-induced astrocyte proliferation: Implication for reactive astrogliosis. Glia 59: 641-654. [crossref]
  305. Nguyen TB, Louie SM, Daniele JR, Tran Q, Dillin A, et al. (2017) DGAT1-Dependent Lipid Droplet Biogenesis Protects Mitochondrial Function during Starvation-Induced Autophagy. Dev Cell 42: 9-21. [crossref]
  306. Ehehalt Robert, Keller P, Haass C, Thiele C, Simons K (2003) Amyloidogenic processing of the Alzheimer beta-amyloid precursor protein depends on lipid rafts. J Cell Biol 160: 113-123. [crossref]
  307. Saido T, Leissring MA (2012) Proteolytic degradation of amyloid beta-Protein. Csh Perspect Med 2: a6379. [crossref]
  308. He G, Luo W, Li P, Remmers C, Netzer WJ, et al. (2010) Gamma-secretase activating protein is a therapeutic target for Alzheimer’s disease. Nature 467: 95-98. [crossref]
  309. Chu J, Li JG, Joshi YB, Giannopoulos PF, Hoffman NE, et al. (2015) Gamma Secretase-Activating protein is a substrate for caspase-3: Implications for alzheimer’s disease. Biol Psychiat 77: 720-728. [crossref]
  310. Perez SE, Nadeem M, Malek-Ahmadi MH, He B, et al. (2017) Frontal cortex and hippocampal-Secretase activating protein levels in prodromal alzheimer disease. Neurodegener Dis 17: 235-241. [crossref]
  311. Satoh J, Tabunoki H, Ishida T, Saito Y, Arima K (2012) Immunohistochemical characterization of secretase activating protein expression in Alzheimer’s disease brains. Neuropathology & Applied Neurobiology 38: 132-141. [crossref]
  312. Floudas CS, Um N, Kamboh M, Barmada MM, Visweswaran S (2014) Identifying genetic interactions associated with late-onset Alzheimer’s disease. Biodata Min 7: 35. [crossref]
  313. Zhu M, Tao Y, He Q, Gao H, Song F, et al. (2014) A common GSAP promoter variant contributes to Alzheimer’s disease liability. Neurobiol Aging 35: 2651-2656. [crossref]
  314. Xu P, Chang JC, Zhou X, Wang W, Greengard P (2021) GSAP regulates lipid homeostasis and mitochondrial function associated with Alzheimer’s disease. The Journal of experimental medicine 218: e20202446. [crossref]
  315. Jin Chu, Elisabetta Lauretti, Caryne P, Praticò D (2014) Pharmacological modulation of GSAP reduces amyloid- levels and tau phosphorylation in a mouse model of Alzheimer’s disease with plaques and tangles. Journal of Alzheimers Disease Jad 41: 729-737. [crossref]
  316. Pera M, Larrea D, Guardia aguarta C, Montesinos J, Velasco KR, et al. (2017) Increased localization of APP C99 in mitochondria鈥恆ssociated ER membranes causes mitochondrial dysfunction in Alzheimer disease. The EMBO Journal. [crossref]
  317. Prete DD, Suski JM, Ouls B, Debayle D, Gay AS, et al. (2016) Localization and processing oftheAmyloid-beta protein precursor inMitochondria-Associated membranes. Journal of Alzheimer\”s Disease 55: 1549-1570. [crossref]
  318. Area-Gomez E, Maria DCLC, Tambini MD, Guardia-Laguarta C, De Groof AJC, et al. (2012) Upregulated function of mitochondria-associated ER membranes in Alzheimer disease. Embo J 31: 4106-4123. [crossref]
  319. L Hedskog, CM Pinho, Filadi R, Rönnbäck A, Hertwig L, et al. (2013) Modulation of the endoplasmic reticulum-mitochondria interface in Alzheimer’s disease and related models. Proceedings of the National Academy of Sciences 110: 7916-7921. [crossref]
  320. Adami PVM, Nichtov Z, Weaver DB, Bartok A, Wisniewski T, et al. (2019) Perturbed mitochondriaR contacts in live neurons that model the amyloid pathology of Alzheimer’s disease. The Company of Biologists 132: jcs229906. [crossref]
  321. Kosicek M, Hecimovic S (2013) Phospholipids and alzheimer’s disease: Alterations, mechanisms and potential biomarkers. Int J Mol Sci 14: 1310-1322. [crossref]
  322. Goodenberger M, Jenkins RB (2012) Genetics of adult glioma. Cancer Genet-Ny 205: 613-621. [Crossref]
  323. Venur VA, Peereboom DM, Ahluwalia MS (2015) Current medical treatment of glioblastoma. Cancer Treatment & Research 163: 103-115. [crossref]
  324. Joo K, Kim J, Jin J, Kim M, Seol H, et al. (2013) Patient-Specific orthotopic glioblastoma xenograft models recapitulate the histopathology and biology of human glioblastomas in situ. Cell Rep [crossref]
  325. Ricard D, Idbaih A, Ducray F, Lahutte M, Hoangxuan K, et al. (2012) Primary brain tumours in adults. Lancet 379: 1984-1996. [crossref]
  326. Libby CJ, Tran AN, Scott SE, Griguer C, Hjelmeland AB (2018) The protumorigenic effects of metabolic alterations in glioblastoma including brain tumor initiating cells. Biochimica Et Biophysica Acta 1869: 175-188. [crossref]
  327. Agnihotri S, Zadeh G (2015) Metabolic reprogramming in glioblastoma: The influence of cancer metabolism on epigenetics and unanswered questions. Neuro Oncology 18: 160-172.[crossref]
  328. Intlekofer AM, Finley LWS (2019) Metabolic signatures of cancer cells and stem cells. Nature Metabolism 1: 177-188. [crossref]
  329. Weinberg H, Hanahan D (2011) Hallmarks of cancer: The next generation. Cell 144: 646-674. [crossref]
  330. Lopez-Lazaro M (2008) The warburg effect: Why and how do cancer cells activate glycolysis in the presence of oxygen? Anti-Cancer Agents in Medicinal. Chemistry (Formerly Current Medicinal Chemistry – Anti-Cancer Agents) 8. [crossref]
  331. Duraj T, Garcromero N, Carrinavarro J, Madurga R, Ana O, et al. Beyond the warburg effect: Oxidative and glycolytic phenotypes coexist within the metabolic heterogeneity of glioblastoma. Cells-Basel 10: 202. [crossref]
  332. Hoangnh LB, Siebzehnrubl FA, Yang C, Tano SS, Deleyrolle LP (2018) Infiltrative and drug鈥恟esistant slowcling cells support metabolic heterogeneity in glioblastoma. The EMBO Journal 37: e98772. [crossref]
  333. Caren Duman, Kaneschka Yaqubi, Angelika Hoffmann, Acikgöz AA, Korshunov A, et al. (2019) AcylCoA-Binding protein drives glioblastoma tumorigenesis by sustaining fatty acid oxidation. Cell Metab 30: 274-289. [crossref]
  334. Antonella DR, Serena P, Marco R, Patrizia T, Letizia M, et al. (2012) A radial glia gene marker, fatty acid binding protein 7 (FABP7), is involved in proliferation and invasion of glioblastoma cells. Plos One 7: e52113. [crossref]
  335. Gupta K, Vuckovic I, Zhang S, Xiong Y, Carlson BL, et al. (2020) Radiation induced metabolic alterations associate with tumor aggressiveness and poor outcome in glioblastoma. Frontiers Media S. A 10: 535. [crossref]
  336. Son B, Lee S, Kim H, Kang H, Youn BH (2020) Decreased FBP1 expression rewires metabolic processes affecting aggressiveness of glioblastoma. Oncogene 39: 36-49. [crossref]
  337. Hua L, Shaan P, Affleck VS, Ian W, Turnbull DM, et al. (2017) Fatty acid oxidation is required for the respiration and proliferation of malignant glioma cells. Neuro-Oncology 43-54. [crossref]
  338. Hanna VS, Ebtisam A (2018) Synopsis of arachidonic acid metabolism: A review. J Adv Res 23-32. [crossref]
  339. Juric-Sekhar G, Zarkovic K, Waeg G, Cipak A, Zarkovic N (2009) Distribution of 4-hydroxynonenal-protein conjugates as a marker of lipid peroxidation and parameter of malignancy in astrocytic and ependymal tumors of the brain. Tumori 95: 762-768. [crossref]
  340. Zajdel A, Wilczok A, Slowinski J, Mazurek OU (2007) Aldehydic lipid peroxidation products in human brain astrocytomas. J Neuro-Oncol 84: 167-174. [crossref]
  341. Zarkovic K, Juric G, Waeg G, Kolenc D, Zarkovic N (2010) Immunohistochemical appearance of HNE-protein conjugates in human astrocytomas. Biofactors 24: 33-40. [crossref]
  342. Atilla-Gokcumen G, Muro E, Relat-Goberna J, Sasse S, Bedigian A, Coughlin M, et al. (2014) Dividing cells regulate their lipid composition and localization. Cell 156. [crossref]
  343. Lopez DH, Bestard-Escalas J, Garate J, Maim贸-Barcel贸 A, Fern谩ndez R, Reigada R, et al. (2018) Tissue-selective alteration of ethanolamine plasmalogen metabolism in dedifferentiated colon mucosa. Biochimica et Biophysica Acta (BBA) – Molecular and Cell Biology of Lipids:S263724189. [crossref]
  344. Sang TL, Lee JC, Kim JW, Cho SY, Seong JK, Moon MH (2016) Global changes in lipid profiles of mouse cortex, hippocampus, and hypothalamus upon p53 knockout. Sci Rep-Uk 6: 36510. [crossref]
  345. Baenke F, Peck B, Miess H, Schulze A (2013) Hooked on fat: The role of lipid synthesis in cancer metabolism and tumour development. Dis Model Mech 6: 1353-1363. [crossref]
  346. Gimple RC, Kidwell RL, Ljy K, Sun T, Gromovsky AD, et al. (2019) Glioma stem cell specific super enhancer promotes polyunsaturated fatty acid synthesis to support EGFR signaling. Cancer Discov. [crossref]
  347. Zou YK, Watters A, Cheng N, Perry CE, Chen Q (2019) Polyunsaturated fatty acids from astrocytes activate PPARγ signaling in cancer cells to promote brain metastasis. Cancer Discov 9: 1720-1735. [crossref]
  348. Cheng X, Geng F, Pan M, Wu X, Guo D (2020) Targeting DGAT1 ameliorates glioblastoma by increasing fat catabolism and oxidative stress. Cell Metab [crossref]
  349. Omuro A, Deangelis LM (2013) Glioblastoma and other malignant gliomas: A clinical review. Journal of the American Medical Association 310: 1842-1850. [crossref]
  350. Wen PY, Kesari S (2008) Malignant gliomas in adults. New Engl J Med 359: 492-507. [crossref]
  351. Accioly MT, Pacheco P, Maya-Monteiro CM, Carrossini N, Robbs BK, et al. (2008) Lipid bodies are reservoirs of cyclooxygenase-2 and sites of Prostaglandin-E2 synthesis in colon cancer cells. Cancer Res 68: 1732-1740. [crossref]
  352. Du W, Zhang L, Brett-Morris A, Aguila B, Kerner J, et al. (2017) HIF drives lipid deposition and cancer in ccRCC via repression of fatty acid metabolism. Nat Commun 8: 1769. [crossref]
  353. Feng G, Xiang C, Wu X, Ji YY, Guo D (2017) Inhibition of SOAT1 suppresses glioblastoma growth via blocking SREBP-1-mediated lipogenesis. Clin Cancer Res 22. [crossref]
  354. Geng F, Guo D (2017) Lipid droplets, potential biomarker and metabolic target in glioblastoma. Intern Med Rev 3: 10. [crossref]
  355. Mitra R, Le TT, Gorjala P, Goodman OB (2017) Positive regulation of prostate cancer cell growth by lipid droplet forming and processing enzymes DGAT1 and ABHD5. Bmc Cancer 17: 631. [crossref]
  356. Pucer A, Brglez V, Payr C, Pungerar J, Petan T (2013) Group X secreted phospholipase A2 induces lipid droplet formation and prolongs breast cancer cell survival. Mol Cancer 12: 111. [crossref]
  357. Sevinsky CJ, Faiza K, Leila K, Anza D, Rao MK, et al. (2018) NDRG1 regulates neutral lipid metabolism in breast cancer cells. Breast Cancer Res 20: 55. [crossref]
  358. Sunami Y, Rebelo A, Kleeff J (2017) Lipid metabolism and lipid droplets in pancreatic cancer and stellate cells. Cancers 10: 3. [crossref]
  359. Tauchi-Sato K, Ozeki S, Houjou T, Taguchi R, Fujimoto T (2002) The surface of lipid droplets is a phospholipid monolayer with a unique fatty acid composition. J Biol Chem 277: 44507-44512. [crossref]
  360. Wilfling F, Haas JT, Walther TC, Jr R (2014) Lipid droplet biogenesis. Curr Opin Cell Biol [crossref]
  361. Olzmann James A, Carvalho Pedro (2019) Dynamics and functions of lipid droplets. 20: 137-155. [crossref]
  362. Paar M, Jungst C, Steiner NA, Magnes C, Sinner F, et al. (2012) Remodeling of lipid droplets during lipolysis and growth in adipocytes. J Biol Chem 287: 11164-11173. [crossref]
  363. Klionsky DJ, Emr SD (2000) Autophagy as a regulated pathway of cellular degradation. Science 290: 1717-1721. [crossref]
  364. Mizushima N, Komatsu M (2011) Autophagy: Renovation of cells and tissues. Cell 147: 728-741. [crossref]
  365. Mizushima N, Levine B, Cuervo AM, Klionsky DJ (2008) Autophagy fights disease through cellular self-digestion. Nature 451: 1069. [crossref]
  366. Singh R, Kaushik S, Wang Y, Xiang Y, Novak I, et al. (2009) Autophagy regulates lipid metabolism. Nature 458: 1131-1135. [crossref]
  367. Wu X, Geng F, Cheng X, Guo Q, Zhong Y, et al. (2020) Lipid droplets maintain energy homeostasis and glioblastoma growth via autophagic release of stored fatty acids. iScience 23: 101569. [crossref]
  368. Guo D, Reinitz F, Youssef M, Hong C, Nathanson D, Akhavan D, et al. (2011) An LXR agonist promotes glioblastoma cell death through inhibition of an EGFR/AKT/SREBP-1/LDLR-dependent pathway. Cancer Discov 1: 442-456. [crossref]
  369. Bjorkhem I (2004) Brain cholesterol: Long secret life behind a barrier. Arteriosclerosis, Thrombosis, and Vascular Biology 24: 806-815. [crossref]
  370. Dietschy JM, Turley SD (2001) Cholesterol metabolism in the brain. Curr Opin Lipidol 12: 105-112. [crossref]
  371. Hayashi H, Campenot RB, Vance DE, Vance JE (2004) Glial lipoproteins stimulate axon growth of central nervous system neurons in compartmented cultures. J Biol Chem 279: 14009-14015. [crossref]
  372. Karten B, Campenot RB, Vance DE, Vance JE (2006) Expression of ABCG1, but not ABCA1, correlates with cholesterol release by cerebellar astroglia. J Biol Chem 281: 4049-4057. [crossref]
  373. Wahrle SE, Jiang H, Parsadanian M, Legleiter J, Han X, et al. (2004) ABCA1 is required for normal central nervous system ApoE levels and for lipidation of astrocyte-secreted apoE. J Biol Chem 279: 40987-40993. [crossref]
  374. Orth M, Bellosta S (2012) Cholesterol: Its regulation and role in central nervous system disorders. Cholesterol 2012: 292598. [crossref]
  375. Jing C, Zhang X, Kusumo H, Costa LG, Guizzetti M (2013) Cholesterol efflux is differentially regulated in neurons and astrocytes: Implications for brain cholesterol homeostasis. Biochimica et Biophysica Acta (BBA) – Molecular and Cell Biology of Lipids 1831: 263-275. [crossref]
  376. Repa JJ (2000) Regulation of absorption and ABC1-Mediated efflux of cholesterol by RXR heterodimers. Science 289: 1524-1529. [crossref]
  377. Venkateswaran Asha, Laffitte Bryan A (2000) Control of cellular cholesterol efflux by the nuclear oxysterol receptor LXR alpha. P Natl Acad Sci Usa 97: 12097-12102. [crossref]
  378. Zelcer N, Hong C, Boyadjian R, Tontonoz P (2009) LXR regulates cholesterol uptake through Idol-Dependent ubiquitination of the LDL receptor. Science 325: 100-104. [crossref]
  379. Villa G, Hulce J, Zanca C, Bi J, Mischel P (2016) An LXR-Cholesterol axis creates a metabolic Co-Dependency for brain cancers. Cancer Cell 30: 683-693. [crossref]
  380. Friedman HS, Kerby T, Calvert H (2000) Temozolomide and treatment of malignant glioma. Clinical cancer research: an official journal of the American Association for Cancer Research 6: 2585-2597. [crossref]
  381. Stupp R, Mason WP, Van D, Weller M, Fisher B, et al. (2005) Radiotherapy plus concomitant and adjuvant temozolomide for glioblastoma – Cancer/Radiothrapie 9: 196-197. [crossref]
  382. Massimo Aureli, Valentina Murdica, Nicoletta Loberto, Samarani M, Prinetti A, et al. (2014) Exploring the link between ceramide and ionizing radiation. Glycoconjugate J 31: 449-459. [crossref]
  383. Brady RO, Kanfer JN, Mock MB, Fredrickson DS (1966) The metabolism of sphingomyelin. II. Evidence of an enzymatic deficiency in Niemann-Pick diseae. Proceedings of the National Academy of Sciences 55: 366-369. [crossref]
  384. Haimovitz-Friedman A (1994) Ionizing radiation acts on cellular membranes to generate ceramide and initiate apoptosis. J Exp Med 180: 525-535. [crossref]
  385. Senchenkov A, Litvak DA, Cabot MC (2001) Targeting ceramide metabolism strategy for overcoming drug resistance. JNCI J Natl Cancer Inst 93: 347-357. [crossref]
  386. Mizushima N, Koike R, Kohsaka H, Kushi Y, Handa S, et al. (1996) Ceramide induces apoptosis via CPP32 activation. Febs Lett 395: 261-271. [crossref]
  387. Abuhusain HJ, Matin A, Qiao Q, Shen H, Kain N, et al. (2013) A metabolic shift favoring sphingosine 1-Phosphate at the expense of ceramide controls glioblastoma angiogenesis. J Biol Chem 288: 37355-37364. [crossref]
  388. Ji-Sun J, Young-Ho A, Byung-In M, Hee-Sun K (2016) Exogenous c2 ceramide suppresses matrix metalloproteinase gene expression by inhibiting ROS production and MAPK signaling pathways in PMA-Stimulated human astroglioma cells. Int J Mol Sci 17: 477. [crossref]
  389. Nganga R, Oleinik N, Ogretmen B (2018) Mechanisms of Ceramide-Dependent cancer cell death. Adv Cancer Res [crossref]
  390. Gault CR, Obeid LM, Hannun YA (2010) An overview of sphingolipid metabolism: From synthesis to breakdown. Oxygen Transport to Tissue XXXIII 688: 1-23. [Crossref]
  391. Buehrer BM, Bell RM (1992) Inhibition of sphingosine kinase in vitro and in platelets. Implications for signal transduction pathways. J Biol Chem 267: 3154-3159. [crossref]
  392. Brocklyn J, Young N, Roof R (2003) Sphingosine-1-phosphate stimulates motility and invasiveness of human glioblastoma multiforme cells. Cancer Lett 199: 53-60. [crossref]
  393. Bassi R, Anelli V, Giussani P, Tettamanti G, Viani P, et al. (2010) Sphingosine-1-phosphate is released by cerebellar astrocytes in response to bFGF and induces astrocyte proliferation through Gi-protein-coupled receptors. Glia 53: 621-630. [crossref]
  394. Anelli V, Gault CR, Cheng AB, Obeid LM (2008) Sphingosine kinase 1 is up-regulated during hypoxia in U87MG glioma cells. J Biol Chem 283: 3365-3375. [crossref]
  395. Strub GM, Maceyka M, Hait NC, Milstien S, Spiegel S (2010) Extracellular and intracellular actions of Sphingosine-1-Phosphate. Adv Exp Med Biol 688: 141-155. [crossref]
  396. Cuvillier O, Pirianov G, Kleuser B, Vanek PG, Spiegel S (1996) Suppression of ceramide-mediated programmed cell death by sphingosine-1-phosphate. Nature 381: 800-803. [crossref]
  397. Masayuki Nagahashi, Manabu Abe, Kenji Sakimura, Takabe K, Wakai T (2018) The role of sphingosine-1-phosphate in inflammation and cancer progression. Cancer Sci 109: 3671-3678. [crossref]
  398. Marfia G, Campanella R, Navone SE, Vito CD, Riccitelli E, et al. (2014) Autocrine/paracrine sphingosine phosphate fuels proliferative and stemness qualities of glioblastoma stem cells. Glia 62: 1968-1981. [crossref]
  399. Im DS, Clemens J, Macdonald TL, Lynch KR (2001) Characterization of the human and mouse sphingosine 1-phosphate receptor, S1P5 (Edg-8): Structure-activity relationship of sphingosine1-phosphate receptors. Biochemistry-Us 40: 14053-14060. [crossref]
  400. Hla T, Maciag T (1990) An abundant transcript induced in differentiating human endothelial cells encodes a polypeptide with structural similarities to Gprotein-coupled receptors. J Biol Chem 265: 9308-9313. [crossref]
  401. Masana MI, Brown RC, Pu H, Gurney ME, Dubocovich ML (1995) Cloning and characterization of a new member of the G-protein coupled receptor EDG family. Receptors Channels 3: 255-262. [crossref]
  402. Zondag GC, Postma FR, Etten IV, Verlaan I, Moolenaar WH (1998) Sphingosine 1-phosphate signalling through the G-protein-coupled receptor Edg-1. The Biochemical journal 330: 605-609. [crossref]
  403. Siehler S, Manning DR (2002) Pathways of transduction engaged by sphingosine 1-phosphate through G protein-coupled receptors. Biochimica et Biophysica Acta 1582: 94-99. [crossref]
  404. Sanchez T, Hla T (2004) Structural and functional characteristics of S1P receptors. J Cell Biochem 92. [crossref]
  405. Bien-Miller S, Lange S, Holm T, B枚hm A, Rauch BH (2016) Expression of S1P metabolizing enzymes and receptors correlate with survival time and regulate cell migration in glioblastoma multiforme. Oncotarget 7. [crossref]
  406. Yoshida Y, Nakada M, Sugimoto N, Harada T, Hayashi Y, et al. (2010) Sphingosine-1-phosphate receptor type 1 regulates glioma cell proliferation and correlates with patient survival. Int J Cancer 126: 2341-2352. [crossref]
  407. Bernhart E, Damm S, Wintersperger A, Nusshold C, Brunner AM, et al. (2015) Interference with distinct steps of sphingolipid synthesis and signaling attenuates proliferation of U87MG glioma cells. Biochem Pharmacol  [crossref]
  408. Young N, Brocklyn JRV (2007) Roles of Sphingosine-1-Phosphate (S1P) receptors in malignant behavior of glioma cells. Differential effects of S1P2 on cell migration and invasiveness. Exp Cell Res 313: 1615-1627. [crossref]
  409. Lepley D (2005) The g protein鈥揅oupled receptor S1P2 regulates Rho/Rho kinase pathway to inhibit tumor cell migration. Cancer Res 65: 3788. [crossref]
  410. Malchinkhuu E, Sato K, Maehama T, Mogi C, Tomura H, Ishiuchi S, et al. (2008) S1P(2) receptors mediate inhibition of glioma cell migration through Rho signaling pathways independent of PTEN. Biochem Biophys Res Commun 366(4):963-968 [crossref]
  411. Quint K, Stiel N, Neureiter D, Schlicker HU, Nimsky C, et al. (2014) The role of sphingosine kinase isoforms and receptors S1P1, S1P2, S1P3, and S1P5 in primary, secondary, and recurrent glioblastomas. Tumour Biol 35: 8979-8989. [crossref]
  412. Rothhammer V, Kenison JE, Tjon E, Takenaka MC, Lima KD, et al. (2017) Sphingosine 1-phosphate receptor modulation suppresses pathogenic astrocyte activation and chronic progressive CNS inflammation. Proceedings of the National Academy of ences 114: 201615413. [crossref]
  413. Sullivan SA, O Sullivan C, Healy LM, Dev KK, Sheridan GK (2018) Sphingosine 1鈥恜hosphate receptors regulate TLR4 innduced CXCL5 release from astrocytes and microglia. J Neurochem 144: 736-747. [crossref]
  414. Dai Z, Wu J, Chen F, Cheng Q, Zhang M, et al. (2019) Cxcl5 promotes the proliferation and migration of glioma cells in autocrine-and paracrinedependent manners. Oncol Rep 36: 3303-3310. [crossref]
  415. Windh RT, Lee MJ, Hla T, An S, Barr AJ, et al. (1999) Differential coupling of the sphingosine 1-Phosphate receptors edg-1, edg-3, and H218/Edg-5 to the gi, gq, and g12 families of heterotrimeric g proteins. J Biol Chem 274: 27351-27358. [crossref]
  416. Liu Y, Wang X, Li J, Tang J, Li B, et al. (2021) Sphingosine 1-Phosphate liposomes for targeted nitric oxide delivery to mediate anticancer effects against brain glioma tumors. Adv Mater.
  417. Bien-M枚ller S, Lange S, Holm T, B枚hm A, Rauch BH (2016) Expression of S1P metabolizing enzymes and receptors correlate with survival time and regulate cell migration in glioblastoma multiforme. Oncotarget 7. [crossref]
  418. Rekers NH, Sminia P, Peters GJ (2011) Towards tailored therapy of glioblastoma multiforme. J Chemotherapy 23: 187-199. [crossref]
  419. Bryan L, Paugh BS, Kapitonov D, Wilczynska KM, Alvarez SM, et al. (2008) Sphingosine-1-phosphate and interleukin-1 independently regulate plasminogen activator inhibitor-1 and urokinase-type plasminogen activator receptor expression in glioblastoma cells: Implications for invasiveness. Molecular Cancer Research Mcr 6: 1469. [crossref]
  420. Young N, Brocklyn JRV (2007) Roles of Sphingosine-1-Phosphate (S1P) receptors in malignant behavior of glioma cells. Differential effects of S1P2 on cell migration and invasiveness. Exp Cell Res 313: 1615-1627. [crossref]
  421. Sato K, Tomura H, Igarashi Y, Ui M, Okajima F (1999) Possible involvement of cell surface receptors in sphingosine 1-phosphate-induced activation of extracellular signal-regulated kinase in C6 glioma cells. Mol Pharmacol 55: 126-133. [crossref]
  422. Malchinkhuu E, Sato K, Horiuchi Y, Mogi C, Ohwada S, et al. (2005) Role of p38 mitogen-activated kinase and c-Jun terminal kinase in migration response to lysophosphatidic acid and sphingosine-1-phosphate in glioma cells. Oncogene 24: 6676-6688. [crossref]
  423. Brocklyn JRV, Young N, Roof R (2003) Sphingosine-1-phosphate stimulates motility and invasiveness of human glioblastoma multiforme cells. Cancer Lett 199: 53-60. [crossref]
  424. Yoshida Y, Nakada M, Harada T, Tanaka S, Furuta T, et al. (2010) The expression level of sphingosine-1-phosphate receptor type 1 is related to MIB-1 labeling index and predicts survival of glioblastoma patients. J Neuro-Oncol 98: 41-47. [crossref]
  425. Yoshida Y, Nakada M, Sugimoto N, Harada T, Hayashi Y, et al. (2010) Sphingosine-1-phosphate receptor type 1 regulates glioma cell proliferation and correlates with patient survival. Int J Cancer 126: 2341-2352. [crossref]
  426. Shimizu F, Watanabe TK, Shinomiya H, Nakamura Y, Fujiwara T (1997) Isolation and expression of a cDNA for human brain fatty acid-binding protein (BFABP). Biochimica et Biophysica Acta (BBA) – Gene Structure and Expression 1354: 24-28. [crossref]
  427. Xu LZ, Sanchez R, Sali A, Heintz N (1996) Ligand specificity of brain lipidbinding protein. J Biol Chem 271: 24711. [crossref]
  428. Kurtz A, Zimmer A, Schngen F, Brning G, Miller T (1994) The expression pattern of a novel gene encoding brain-fatty acid binding protein correlates with neuronal and glial cell development. Development 120: 2637-2649. [crossref]
  429. Owada Y, Yoshimoto T, Kondo H (1996) Spatio-temporally differential expression of genes for three members of fatty acid binding proteins in developing and mature rat brains. J Chem Neuroanat 12: 113-122. [crossref]
  430. Yun SW, Leong C, Zhai D, Tan YL, Lim L, et al. (2012) Neural stem cell specific fluorescent chemical probe binding to FABP7. P Natl Acad Sci Usa 109: 10214-10217.
  431. Singh SK, Clarke ID, Terasaki M, Bonn VE, Hawkins C, et al. (2003) Identification of a cancer stem cell in human brain tumors. Cancer Res 63: 5821. [crossref]
  432. Llaguno SA, Chen J, Parada LF (2009) Signalling in malignant astrocytomas: Role of neural stem cells and its therapeutic implications. Clinical Cancer Research An Official Journal of the American Association for Cancer Research 15: 7124-7129. [crossref]
  433. Kaloshi G, Mokhtari K, Carpentier C, Sophie T, Lejeune J, et al. (2007) FABP7 expression in glioblastomas: Relation to prognosis, invasion and EGFR status. J Neuro-Oncol 84: 245-248. [crossref]
  434. Liang YU, Maximilian D, Nathan W, Bollen AW, Aldape KD, et al. (2005) Gene expression profiling reveals molecularly and clinically distinct subtypes of glioblastoma multiforme. Proc Natl Acad Sci USA 102: 5814-5819. [crossref]
  435. Liang Y, Bollen AW, Aldape KD, Gupta N (2006) Nuclear FABP7 immunoreactivity is preferentially expressed in infiltrative glioma and is associated with poor prognosis in EGFR-overexpressing glioblastoma. Bmc Cancer 6: 97. [crossref]
  436. Bensaad K, Favaro E, Lewis CA, Peck B, Lord S, et al. (2014) Fatty acid uptake and lipid storage induced by HIF-1伪 contribute to cell growth and survival after hypoxia-reoxygenation. Cell Rep 9: 349-365.
  437. Hoangnh LB, Siebzehnrubl FA, Yang C, Tano SS, Deleyrolle LP (2018) Infiltrative and drug resistant slowcling cells support metabolic heterogeneity in glioblastoma. The EMBO Journal 37: e98772. [crossref]
  438. Xu X, Wang Y, Choi WS, Sun X, Godbout R (2021) Super resolution microscopy reveals DHA-dependent alterations in glioblastoma membrane remodelling and cell migration. Nanoscale 21.
  439. Paton CM, Ntambi JM (2008) Biochemical and physiological function of stearoyl-CoA desaturase. The American journal of physiology 297: E28-E37. [crossref]
  440. Matthew T Flowers, James M Ntambi (2008) Role of stearoyl-coenzyme a desaturase in regulating lipid metabolism. Curr Opin Lipidol 19: 248-256. [crossref]
  441. Wu X, Zou X, Chang Q, Zhang Y, Li Y, et al. (2013) The evolutionary pattern and the regulation of Stearoyl-CoA desaturase genes. Biomed Res Int 2013: 856521. [crossref]
  442. Ecker J, Liebisch G, Grandl M, Schmitz G (2010) Lower SCD expression in dendritic cells compared to macrophages leads to membrane lipids with less monounsaturated fatty acids. Immunobiology 215: 748-755. [crossref]
  443. Zhang L, Ge L, Parimoo S, Stenn K, Prouty SM (1999) Human stearoyl-CoA desaturase: Alternative transcripts generated from a single gene by usage of tandem polyadenylation sites. Biochem J 340: 255-264. [crossref]
  444. Noushmehr H, Weisenberger D, Diefes K, Phillips H, Pujara K, et al. (2010) The cancer genome atlas research network. Identification of a CpG island methylator phenotype that defines a distinct subgroup of glioma. Cancer Cell 17: 510-522. [crossref]
  445. Menendez J, Lupu R (2007) Fatty acid synthase and the lipogenic phenotype in cancer pathogenesis. Nat Rev Cancer 7: 763-777. [Crossref]
  446. Peck, Barrie, Schulze, Almut. (2016) Lipid desaturation – the next step in targeting lipogenesis in cancer? Febs J 283: 2767-2778. [crossref]
  447. Hilvo M, Denkert C, Lehtinen L, Muller B, Brockmoller S, et al. (2011) Novel theranostic opportunities offered by characterization of altered membrane lipid metabolism in breast cancer progression. Cancer Res 71: 3236-3245. [crossref]
  448. Scaglia N, Caviglia JM, Igal RA (2005) High stearoyl-CoA desaturase protein and activity levels in simian virus 40 transformed-human lung fibroblasts. Biochim Biophys Acta 1687: 141-151. [crossref]
  449. Brennan CW, Verhaak R, Mckenna A, Campos B, Noushmehr H, et al. (2013) The somatic genomic landscape of glioblastoma. Cell 155: 462-477. [crossref]
  450. Oatman N, Dasgupta N, Arora P, Choi K, Dasgupta B (2021) Mechanisms of stearoyl CoA desaturase inhibitor sensitivity and acquired resistance in cancer. Sci Adv 7: d7459. [crossref]
fig 7

Identification of Biomarkers in Colorectal Cancer Using a Multiplex Immunohistochemistry Technology

DOI: 10.31038/JCRM.2022554

Abstract

Colorectal Cancer (CRC) is a common malignant tumor with high mortality arising from adenomatous polyps of the large intestine. The rapid development of multiple immunofluorescence has led to the widespread application of a newly advanced technology called multiplex immunohistochemistry (mIHC), which enables the detection of multiple fluorescent proteins on a tumor tissue microarray (TMA) within the same temporal and spatial organization. Using this mIHC technology, we detected six tumor-associated proteins, including cluster of differentiation 4 (CD4), cluster of differentiation 8 (CD8), Pan-cytokeratin (P-CK), forkhead box P3 (FOXP3), programmed cell death 1 (PD1) as well as programmed death ligand-1 (PDL1) in cancer tissues and para-carcinomatous normal tissues from a cohort of 79 colorectal cancer patients. Results showed that, in CRC tissues, expression levels of P-CK and FOXP3 were upregulated while CD4 expression decreased significantly in comparison with adjacent normal tissues. What’s more, no significantly differential expression of CD8, PD1 or PDL1 was observed between cancer and normal tissues. FOXP3 expression was found to be correlated with tumor size (FOXP3 expression in tumor with volume >10 cm3 was significantly lower than that in tumor with volume ≤ 10 cm3), and reduced FOXP3 expression was associated with worse prognosis. P-CK expression in low-grade (Grade I-II) CRC patients was higher than that in advanced grade (Grade III-IV) patients, while association of P-CK expression with CRC prognosis was of no significance. In conclusion, FOXP3 and P-CK could be utilized as biopredictors of CRC (FOXP3 as a diagnostic and prognostic biomarker; P-CK as a diagnostic biomarker) for their differential expression patterns and clinicopathological correlation, while CD4, CD8, PD1 and PDL1 are more suitable for combined use.

Keywords

Colorectal cancer (CRC), Multiplex immunohistochemistry (mIHC), Tumor tissue microarray (TMA), Diagnosis, Prognosis, Biomarker

Introduction

Colorectal Cancer (CRC), one of the major causes of morbidity and mortality worldwide, is the second most common type of cancer in women and the third most common type of cancer in men, accounting for over 9% of all cancer incidence and causing death for more than 600,000 cases all over the world per year [1-4]. CRC is widely believed to develop in a multi-step process from Aberrant Crypt Foci (ACF), through benign and precancerous lesions (adenomas), to malignant tumors (adenocarcinomas) over an extended period of time [5]. Treatment of CRC usually comprises surgical resection of the primary tumors in patients followed by chemotherapy, radiotherapy and/or immunotherapy for advanced stages (stage III and IV) [6]. Despite advances in detection and available therapeutic strategies, the clinical outcomes for CRC remain poor due to tumor recurrence, metastasis, and resistance to radio-/chemo-therapy [7,8].

Early diagnosis of CRC is of importance for its significant impacts on cancer management, prognosis, recurrence and survival [9-11]. The 5-year survival rate could rise up to 90% in CRC patients who were diagnosed in the early stage, but unfortunately, the great majority of CRC cases had developed to an advanced stage at the time of diagnosis with a low survival rate around 8-9% [12,13]. Invasive techniques used for CRC diagnosis including endoscopic and radiological imaging suffered from poor patient compliance [14]. In addition, tumor markers such as carbohydrate antigen 19-9 (CA 19-9) and Carcinoembryonic Antigen (CEA) commonly used in clinical circumstance have the problems of unsatisfactory sensitivity and specificity, resulting in limited clinical application in CRC diagnosis, prognosis and survival [15]. Thus, the development of noninvasive and accurate screening tools for early detection and precise staging of CRC are of great importance and significance.

Conventional Immunohistochemistry (IHC) is a diagnostic technique widely used in the field of tissue pathology. However, IHC suffers from a number of limitations such as relatively high interobserver variability and limited labelling of a single marker per tissue section, resulting in missed opportunities of important diagnostic and prognostic information [16-18]. By contrast, multiplex Immunohistochemistry (mIHC), allowing simultaneous detection of multiple markers on a single tissue section, has emerged as a promising technology for its capability of provision of high throughput multiplex immunohistochemical staining and standardized quantitative analysis of highly reproducible and efficient tissue studies, as well as comprehensive study of cellular component, marker expression patterns, relative spatial distribution of multiple cell types and cell‐cell interactions, which are of benefit to diagnostic accuracy [19-21].

In light of this, we analyzed the expression levels and potential clinicopathological prognosis values of six tumor-associated proteins including cluster of differentiation 4 (CD4), cluster of differentiation 8 (CD8), Pan-cytokeratin (P-CK), forkhead box P3 (FOXP3), programmed cell death 1 (PD1) and programmed death ligand-1 (PDL1) in colorectal cancer, relying on 7-color fluorescent multiplex immunostaining of tumor tissue microarray (TMA) from a cohort of 79 cancer patients.

Materials and Methods

Information for Patients

The HColA180Su17 tumor Tissue Microarray (TMA) (Outdo, Shanghai, China) consisted of paired colorectal adenocarcinoma tissues and adjacent normal tissues derived from 79 colorectal cancer patients. These patients underwent surgery from Jun. 2006 to Apr. 2007, and the follow-up information was available from Sep. 2007 to Jul. 2015. The study was conducted under the approval of the Institutional Ethics Committee and all procedures were performed according to relevant guidelines and regulations for research. The clinicopathological characteristics of 79 cancer patients were summarized in Table 1.

Table 1: Clinicopathological characteristics of a cohort of 79 colorectal cancer patients

Clinicopathological characteristics (N=79)

Number

Proportion (%)

Gender
Male

38

48.10%

Female

41

51.90%

Age (years)

≤65

36

45.57%

>65

43

54.43%

T stage

T1

1

1.27%

T2

5

6.33%

T3

58

73.42%

T4

15

18.98%

Lymph node (N stage)
Negative (N0)

48

60.76%

Positive (N1a, b-N2a, b)

31

39.24%

Metastasis (M stage)
Negative (M0)

78

98.73%

Positive (M1a, b)

1

1.27%

TNM stage
I

5

6.33%

II A

34

43.04%

II B

6

7.59%

II C

3

3.80%

III A

0

0.00%

III B

28

35.44%

III C

3

3.80%

IV A

0

0.00%

IV B

0

0.00%

Pathological grade
I

16

20.25%

II

50

63.29%

III

12

15.19%

IV

1

1.27%

Histology
Adenocarcinoma

31

39.24%

Canalicular adenoma

41

51.90%

Mucinous adenocarcinoma

6

7.59%

Signet-ring cell carcinoma

1

1.27%

Disease status at last follow-up
Survival

42

53.16%

Death

37

46.84%

Preparation of Tissue Microarray (TMA)

Tissue Microarray (TMA) was made on basis of pathological diagnosis of each tissue. Briefly, formalin-fixed and paraffin-embedded samples were identified as well as the specimens were reviewed with hematoxylin and eosin stain by an independent surgical pathologist in order to confirm the presence of colorectal cancer and adjacent normal tissues [22]. For the formation of TMA, core cylinders (1 mm) were punched from each of circled areas and stored in a recipient paraffin block after circling of at least two representative tumor areas from each block by the pathologist. At last, consecutive TMA sections (6 mm thick) were cut and placed onto poly-L-lysinecoated slides for subsequent analysis [23].

Fluorescent mIHC of TMA

For multiplex Immunohistochemistry (mIHC) staining, antibodies for CD4, CD8, PCK, FOXP3, PD1 and PDL1were optimized by concentration and application order, meanwhile, a spectral library was built based on the single-stained slides [24]. The multiplex immunofluorescence staining and multispectral imaging of these six proteins were obtained on a TMA slide using Opal Polaris 7 Color Manual IHC Detection Kit (cat NEL861001KT, Akoya, US). In brief, the slide was deparaffinized by xylene for 10 min for three times, followed by 100% ethanol, 95% ethanol, 85% ethanol, and 75% ethanol for 5 min, respectively. After rinsing in distilled water for 3 min, slide was pretreated with 100 ml citric acid solution (pH6.0/pH9.0) for antigen retrieval with microwaving (15 min on 20% power after 45 s on 100% power) and transferred to a slide jar containing 1xTBST to mix well. Afterwards, the slide was blocked in 10% blocking solution for 10 min, stained respectively with primary antibody against CD4, CD8, P-CK, FOXP3, PD1 or PDL1 for 1 h at room temperature, washed with 1xTBST for 3 min twice and incubated with polymer HRPanti-mouse/rabbit IgG secondary antibody for 10 min at room temperature. The slide was covered by Tyramide (TSA)-conjugated fluorophore (TSA Fluorescence Kits, Panovue, Beijing, China) at 1:100 dilution and incubated for 10 min at room temperature, washed with 1xTBST for 3 min twice  for next staining procedure. Furthermore, the process was repeated by microwave heat-treating the slide for antigen retrieval for every additional marker in mIHC assay, followed by one primary antibody staining during each cycle ordered as CD4, CD8, P-CK, FOXP3, PD1 and PDL1, respectively, and then downstream procedures as mentioned above. After labelling of all these human antigens, cell nucleus were counterstained with 4′,6diamidino-2-phenylindole (DAPI) (Sigma-Aldrich, US). Detailed information about primary antibodies was summarized in Table 2.

Table 2: Primary antibodies used for mIHC staining

Antibodies

Dilution Antibody Type Catalogue#

Vender

CD4

1:200

Rabbit monoclonal ab133616

Abcam

CD8

1:100

Mouse monoclonal NBP2-34039

NOVUS

P-CK

1:100

Mouse monoclonal GM351529

Gene Tech

FOXP3

1:200

Mouse monoclonal 14-4777-83

Thermo

PD1

1:200

Mouse monoclonal GT228129

Gene Tech

PDL1

1:200

Rabbit monoclonal ab213524

Abcam

Multispectral Imaging

The stained slide was scanned using the Vectra Polaris (Akoya, US) to obtain multispectral images, which precisely captures the fluorescent spectra from 420 to 720 nm (at 20-nm wavelength intervals) with identical exposure time. Next, the scans were combined into a single stack image with high contrast and accuracy

Scoring Multispectral Images

InForm Tissue Analysis Software (Akoya, US) was used in batch analysis of experimental multispectral images [25]. Firstly, images of single-stained and unstained sections were used to respectively extract the fluorescent spectrum of each fluorescein and autofluorescence of tissues. Secondly, the extracted images were used in establishment of a spectral library for multispectral unmixing by InForm image analysis software. Finally, using this established spectral library, gain of reconstructed images of sections with removed autofluorescence was fulfilled. In order to score multispectral images, three to six representative regions of interest for imaging (200×) from each case were selected. A few representative multispectral images were then loaded into analysis software to build an algorithm for segmenting tissues and cells. Next, two tissue categories of STROMA and TUMOR were trained in accordance with intensity of DAPI signals, these detected tissue compartments were selected and quantified for each stained target proteins, and corresponding number of positive and total cells were counted as well. 4-bin (0, 1+, 2+, 3+) scoring system was used for quantification of expression levels of target proteins by calculating H-score (a score which was calculated using the percentage in each bin and ranges from 0 to 300) with cell stains. Results of H-score were shown by the positive rate of cells in each bin, including four levels (0~1, 1~2, 2~3, 3~) so as to measure and categorize protein expression levels into negative, low, medium and high levels, respectively. Generally, H-score with 0~1 and 1~2 (0, 1+) were considered as low expression level, while score with 2~3 and 3~ (2+, 3+) were considered as high expression level.

Statistical Analysis

The significance of experimental data from patient specimens was determined by the Mann-Whitney U test. The Kaplan-Meier test was used to assess overall survival (OS) rates, and survival curves were plotted by the log-rank test. *P<0.05 was considered as statistically significant, **P<0.01 and ***P<0.0001 were considered as strongly significant. Statistics software GraphPad Prism version 8 was used for all statistical analyses.

Results

Demographics

A following-up for the cohort of 79 CRC patients was performed from 2008 to 2015 for the evaluation of a seven-year survival. Among these eight clinicopathological characteristics including gender, age, tumor size, T stage, N stage, M stage, TNM stage and pathological grade, the survival was associated with three of them, namely N stage, TNM stage as well as pathological grade. The results showed that prognosis of patients with negative lymph nodes (N0), early TNM stage (TNM I-II) and low pathological grade (Grade I-II) were significantly better than those with positive lymph nodes (N1-2), late TNM stage (TNM 3-4) and advanced pathological grade (Grade III-IV) (P<0.05, Figure 1 and Table 3).

fig 1

Figure 1: Overall survival (OS) rates of clinicopathological characteristics analyzed by Kaplan-Meier test. A. Lymph Node (N Stage), B. TNM Stage, C. Pathological Grade as clinical prognostic factors in cancer tissues in a cohort of 79 CRC patients. Orange dotted line: Overall survival (OS) rates as 50%.

Table 3: Prognostic clinicopathological characteristics of a cohort of 79 colorecta cancer patients

Clinicopathological characteristics

HR (95%CI)

P Value

Gender (male vs. female)

0.806 (0.410-1.584)

0.532

Age (yeas≤65 vs. yeas>65)

0.755 (0.384-1.484)

0.415

Tumor size (V≤10 cm3 vs. V>10 cm3)

0.783 (0.327-1.876)

0.584

T stage (T1-3 vs. T4)

0.812 (0.333-1.978)

0.646

N stage (Negative vs. Positive)

0.3709 (0.179-0.768)

<0.01

M stage (Negative vs. Positive)

2.787 (0.179-43.36)

0.464

TNM (TNM I-II vs. TNM III-IV)

0.413 (0.201-0.852)

<0.01

Pathological grade (I-II vs. III-IV)

0.209 (0.071-0.611)

<0.01

Fluorescent mIHC Profile on TMA Slides Derived from Colorectal Cancer Patients

In order to obtain multiple fluorescent images, the TMA slides were trained according to intensity of DAPI signals before the selection of detected tissue compartments for each stained target proteins on slides. All six antibodies of CD4, CD8, P-CK, FOXP3, PD1 and PDL1 were then performed ahead of the quantification of protein expression level by scoring system to calculate H-score based on cell fluorescence. In detected tissue compartments and cells, images of monochromatic proteins were shown in the upper row ordered as DAPI, CD4, CD8, P-CK, FOXP3, PD1 as well as PDL1 (Figure 2). In addition, merged images of the multispectral fluorescence of these target proteins and DAPI were displayed at the bottom of the figure. The selected images displayed tumor (Figure 2A) and adjacent normal (Figure 2B) tissues, respectively.

fig 2

Figure 2: Mono- and multi-chromatic mIHC profile of colorectal cancer and adjacent normal tissues. A, B. Representative images of monochromatic and multispectral fluorescence in tissues from colorectal cancer and adjacent normal areas. Small images in the upper row displayed selected tissue compartments stained by DAPI, CD4, CD8, P-CK, FOXP3, PD1 and PDL1. Large images at the bottom showed a merged multispectral fluorescence from DAPI, CD4, CD8, P-CK, FOXP3, PD1 and PDL1.

Determination of Significant Markers by Fluorescent mIHC in Colorectal Cancer Patients

In a cohort of 79 colorectal patients, comparison of the expression levels of CD4, CD8, P-CK, FOXP3, PD1 and PDL1 were performed between tumor and paracarcinomatous normal tissues for the exploration of cancer associated potential biomarker. As shown in Figure 3 for monochromatic proteins, expressions of P-CK and FOXP3 were upregulated while CD4 expression decreased significantly in cancer tissues compared with adjacent normal tissues (Figure 3A, P<0.05; Figure 3C, P<0.001; Figure 3D, P<0.01). As shown in Figure 4 for bi- as well as multi-chromatic combinations, except that the expression levels of bichromatic CD4/P-CK, CD8/P-CK and P-CK/FOXP3, trichromatic CD4/CD8/P-CK, multichromatic CD4/CD8/P-CK/FOXP3 and CD4/CD8/P-CK/FOXP3/PD1/PDL1 were of significant differences (Figure 4A to 4F, P<0.001), differential expressions were not observed in other combinations in cancer tissues. As to the compared expression levels of single, double or multiple stained combinations of these six target proteins, all data were analyzed by Mann-Whitney U test and the P values were shown in Table 4.

fig 3

Figure 3: Comparing expression levels of monochromatic target proteins based on H-scores by mIHC from tumor versus normal tissues in a cohort of 79 colorectal cancer patients. A to F. Differential expression patterns of single stained proteins including CD4 (3A. P<0.05), CD8 (3B, P=0.915), P-CK (3C, P<0.001), FOXP3 (3D, P<0.01), PD1 (3E, ns. P=0.231) and PDL1 (3F, P=0.511).

fig 4

Figure 4: Comparing expression levels of di- and multi-chromatic target proteins based on H-scores by mIHC from tumor versus normal tissues in a cohort of 79 colorectal cancer patients. A to F. Comparing expression patterns of combination of double and multiple stained proteins including CD4/P-CK (3A. P<0.001), CD8/PC-K (3B, P<0.001), P-CK/FOXP3 (3C, P<0.05), CD4/CD8/P-CK (3D, P<0.001), CD4/CD8/P-CK/FOXP3 (3E, P<0.001), and CD4/CD8/P-CK/FOXP3/PD1/PDL1 (3F, P<0.001).

Table 4: Differential expression of mIHC markers in cancer vs. normal tissues

mIHC target proteins

Cancer vs. Normal (N=79)

CD4

P < 0.05

CD8

P=0.915

P-CK

P < 0.001

FOXP3

P < 0.01

PD1

P=0.231

PDL1

P=0.511

CD4/CD8

P=0.340

CD4/P-CK

P < 0.001

CD8/P-CK

P < 0.001

CD4/FOXP3

P=0.058

CD8/FOXP3

P=0.781

P-CK/FOXP3

P < 0.001

PD1/PDL1

P=0.859

CD4/CD8/P-CK

P < 0.001

CD4/CD8/FOXP3

P=0.402

FOXP3/PD1/PDL1

P=0.975

CD4/CD8/P-CK/FOXP3

P < 0.001

CD4/CD8/PD1/PDL1

P=0.392

CD4/CD8/FOXP3/PD1/PDL1

P=0.481

CD4/CD8/P-CK/FOXP3/PD1/PDL1

P < 0.001

Correlation between Six Proteins and Clinicopathological Characteristics

Statistic analyses were performed by Mann-Whitney U test to explore the correlation between six proteins (CD4, CD8, P-CK, FOXP3, PD1 and PDL1) and eight cancer related clinicopathological factors (gender, age, tumor size, T stage, lymph node, metastasis, TNM stage, pathological grade). FOXP3 and P-CK were found to be correlated with tumor size and pathological grade, respectively , even though most of the correlations were of no significance (Table 5). Among which, expression of FOXP3 in tumor with volume>10 cm3 (N=65) was significantly lower than that in tumor with volume≤10 cm3 (N=14) (Figure 5A, P<0.01), and expression of P-CK in low pathological grade (Grade I-II) (N=66) was higher than that in advanced grade (Grade III-IV) (N=13) (Figure 5B, P<0.05).

Table 5: Correlation between mIHC target proteins and clinicopathological characteristics

Clinicopathological characteristics

P value

CD4

CD8 P-CK FOXP3 PD1

PDL1

Gender (male vs. female)

0.901

0.232 0.540 0.351 0.375

0.656

Age (yeas ≤65 vs. yeas >65)

0.805

0.419 0.503 0.491 0.768

0.730

Tumor size (V≤10 cm3 vs. V>10 cm3)

0.843

0.673 0.817 <0.01 0.695

0.912

T stage (T1-3 vs. T4)

0.587

0.780 0.995 0.527 0.350

0.231

N stage (negative vs. positive)

0.778

0.432 0.877 0.253 0.784

0.194

M stage (negative vs. positive)

TNM (TNM I-II vs. TNM III-IV)

0.775

0.424 0.866 0.533 0.835

0.939

Pathological grade (I-II vs. III-IV)

0.417

0.423 <0.05 0.924 0.526

0.537

fig 5

Figure 5: Significant correlations between two target proteins and clinicopathological characteristics in colorectal cancer tissues. A. The expression level of FOXP3 significantly declined in larger tumor (V>10 cm3) in comparison with smaller tumor (V≤10 cm3). B. The expression level of P-CK in pathological grade I and II was significantly higher than that in advanced grade III and IV. Data on the graph was displayed as mean ± SD (*P<0.05, **P<0.01).

Association of Prognosis Markers with Clinical Outcomes

For purpose of prognosis potential of these six proteins in CRC, expression of each protein was divided into low-expressed group (H-score 0 to 1+) and high-expressed group (H-score 2+ to 3+) on the basis of H-score representation calculated by the fluorescence intensity from three to six representative regions of each sample. Association of low-/high-level protein expression with the seven-year overall survival (OS) status of 79 CRC patients were analyzed by Kaplan-Meier test. Compared with CD4 (Figure 6A, P=0.122), CD8 (Figure 6B, P=0.905), P-CK (Figure 6C, P=0.406), PD1 (Figure 6E, P=0.582) and PDL1 (Figure 6F, P=0.156), FOXP3 was the only one with statistically significant association with CRC prognosis (Figure 6D, P<0.05). CRC patients with high-level FOXP3 expression (N=6) seemed to have a longer OS time than those with low-level expression (N=73) (Figure 6D, P<0.05), which supported the tumor-growth potential of low-expressed FOXP3 observed in our study (Figure 5A, P<0.01).

fig 6

Figure 6: Overall survival (OS) rates with differential expression levels of CD4 and FOXP3 analyzed by Kaplan-Meier test. The low- and high-expression of A. CD4 and B. FOXP3 were associated with a status of seven-year survival in cancer tissues in a cohort of 79 CRC patients. Orange dotted line: half of OS rates as 50%.

Discussion

In this study, we performed multiplex immunohistochemistry analysis on six target proteins to explore the correlation of these molecules with colorectal cancer. FOXP3 (forkhead box P3, also named IPEX, PIDX) is a member of the forkhead box (FOX) family of transcription factors consisting of an evolutionarily conserved group of transcriptional regulators whose dysfunction has been associated with human malignant neoplasias [26-35]. FOXP3 is mainly expressed in regulatory T (Treg) cells, and it has also been found in other cells such as B lymphocytes [36-42]. FOXP3 was described as an important molecular actor involved in the development and function of Treg cells playing essential roles in the regulation of autoimmunity, infection and tumor environment [36-38]. FOXP3 is considered as a molecule at the crossroads of tumorigenesis and immunity for its bilateral role of cancer promotor or suppressor [42-46]. Furthermore, the role of FOXP3 in the biogenesis, development as well as clinical prognosis of colorectal cancer is still not completely understood, thereinto, infiltration of FOXP3+ Treg cells indicated favorable prognosis in some but not all studies [47-57]. Our results showed that the expression level of FOXP3 was not only significantly upregulated in tumor tissues (Figure 3D, P<0.01), but also associated with tumor size (Table 5, P<0.01). Additionally, FOXP3 expression in CRC patients with tumor volume>10 cm3 was significantly lower than that in patients with tumor volume≤10 cm3 (Figure 5A, P<0.01), indicating a tumor growth potential of FOXP3 with low expression in CRC, consistently, reduced expression of FOXP3 was associated with worse prognosis (Figure 6D, P<0.05). All these results showed that FOXP3 could be applied as a potential biomarker for CRC diagnosis and prognosis.

CD4, a membrane glycoprotein of T lymphocytes, is expressed not only in T lymphocytes, but also in B cells, macrophages as well as granulocytes. CD4 acts as a coreceptor with the T-cell receptor on T lymphocytes in recognition of antigens displayed by antigen-presenting cells in the context of class II major histocompatibility complex (MHC) molecules, and functions to initiate or augment the early phase of T-cell activation. Similarly, CD8, a cell surface glycoprotein found on most cytotoxic T lymphocytes mediating immune cell-cell interactions, acts as a coreceptor with the T-cell receptor on T lymphocytes to recognize antigens displayed by antigen-presenting cells in the context of class I MHC molecules. In general, CD4+ and CD8+ T cells identify antigens related to cancer cells and play significant roles in cancer immunology and immunotherapy [58,59]. Additionally, various studies have demonstrated that CD4+ and CD8+ T cells may also control tumor growth [60,61]. Increased levels of CD4+ and CD8+ T cells in colorectal tumor microenvironment were shown to correlate with improved response to chemoradiotherapy [62]. Results of prevenient studies suggested that levels of tumor infiltration by CD4+ and CD8+ T cells may be good predictive factors for patient clinical prognosis of various tumors including colorectal cancer, melanoma, oesophageal squamous cell carcinoma, ovarian cancer, pancreatic cancer and renal cancer [63-71]. Differently, compared with adjacent normal tissues, the expression levels of CD4 and CD8 in colorectal cancer tissues here decreased significantly and had no difference, respectively (Figure 3A and 3B), suggesting reduced immune infiltration of CD4+ and CD8+ T cells. What’s more, association of differential expression levels of CD4 or CD8 with clinical outcomes of CRC patients was of no significance (Figure 6A and 6B), and they had no significant association with tumor size or other clinicopathological characteristics (Table 5). Malignant tumors like CRC can cause the functional loss of antigen recognition, cell proliferation and activation of effector T cells, which is known as T cell exhaustion accompanied by the activation of multiple inhibitory receptors such as CTLA4 and PD1/PDL1 [72-74]. The decreased infiltration and effects on prognosis of CD4+ and CD8+ T cells observed here may be related to T cell exhaustion. Generally, the biological behaviors of cancers are influenced by the functional status of tumor-infiltrating immune cells whose roles in response to cancer are component- and stage-dependent. The CD4+ T cells consist of multiple morphologically and functionally distinctive subpopulations such as T regulatory (Treg) cells, T helper 1 (Th1), Th2, Th9, Th17 and follicular helper T (Tfh) cells, whose roles related to proinflammation and/or antiinflammation, activation and infiltration of CD8+ T cells in tumor microenvironment display tumor-promoting or tumor-suppressing effects in a case-dependent manner [75-87]. The limited tumor infiltration and functional potential of CD8+ T cells over served in this study might be partially due to a lack of CD4+ Th cell-mediated function.

PD1 (programmed cell death 1, also named PDCD1, CD279), an immunoinhibitory receptor belonging to the CD28 family that is expressed on activated T cells, is involved in T cell proliferation and functional regulation including those of effector CD8+ T cells, and also able to promote the differentiation of CD4+ T cells into T regulatory cells [88-90]. PD1 is expressed in many types of tumors and has demonstrated to play roles in anti-tumor immunity, safeguarding against autoimmunity as well as the inhibition of effective anti-tumor and anti-microbial immunity. Furthermore, PD1 interacts with ligand PDL1 (also named B7-H1, CD274) to form the PD1/PDL1 axis, an immune checkpoint which is usually up-regulated to help tumor cells avoid immune destruction in an immunosuppressive tumor microenvironment [91]. Overexpressed PDL1 can protect tumor cells by inhibiting the activity of PD1 expressing adjoining tumor-infiltrating effector CD4+/CD8+ T cells [92]. PDL1 is mainly expressed on the surface of antigen-representing and tumor cells in various types of cancer such as carcinomas of the adrenal cortex, bladder, brain, breast, colorectum, esophagus, gastrointestinal tract, kidney, liver, lung, ovary, pancreas, thymus, thyroid and urothelium [93]. Contradictory correlations of expression of PD1 and/or PDL1 with prognosis results and clinicopathological characteristics of colorectal cancer were observed (some investigations showed that overexpression of PD1 and/or PDL1 forecasted better prognosis, while others presented opposite results), even if PD1 and PDL1 may play oncogenic roles in colon cancer carcinogenesis [94-98]. Again, in our study, no significant difference was observed between expression of either PD1 or PDL1 in colorectal cancer tissues and those in normal tissues (Figure 3E and 3F), they also had no significant association with pathological grade or other characteristics (Table 5). Differential expression of PD1 or PDL1 was not statistically associated with CRC prognosis (Figure 6E and 6F). All these results indicated that PD1 and PDL1, in comparison to using alone, are more suitable for combination with other proteins for the application as potential biopredictors of CRC diagnosis.

References

  1. McGuire S Geneva (2016) Switzerland: World Health Organization, International Agency for Research on Cancer, WHO Press, 2015. Advances in Nutrition An International Review Journal 7: 418-419. [crossref]
  2. Jahani-Sherafat S, Alebouyeh M, Moghim S, et al. (2018) Role of gut microbiota in the pathogenesis of colorectal cancer; a review article. Gastroenterology and Hepatology from Bed to Bench 11: 101-109. [crossref]
  3. Torre LA, Bray F, Siegel RL, Ferlay J, Lortet-Tieulent J, et al. (2015) Global cancer statistics, 2012. CA: A Cancer Journal for Clinicians 65: 87-108. [crossref]
  4. Favoriti P, Carbone G, Greco M, et al. (2016) Worldwide burden of colorectal cancer: a review. Updates in Surgery 68: 7-11. [crossref]
  5. Fearon ER, Vogelstein B (1990) A genetic model for colorectal tumorigenesis. Cell 61: 759-767. [crossref]
  6. Graham JS, Cassidy J (2012) Adjuvant therapy in colon cancer. Expert Review of Anticancer Therapy 12: 99-109. [crossref]
  7. Bandar MA, Kim N (2017) Current status and future perspectives on treatment of liver metastasis in colorectal cancer (Review). Oncology Reports 37: 2553-2564. [crossref]
  8. Soon-Chan K, Young-Kyoung S, Ye-Ah K, et al. (2018) Identification of genes inducing resistance to ionizing radiation in human rectal cancer cell lines: re-sensitization of radio-resistant rectal cancer cells through down regulating NDRG1. BMC Cancer 18: 594. [crossref]
  9. Duffy MJ, Dalen AV, Haglund C, et al. (2007) Tumour markers in colorectal cancer: European Group on Tumour Markers (EGTM) guidelines for clinical use. European Journal of Cancer 43: 1348-1360. [crossref]
  10. Duffy MJ, Dalen AV, Haglund C, et al. (2003) Clinical utility of biochemical markers in colorectal cancer: European Group on Tumour Markers (EGTM) guidelines. European Journal of Cancer 39: 718-727. [crossref]
  11. Zhou Y, Abel G A, Hamilton W, et al. (2017) Diagnosis of cancer as an emergency: a critical review of current evidence. Nature Reviews Clinical Oncology 14: 45-56. [crossref]
  12. Meyerhardt JA, Mayer RJ (2005) Systemic therapy for colorectal cancer. New England Journal of Medicine 352: 476-487. [crossref]
  13. Mazzanti R, Solazzo M, Ornella Fantappié, et al. (2006) Differential expression proteomics of human colon cancer. American Journal of Physiology Gastrointestinal & Liver Physiology 290: G1329.
  14. Wang H, Tso VK, Slupsky CM, Fedorak RN (2010) Metabolomics and detection of colorectal cancer in humans: a systematic review. Future Oncology 6: 1395-1406. [crossref]
  15. Ni Y, Xie G, Jia W (2014) Metabonomics of human colorectal cancer: new approaches for early diagnosis and biomarker discovery. Journal of Proteome Research 13: 3857-3870. [crossref]
  16. Polley M, Leung S, Mcshane LM, Gao D, Hugh JC, et al. (2013) An International Ki67 Reproducibility Study. Journal of the National Cancer Institute 105: 1897-1906. [crossref]
  17. Varga Z, Diebold J, Dommann-Scherrer C, Frick H, Kaup D, et al. (2015) How Reliable Is Ki-67 Immunohistochemistry in Grade 2 Breast Carcinomas? A QA Study of the Swiss Working Group of Breast- and Gynecopathologists. Plos One 7: e37379. [crossref]
  18. Cheng CL, Thike AA, Tan S, Chua PJ, Bay BH, et al. (2015) Expression of FGFR1 is an independent prognostic factor in triple-negative breast cancer. Breast Cancer Research & Treatment 151: 99-111. [crossref]
  19. Stack Edward C, Wang C, Roman KA, Hoyt CC (2014) Multiplexed immunohistochemistry, imaging, and quantitation: A review, with an assessment of Tyramide signal amplification, multispectral imaging and multiplex analysis. Methods: A Companion to Methods in Enzymology 70: 46-58.
  20. Abel EJ, Bauman TM, Weiker M, Shi F, Downs TM, et al. (2014) Analysis and validation of tissue biomarkers for renal cell carcinoma using automated high-throughput evaluation of protein expression. Human Pathology 45: 1092-1099. [crossref]
  21. Lim JCT, Yeong JPS, Lim CJ, Ong CCH, Wong SC, et al. (2018) An automated staining protocol for 7colour immunofluorescence of human tissue sections for diagnostic and prognostic use. Pathology 50: 333. [crossref]
  22. Ring Kari L, Frumovitz MM, Yemelyanova AV, Soliman PT, Jazaeri AA (2017) Potential immunotherapy targets in recurrent cervical cancer. Gynecologic Oncology: An International Journal 145: 462-468. [crossref]
  23. F Min, Li Y, Kai H, Qi S, Zhang J, et al. (2017) IL33 Promotes Colon Cancer Cell Stemness via JNK Activation and Macrophage Recruitment. Cancer Research 77: 2735. [crossref]
  24. Ying L, Yan F, Meng Q, Yu L, Yuan X, et al. (2018) PD-L1 expression is a prognostic factor in subgroups of gastric cancer patients stratified according to their levels ofCD8 and FOXP3 immune markers. Oncoimmunology 7: e1433520. [crossref]
  25. Yang L, Liu Z, Tan J, Dong H, Zhang X (2018) Multispectral imaging reveals hyper active TGF-β signaling in colorectal cancer. Cancer biology & therapy 19: 1-8. [crossref]
  26. Darnell James E (2002) Transcription factors as targets for cancer therapy. Nature Reviews Cancer 2: 740-749. [crossref]
  27. Tong IL, Young RA (2013) Transcriptional Regulation and Its Misregulation in Disease. Cell 152: 1237-1251. [crossref]
  28. Bhagwat AS, Vakoc CR (2015) Targeting Transcription Factors in Cancer. Trends in Cancer 1: 53-65.
  29. Myatt SS, Lam WF (2007) The emerging roles of forkhead box (Fox) proteins in cancer. Nature Reviews Cancer 7: 847-859. [crossref]
  30. Hannenhalli S, Kaestner KH (2009) The evolution of Fox genes and their role in development and disease. Nature Reviews Genetics 10: 233-240. [crossref]
  31. Benayoun BA, Caburet S, Veitia RA (2011) Forkhead transcription factors: key players in health and disease. Trends in Genetics 27: 224-232. [crossref]
  32. Lam EF, Brosens JJ, Gomes AR, Koo CY (2013) Forkhead box proteins: tuning forks for transcriptional harmony. Nature Reviews Cancer 13: 482-495. [crossref]
  33. Katoh M, Igarashi M, Fukuda H, Nakagama H, Katoh M (2013) Cancer genetics and genomics of human FOX family genes. Cancer Letters 328: 198-206. [crossref]
  34. Lam EW, Gomes AR (2014) Forkhead box transcription factors in cancer initiation, progression and chemotherapeutic drug response. Frontiers Research Topic. Molecular & Cellular Oncology 4: 305. [crossref]
  35. Golson ML, Kaestner KH (2016) Fox transcription factors: from development to disease. Development 143: 4558-4570. [crossref]
  36. Fontenot JD, Gavin MA, Rudensky AY (2003) Foxp3 programs the development and function of CD4+CD25+ regulatory T cells. Nature Immunology 4: 330336. [crossref]
  37. Khattri R, Cox T, Yasayko SA, Ramsdell F (2003) An essential role for Scurfin in CD4+CD25+ T regulatory cells. Nature Immunology 4: 337-342. [crossref]
  38. Campbell DJ, Ziegler SF (2007) FOXP3 modifies the phenotypic and functional properties of regulatory T cells. Nature Reviews Immunology 7: 305. [crossref]
  39. Triulzi T, Tagliabue E, Balsari A, Casalini P (2013) FOXP3 expression in tumor cells and implications for cancer progression. Journal of Cellular Physiology 228: 30-35. [crossref]
  40. Mercer F, Unutmaz D (2009) The Biology of FoxP3: A Key Player in Immune Suppression during Infections, Autoimmune Diseases and Cancer. Oxygen Transport to Tissue 665: 47-59. [crossref]
  41. Martin F, Ladoire S, Mignot G, Apetoh L, Ghiringhelli F (2010) Human FOXP3 and cancer. Oncogene 29: 4121-4129. [crossref]
  42. Redpath M, Xu B, Kempen L, Spatz A (2011) The dual role of the X-linked FoxP3 gene in human cancers. Molecular Oncology 5: 156-163. [crossref]
  43. Tao Z, Wang L, Morrison C, Chang X, Zhang H, et al. (2007) FOXP3 is an X-linked breast cancer suppressor gene and an important repressor of the HER-2/ErbB2 oncogene. Cell 129: 1275-1286. [crossref]
  44. Katoh H, Zheng P, Liu Y (2010) Signalling through FOXP3 as an X-linked tumor suppressor. International Journal of Biochemistry & Cell Biology 42: 1784-1787. [crossref]
  45. Wang L, Liu R, Ribick M, et al. (2010) FOXP3 as an X-linked tumor suppressor. Discovery medicine 10: 322-328.
  46. Redpath M, Xu B, Kempen LC, Spatz A (2011) The dual role of the X-linked FoxP3 gene in human cancers. Molecular Oncology 5: 156-163. [crossref]
  47. Xu P, Wei F, Zheng Z, Wang J, Wang P, et al. (2017) The Clinicopathological and Prognostic Implications of FoxP3+ Regulatory T Cells in Patients with Colorectal Cancer: A Meta-Analysis. Frontiers in Physiology 8: 950. [crossref]
  48. Sinicrope FA, Rego RL, Ansell SM, Knutson KL, Foster NR, et al. (2009) Intraepithelial Effector (CD3+)/Regulatory (FoxP3+) T-Cell Ratio Predicts a Clinical Outcome of Human Colon Carcinoma. Gastroenterology 137: 1270-1279. [crossref]
  49. Fridman WH, Pagès F, Sautès-Fridman C, Galon J (2012) The immune contexture in human tumours: impact on clinical outcome. Nature Reviews Cancer 12: 298-306. [crossref]
  50. Suzuki, H, Onishi, Morisaki T, Tanaka M, Katano M (2013) Intratumoral FOXP3+VEGFR2+ regulatory T cells are predictive markers for recurrence and survival in patients with colorectal cancer. Clinical Immunology San Diego Academic Press 146: 26-33. [crossref]
  51. Yong H, Huaiwei L, Yong Z, Yuan R, Wang F, et al. (2014) Prognostic Value of Tumor-Infiltrating FoxP3+ T Cells in Gastrointestinal Cancers: A Meta Analysis. Plos One 9: e94376. [crossref]
  52. Shang B, Liu Y, Jiang SJ, Liu Y (2015) Prognostic value of tumor-infiltrating FoxP3+ regulatory T cells in cancers: a systematic review and meta-analysis. Scientific Reports 5: 15179. [crossref]
  53. Yoon HH, Orrock JM, Foster NR, Sargent DJ, Smyrk TC, et al. (2012) Prognostic Impact of FoxP3+ Regulatory T Cells in Relation to CD8+ T Lymphocyte Density in Human Colon Carcinomas. PLoS ONE 7: e42274. [crossref]
  54. Salama P, Phillips M, Grieu F, Morris M, Zeps N, et al. (2009) Tumor-infiltrating FOXP3+ T regulatory cells show strong prognostic significance in colorectal cancer. Journal of Clinical Oncology 27: 186-192. [crossref]
  55. Sinicrope FA, Rego RL, Ansell SM, Knutson KL, Foster NR, et al. (2009) Intraepithelial Effector (CD3+)/Regulatory (FoxP3+) T-Cell Ratio Predicts a Clinical Outcome of Human Colon Carcinoma. Gastroenterology 137: 1270-1279. [crossref]
  56. Deleeuw RJ, Kost SE, Kakal JA, Nelson BH (2012) The Prognostic Value of FoxP3+ TumorInfiltrating Lymphocytes in Cancer: A Critical Review of the Literature. Clinical Cancer Research 18: 3022-3029. [crossref]
  57. Saito T, Nishikawa H, Wada H, Nagano Y, Sugiyama D, et al. (2016) Two FOXP3+CD4+ T cell subpopulations distinctly control the prognosis of colorectal cancers. Nature Medicine 22: 679-684. [crossref]
  58. Jannie B, Tomasz A, Nikolina B, Melief CJM, Kastenmüller W (2018) CD4+ T cell help in cancer immunology and immunotherapy. Nature Reviews Immunology 18: 635-647. [crossref]
  59. Bagher Farhood, Masoud N, Mortezaee K (2019) CD8+ cytotoxic T lymphocytes in cancer immunotherapy: A review. Journal of cellular physiology 234: 8509-8521. [crossref]
  60. Flynn S, Stockinger B (2003) Tumor and CD4 T-cell interactions: tumor escape as result of reciprocal inactivation. Blood 101: 4472-4478. [crossref]
  61. Boer D Th A, van Mierlo GJ, Fransen MF, Melief CJ, Offringa R, et al. (2005) CD4+ T Cells Are Able to Promote Tumor Growth through Inhibition of Tumor-Specific CD8+ T-Cell Responses in Tumor-Bearing Hosts. Cancer Research 65: 6984. [crossref]
  62. Yasuda K, Nirei T, Sunami E, Nagawa H, Kitayama J (2011) Density of CD4(+) and CD8(+) T lymphocytes in biopsy samples can be a predictor of pathological response to chemoradiotherapy (CRT) for rectal cancer. Radiation Oncology 6: 49. [crossref]
  63. Olino K, Park T, Ahuja N (2020) Exposing Hidden Targets: Combining epigenetic and immunotherapy to overcome cancer resistance – Science Direct. Seminars in Cancer Biology 65: 114-122.
  64. Mlecnik B, Bindea G, Angell HK, Maby P, Angelova M, et al. (2016) Integrative Analyses of Colorectal Cancer Show Immunoscore Is a Stronger Predictor of Patient Survival Than Microsatellite Instability. Immunity 44: 698-711. [crossref]
  65. Fukunaga A, Miyamoto M, Cho Y, Murakami S, Kawarada Y, et al. (2004) CD8+ tumor-infiltrating lymphocytes together with CD4+ tumor-infiltrating lymphocytes and dendritic cells improve the prognosis of patients with pancreatic adenocarcinoma. Pancreas 28: 26-31. [crossref]
  66. Cho Y, Miyamoto M, Kato K, Fukunaga A, Shichinohe T, et al. (2003) CD4+ and CD8+ T cells cooperate to improve prognosis of patients with esophageal squamous cell carcinoma. Cancer Research 63: 1555-1559. [crossref]
  67. Zhang L, Conejogarcia J R, Katsaros D, Gimotty PA, Massobrio M, et al. (2003) Intratumoral T cells, recurrence, and survival in epithelial ovarian cancer. N Engl J Med 348: 203-213. [crossref]
  68. Nakano O, Sato M, Naito Y, Suzuki K, Orikasa S, et al. (2001) Proliferative activity of intratumoral CD8 (+) T-lymphocytes as a prognostic factor in human renal cell carcinoma: clinicopathologic demonstration of antitumor immunity. Cancer Res 61: 5132-5136. [crossref]
  69. Bromwich EJ, Mcardle PA, Canna K, McMillan DC, McNicol AM, et al. (2003) The relationship between Tlymphocyte infiltration, stage, tumour grade and survival in patients undergoing curative surgery for renal cell cancer. British Journal of Cancer 89: 1906-1908. [crossref]
  70. Giraldo NA, Sanchez-Salas R, Peske JD, Vano Y, Becht E, et al. (2018) The clinical role of the TME in solid cancer. British Journal of Cancer 120: 45-53. [crossref]
  71. Wang B, Li F, Guo L, et al. (2020) Loss of survival advantage for deficient mismatch repair in patients with advanced colorectal cancer may be caused by changes in prognostic value of CD8+T cell expression. World J Surg Oncol 18: 196. [crossref]
  72. Wherry E J, Kurachi M (2015) Molecular and cellular insights into T cell exhaustion. Nature Reviews Immunology 15: 486-499. [crossref]
  73. Blackburn SD, Shin H, Haining WN, Zou T, Workman CJ, et al. (2009) Coregulation of CD8+ T cell exhaustion by multiple inhibitory receptors during chronic viral infection. Nature Immunology 10: 29-37. [crossref]
  74. Sen DR, Kaminski J, Barnitz RA, Kurachi M, Gerdemann U, et al. (2016) The epigenetic landscape of T cell exhaustion. Science 354: 1165-1169. [crossref]
  75. Grivennikov SI, Greten FR, Karin M (2010) Immunity, Inflammation, and Cancer. Cell 140: 883-899. [crossref]
  76. Baitsch L, Baumgaertner P, Estelle Devêvre, Raghav SK, Legat A, et al. (2011) Exhaustion of tumor-specific CD8+ T cells in metastases from melanoma patients. Journal of Clinical Investigation 3: 23-25. [crossref]
  77. Zarour HM (2016) Reversing T-cell Dysfunction and Exhaustion in Cancer. Clinical Cancer Research 22: 1856-1864. [crossref]
  78. Bos R, Sherman LA (2010) CD4+ T-Cell Help in the Tumor Milieu Is Required for Recruitment and Cytolytic Function of CD8+ T Lymphocytes. Cancer Research 70: 8368. [crossref]
  79. Ruffell B, De Nardo DG, Affara NI, Coussens LM (2010) Lymphocytes in cancer development: Polarization towards pro-tumor immunity. Cytokine & Growth Factor Reviews 21: 3-10. [crossref]
  80. Zanetti Maurizio (2015) Tapping CD4 T Cells for Cancer Immunotherapy: The Choice of Personalized Genomics. The Journal of Immunology: Official Journal of the American Association of Immunologists 194: 2049-2056. [crossref]
  81. Vegran F, Apetoh L, Ghiringhelli F (2015) Th9 Cells: A Novel CD4 T-cell Subset in the Immune War against Cancer. Cancer Research 75: 475-479. [crossref]
  82. Vegran F, Berger H, Boidot R, Mignot G, Bruchard M, et al. (2014) The transcription factor IRF1 dictates the IL21-dependent anticancer functions of [T.sub.H] 9 cells. Nature Immunology 15: 758-766. [crossref]
  83. Bailey SR, Nelson MH, Himes RA, Li Z, Mehrotra S, et al. (2014) Th17 cells in cancer: the ultimate identity crisis. Frontiers in Immunology 5: 276. [crossref]
  84. Sara O, Pizarro TT (2015) The Treg/Th17 Axis: A Dynamic Balance Regulated by the Gut Microbiome. Frontiers in Immunology 6: 639. [crossref]
  85. El-Omar E M, Rabkin C S, MD Gammon, et al. (2003) Increased risk of noncardia gastric cancer associated with proinflammatory cytokine gene polymorphisms. Gastroenterology 124: 1193-1201.
  86. Grivennikov Sergei I (2013) Inflammation and colorectal cancer: colitis-associated neoplasia. Seminars in Immunopathology 35: 229-244. [crossref]
  87. Huang J, Shen F, Huang H, Ling C, Zhang G (2017) Th1 high in tumor microenvironment is an indicator of poor prognosis for patients with NSCLC. Oncotarget 8: 13116-13125. [crossref]
  88. Freeman GJ, Long AJ, Iwai Y, Bourque K, Chernova T, et al. (2000) Engagement of the Pd-1 Immunoinhibitory Receptor by a Novel B7 Family Member Leads to Negative Regulation of Lymphocyte Activation. The Journal of Experimental Medicine 192: 1027-1034. [crossref]
  89. Nishimura H, Nose M, Hiai H, et al. (1999) Development of Lupus-like Autoimmune Diseases by Disruption of the PD-1 Gene Encoding an ITIM Motif-Carrying Immunoreceptor. Immunity 11: 141-151. [crossref]
  90. Nishimura H, Okazaki T, Tanaka Y, Nakatani K, Hara M, et al. (2001) Autoimmune Dilated Cardiomyopathy in PD-1 Receptor-Deficient Mice. Science 291: 319-322. [crossref]
  91. Fusi A, Festino L, Botti G, Masucci G, Melero I, et al. (2015) PD-L1 expression as a potential predictive biomarker. Lancet Oncology 16: 1285-1287. [crossref]
  92. Dong Haidong, Strome SE, Salomao DR, Tamura H, Hirano F, et al. (2002) Tumor-associated B7-H1 promotes T-cell apoptosis: A potential mechanism of immune evasion. Nature Medicine 8: 793-800. [crossref]
  93. Yu J, Wang X, Teng F, Kong L (2016) PD-L1 expression in human cancers and its association with clinical outcomes. Oncotargets & Therapy 9: 5023-5039. [crossref]
  94. Shi SJ, Wang LJ, Wang GD, Guo ZY, Wei M, et al. (2013) B7-H1 Expression Is Associated with Poor Prognosis in Colorectal Carcinoma and Regulates the Proliferation and Invasion of HCT116 Colorectal Cancer Cells. Plos One 8: e76012. [crossref]
  95. Angelica C M, Cristina I, David V, Wang X, Peltier HJ, et al. (2016) PDL1 Regulation by p53 via miR-34. Journal of the National Cancer Institute 108: 303. [crossref]
  96. Yang L, Xue R, Pan C (2019) Prognostic and clinicopathological value of PD-L1 in colorectal cancer: a systematic review and meta-analysis. OncoTargets and therapy 12: 3671-3682. [crossref]
  97. Masugi Y, Nishihara R, Yang J, Mima K, da Silva A, et al. (2016) Tumour CD274 (PD-L1) expression and T cells in colorectal cancer. Gut 1463. [crossref]
  98. Li Y, Liang L, Dai W, Cai G, Xu Y, et al. (2016) Prognostic impact of programed cell death-1 (PD-1) and PD-ligand 1 (PD-L1) expression in cancer cells and tumor infiltrating lymphocytes in colorectal cancer. Molecular Cancer 15: 55. [crossref]

Implications of the Strong Black Woman Stereotype for Maternal and Perinatal Health: A Short Note

DOI: 10.31038/IGOJ.2022521

Short Commentary

Operationalizing diverse forms of racism is essential to dismantling inequities in maternal and perinatal health and is a necessary step toward reproductive health justice for Black women in the United States (U.S.). Despite the well-known negative association between racism and health outcomes among U.S. minority racial groups [1,2], scant research exists examining the associations between internalized racism and stress and their impact on maternal mental health and birth outcomes [3]. This limitation is problematic. Among non-Hispanic Black Americans living in the U.S., exposure to racism significantly correlates to poor mental health, including psychological stress, anxiety, and depression, which have a positive relationship to poor birth outcomes among Black women [4].

Research has found that the prevalence of Low Birthweight (LBW) babies among African American populations is approximately two times higher (13.9%) than in White, non-Hispanic populations (7.0%) [5]. While Preterm Births (PTB) were found to have generally declined in 2020, this rate continues to be much higher among Black non-Hispanic women than in White women at 14.39% and 9.10%, respectively [5]. The health implications for LBW and PTB infants are substantive and can lead to a life course of poor health. Adding to this concern, the infant mortality rate among Black births was 10.6 per 1,000 deaths, which is nearly 2.5 times higher than that of White infants (4.5 times per 1,000 deaths) [6].

Structural racism remains a constant threat to Black women’s reproductive health. Manifesting in personally-mediated discrimination and inequitable policies, racism is often based on historical and sociocultural tropes or stereotypes, which characterize Black Americans as inadequate and inferior. One response of stigmatized racial populations to pervasive negative racial stereotypes is to internalize this racism with significant repercussions to maternal and perinatal health.

Internalized racism is the unconscious appropriation of the dominant White culture’s actions, beliefs, and stereotypes about racialized peoples [3]. Not to be mistaken for individual pathology, it takes shape through frequent and enduring exposure to multiple layers of racial oppression in the U.S. [7,8]. One mechanism by which internalized racism can cause mental and physical harm is through an understudied specific internalized representation of racism, the Strong Black Woman (SBW). Intergenerationally, Black women perceive the Strong Black Woman as a natural and normal aspect of identity as it characterizes Black women’s pride, persistence, and imperviousness to everyday occurrences of racism, allowing for their survival and that of their families and communities within an adversarial social context [9]. As such, the SBW presents with certain normative behaviors, such as enduring strength, the suppression of emotions, resistance to vulnerability or dependence, persistence to succeed despite limited resources, and a responsibility to help others. While the SBW has been touted as a coping mechanism encouraging self-efficacy and perseverance, this caricature of Black women’s strength is rooted in attitudes and beliefs that justified their enslavement during chattel slavery in the U.S. to maintain White power and privilege [10].

Complicit with racist ideology, the SBW schema harms self-image with far-reaching implications for Black mothers [11-13]. The SBW is a norm to which Black women’s behavior is compared and modulated, leading to maladaptive perfectionism, affect, and coping. With few opportunities for expressing emotions or vulnerabilities, unrealistic expectations allow shame, guilt, and low self-esteem to surface when women perceive themselves as not meeting the standards. These factors are associated with strained interpersonal relationships, stress-related health behaviors, the embodiment of stress, delayed self-care, decreased help-seeking behaviors, and a lack of social or emotional support [12-16], which erodes resilience and compounds psychological stress, depression, and anxiety [2,14,17]. Further research demonstrates that health practitioners often dismiss Black mothers’ concerns using perceptions informed by a skewed understanding of Black women’s strengths [18]. The SBW schema reinforces a longstanding stereotype that Black women can “naturally endure” pain, affecting how their pain is perceived and managed in the healthcare setting, especially during labor and delivery [18]. As a form of internalized racism, the SBW stereotype threatens Black women’s health and well-being at individual and health system levels with severe implications for maternal and perinatal health.

There is an urgent need for health practitioners to mitigate these adverse maternal and perinatal outcomes [19]. One way is moving away from a physician-centered model of care toward a reproductive justice (RJ) framework of healthcare delivery, which addresses social and structural determinants of health, such as access to quality care, housing, nutrition, education, and diverse forms of racism [20]. RJ seeks to increase access to just and equitable care, improving adverse health outcomes and disparities. In the context of the SBW stereotype, health practitioners work to understand racism and its internalization. They encourage self-determination in perinatal health care experiences [20]. Furthermore, within an RJ framework, health practitioners make timely and appropriate recommendations for therapy while considering factors like racial or cultural concordance [21]. Removing language and policies within healthcare systems that rely on harmful stereotypes, such as the SBW schema, is necessary to improve Black perinatal and infant health outcomes.

Until harmful narratives surrounding Black women’s strength are disassembled, emotional dysregulation, poor mental health, and medical racism will likely continue, allowing for the persistence of poor maternal and perinatal outcomes. RJ seeks to understand better and mitigate the impacts of racism on perinatal and infant health outcomes. Clinical research examining internalized racism and its association with stress, maternal mental health, and birth outcomes are imperative for improving perinatal health care inequities.

Keywords

Perinatal health, Internalized racism, Structural racism, Reproductive justice, Maternal health care, Health communication

References

  1. Gale MM, Pieterse AL, Le DL, Huynh K, Powell S, et al. (2020) A meta-analysis of the relationship between internalized racial oppression and health-related outcomes. The Counseling Psychologist 48: 498-525.
  2. Jefferies K (2020) The strong black woman: insights and implications for nursing. Journal of the American Psychiatric Nurses Association 28: 332-338. [crossref]
  3. Treder K, White KO, Woodhams E, Pancholi R, Yinusa-Nyahkoon L (2022) Racism and the reproductive health experiences of U.S.-born black women. Obstetrics & Gynecology 139: 407-416. [crossref]
  4. Paradies Y, Ben J, Denson N, Elias A, Priest N, et al. (2015) Racism as a determinant of health: A systematic review and meta-analysis. PLOS ONE 10: e0138511. [crossref]
  5. Bridgeman-Bunyoli AM, Cheyney M, Monroe SM, Wiggins N, Vedam S (2022) Preterm and low birthweight birth in the United States: Black midwives speak of causality, prevention, and healing. Birth 49: 526-539. [crossref]
  6. Hoyert D (2022, February). Maternal mortality rates in the United States, 2020. Centers for Disease Control and Prevention.
  7. Brown DL, Rosnick CB, Segrist DJ (2017) Internalized racial oppression and higher education values: The mediational role of academic locus of control among college African American men and women. Journal of Black Psychology 43: 358-380.
  8. David EJR, Schroeder TM, Fernandez J (2019) Internalized racial oppression: A systematic review of the psychological literature on racism’s most insidious consequence. Journal of Social Issues 75: 1057-1086.
  9. Woods-Giscombe CL, Allen AM, Black AR, Stee TC, Li Y, et al. (2019) The Giscombe Superwoman schema questionnaire: Psychometric Properties and associations with mental health and health behaviors in African American women. Issues in Mental Health Nursing 40: 672-681. [crossref]
  10. Collins PH (2000) Gender, black feminism, and Black Political Economy. The ANNALS of the American Academy of Political and Social Science 568: 41-53.
  11. Evans SY, Bell K, Burton NK (2017) Black Women’s Mental Health: Balancing Strength and Vulnerability. SUNY Press.
  12. Nelson T, Cardemil EV, Overstreet NM, Hunter CD, Woods-Giscombé CL (2022) Association between superwoman schema, depression, and resilience: The mediating role of social isolation and gendered racial centrality. Cultural Diversity and Ethnic Minority Psychology. [crossref]
  13. Harrington EF, Crowther JH, Shipherd JC (2010) Trauma, binge eating, and the “strong Black woman”. Journal of Consulting and Clinical Psychology 78: 469. [crossref]
  14. Silva PH, Aiquoc KM, Silva Nunes AD, Medeiros WR, Souza TA, et al. (2022) Prevalence of access to prenatal care in the first trimester of pregnancy among black women compared to other races/ethnicities: A systematic review and meta-analysis. Public Health Reviews 43. [crossref]
  15. Jhingoeri N, Tarini BA, Barber J, Parikh K (2022) Elevated parental stress is associated with lower self-efficacy in provider communication during a pandemic. Hospital Pediatrics 12: 673-679. [crossref]
  16. Liao KYH, Wei M, Yin M (2020) The misunderstood schema of the strong Black woman: Exploring its mental health consequences and coping responses among African American women. Psychology of Women Quarterly 44: 84-104.
  17. Danieli Y, Norris FH, Engdahl B (2016) Multigenerational legacies of trauma: Modeling the what and how of transmission. American Journal of Orthopsychiatry 86: 639-651. [crossref]
  18. Adebayo CT, Parcell ES, Mkandawire-Valhmu L, Olukotun O (2022) African American Women’s maternal healthcare experiences: a Critical Race Theory perspective. Health Communication 37: 1135-1146. [crossref]
  19. Essien U, Molina R, Lasser K (2019) Strengthening the postpartum transition of care to address racial disparities in maternal health. Journal of the National Medical Association 111: 349-351. [crossref]
  20. Julian Z, Robles D, Whetstone S, Perritt JB, Jackson AV, et al. (2020) Community-informed models of perinatal and reproductive health services provision: A justice-centered paradigm toward equity among black birthing communities. Seminars in Perinatology 44: 151267.
  21. Donovan R, West L (2015) Stress and mental health: Moderating role of the strong Black woman stereotype. Journal of Black Psychology 41: 384-296.
fig 4

Vipsyana Meditation May Alter Medication for Mental Health of Older Adults

DOI: 10.31038/ASMHS.2022663

Abstract

Stress cognitions are important for survival, but if they are based on distorted perceptions, they may promote excessive stress arousal, creating a harmful milieu for cellular longevity. While in contrast, emotions based on ‘false projections’ or fear-based beliefs are harmful to longevity of your life. We speculate that certain types of meditation can increase awareness of present moment experience leading to positive cognitions, primarily by increasing meta-cognitive awareness of thought, a sense of control (and decreased need to control), and increased acceptance of emotional experience. These cognitive states and skills reduce cognitive stress and thus ability for more accurate appraisals, reducing exaggerated threat appraisals and rumination, and distress about distress. These positive states are thus stress-buffering. Increasing positive states and decreasing stress cognitions may in turn slow the rate of cellular aging. There is some indirect support of aspects of this hypothesis involving stress cognitions. In our previous study, perceived life stress – primarily an inability to cope with demands and feeling a lack of control, and higher nocturnal stress hormones (cortisol and catecholamines) were related to shorter telomere length. Trait negative mood was related to lower telomerase activity, a precursor of telomere shortening. Here we presented preliminary data from the same sample linking telomere length to higher proportions of challenge appraisals relative to threat appraisals in response to a standardized stressor. The results suggest that the relative balance of threat to challenge cognitions may be important in buffering against the long term wear and tear effects of stressors. To the extent that meditation mitigates stress-related cognitions and propagation of negative emotions and negative stress arousal, a longstanding practice of mindfulness or other forms of meditation may indeed decelerate cellular aging. We also speculate about the physiological mechanisms. Above we have reviewed data linking stress arousal and oxidative stress to telomere shortness. Meditative practices appear to improve the endocrine balance toward positive arousal (high DHEA, lower cortisol) and decrease oxidative stress. Thus, meditation practices may promote mitotic cell longevity both through decreasing stress hormones and oxidative stress and increasing hormones that may protect the telomere. There is much evidence of neuroendocrine and physical health benefits from TM, which has a longer history of study than MBSR. The newer studies of mindfulness meditation are promising, and offer insight into specific cognitive processes of how it may serve as an antidote to cognitive stress states. This field of stress induced cell aging is young, our model is highly speculative, and there are considerable gaps in our knowledge of the potential effects of meditation on cell aging. Several laboratories are working on diverse aspects of this model, which will soon allow it to be evaluated in light of the empirical data.

Older adults, those aged 60 or above, make important contributions to society as family members, volunteers and as active participants in the workforce. While most have good mental health, many older adults are at risk of developing mental disorders, neurological disorders or substance use problems as well as other health conditions such as diabetes, hearing loss, and osteoarthritis. Furthermore, as people age, they are more likely to experience several conditions at the same time. Globally, the population is ageing rapidly. Between 2015 and 2050, the proportion of the world’s population over 60 years will nearly double, from 12% to 22%. Mental health and well-being are as important in older age as at any other time of life. Mental and neurological disorders among older adults account for 6.6% of the total disability (DALYs) for this age group. Approximately 15% of adults aged 60 and over suffer from a mental disorder. The world’s population is ageing rapidly. Between 2015 and 2050, the proportion of the world’s older adults is estimated to almost double from about 12% to 22%. In absolute terms, this is an expected increase from 900 million to 2 billion people over the age of 60. Older people face special physical and mental health challenges which need to be recognized. Over 20% of adults aged 60 and over suffer from a mental or neurological disorder (excluding headache disorders) and 6.6% of all disability (disability adjusted life years-DALYs) among people over 60 years is attributed to mental and neurological disorders. These disorders in older people account for 17.4% of Years Lived with Disability (YLDs). The most common mental and neurological disorders in this age group are dementia and depression, which affect approximately 5% and 7% of the world’s older population, respectively. Anxiety disorders affect 3.8% of the older population, substance use problems affect almost 1% and around a quarter of deaths from self-harm are among people aged 60 or above. Substance abuse problems among older people are often overlooked or misdiagnosed. Mental health problems are under-identified by health-care professionals and older people themselves, and the stigma surrounding these conditions makes people reluctant to seek help.

Risk Factors for Mental Health Problems among Older Adults

There may be multiple risk factors for mental health problems at any point in life. Older people may experience life stressors common to all people, but also stressors that are more common in later life, like a significant ongoing loss in capacities and a decline in functional ability. For example, older adults may experience reduced mobility, chronic pain, frailty or other health problems, for which they require some form of long-term care. In addition, older people are more likely to experience events such as bereavement, or a drop in socioeconomic status with retirement. All of these stressors can result in isolation, loneliness or psychological distress in older people, for which they may require long-term care. Mental health has an impact on physical health and vice versa. For example, older adults with physical health conditions such as heart disease have higher rates of depression than those who are healthy. Additionally, untreated depression in an older person with heart disease can negatively affect its outcome. Older adults are also vulnerable to elder abuse – including physical, verbal, psychological, financial and sexual abuse; abandonment; neglect; and serious losses of dignity and respect. Current evidence suggests that 1 in 6 older people experience elder abuse. Elder abuse can lead not only to physical injuries, but also to serious, sometimes long-lasting psychological consequences, including depression and anxiety (Figure 1).

fig 1

Figure 1

Dementia and Depression among Older People as Public Health Issues

Dementia is the loss of cognitive functioning — thinking, remembering, and reasoning — to such an extent that it interferes with a person’s daily life and activities. Some people with dementia cannot control their emotions, and their personalities may change. It is a syndrome, usually of a chronic or progressive nature, in which there is deterioration in memory, thinking, behaviour and the ability to perform everyday activities. It mainly affects older people, although it is not a normal part of ageing. It is estimated that 50 million people worldwide are living with dementia with nearly 60% living in low- and middle-income countries (Figure 2).

fig 2

Figure 2

The total number of people with dementia is projected to increase to 82 million in 2030 and 152 million in 2050. There are significant social and economic issues in terms of the direct costs of medical, social and informal care associated with dementia. Moreover, physical, emotional and economic pressures can cause great stress to families and carers. Support is needed from the health, social, financial and legal systems for both people with dementia and their carers (Figure 3).

fig 3

Figure 3

Depression

Depression can cause great suffering and leads to impaired functioning in daily life. Unipolar depression occurs in 7% of the general older population and it accounts for 5.7% of YLDs among those over 60 years old. Depression is both underdiagnosed and undertreated in primary care settings. Symptoms are often overlooked and untreated because they co-occur with other problems encountered by older adults. Older people with depressive symptoms have poorer functioning compared to those with chronic medical conditions such as lung disease, hypertension or diabetes. Depression also increases the perception of poor health, the utilization of health care services and costs.

Treatment and Care Strategies to Address Mental Health Needs of Older People

It is important to prepare health providers and societies to meet the specific needs of older populations, including:

  • Training for health professionals in providing care for older people;
  • Preventing and managing age-associated chronic diseases including mental, neurological and substance use disorders;
  • Designing sustainable policies on long-term and palliative care; and
  • Developing age-friendly services and settings.

Health promotion – The mental health of older adults can be improved through promoting Active and Healthy Ageing. Mental health-specific health promotion for older adults involves creating living conditions and environments that support wellbeing and allow people to lead a healthy life. Promoting mental health depends largely on strategies to ensure that older people have the necessary resources to meet their needs, such as:

  • Providing security and freedom;
  • Adequate housing through supportive housing policy;
  • Social support for older people and their caregivers;
  • Health and social programmes targeted at vulnerable groups such as those who live alone and rural populations or who suffer from a chronic or relapsing mental or physical illness;
  • Programmes to prevent and deal with elder abuse; and
  • Community development programmes.

Interventions – Prompt recognition and treatment of mental, neurological and substance use disorders in older adults is essential. Both psychosocial interventions and medicines are recommended. There is no medication currently available to cure dementia but much can be done to support and improve the lives of people with dementia and their caregivers and families, such as:

  • Early diagnosis, in order to promote early and optimal management;
  • Optimizing physical and mental health, functional ability and well-being;
  • Identifying and treating accompanying physical illness;
  • Detecting and managing challenging behaviour; and
  • Providing information and long-term support to careers.

Mental health care in the community -Good general health and social care is important for promoting older people’s health, preventing disease and managing chronic illnesses. Training all health providers in working with issues and disorders related to ageing is therefore important. Effective, community-level primary mental health care for older people is crucial. It is equally important to focus on the long-term care of older adults suffering from mental disorders, as well as to provide caregivers with education, training and support. An appropriate and supportive legislative environment based on internationally accepted human rights standards is required to ensure the highest quality of services to people with mental illness and their caregivers.

Get Your Finances in Order

Organise your money so you can work out what you’ll have to live on. Gradually reducing your spending in the lead up to retirement will make it easier to adjust. Track down any old pensions, claim your state pension and check what other benefits you can claim (Figure 4).

fig 4

Figure 4

Wind Down Gently

Ensure a smoother transition by retiring in stages. By easing off your workload over several years, you’ll be able to get used to the idea of not working and fill your time in other ways. Ask your employer if you can cut back your working hours.

Prepare for Ups and Downs

There may be times when you feel lonely or a bit lost, which is normal. If ill health or changes in your relationships temporarily scupper your plans, accept that this has happened and get your back-up plan in action. Think positively and share any concerns with others. Use your free time to continue to challenge yourself mentally, whether it’s learning an instrument or a language or getting a qualification.

Eat well-Make sure you eat regular meals, especially if your previous pattern, while at work, was to snack. Take advantage of the extra time on your hands and explore healthy cooking options. Fruits and vegetables contain many vitamins and minerals that are good for your health. These include vitamins A (beta-carotene), C and E, magnesium, zinc, phosphorous and folic acid. Folic acid may reduce blood levels of homocysteine, a substance that may be a risk factor for coronary heart disease. Homocysteine is a type of amino acid, a chemical your body uses to make proteins. Normally, vitamin B12, vitamin B6, and folic acid break down homocysteine and change it into other substances your body needs. There should be very little homocysteine left in the bloodstream (Figure 5).

fig 5

Figure 5

Develop a Routine

You may find it feels more normal to continue getting up, eating and going to bed at roughly the same time every day. Plan in regular activities such as voluntary work, exercise and hobbies. This will keep things interesting and give you a purpose.

Exercise Your Mind

Government studies have shown that learning in later years can help people stay independent, so use your free time to continue to challenge yourself mentally, whether it’s learning an instrument or a language or getting a qualification (Figure 6).

fig 6

Figure 6

Keep Physically Active

We should all aim to do at least 150 minutes of moderate-intensity physical activity a week, so build up to this if you haven’t made exercise a normal part of your life previously. Why not sign up for a charity event to give you a goal to work towards ? WHO defines physical activity as any bodily movement produced by skeletal muscles that requires energy expenditure. Physical activity refers to all movement including during leisure time, for transport to get to and from places, or as part of a person’s work.

Make a List

Writing down your aims may help you focus on what you really want to achieve – like a ‘to do’ list. Work out what you can afford to do and schedule time to make it happen, so you experience a sense of accomplishment, as you would have done at work.

Seek Social Support

For many people, work can form a big part of their social life and it’s common to feel at a bit of a loose end once you retire. Fill the gaps by joining clubs and groups. Find out about the social and physical benefits of walking groups.

Make Peace and Move On

Don’t spend your retirement dwelling on your working days. Accept that you’ve done all you can in that job and focus on your next challenge. You’ve still got lots to achieve.

Go for a Health Check

Prevention is better than cure, and now is the perfect time to get your free midlife MOT. The NHS Health Check programme aims to help prevent heart disease, stroke, diabetes, kidney disease and certain types of dementia. Everyone between the ages of 40 and 74, who has not already been diagnosed with one of these conditions or have certain risk factors, will be invited once every five years to have a check to assess their risk of these age-related illnesses and will be given support and advice to help them reduce or manage that risk. If you’re in this category but haven’t had a check in the last five years, you can ask your GP for one.

Keep in Touch with Your Friends from Work

Just because you are retiring doesn’t mean you have to lose touch with the group of friends you made in your workplace. Why not make arrangements for regular catch-ups ? Or, you might want to use some of your new leisure time to catch up with old friends that you haven’t seen for a while. If you enjoy party planning, find an excuse to get everyone together and have fun arranging the perfect garden or dinner party, anniversary celebration or other special occasion. You could even raise funds for our life saving work at the same time through our “Give in Celebration” funds.

Pamper Yourself

After decades of hard work, you are due some ‘me time’. Whether your idea of indulgence is a city break, a day trip to a spa or a small pleasure like dining out or going to the cinema, schedule some time for a well-deserved treat.

Practise Mindfulness

Practising mindfulness has become more popular than ever in the last decade as a strategy to relieve stress, anxiety and depression. Fresh air and exercise is an instant mood booster and instrumental in maintaining your wellbeing. Research, such as a 2009 study from Goethe University in Germany, has shown that meditation strengthens the hippocampus, the area of the brain that is important for memory, and slows the decline of brain areas responsible for sustaining attention. There are no set guidelines for how often you should meditate for optimal result, but a handful of experiments suggest that a mere 10 to 20 minutes of mindfulness a day can be beneficial—if people stick with it.

Give Back to the Community

Ever thought of volunteering? Perhaps you’d enjoy getting involved with your local youth club, animal rescue centre, environmental organisation or elderly support group. There are plenty of charities that would welcome a helping hand, not least the BHF, of course! We offer the opportunity to help out in our shops, in a furniture or electrical store, with fundraising and at lots of different types of events.

Be One with Nature

Fresh air and exercise is an instant mood booster and instrumental in maintaining your wellbeing. Why not incorporate a walk in the woods or a nearby park into your daily routine? This is an ideal way of achieving the recommended minimum of 150 minutes of physical activity per week.

Travel More

Always dreamt of going on an around-the-world cruise, a wine-tasting trip through Italy, or a simple camping expedition in the Welsh valleys? Now you can finally make those long-held plans a reality, depending on your health and budget limitations. If longer trips aren’t practical, mini breaks may be a good alternative – or even days out to places you’ve never visited before.

Get a New Pet or Partner

Could you house a rescue cat or dog in need of a new home? Research has shown that our furry friends have a positive effect on our health and wellbeing.

Push Your Boundaries

It’s easy to get stuck in a rut, both health-wise and in general, and doing something different can be a refreshing change. Some people have found that simple changes, such as trying a tasty new recipe, finding a different hairdresser or joining an exercise class they haven’t done before gives them a new zest for life.

Take Up a New Project

Finally you have time to get stuck into all those things you’ve been meaning to do but never got round to. Mapping your family tree, building a shed, planting a veg patch… the list goes on, but now you can actually do what you’ve always wanted to. Need inspiration? Have a look at our features on gardening, healthy baking, and cycling groups. Read our feature about retirement. Read how volunteering can help you beat loneliness.

A very recent study tested whether an acute bout of exercise would induce a different response on telomerase activity in older vs. young individuals and whether this response would be gender-specific [1]. To test this hypothesis, age- and gender-related differences in telomerase and shelterin responses at 30, 60, and 90 min after a high intensity interval cycling exercise were determined in PBMC of 11 young (22 years) and 8 older (60 years) men and women. A larger increase in telomerase activity, as assessed by TERT mRNA levels, was found in the young compared to the older group after exercise. The second main finding of that study was the higher TERT response to the acute endurance exercise in men compared to women, in whom the response was negligible, independently of age (Figure 7).

fig 7

Figure 7

Those results showed that aging is associated with reduced telomerase activation in response to high-intensity cycling exercise in men [1]. Another study showed that a 30-min treadmill running session was long enough to increase PBMC telomerase activity in 22 young healthy subjects including 11 women and 11 men [2]. Altogether, those recent studies confirm that the increasing telomerase activity after a single bout of exercise could be one of the mechanisms by which physical activity protects against aging [2].

We propose that engaging in a healthy diet and regular physical activity could be both promising strategies to protect telomere maintenance and improve health span at old age (Figure 8 and Table 1).

  • Find a quiet, comfortable place to sit, with your back upright.
  • Put on headphones (this will help block outside distractions).
  • Select the meditation length that’s ideal for you.
  • Press play and close your eyes. Focus your attention on your breath, breathing in and out.

fig 8

Figure 8

Table 1: Professional Advantage of Vipassana

Sl. No.

 Professional Advantage of Vipassana

Students

N

%

1

Developed balanced mind,

29

21.8

2

Control over Tension angry frustration, agitation anxiety, impatience, Reduce stress

56

42.2

4

More empathetic, organized, confidant, orderly and disciplined

18

13.5

5

Objective perception

11

8.3

6

Build good relationship with peers, relatives, and colleague

7

5.3

7

Handle conflict situation

5

3.8

8

Make better decision making

13

9.8

9

Enhance my productivity

1

.8

10

No benefit, Not convinced. Only a spiritual process.

3

2.3

11

Better concentration

14

10.5

  Total

133

100.0

Meditation Reduce depression, tiredness, and fatigue, improve attention, emotion regulation, and mental flexibility. Meditation goes beyond simple relaxation techniques, although that is definitely one of the main benefits. I develop the system called Ven Dr Sumedh Thero system of ordination/Meditation i.e. based on my own experience in India, Sri Lanka, Thailand, Vietnam by meditating as brain exercise and mental energy conservation [3-5]. The study indicates that the Vipassana Meditation process enhanced their professional skills and approaches. Majority students reported that (42.2%) the awareness process helped them to control over their tensions, anxiety and impatience and reduce their anxiety to perceive things professionally than personally [4].

References

  1. Cluckey TG, Nieto NC, Rodoni BM, Traustadottir T (2017) Preliminary evidence that age and sex affect exercise-induced hTERT expression. Gerontol 96: 7-11. [crossref]
  2. Zietzer A, Buschmann EE, Janke D, Li L, Brix M, et al., (2017) Acute physical exercise and long-term individual shear rate therapy increase telomerase activity in human peripheral blood mononuclear cells. Acta Physiol 220: 251-262. [crossref]
  3. Ven Sumedh Thero, Kataria HB, Aditya Suman (2022) Meditation for Skin Aging, Reduces Wrinkles and Change Your Appearance? International Journal of Clinical & Experimental Dermatology 7: 8-12.
  4. Ven Sumedh Thero, Kataria HB, Aditya Suman (2021) How Running Give Us a High Expectations to Overcome Neurological Disorders . Journal of Neurology Research Review & Reports. SRC/JNRRR-157 Volume 3(3): 1-6.
  5. Ven Sumedh Thero (2021) Family Dynamics and Health in Post Covid-19. Clinical Research and Clinical Case Reports 1.

Review on Studies on Genetic Variability of Chickpea (Cicer arietinum L.) Genotypes for Future Breeding Program in Ethiopia

DOI: 10.31038/AFS.2022443

Abstract

Genetic variability studies provide basic information concerning genetic properties of population following which breeding methods could be formulated for future improvement of the crop. Components of genetic parameters such as genotypic coefficient of variation and phenotypic coefficient of variation have an immense importance in detecting the amount of genetic variation exist in the genotypes. Genetic variability study for agronomic traits is a key component of the breeding program for boarding the genetic pool of crop. Once genetic variability of certain crops has been successfully determined crop improvement is easy through the use of appropriate selection methods on yield components hence they are easily inherited than total yield itself. Thus, in this review, studies of genetic variability of chickpea have discussed to help different researchers on their variability studies by providing some important information that will help chickpea improvements.

Key words

Variability, GCV, PCV, Genotypes, Crop Improvement

Introduction

Chickpea (Cicer arietinum L.) is self-pollinated diploid (2n=2×=16) annual leguminous plant belongs to family Fabacea, with a genome size of 738.09 Mbp (Varshney et al., 2013). Chickpea is the third most important pulse crop in the world after faba bean and field pea [1]. Chickpea is one of the first pulse crops domesticated in the Fertile Crescent about 7400 years ago and most probably originated in an area of South-eastern Turkey adjoining Syria [2]. Ethiopia is designated as a secondary center of origin while South-west Asia and the Mediterranean are the two primary center of origin of chickpea according to Vavilov [3].

The achievement of crop improvement through breeding program largely relies on the extent of genetic and phenotypic variability existed among individuals in the population. Selection and development of new variety depends upon the extent of genetic variability in the base population [4] and breeders require existence and extent of interrelationship among important characters for the selection and development of varieties from populations comprising diversified genotypes [5]. The low yields have been attributed to several factors among which include low genetic diversity of cultivated chickpea and several biotic and abiotic stresses [6]. Evaluation and assessment of genetic resources is a pre-requisite for which the future breeding work depends.

Objective

To review Studies on Genetic Variability of Chickpea (Cicer arietinum L.) crop for its future Breeding Program in Ethiopia.

Literature Review

Origin and Distribution

Chickpea (Cicer arietinum L.) belongs to the family Leguminoseae, sub-family Papilionaceae and tribe Cicereae. Chickpea is one of the first pulse crops domesticated in Old World and most probably originated in an area of South-eastern, Turkey adjoining Syria [2,7]. This crop was gradually introduced to the west Mediterranean region, to Eastern and Southern Asia and East Africa. It reached the Indian sub-continent before 2000 BC [8]. Ethiopia is a second center of diversity for chickpea [9]. Chickpea is the only cultivated species within genus Cicer and grown in relatively well-drained black soils, in the cool semi-arid areas of the tropics, sub-tropics as well as the temperate areas [10].

Desi and Kabuli are the two chickpea types produced globally. Kabuli types have a larger cream-colored seed with a thin seed coat whereas the Desi types have a smaller, reddish brown-colored seed with a thick seed coat. Their content also vary in carbohydrates content which ranged from 54 – 71% for Kabuli and 51 – 65 % for Desi type; protein from 12.6 – 29% for Kabuli and from16.7 – 30.6 % for Desi; lipid from 3.4 ¬- 8.8% for Kabuli and from 2.9 – 7.4% for Desi; and energy from 357 – 447 kcal/100g and from 334 – 437 kcal/100g for Kabuli and Desi, respectively [11]. On an average, world production consists of about 75% of Desi and 25% of Kabuli types (EARO, 2004). Although Kabuli types can be profitably adapted in the country, Ethiopia traditionally produces largely the Desi types of chickpea.

Ecology of Chickpea

Chickpea is traditionally grown in the northern hemisphere, mostly at relatively high elevations in India and Ethiopia. However, most of the Desi type chickpea is grown between 20° and 30° N while Kabuli type is grown above 30°N. These environmental conditions give significance difference in photoperiod, temperature and precipitation, all of which have a profound effect on growth and development of the crop. Chickpea requires fertile soil with good drainage system. Any water-logged conditions can severely damage the crop. Chickpeas generally grow on black or red soils and require a soil pH of 6.0 to 7.0. The crop prefers soil with good residual soil moisture content. Chickpeas can be grown on a wide range of soil types provided that the drainage is good and they cannot withstand water logging. For optimum results, clay loams are required. In Ethiopia, chickpea is best adapted to the areas having Vertisols [8].

Economic Importance of Chickpea

Chickpea production has many benefits; first, it fixes atmospheric nitrogen in soils and thus improves soil fertility and saves fertilizer costs in subsequent crops. Second, it improves more intensive and productive use of land, particularly in areas where land is scarce and the crop can be grown as a second crop using residual moisture. Third, it reduces malnutrition and improves human health especially for the poor who cannot afford livestock products. It is an excellent source of protein, fiber, complex carbohydrates, vitamins, and minerals. Fourth, the growing demand in both the domestic and export markets provides a source of cash for small holder producers. Fifth, it increases livestock productivity as the residue is rich in digestible crude protein content compared to cereals [12].

Chickpea Breeding Efforts and Major Achievements in Ethiopia Specifically

According to Asnake et al. [13], the national chickpea and lentil research program came up with 17 superior varieties of chickpea during the decade (2005-2016). The new chickpea varieties have comparative advantages in terms of earliness, Aschochyta blight tolerance, seed size, grain yield, suitability for mechanization and rust resistance among others. The advance in release of chickpea variety for the last decade revealed that 9 Kabili type and 8 Desi type chickpea varieties have been released for production. The release of the chickpea varieties so far was also based on product concepts and market oriented. Despite the release of several improved varieties, however, the variety replacement rate of chickpea is reasonably low. The genetic gains from breeding are also low as compared to the expectation. This calls for improving breeding progress for economic attributes on one hand and effective promotion of the available technologies on the other [13].

In the early phases of chickpea breeding, selections from local landraces were used to develop new varieties. Later the national chickpea improvement program created significant genetic variability for major agro-morphological traits desired by the breeding program through the introduction of diverse germplasm lines from different sources [14]. The major agro-morphological traits prioritized by the breeding program includes productivity, seed size, plant phenology and resistance to key biotic and abiotic stresses prevalent in the country; particularly resistance to wilt/root rot diseases complex, ascochyta blight, major insect pests, drought, moisture and heat stresses.

In breeding programs, combination of bulk and pedigree methods are mainly used in handling several segregating generation developed from different crossing schemes. In early segregating generations, selection is done for simple traits such as disease resistance and seed traits. Screening of several segregating populations and local germplasm genotypes for resistance/tolerance to Fusarium wilt using an aggressive wilt sick plots at Debre Zeit Agricultural Research Center allowed the identification of sources of disease resistance [14].

Precision in selection for different biotic and abiotic stresses such as disease resistance, drought and heat tolerance can be greatly improved by screening several advanced germplasm line/segregating generation under controlled environmental conditions or at hot spot locations. Genomics assisted breeding (GAB) techniques, particularly marker assisted backcross breeding, marker assisted selection/marker assisted recurrent selection have a great potential to enhance precision and efficiency of chickpea breeding program [6]. These days, several success stories of GAB to develop superior varieties are reported in different pulse and cereal crops [15,16]. Therefore, integration of genomics tools in Ethiopia chickpea breeding program has a great potential to speed up the efficiency of selections in the segregating generations for higher and rapid genetic gains.

Moreover, single seed descent and speed breeding/rapid generation advancement methods are already in use at present and needs to be further strengthen to reduce the time required to reach the desired level of homozygosity and to speed up the release of appropriate varieties with desired traits. Adoption of speed breeding technology by generating 4-6 generations per year will be contributing to accelerate genetic gain in legumes breeding program [17].

Genetic Variation, Heritability and Genetic Advance in Genetic Variability Studies

Genetic variability studies provide basic information concerning genetic properties of population following which breeding methods could be formulated for future improvement of the crop [18]. Genetic variability study for agronomic traits is a key component of the breeding program for boarding the genetic pool of crop [4]. Component of genetic parameters such as genotypic coefficient of variation and phenotypic coefficient of variation have an immense important in detecting the amount of genetic variation exist in the genotypes.

Scholars like [19,20] reported high PCV and moderate GCV for number of pods per plant. Another scholars, [21] recorded highest phenotypic and genotypic coefficient of variation (PCV and GCV) for number of pods per plant followed by biological yield per plant and 100-grain weight. In relation to this result [22] reported moderate genotypic coefficient of variations were for grain yield per plant (19.73), number of pods per plant (18.90 %), biological yield per plant (13.56%), number of primary branches per plant (12.75%) and 100-grain weight (11.60%).

Ali and Ahsan [23] reported the presence of greatest genotypic and phenotypic coefficient of variation in chickpea for number of seed per plant, number of pods per plant and plant height. Tesfamichael et al. [1] observed the presence of large variation for days to 50% flowering, plant height, days to maturity, number of pod per plant, 100 seed weight, and seed yield. Johnson et al. [24] conducted an experiment to determine genetic variability of thirty-one chickpea genotypes. His study indicated that the mean sum of squares due to genotypes were significant for all characters studied and suggested the existence of sufficient variability among the genotypes for the traits. This report also showed high values of genotypic coefficients of variation for secondary branches per plant, pod per plant, seed yield per plant, biological yield and primary branches per plant.

Chopdar et al. [25] found the highest genotypic coefficients variations for seed yield and 100-seed weight and moderate coefficient of variation for harvest index, number of pods per plant and biomass per plant and plant height in chickpea. And also genotypic coefficients of variations were low for days to maturity, days to 50 per cent flowering, primary branches per plant and number of seeds per pod. Fasil Hailu [20] reported highest phenotypic and genotypic variance for biological yield, harvest index and number of pods per plant while lowest value was recorded for number of seed per pod, primary branches and secondary branches and said selection is effective for high genotypic and phenotypic variability characters. In addition, Awol et al. [26] reported the lowest PCV and GCV (4.2% and 3.91%) for days to maturity, while the highest PCV and GCV values of 28.64% and 27%; respectively, were obtained for grain yield.

Other scholars [27] reported High GCV was recorded for hundred seed weight (36.01), number of secondary branches (20) and harvest index (22.4) and high PCV for hundred seed weight (36.02), number of secondary branches (27.53), harvest index (23.37), grain yield (22.89) and biological yield. And also Moderate GCV and PCV were noted for traits such as grain yield, biological yield, number of primary branches, days to emergence and number of pods per plant, and number of primary branches, days to emergence and number of pods per plant, respectively. Higher phenotypic and genotypic coefficient of variability indicates the existence of wide genetic variation among the genotypes under the study so that genetic improvement could be possible through selection.

Hussain et al. [22] also reported low GCV for days to 50% flowering (2.10%).  Traits with low GCV and PCV indicate presence of narrow genetic variability. Traits such as physiological maturity, days to flowering, number of seed per pod, grain filling period and plant height was showed low GCV and PCV value. Thus, improvement for such traits could be possible through hybridization followed by selection.

Dubey and Srivastava [28] also reported high heritability (broad sense) for plant height, number of pods per plant, 100-grain weight and grain yield per plant. Malik et al (2010) reported high broad sense heritability estimates for number of secondary branches, harvest index, hundred seed weight and number of pods per plant and grain yield.

Chand et al. [29] reported that the highest broad sense heritability estimate was obtained for 100 seed weight (80%), number of seeds per pod (77%) and number of primary branch (62%) in chickpea genotypes. Hussain et al. [22] studied genetic variability and mode of inheritance in eight quantitative traits of chickpea and reported that high broad sense heritability for grain yield (96.40%), number of pods per plant (93.19%), 100-grain weight (89.67%), biological yield (83.83%) and plant height (78.83). According to Chopdar et al. [25], 100-seed weight had the highest heritability followed by days to 50% flowering (85.31), seed yield per plant (84.29), days to maturity (78.39), biomass per plant (69.06), number of pods per plant (68.06) and harvest index (67.51) in chickpea.

Parameshwarappa et al. [30] reported high heritability with high genetic advance as percent of mean for pods per plant, 100-seed weight and seed yield per plant, suggesting that these traits could be improved through simple selection. High heritability with high genetic advance as percent of means is the indication for the presence of additive gene action. He also found that high heritability with moderate genetic advance as percent of means for days to 50 percent flowering, and high heritability with low genetic advance as percent of means for plant height, primary branches per plant and secondary branches per plant.

According to Biru et al. [31] hundred seed weight, number of pods per plant, number of seed per pod and grain yield showed high heritability combined with high genetic advance as a percentage of mean. Moreover, low heritability and expected genetic advance were observed for days to maturity and branches per plant.

Joshi et al. [32] observed that high estimates of heritability in broad sense for days to 50% flowering, days to maturity, plant height, biological yield per plant, seed yield, harvest index and 100-seed weight, indicating that these characters were less affected by the environment and the plant breeder may use these characters for selection on the basis of phenotypic expression in the individual material.

Awol et al. [26] reported high broad sense heritability estimate for grain yield, hundred seed weight, biological yield, number of pods per plant, days to flowering, plant height, number of primary branches and number of secondary branches. Also Alemayo et al. [27] in their study on variability of 56 chickpea genotypes, estimate for all thirteen traits showed high (>60%) broad sense heritability. The highest heritability was obtained for hundred seed weight (99.96%) while the lowest was for number of seed per pod (62.96%). Presence of high broad sense heritability indicates selection based on phenotypic expression of individual genotypes for such characters might be easy due to relatively small effects of environment on phenotype.

But Arora and Jeena [33] recorded low value of heritability for days to 50% flowering; Singh and Rao (1991) for number of primary branches per plant. According to Johnson et al. [24] heritability alone might not be effective unless coupled with higher genetic advance as percent of the mean in predicting the effectiveness of selecting the best performing genotypes and he classified estimates of genetic advances as a percentage of the mean excelling 20% as high, ranging from 10 to 20% as moderate and those which showed below 10 as low.

Zali et al. [19] reported that the genetic advance (5% selection intensity) was the highest for number of secondary branches, number of seeds per plant and seed yield. This implies that progress on improving seed yield could be achieved through simple selection of the number of secondary branches and number of seeds per plant. Another scholar [22] reported high heritability coupled with high genetic advance as percent of mean for grain yield per plant (39.91), number of pods per plant (37.59), biological yield per plant (25.58) and 100-grain weight (22.62).

In their research, Alemayo et al. (2021) reported high heritability coupled with high genetic advance as percent of the mean were recorded for hundred seed weight (74.26%), number of secondary branches (54.65%), harvest index (44.34%), grain yield (33.38%), biological yield (32.6%), number of primary branches (28.35%), days to emergence (27.3%) and number of pods per plant (25.8%). High estimate of genetic advance as percent of the mean for these traits indicates that whenever we select the best 5% genotypes as parent for a given trait, genotypic value of the new population for the traits will be improved highly and they are governed by additive gene [34].

In addition, Alemayo et al. [27] reported, for traits like plant height, grain filling period and days to flowering showed high heritability with moderate genetic advance as percent of mean. This shows that, such traits are primarily under genetic control and their selection can achieved based on their phenotypic performance. In another hand they reported as, Low genetic advance as percent of mean were observed for number of seed per pod and days to physiological maturity. This suggested that the expressions of such traits are controlled by non-additive gene action and their selection might not be satisfactory. So, the appropriate usage of pure line selection may be valuable for improving these characters with moderate or high heritability characters [35].

Conclusion and Future Prospects

For better improvement of a crop study on genetic variability is the crucial that help in getting sufficient information regarding per se performance, variability, heritability, genetic advance and association that may exist among yield and its components – agronomic and phonological traits. Because, without presence of genetic variability among genotypes (in our case, among chickpea genotypes) there is no success for its improvement. So, for successful breeding program [for chickpea] researchers should focus on creating variability among chickpea genotypes.

References

  1. Tesfamichael SM, Githiri SM, Nyende AB, Rao NVPRG (2015) Variation for agro morphological traits among Kabuli chickpea (Cicer arietinum L.) genotypes. Journal of Agricultural Science 7: 75.
  2. Van der Maesen LJG (1987) Origin, history and taxonomy of chickpea 11-34.
  3. Vavilov NI (1926) The origin of the cultivation of ‘primary ‘crops, in particular cultivated hemp. Studies on the origin of cultivated plants 221-233.
  4. Singh BD (2001) Plant breeding: Principles and Methods. Kalyani Publishers, New Delhi.
  5. Falconer DS, Mackay FC (1996) Introduction to Quantitative Genetics. Longman, New York.
  6. Gaur PM, Jukanti AK, Varshney RK (2012) Impact of genomic technologies on chickpea breeding strategies. Agronomy 2: 199-221.
  7. Toker C, Cagirgan IC (2004) The use of phenotypic correlations and factor analysis in determining characters for grain yield selection in chickpea (Cicer arietinum L.). Hereditas 140: 226-228. [crossref]
  8. Martin JH, Waldren RP, Stamp DL (2000) Principles of Field Crop Production. Fourth ed., Macmillan Publishing Corporation: USA.
  9. Pundir RPS, Hailemariam Mengesha (1983) Collection of chickpea in Ethiopia. Inter. Chickpea Newsletter, 8: 6-7.
  10. Atta BM, Shah TM (2009) Stability analysis of elite chickpea genotypes tested under diverse environments. Australia Journal of Crop Science 3: 249-256.
  11. Wood JA, Grusak MA (2007) Nutritional value of chickpea. EARO (Ethiopian Agricultural Research Organization), 2004. Directory of Released Crop Varieties and their Recommended Cultural Practices. EARO: Addis Ababa, Ethiopia 101-142.
  12. FDRE (Federal Democratic Republic of Ethiopia) (2010) Extension Package for Pulse Production and Improved Management Practices. Agricultural Extension Directorate. Amharic version. FDRE: Addis Ababa, Ethiopia.
  13. Asnake F, Lijalem K, Million E, Dagnachew B, Niguse G, et al., (2018) A Decade of Research Progress in Chickpea and Lentil Breeding and Genetics. Crop Sci 6: 101-113.
  14. Asnake F, Dagnachew B (2020) Chickpea Breeding and Crop Improvement in Ethiopia: Past, Present and the Future. Universal Journal of Agricultural Research 8: 33-40.
  15. Varshney RK, Hoisington DA, Tyagi AK (2006) Advances in cereal genomics and applications in crop breeding. Trends Biotechnol 24: 490-499. [crossref]
  16. Varshney RK, Thudi M, May GD, Jackson SA (2010) Legume Genomics and Breeding. Plant Breeding Rev 33: 257-304.
  17. Varshney RK, Pandey MK, Bohra A, Singh VK, Thudi M (2018) Toward the sequence based breeding in legumes in the post genome sequencing era. Theoretical and Applied Genetics 132: 797-816.
  18. Khlestkina EK, Huang XQ, Quenum FB, Chebotar S, Röder MS, et al. (2004b) Genetic diversity in cultivated plants – loss or stability? Theoretical and Applied Genetics 108: 1466-1472. [crossref]
  19. Zali H, Farshadfar E, Sabaghpour SH (2011) Genetic variability and inter relationships among agronomic traits in chickpea (Cicer arietinum L.) genotypes. Crop breeding journal 1: 127-132.
  20. Fasil Hailu Gebremichael M.Sc Thesis (2019) Genetic variability and character association of kabuli chickpea (Cicer arietinum L.) Genotypes for grain yield and related traits at Debre zeit and akaki, central Ethiopia.
  21. Dwevedi KK, Gaibriyal ML (2009) Assessment of genetic diversity of cultivated chickpea (Cicer arietinum L.). Asian J. Agri. Sci 1: 7-8.
  22. Hussain N, Ghaffar A, Aslam M, Hussain K (2016) Assessment of genetic variation and mode of inheritance of some quantitative traits in chickpea (Cicer arietinum L.). JAPS: Journal of Animal & Plant Sciences 26: 1334-1338.
  23. Ali Q, Ahsan M (2012) Estimation of genetic variability and correlation analysis for quantitative traits in chickpea (Cicer arietinum L.). International Journal for Agro Veterinary and Medical Sciences 6: 241-249.
  24. Johnson PL, Sharma RN, Nanda HC (2015) Genetic diversity and association analysis for yield traits chickpea (Cicer arietinum L.) under rice based cropping system. The Bioscan 10: 879-884.
  25. Chopdar DK, Bharti B, Sharma PP, Dubey RB, Meena BB (2017) Studies on genetic variability, character association and path analysis for yield and its contributing traits in chickpea [Cicer arietinum (L.)]. Legume Research-An International Journal 40: 824-829.
  26. Awol Mohammed, Bulti Tesso, Chris Ojiewo, Seid Ahmed (2019) Assessment of genetic variability and heritability of agronomic traits in Ethiopian chickpea (Cicer arietinum L.) landraces. Black Sea Journal of Agriculture 2: 10-15.
  27. Alemayo GT, Gurmu GN, Singh BCS, Getachew Z (2021) Genetic Variability of Chickpea (Cicer Arietinum L.) Genotypes for Yield and Yield Components in West Shewa, Ethiopia. Plant Cell Biotechnology And Molecular Biology 307-331.
  28. Dubey KK, Srivastava SBL (2007) Study of direct selection in chickpea (Cicer arietinum L.). Plant Archives 7: 211-212.
  29. Chand JU, Singh DP, Roopa LG (2012) Assessment of genetic variability and correlation of important yield related traits in chickpea (Cicer arietinum L.). Legume Research: An International Journal 35.
  30. Parameshwarappa SG, Salimath PM, Upadhyaya HD, Patil SS, Kajjidoni ST (2012) Genetic variability studies in mini core collection of chickpea (Cicer arietinum L.) under different environments. Karnataka Journal of Agricultural Sciences 25: 305-308.
  31. Biru A, Kassahun T, Teklehaimanot H, Dagnachew L (2017) Broad sense heritability and genetic advance for grain yield and yield components of chickpea (Cicer arietinum L.) genotypes in western Ethiopia. International Journal of Genetics and Molecular Biology 9: 21-25.
  32. Joshi P, Yasin M, Sundaram P (2018) Genetic variability, heritability and genetic advance study for seed yield and yield component traits in a chickpea recombinant inbred line (RIL) Population. International Journal of Pure and Applied Bioscience 6: 136-141.
  33. Arora PP, Jeena AS (2000) Variability in relation to response to selection in chickpea. Sci. Dig 20: 267-298.
  34. Noor F, Ashaf M, Ghafoor A (2003) Path analysis and relationship among quantitative traits in chickpea (Cicer arietinum L.). Pakistan J. Biol. Sci 6: 551-555.
  35. Arshad M, Bakhsh A, Bashir M, Haqqani AM (2002). Determining the heritability and relationship between yield and yield components in chickpea (Cicer arietinum L.). Pakistan J. Bot 34: 237-245.