Archives

Evaluation of antioxidant and polyphenolic content of a Sri Lankan poly herbal formulae and assessment of its in vitro antiproliferative activity on RD and MCF-7 cancer cells compared to healthy CC1 cells

DOI: 10.31038/CST.2017231

Abstract

Background: Evidence of cancer cure or improvement of quality of life in cancer patients has been reported using prescriptions based on traditional knowledge, but not scientifically investigated. The objectives of the current study is to evaluate the anti-proliferative action of a poly herbal drug which is currently used in traditional medicine name “Le Pana Guliya (LPG)”

Methods: The aqueous extract of LPG was freeze dried. Total phenolic content was assayed using Folin Ciocalteu reagent. Antioxidant activity of the extract was evaluated using DPPH radical scavenging assay in vitro. Brine shrimp assay was conducted to determine the cytotoxicity (LD50) of the LPG. The cell viability was determined by MTT assay and cytotoxicity by LDH leakage assay after 24 and 48 hours incubation with LPG. Morphological Changes after the treatment of the drug was observed using an inverted light microscope. RD, MCF-7 cells and CC1 cells were used in all experiments.

Results: The TPC of the LPG was 5.31 ± 0.14 W/W% of GAE and antioxidant capacity is comparable to ascorbic acid. LPG exhibited strong cytotoxic activity against RD and MCF-7 cell lines with MTT assay. A 50% leakage of LDH was observed at concentrations less than 30μg/mL and 10 μg/mL for both RD and MCF-7 cells respectively after 24 hour exposure. While, LPG exhibited strong cytotoxic activity against RD and MCF-7 cells the brine shrimp and CC1 cells results (EC50>100μg/mL) suggest that the LPG have minimum cytotoxicity towards the normal healthy cells.

Conclusion: The present study provides evidence for potent anti cancer activity of LPG on RD and MCF-7 cells. The brine shrimp bio-assay and CC1 cells results suggests that the extract have minimum cytotoxicity towards the normal healthy cells.

Keywords

Anti-proliferative activity, Cytotoxicity, MTT assays, LDH assay, Brine shrimp assay, Light microscopy, RD cells, MCF-7, CC1, DPPH

Introduction

Natural products have played an imperative role in the lead-finding of candidates for the development of present-day cancer chemotherapy due to their low toxicity and side effects. They offer a valuable source of a wide variety of chemical structures with biological activities (lead molecules) for the development of novel drugs [1]. Approximately 60% of all drugs currently undergoing clinical trials for cancer treatment are natural products or compounds derived from natural products [2, 3]. These substances embrace some of the most exciting new chemotherapeutic agents currently available for use in a clinical setting [3].

Sri Lanka is gifted with many plants which have vast medicinal value. Use of plants for medicinal preparations is a primary part of the Sri Lankan cultural life and this is implausible to change in the years to come. The Sri Lankan traditional medicine system shows extensive use of plant products in cancer treatment. A significant surge of interest in chemoprevention research has thus led to the discovery of many phytochemicals as successful chemo preventive agents.

Many traditional healers and folklore medical practitioners in the country have been treating cancer patients for many years using various medicinal plant species. There is evidence of case reports on cancer cure using traditional knowledge, but they are not scientifically investigated. In addition to use of a single plant, poly herbal formulations of drugs are intensively used in Sri Lanka. The poly herbal drug ‘Le Pana Guliya’ (LPG) found in Ola leaf inscriptions is prescribed to treat different types of cancers by traditional doctors.This study was aimed at investigating of its cytotoxic effect against two different cancer cell lines compared with healthy CC1 cells.

Materials And Methods

Chemicals and equipment

Chemicals needed for cell culture and cytotoxicity studies were purchased from Sigma –Aldrich (St Louis, MO63178, USA). 1-Diphenyl-2-picrylhydrazyl (DPPH), TritonX-100, was purchased from Fluka. Tris base was purchased from Promega (Madison, WI 53711–5399, USA). All chemicals used were of analytical grade.
Shimadzu UV 1601 UV visible spectrophotometer (Kyoto, Japan) was used to measure the absorbance. LFT 600 EC freeze dryer was used to obtain the freeze dried powder of the poly herbal drug. Cells were incubated at 37°C in a humidified CO2 incubator (SHEL LAB/Sheldon manufacturing Inc. Cornelius, OR 97113, USA). Inverted fluorescence microscope (Olympus Optical Co. Ltd. 1X70-S1F2, Japan) for observation of cells, and photographs were taken using microscope digital camera (MDC200 2M PIXELS, 2.0 USB). Deionized water from UV ultra-filtered water system (Waterproplus LABCONCO Corporation, Kansas city, Missouri 64132–2696) and distilled water was used in all experiments.

Cell cultures

Human Rhabdomyosarcoma cell line (RD), and human breast adenocarcinoma cell line (MCF-7) were cultured in Dulbecco’s Modified Eagle Medium (DMEM), supplemented with 10% heat inactivated fetal bovine serum (FBS), penicillin (100 U/mL) and streptomycin (100 U/mL). The cells were maintained in 25 cm2 plastic tissue culture flasks at 37oC in a humidified atmosphere containing 5% CO2 in air. Exponentially growing cells were used in all experiments. The normal rat fibroblast (CC1) cell line was employed as the control.

Preparation of poly-herbal extract

The poly herbal drug (5 g) soaked in distilled water (100 mL) was kept in the rotary shaker for 48 hours in an air tight dark bottle. The extract was then filtered through a layer of muslin cloth and filtrate was centrifuged at 3,000 rpm for 15 minutes at 4oC to remove any debris.

The supernatant was freeze dried, and stored at -20°C in an air tight vial until used. The freeze dried extract was reconstituted with distilled water for experimental purposes.

Antioxidant activity

The DPPH assay was used to determine the radical scavenging activity of the extract, as reported previously by Perera (2008) [4]. Briefly different concentrations of plant extract (100 µL) was mixed with DPPH reagent prepared in absolute ethanol (100 µM, 900 µL) and incubated for 30 minutes in darkness at 37oC, in a water bath. The percentage of de-colorization was obtained spectro-photometrically at 517 nm. The control was prepared as above without adding extract while L-ascorbic acid was used as the positive control.

At least three independent tests were performed for each sample. Percentage inhibition was calculated from the following formula:

CST 2017-214 Fomula1

The effective concentration of the sample required to scavenge the respective radical by 50% (EC50) was calculated using the linear segment of the curve obtained with percentage inhibition against concentration.

Total phenolic content (TPC)

The total phenolic content of the lyophilized sample (n = 6) of the poly herbal drug was determined using the Folin-Ciocalteu method [5].

Brine shrimp bioassay

Brine shrimp assay was conducted to determine the cytotoxicity (LD50) of the poly herbal drug as explained previously by Soysa (2014) and Middleton (2005) [6, 7].

Briefly, dried cysts of brine shrimps (10 mg) were allowed to hatch at room temperature in sterile sea water. After 24 hours the free nauplii were selected and 10 were added to each petridish containing different concentrations of the extract in sea water. After 24 and 48 hours, the petridishes were observed using a magnifying glass and the number of survived nauplii in each petridish was counted.

The mortality end-point of this bioassay was defined as the absence of controlled forward motion during 30 seconds of observation [7].

The percentage lethality was determined by comparing the surviving larvae of the test and the control. The percentage survival was calculated as:

CST 2017-214 Fomula2

Cell viability assay

The effect of aqueous extract of the drug on the cell viability was determined by MTT assay. The live cells reduce yellow MTT to purple formazan crystals by mitochondrial dehydrogenase enzyme [8]. Cells were suspended in the growth medium and seeded in 24-well plates at 2 x 10⁵ cells/well for overnight. The cells were then treated with different concentrations of the drug at 37oC for 24 and 48 hours. A positive control with cyclohexamide (50 g/mL) and a negative control without the drug were simultaneously conducted.

Percentage viability of the cells treated with the drug was calculated comparing the viability of the un-treated cells.

After 24/48 hours, the utilized growth media was subsequently replaced with 1.0 mL of minimum essential media (MEM), and 100 µL of MTT (5 mg/mL in PBS). The cells were incubated at 37o C for 4 hours and the medium was carefully removed. The formazan product was dissolved in acidified isopropanol (0.05 M HCl in isopropyl alcohol (IPA); 750 µL) and absorbance was read at 570 nm. Cell survival was expressed as a percentage of viable cells of treated samples to that of untreated cells (negative control). The drug extracts were prepared in triplicate and each experiment was performed in triplicates to each preparation.

Lactate dehydrogenase (LDH) activity

Cytotoxicity induced by the LPG evaluated by lactate dehydrogenase (LDH) leakage into the culture medium, as explained in Fotakis and Timbrell (2006) [9]. Cells seeded in 24 well plates (2 x 10⁵ cells/well) were exposed to different concentrations of the drug. After 24/48 hours incubation the culture medium was aspirated and centrifuged at 4000 rpm for 5 min in order to obtain a cell free supernatant. The cell lysate was prepared by treating the cells with Triton X 100 (0.1%; 1 mL) and sonicating the contents for 20 seconds. The final suspension was centrifuged at 4000 rpm for 5 minutes. Medium and the lysate were subjected to LDH assay. The activity of LDH in the medium was determined using a commercially available, LDH assay kit (HUMAN).

Negative control and positive control with cyclohexamide (50g/mL) were also carried out along with the experiment to measure the percentage LDH leakage.

The absorbance was measured at 340 nm at intervals of 15 seconds for 1.5 minutes using an air blank. The rate of decline (gradients of the graphs) of NADH concentration was used to calculate the LDH activity in the supernatant and the lysate.

The percentage LDH leakage to the medium was calculated using the following equation.

CST 2017-214 Fomula3

Where total LDH activity = LDH activity of supernatant + LDH activity of the lysate.

Light microscopy

RD, MCF-7 and CC1 cells grown at 70% confluence were treated with different concentrations of aqueous drug extracts for 24, 48 and 72 hours and observed under phase-contrast inverted fluorescence microscope (40X). The changes in morphology were compared with positive and negative controls.

Statistical analysis

All the results of the experiments were expressed as the mean ± standard deviation (Mean ± SD). The measurements were performed in triplicate and values shown are representatives of at least three independent experiments. Least square linear regression analysis was applied using Microsoft excel to determine the EC50/LD50 values and for the calibration curves.

R2 > 0.99 was considered as linear for the calibration curves.
Significant differences of each test result were statistically analyzed using “Mann-Whitney U” test significances with 95% significance using SPSS version 16.

Results

Anti-oxidant capacity and total Phenolic content

The aqueous extracts of the poly herbal drug showed moderate free radical scavenging activity with a value of EC50 = 68.0 ± 2.8 g/mL with compared to the positive control, L- ascorbic acid (3.4±0.9g/mL; n=6).
The percentage total phenolic content of the aqueous extract of the poly herbal drug was 5.3 ± 0.1 W/W % of Gallic Acid Equivalence (GAE).

Brine shrimp bioassay

LPG shows no lethality towards the brine shrimp even after 48 hours exposure up to a concentration of 10 to 2000 μg/mL. This results show that the aqueous extract either does not possess any significant (p>0.05) alterations in the cellular functions or no significant cytotoxity.

Cell viability assay

The effect of LPG on cell viability of RD, MCF-7 and CC1 cells was evaluated by tetrazolium assay (MTT).
Multiple concentrations of the aqueous extract of the poly herbal drug were used and effective concentrations were calculated for each cell line (EC50) from dose response curve. The percentage cell viability of RD, MCF-7 and CC1 are shown in Figure 1.

CST 2017-214 Figure1

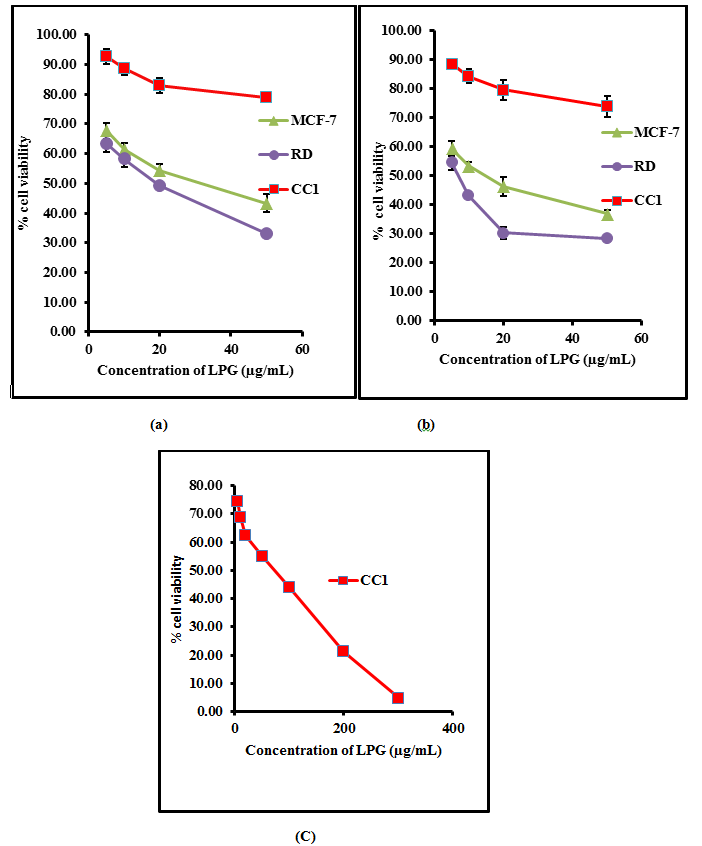
Figure 1. The percentage cell viability of on RD, CC1 and MCF-7 cell lines as determined by MTT assay, (a) after 24 hours treatment (b) 48 hours and (c) 72 hours with aqueous extract of the poly herbal drug. The data are presented as mean ± SD of six independent experiments.

The aqueous extract of the LPG exhibited no significant cytotoxic activity (p>0.05) against CC1 cell line, achieving an EC50 of 85.3 ± 9.8 µg/mL after 72 hour incubation.

On the contrary, the aqueous extract of the poly herbal drug exhibited significant cytotoxic activity (p<0.05) against RD and MCF-7 cell lines compared to the CC1 cells as shown in Table I.

Table I. EC50 values obtained for MTT assay for the three different cell lines.

CST 2017-214 Table1

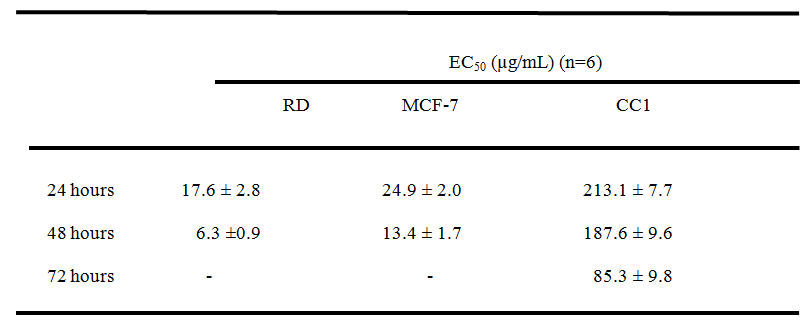
*All results were mean of 6 independent measurements ± standard deviation. “Mann-Whitney U” test at 95% confidence level showed a significant difference (p < 0.05) in both RD and MCF-7 cells compared to CC1 cells.

After 24 and 48 hour incubation with Cyclohexamide (Positive control) at a concentration of 50µg/mL, the percentage viability showed by tested cells depicted in Table 2. The percentage cell viability obtained for MTT assay at a concentration of 50µg/mL of LPG was calculated using respective regression equations to compare the capacity to inhibit cell proliferation, with that of the positive control. The values are shown in Table 2.These results exhibited the significant cytotoxicity (p< 0.05) exert by the aqueous extract of LPG against cancer cells compared to CC1 cells as determined by MTT assay.

Table 2. Percentage cell viability obtained by MTT assay at 50 µg/mL Cyclohexamide (+ve Control) and 50 µg/mL LPG after 24 hours and 48 hours exposure

CST 2017-214 Table2

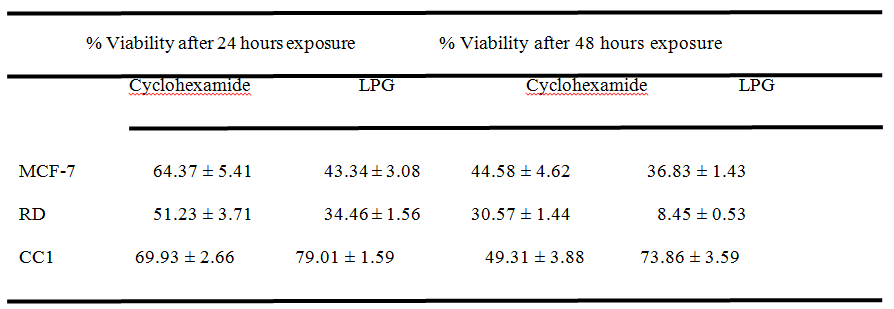
*All results were mean n=6 measurements ± standard deviation in three independent experiments.

Lactate dehydrogenase (LDH) assay

Measurement of LDH activity is also an indicator of cell viability through evaluation of the cell membrane permeability. The enzyme activity is measured externally, as it leaks from dead cells which lose their membrane integrity. The LDH release curves for RD, MCF-7 and CC1 cell lines treated with different concentrations of the LPG suggested that the cytotoxic effect of the extract was concentration dependent (Figure 2).

CST 2017-214 Figure2

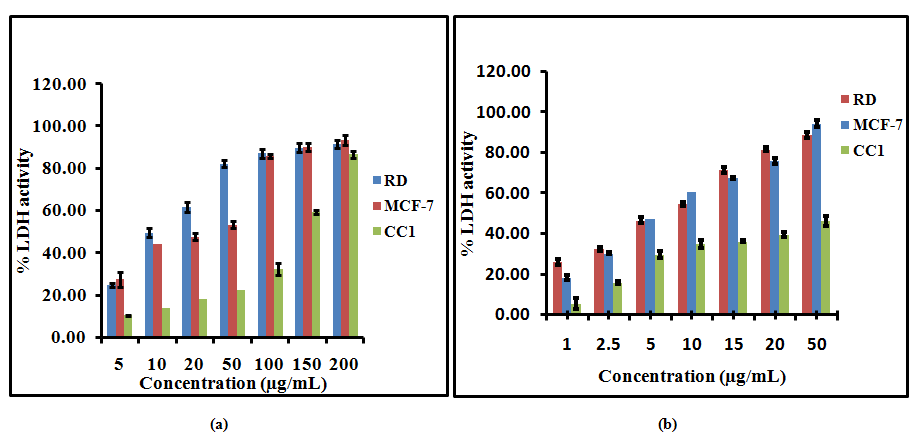
Figure 2. Lactate Dehydrogenase (LDH) release from RD, MCF-7 and CC1 cells with aqueous extract of the poly herbal drug, (a) after 24 hour, (b) after 48 hour incubation. The data are presented as mean ± SD of six independent experiments.

Fifty percent leakage of LDH to the media was observed at 26.9± 1.6 and 30.5 ±2.8μg/mL for RD and MCF-7 cells after 24 hour incubation respectively. After 48 hours of incubation with LPG the EC50 values further decreased and 50% LDH leakage arise at 8.2± 0.2 and 6.0± 0.2 μg/mL for RD and MCF-7 cells respectively. In contrast to RD and MCF-7 cells the CC1 cells showed 50% leakage of LDH at 159.3± 3.1 and 103.1 ±5.2μg/mL LPG concentrations after 24 and 48 hours respectively.

Light microscopy

Morphological alterations of RD, MCF-7 and CC1 cell lines upon exposure to the aqueous extract of the poly herbal drug was observed under the phase contrast inverted microscope. The microscopic observations revealed that the aqueous extract has a significant cytotoxic effect on RD and MCF-7 cells compared to the negative control. However CC1 cells treated with the drug did not show significant cell death (Figure 3).

CST 2017-214 Figure3

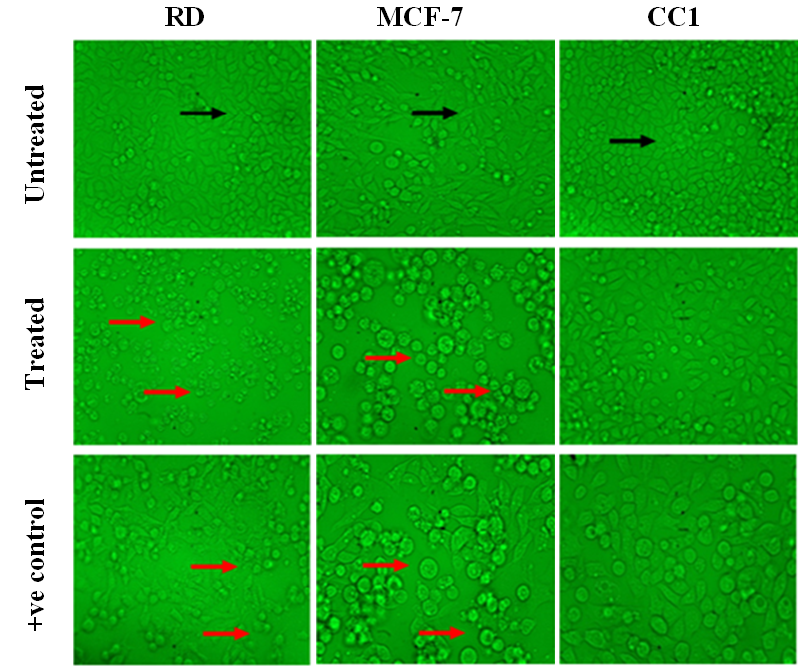
Figure 3. Light microscopy images of RD, MCF-7 and CC1 cells treated with their respective EC50 values of LPG, with magnification of 40X. (Black arrow – indicates healthy spindle shape cells; Red arrow – dead and shrinkage cells due to the LPG treatment).

Discussion

Cancer has become the most leading cause of death worldwide. It has become an emerging health problem affecting both developing and developed countries. According to the World Health Organization reports published in 2014, 8.2 million patients have died from cancer in 2012 and the number of annual cancer cases reported in 2012 was 14 million. It has been also estimated that the number of annual cancer cases would have increased from 14 million in 2012 to 22 million within the next two decades [10]. The most effective treatment approaches in cancer are chemotherapy and radiotherapy. Nevertheless, the higher incidence in side effects, have made investigators engage in finding novel anticancer compounds with less adverse effects. As a result of this, plants and other natural sources have provided nearly 60% of anti cancer agents which are currently in use [11]. Especially the most novel chemotherapeutic agents more than ever before are botanical in kind [2].

Traditional folklore medicine which involves the use of natural elements uses either single or multiple herbs as a mixture (polyherbs) for treatment of diseases. The use of polyherbal formulation is found to be more effective than the use of a single herb as the active phytochemical constituents of the individual plants are insufficient to achieve the desirable therapeutic effect. But when combining the herbs in a particular ratio the synergistic effect produced by the active phytochemicals of several plants give a better therapeutic effect [12].

Polyherbal preparations are used worldwide for treatment of various disease conditions including cancer. As the polyherbal formulations have gained more attention, many studies have been conducted to identify the mechanism of action and the efficacy of these polyherbal preparations. A latest study [13] which gives a global perspective on polyherbal formulations reports that for the past six years, only 2 publications have been made regarding polyherbal formulations that show/have anticancer activity.

Zyflamend® used in China [14], Sho-saiko-to® used in Japan [15] and Arbudhcure® used in India [16] are few of the polyherbal preparations used for cancer treatment where attempts have been made to validate scientifically for their mechanism of action and therapeutic efficacy.

With compared to the aforementioned poly herbal drugs the polyherbal LPG is not commercialized and no scientific research has been carried out up to this study to identify its mechanism of action or evaluate its effectiveness on treatment of cancer even though it is being used to treat 32 different types of cancer in traditional medicinal system in Sri Lanka.

Secondary metabolites of plants including phenolic compounds are very important for their essential functions in reproduction, growth and in defense mechanisms [17]. Phenolic compounds also provide natural antioxidants for protection against many diseases including cancers. It has been reported that antioxidant effects of plants are mainly attributed to the radical scavenging activity of phenolic compounds such as flavonoids, polyphenols, tannins, and phenolic terpenes. The polyphenols have the capability to scavenge ROS as well as oxidatively generated free radicals which derive from bio-molecules [18].

As depicted in results the quantitative measurement of poly phenolic content obtained in the present study showed that the water extract of LPG has moderate levels of polyphenols. Similarly the EC50 values obtained for the different samples of LPG for DPPH assay showed higher values compared to EC50 of ascorbic acid which evidently indicate that the LPG has a lower anti-oxidant capacity.

It was reported by several authors, that the proliferation of cancer cells are inhibited by the high antioxidant and poly phenolic content present in plant extracts [14, 19]. This probable fact that presence of low polyphenolic content and low antioxidant potential was explained in Hamberger and Hastettman 1991[20], as possible changes occurring in the chemical composition of the plant materials during the processes of the drug manufacturing that could result in a reduced pharmacological activity in mixtures. Thus it can be suggested that even though the LPG exerts an effective antiproliferative activity and cytotoxicity, the mechanism of action must be in a different pathway compared to most of the other traditional medicinal drugs which exert antiproliferative activity via the phenolics and antioxidants.

Cytotoxic action in brine shrimp assay is brought about by the active ingredients present in the drug by disturbing the fundamental mechanisms associated with cell growth, mitotic activity, differentiation and function [21]. According to previous reports a crude plant extract is toxic (active) if it has an LD50< 1000 µg/mL while non-toxic (inactive) if LD50> 1000 µg/mL [22]. The present study evidently indicates that the aqueous extract of LPG shows no lethality towards the brine shrimp even after 48 hours of exposure within the concentrations tested ranging 10 to 2000 µg/mL. This results show that the aqueous extract either does not possess any significant (p>0.05) alterations in the cellular functions or no significant cytotoxicity. Similar results were observed in a previous study which shows anticancer activity of the plant extract of Flueggea leucopyrus against HEp 2 cells but no toxicity for brine shrimps [6].

In this study the cell viability of the tested cell lines were determined by the MTT reduction assay. Each cell type was treated with different concentration of LPG extract and incubated for 24 and 48 hours. The EC50 value was obtained from the graph between the percentages of cell viability versus concentrations of LPG extract (Figure 1). The values were used to describe the degree of cytotoxicity of the extract towards cell lines. The cell viability of CC1 cells were further determined after 72 hours due to the high viability of the cells at 48 hours of incubation (187.58 ± 9.59 µg/mL).

It was established by the American National Cancer Institute (NCI), that if a crude extract shows EC50< 30 µg/mL after an incubation of 72 hours it is considered as cytotoxic [23]. However crude extract with EC50 less than 20µg/mL after 48 hours incubation is supposed to be highly cytotoxic [24]. Present study shows a potent cytotoxic effect on RD and MCF-7 cells with the aqueous extract of the LPG even at 24 hours which is much lower than the value specified by the NCI. However, the extract was less cytotoxic towards normal mouse fibroblast cell line CC1.

After 24 and 48 hours of incubation with Cyclohexamide (Positive control) at a concentration of 50μg/mL, the percentage viabilities of the tested cells are showed in Table 2. In contrast, the percentage viability obtained for MTT assay at the same concentration of LPG (50 μg/mL) treatment was markedly lower for RD and MCF-7 cells (Table 2).The EC50values obtained for MTT assay indicate that the cytotoxicity of the LPG extract against the cancer cell lines is within the limit of cytotoxicity (EC50 < 30 μg/mL), as reported by the American National Cancer Institute (NCI) over 72 hour post exposure and it is beyond the limits for CC1 cells (Table 1) Thus LPG shows significant anti-proliferative activity on cancer cells studied compared to the standard anti cancer drug. Cyclohexamide showed a % cell viability of 69.93 ± 9.26% and 49.31 ± 3.88% for 24 and 48 hours respectively for CC1 cells, suggesting its high toxicity towards the normal cells compared to the LPG (Table 2).

It is reported that the poly herbal anticancer drug Zyflamend® shows an EC50 value of 200 µg/mL against prostate cancer cell line (PCC) after an incubation period of 96 hours [14]. Japanese poly herbal drug Sho-saiko-to® shows an EC50 value of 353.5 µg/mL against human hepatocellular carcinoma (HCC-KIM) at 72 hour incubation [15], while Arbudhcure® shows an EC50 of 33.0 µg/mL against HeLa cells for 48 hours post exposure to the respective drug [16]. The current study demonstrates that LPG shows higher anti-proliferative activity on four different cancer cell lines investigated in the present study in comparison with aforementioned polyherbal drugs.

Measurement of LDH activity is another indicator of cell viability through evaluation of the cell membrane permeability. Previous studies suggest that LDH is a more reliable and accurate marker of cytotoxicity, since damaged cells is fragmented completely during the course of prolonged incubation with substances [25]. The intracellular LDH release to the medium is a measure of irreversible cell death. Xia (2007) [26] reported that there is a correlation between the direct involvement of LDH up regulation and subsequent induction of apoptosis, which is ideal for an effective anti cancer drug.

Fifty percent leakage of LDH to the media was observed at 26.9± 1.6 and 30.5 ±2.8μg/mL for RD and MCF-7 cells after 24 hour incubation respectively. After 48 hours of incubation with LPG the EC50 values further decreased and 50% LDH leakage arise at 8.2± 0.2 and 6.0± 0.2 μg/mL for RD and MCF-7 cells respectively. In contrast to RD and MCF-7 cells the CC1 cells showed 50% leakage of LDH at 159.3± 3.1 and 103.1 ±5.2μg/mL LPG concentrations after 24 and 48 hours respectively. These results indicate that the LPG is having minimal cytotoxic effect on control cells while it possesses a remarkable cytotoxicity on two cancer cell types studied.

Morphological alterations of RD, MCF-7 and CC1 cell lines upon exposure to the aqueous extract of the LPG revealed that even at low concentrations the morphology of the RD and MCF-7 cells changed into an irregular shape with extremely condensed nuclear contents, signs of membrane blebbing, suggesting an autophagic mechanism of cell death. The untreated cells (negative control)of RD and MCF-7 cell lines show cells with normal morphology (Spindle shape/ elongated cells) that adhered to the culture plate with no signs of cells death and growth disorders.

The positive control also shows the typical morphological changes which indicate the cellular damage in RD and MCF-7 cells. In contrast to the RD and MCF-7 cells the CC1 cells do not show any significant morphological changes even after 72 hour incubation with the extract.

Conclusions

The present study provides strong evidence for potent anti-cancer activity of the poly herbal drug “Le Pana Guliya” on RD and MCF-7 cells compared to controls. The brine shrimp and CC1 cells results suggest that the extract has minimum cytotoxicity towards the normal healthy cells. This calls for further studies on the active components and the mechanism of action involved in cytotoxicity of the chemotherapeutic action of LPG.

Acknowledement: The financial support by World Class University Research Grant No. AP/3/2012/CG/10is highly acknowledged.

Conflict of Interest: No conflict of interest between authors.

References

  • Vuorelaa P, Leinonenb M, Saikkuc P, Tammelaa P, Rauhad JP, Wennberge T and Vuorela H (2004) Natural products in the process of finding new drug candidates. Current Medicinal Chemistry11:1375-1389.
  • Biswas J, Roy M and Mukherjee A (2015) Anticancer Drug Development Based on Phytochemicals. Journal of Drug Discovery, Development and Delivery 2: 1012.
  • Hosseini A and Ghorbani A (2015) Cancer therapy with phytochemicals: evidence from clinical studies. Avicenna Journal of Phytomedicine 5:84-97.
  • Perera MGAN, Soysa SSSB, Abeytunga DTU and Ramesh R (2008) Antioxidant cytotoxic properties of three traditional decoctions used for the treatment of cancer in Sri Lanka. Pharmacognosy Magazine 4: 172-181.
  • Velioglu, YS, Mazza G, Gao L and Oomah BD (1998) Antioxidant activity and total phenolics in selected fruits, vegetables, and grain products. Journal of Agricultural Food & Chemistry 46: 4113–4117.
  • Soysa P, De Silva IS and Wijayabandara J (2014) Evaluation of antioxidant and antiproliferative activity of FlueggealeucopyrusWilld (katupila). BMC Complementary and Alternative Medicine 14:274.
  • Middleton P, Stewart F, Al-Qahtani S, Egan P, O’Rourke C and Sarker SD (2005) Antioxidant, antibacterial activities and general toxicity of Alnusglutinosa, Fraxinus excelsior and Papaverrhoeas. Iranian Journal of Pharmaceutical Research 2:81-86.
  • Mosmann T (1983) Rapid colorimetric assay for cellular growth and survival: application to proliferation and cytotoxicity assays. Journal of Immunological Methods 65:55-63.
  • Fotakis G and Timbrel J (2006) A In vitro cytotoxicity assays: Comparison of LDH, neutral red, MTT and protein assay in hepatoma cell lines following exposure to cadmium chloride. Toxicology Letters 160: 171–177.
  • World Cancer report 2014. International Agency for Research on Cancer (IARC) 2014, World health organization.
  • Cragg GM and Newman DJ (2000) Antineoplastic agents from natural sources: achievements and future directions. Expert Opinion on Investigational Drugs 9:2783-2797.
  • Parasuraman S, Thing GS and Dhanaraj SA (2014) Polyherbal formulation: Concept of ayurveda. Pharmacognosy Reviews 8:73-80.
  • Aslam MS, Ahmad MA, Mamat AS, Ahmad MZ and Salam F (2016) An Update Review on Polyherbal Formulation: A Global Perspective. Systematic Reviews in Pharmacy 7:35-41.
  • Zhao Y, Donohoe D, Huang EC and Whelan J (2015) Zyflamend, a polyherbal mixture, inhibits lipogenesis and mTORC1 signalling via activation of AMPK. Journal of Functional Foods 18:147-158.
  • Yano H, Mizoguchi A, Fukuda K, Haramaki M, Ogasawara S, Momosaki S and Kojiro M (1994) The herbal medicine sho-saiko-to inhibits proliferation of cancer cell lines by inducing apoptosis and arrest at the G0/G1 phase. Cancer Research 54: 448-454.
  • Pankajaakshan PK and Hashim KM (2014) Anti-cancer activity of Arbudhcure prepared from Aswathy medical hall. European Journal of Experimental Biology 4:22-25.
  • Prior RL, Wu, X and Schaich, K (2005) Standardized methods for the determination of antioxidant capacity and phenolics in foods and dietary supplements. Journal of Agriculture and Food chemistry 53: 4290-4302.
  • Valko M, Leibfritz D, Moncola J, Cronin MTD, Mazura M and Telser J (2007) Free radicals and antioxidants in normal physiological functions and human disease. Review. International Journal of Biochemistry and Cell Biology 39: 44-84.
  • Suryavanshi S, Choudhari A, Deshpande R, Kulkarni O and Kaul-Ghanekar R (2011) Analyzing the antioxidant potential of aqueous and ethanolic preparations of an herbal composition (HC9) and evaluating their cytotoxic activity in breast cancer cell lines. Biotechnology, Bioinformatics and Bioengineering 1:513-522.
  • Hamberger M, Hastettman K (1991) Bioactivity in plants: the link between phytochemistry and medicine. Phytochemistry 30:3864-3874.
  • Meyer BN, Ferrigni NR, Putnam JE, Jacobsen LB, Nichols DE and McLaughlin JL (1982) Brine shrimp: A convenient general bioassay for active plant constituents. Journal of Planta Medica 45: 31-34.
  • Olowa LF and Nuñeza OM (2013) Brine Shrimp Lethality Assay of the Ethanolic Extracts of Three Selected Species of Medicinal Plants from Iligan City, Philippines. International Research Journal of Biological Sciences 2: 74-77.
  • Abdel-Hameed ES, Salih A, Bazaid SA, Shohayeb MM, El- Sayed MM and El-Wakil EA (2012) Phytochemical studies and evaluation of antioxidant, anticancer and antimicrobial properties of Conocarpus erectus L. growing in Taif, Saudi Arabia. European Journal of Medicinal Plants 2: 93-112.
  • Mahavorasirikul W, Viyanant V, Chaijaroenkul W, Itharat A, Na-Bangchang K (2010) Cytotoxic activity of Thai medicinal plants against human cholangiocarcinoma, laryngeal and hepatocarcinoma cells in vitro. BMC Complement Altern Med 10: 55. [crossref]
  • Sarveswaran S, Marati RV and Marathaiveeran PB (2006) Effects of Terminalia arjuna bark extract on apoptosis of human hepatoma cell line (HEPG2). Journal of Gastroenterology 12: 1015-1024.
  • Xia GH, Chen BA, Shao ZY, Lu HX, Konstanze D and Hartmut D (2007) Mechanism of 2-methoxyestradiol-induced apoptosis in myelodysplastic syndrome MUTZ-1 cell line. Zhongguo Shi Yan Xue Ye Xue Za Zhi 15:296-301.

Bridging the Gap: Incorporating Exercise Evidence into Clinical Practice in Breast Cancer Care in Ontario-A Pilot Randomized Control Trial Protocol

DOI: 10.31038/CST.2017222

Abstract

Background: Breast cancer (BC) and its treatments lead to numerous side effects that affect a person’s life for years after treatment has ended. Research shows that regular exercise limits many of these side effects.However, less than 30% of BC survivors regularly exercise due to many barriers at both the patient and health care professional level. The purpose of this pilot trial is to assess the feasibility and effectiveness of conducting a novel KT intervention using exercise and self-management versus usual care among BC survivors.

Methods: Study Design: Pilot randomized controlled trial. Eligibility: Women older than 18 years who are currently undergoing chemotherapy treatment for BC. Intervention: The intervention group includes an 8-session multi-component intervention with a structured aerobic exercise program plus SM supervised by a physiotherapist. Randomization: Participants will be randomly allocated using a 1: 1 allocation ratio to receive the intervention of structured exercise plus SM program or usual care. Outcomes: The primary feasibility outcomes include recruitment rate, retention rate, and adherence rate. The secondary outcomes include exercise knowledge and behavior, HRQoL and resource utilization. Analysis: A blinded assessor will assess outcomes at baseline, post intervention, at 2- and 4-month follow up. Intervention feasibility and effectiveness will be assessed using descriptive statistics and analysis of covariance for continuous outcomes.

Discussion: This study aims to assess the feasibility of a novel KT intervention to close the current KT gap and increase exercise awareness for women with BC. This project will assess process and resource variables before implementation of a larger scale intervention. The overall project goal is to promote sustainable exercise behaviour to help manage the burden of BC.

Trial Registration: This trial was registered on ClinicalTrials.gov on March 21, 2017 (Identifier: NCT03087461).

Keywords:

Breast neoplasms, exercise, translational medical research, pilot study, rehabilitation

Introduction

Breast cancer (BC) and its treatments lead to numerous side effects that affect a person’s quality of life (QOL) for years after treatment has ended [1-5]. Research has shown that regular exercise limits many of these side effects and can prevent disease recurrence [5-10]. However, less than 30% of survivors participate in regular exercise [11-13]. Previous research conducted by our team has shown that over 80% of BC survivors in southwestern Ontario are unaware of the benefits of exercise and are not educated on the need to stay physically active [11], health professionals face many institutional, personal, and patient-related barriers to promoting exercise [14], and there is a need for novel knowledge translation (KT) strategies within cancer institutions that focus on easy-to-access exercise interventions and education by physiotherapists (PTs) [15].

Moreover, the societal burden of this disease is projected to increase substantially over the next two decades. The Canadian Cancer Society’s 2015 Statistics report [16] suggests that the number of new cancer cases in women will increase by 74% by the year 2032 due to the aging Canadian population. The number of new cases of BC is projected to increase by more than 10,000 in this same time period [16]. Fortunately, due to improved screening and treatment techniques, survival rates for BC are increasing [3]. However, physical and functional sequelae prevent survivors from returning to their activities associated with work, leisure, and domestic roles [3]. Exercise is an effective, safe, and cost-efficient way to manage this burden and return women to their pre-cancer activity levels. Therefore KT research is needed to determine how to best translate and integrate this research knowledge into clinical practice in order to elicit sustainable behaviour change for this population. Pilot work completed for this project has shown that in order to change clinical practice, implementation strategies using accessible exercise options and education are needed within the institution to maximize women’s engagement with exercise information provided and to partake in this behaviour [15]. Along with this, self-management (SM) programs have been shown to improve QOL and physical side effects in BC survivors, however, the implementation of these programs in clinical practice is scarce [17]. The current knowledge to practice gap in the field of BC rehabilitation shows that novel KT strategies are needed.

A pilot study is an, “investigation designed to test the feasibility of methods and procedures for later use on a large scale or to search for possible effects and associations that may be worth following up in a subsequent larger study” [18]. For this project, a pilot study is needed as the first step in order to assess process and resource variables before implementation of a large scale intervention [19]. Process variables include measuring recruitment rate, retention rate, and adherence rates to the intervention provided [19]. Resource variables include determining the centers willingness and capacity to house a specific intervention, equipment availability, intervention location, and budget concerns [19]. There is currently a lack of pilot trials for a novel KT intervention of this sort and therefore this pilot study will aid in shaping and guiding a larger, phase III trial.

Methods & materials

Study Purpose:

The purpose of this study is to determine whether KT strategies, focusing on accessible exercise locations and SM education by PTs using technology, are feasible and impact exercise knowledge and behaviour, QOL, and need for additional health care services among women with BC. Specifically, the objectives of this project are to: (1) Determine the feasibility (through recruitment, retention and adherence rates) of providing a complex KT intervention designed specifically for women with BC using technology, and (2) Determine preliminary estimates of effects of the KT intervention on levels of exercise knowledge and behaviour, health related quality of life and, resource utilization, among BC survivors over a four month period.

Study Design & Participants:

This study is a pilot randomized controlled trial. Eligible participants will include community-dwelling, English-speaking women, over 18 years, who are currently undergoing chemotherapy for Stage 1-3 BC and have been cleared by their oncologist to participate in moderate intensity aerobic exercise. Participants will be excluded from the study if they have another chronic disease, cognitive impairment or injury that prevents them from participating independently in moderate intensity exercise.

Recruitment:

Medical oncologists and Primary Care Nurses at the Juravinski Cancer Centre (JCC) will recognize possible participants for this study within their patient caseload. For those they think are eligible, the health care professional will briefly discuss the study with their patient and get consent for the patient to be contacted by a member of the research team. Possible participants will be contacted by phone to discuss eligibility and potential study enrollment. The Hamilton Integrated Research Board approved this study (reference #: 3124) in April 2017. All participants will provide written informed consent on the approved consent forms prior to enrollment in this study.

Intervention:

This pilot project will implement a multi-dimensional KT intervention including an exercise and SM program. Refer to Figure 1 for study flow chart.

Figure 1. Study Flow Chart

                                                            Figure 1. Study Flow Chart

The exercise intervention will involve an evidence-based moderate intensity aerobic exercise program, using recumbent bikes, delivered within the cancer institution. Results from participants in our focus group run during the pilot work for this project suggest that exercise programs should be delivered in the institution where women are waiting for their chemotherapy. Delivering the program in this environment will increase the accessibility of the services and we anticipate this approach will increase exercise awareness. Participants will take part in the 30-minute, moderate intensity (50-70%HRmax or 4-6/10 on Rate of Perceived Exertion scale) aerobic exercise program for 8 sessions. The intervention will be supervised by a PT educated in cancer rehabilitation and who has been trained in the specific protocol used and in working with women with BC.

The SM component will include educational modules created by a PT. Participants will view these 30 minute modules prior to each exercise intervention, over the same 8 sessions. Content provided within the program will include information on the benefits of exercise during and after BC treatment, safe exercise prescription, how to self-monitor exercise levels, action planning for specific exercise strategies, and precautions related to exercise and BC. Refer to Table 1 for details of SM content for each week of the program. A variety of tools will be used in the SM program, including a mobile app and e-health resources for BC. Having numerous sessions will allow the PT to provide consultation in respect to exercise adaptation, parameters, and programming in order to facilitate long-term exercise engagement and participation. Adherence and fidelity to the specified exercise and self-management protocol will be monitored through random observation by study investigators. (Figure 1, Table 1).

Table 1. Self-Management Content

Session Content
1 Introductions.

What are the side effects of treatment? Why do they happen?

Benefits of exercise for women with breast cancer.

Types of exercise and safety precautions during exercise (how to monitor BP, HR, RPE)

What is self-management?

How to participate in effective self-management.

Self-management and breast cancer.

Introduction to goal setting/action planning.

2 Review of previous week goal/action plan.

The importance of posture for women with breast cancer (common postural issues, how to assess posture, how to ensure optimal posture).

Relaxation and breathing techniques to manage anxiety and stress.

Set goal/action plan for week.

3 Review of previous week goal/action plan.

Appropriate exercise techniques to maintain/increase endurance:

–                      Description of aerobic exercise

–                      Types of aerobic exercise

–                      Parameters for aerobic exercise

Set goal/action plan for week.

4 Review of previous week goal/action plan

Appropriate exercise techniques to maintain/increase strength

–                      Description of strengthening exercise

–                      Types of strengthening exercise

–                      Parameters for strengthening exercise

Set goal/action plan for week.

5 Review of previous week goal/action plan

Other forms of Exercise (flexibility, yoga, Tia Chi, etc)

Appropriate exercise techniques to maintain/increase flexibility:

–                      Description of flexibility exercises

–                      Types of flexibility exercises

–                      Parameters for flexibility exercise

Description of other forms of exercise:

–                      Types of other forms of exercise

–                      Parameters of other forms exercise

Set goal/action plan for week.

6 Review of previous week goal/action plan.

Self-monitoring physical activity levels:

–                      Introduction to Breast Cancer Physio Guide (App)

–                      Introduction to Stanford Action Planning App

–                      Other techniques to monitor physical activity levels

Set goal/action plan for week.

7 Review of goal/action plan.

Communicating with others (family, health professionals) about exercise and physical activity.

Available exercise programs in the community.

How to move forward: how to evaluate progress.

Set goal/action plan for week.

8 Review of goal/action plan.

Summary of self-management program.

How did you use self-management information?

Questions/comments.

Outcomes:

Primary Outcomes: The feasibility and effectiveness of the KT intervention will be assessed using quantitative outcomes. The primary outcomes of feasibility variables will be assessed at baseline and post intervention, where applicable. Feasibility will be assessed by measuring recruitment (percentage (%) of eligible patients recruited), retention (% of consented patients who complete the intervention), and adherence rates (% of sessions attended) to the intervention).

Secondary Outcomes: Secondary effectiveness outcomes will be assessed at four time points: baseline, post intervention, and at 2 and 4 month follow up. At baseline, participants will be instructed on how to complete each self-report measure by an assessor blinded to participant group allocation. All post-intervention, 2 and 4 month follow up, assessments will be mailed to participants to complete and return to study investigators using pre-paid postage envelops. No identifiers will be used on these assessments and therefore assessors performing the analysis of data will be blinded to participant group allocation. Hard copies of the completed outcome measures will be stored in a locked filing cabinet only accessible by the study investigators at McMaster University and data entered into statistical analysis software will be stored on a password protected computer.

Level of exercise knowledge and behaviour will be assessed using a Theory of Planned Behaviour (TPB) [20] based questionnaire. The TPB has been used extensively to determine levels of intention and behaviour for various health behaviours, including exercise [21,22].

Quality of life will be measured using the FACT-B [23], a selfreport measure designed to assess multi-dimensional QOL specifically for women with BC.

Need for additional health care services will be measured using the EQ-5D [24] and a piloted self-report questionnaire assessing health care facility visits, doctor visits, procedures received, support services used, loss of work, and prescription medications used.

Sample Size:

Debate exists as to whether sample size calculations for pilot studies are necessary. Some authors suggest that no calculation is needed as long as the pilot study is large enough to provide useful information about the aspects that are being examined for feasibility [19]. However other authors suggest using a percentage of the sample required for a full study [25,26], or to use a confidence interval (CI) to establish feasibility [19,26]. For this project we have decided to calculate sample size based on the proportion of success of the primary outcome of feasibility (using estimates for adherence rates) [19,25,26].

Therefore, using a Z value from the standard normal distribution to reflect a 95% confidence interval (1.96), E as the desired margin of error (0.2), and p as the proportion of successes in the population (0.75-estimated adherence rates), the sample size for this pilot study will be at least 18 participants (9/group). With an expected drop out rate of 25%, based on previous exercise based literature with this population, the final sample size for this project should be 23 participants. In order to ensure an even number of individuals can be randomized to each group, this will be rounded up to a total of 24 participants (12/group).

Randomization-Sequence Generation:

Prior to participant randomizations, all eligible participants will complete the following forms: (a) patient information form, (b) Godin leisure time exercise questionnaire, (c) consent form, and (d) baseline measures. All participants will be informed verbally in person and in writing that they have equal chance of being randomized into the intervention or control group. They will not be made aware of the study hypotheses. Randomization to intervention or control group will be completed by a member of the research team who is independent of the intervention on a record by record basis using a computer software program (STATA/MP v14). This researcher will remain blind to the identity of each treatment group (by randomizing only to group A or B) during the randomization process. Participants may withdraw from the study at any time. Investigators may withdraw a participant from the research study if circumstances arise which warrant doing so (for example, safety).

Allocation Concealment & Implementation:

Allocation of participant randomization will be concealed in sequentially numbered, opaque, sealed envelops. The envelops will be opened sequentially by the researchers only after participant details have been written on the envelop by the researcher who completed randomization. If the participant is allocated to the intervention group, they will receive a phone call to organize details of the first intervention session (such as time and location).

Blinding:

Due to the nature of this knowledge translation study, participants and persons administering the intervention will not be blinded to group assignment. However, the assessor receiving the self-reported outcome measures will be blind to group allocation and will not be involved in running of the intervention. A researcher blinded to the group allocation of the participants will conduct all statistical analysis.

Statistical Methods:

Participant characteristics will be analyzed at baseline to ensure no significant differences exist between groups. Means and standard deviations (SD) will be used to report continuous variables and t-tests will be used to assess differences between the two groups for these variables. Frequencies will be used to report categorical variables and Pearsons X2 test will be used to assess differences between groups for these variables. All statistical analysis will be completed using STATA/ MP 14. Refer to Table 2 for a summary table of study objective and methodology.

Research Questions 1: Descriptive statistics will be used to measure feasibility (recruitment rate, retention rate, and adherence rates). Recruitment rates will be calculated by determining the percentage of eligible patients that were actually enrolled in the study. A recruitment log will be kept, detailing reasons for non-participation of eligible patients. Retention rate will be defined by calculating the percentage of enrolled patients who complete the intervention. Adherence rates will be calculated as a percentage of total sessions attended. Attendance will be tracked on the feasibility data collection sheet and reasons for non-participation on scheduled intervention days will be documented using an adherence log.

Table 2. Summary Table

Objective Hypothesis Outcome Analysis Method
Determine the feasibility (through recruitment, retention and adherence rates) of providing a complex KT intervention including accessible exercise programs delivered within the cancer institution and a SM program designed specifically for women with BC using technology Implementing and providing a complex KT intervention for women with BC is feasible (recruitment, retention, and adherence rates are 50%, 75%, and 75% respectively). Recruitment Rate Descriptive statistics (percentage (%) of eligible patients recruited). Recruitment logs will be kept, detailing reasons for non-participation of eligible patients.
Retention Rate Descriptive statistics (% of consented patients who complete the intervention).
Adherence Rate Descriptive statistics (% of sessions attended). Adherence rates will be tracked using the data collection sheet. Reasons for non-participation on scheduled intervention days will be documented using adherence logs.
Determine preliminary estimates of effects of the KT intervention of exercise plus SM versus usual care among BC survivors over a four-month period. Compared to the control group, BC survivors participating in the KT intervention will have higher levels of exercise knowledge and behaviours and QOL, and less need for additional health care services.


Levels of exercise knowledge and behaviour (using a Theory of Planned Behaviour  based questionnaire) An analysis of covariance will be used to determine within and between group differences. An intention to treat analysis will be used for these analyses.
Health related quality of life (using the FACT-B)
Resource utilization (using the EQ-5D and a piloted self-report questionnaire assessing health care facility visits, doctor visits, procedures received, support services used, loss of work, and prescription medications used)

Research Question 2: Effectiveness outcomes will be assessed at four time points: baseline, 12 weeks (post intervention), and at 2 and 4 month follow. An analysis of covariance will be used to determine within and between group differences. An intention to treat analysis will be used for these analyses. (Table 2)

Discussion

There is a small risk of participant injury during the exercise intervention. While it has been well documented that exercise is safe for this population if proper screening and precautions are followed, minor injuries have the potential to occur in any active intervention. In order to ensure safety, all participants will need medical clearance to participate in moderate intensity exercise from their medical oncologists and will be supervised by a physiotherapist during each session. Heart rate, blood pressure, rate of perceived exertion and oxygen saturation measurement tools will be present and used during each exercise session. While uncommon, all side effects secondary to exercise will be tracked using Exercise logs. Type, intensity, duration, and management of any side effect will be documented using these logs.

The findings of this KT pilot study will help to determine the feasibility and preliminary effectiveness of a novel implementation strategy. This project will inform a larger intervention trial which has the potential to change the way rehabilitation services are provided in clinical practice and impact all levels of BC prevention; secondary and tertiary prevention of treatment-related side effects, and primary prevention of disease recurrence through sustained behaviour change. The results from this pilot project should be interpreted with an understanding of the potential threats to the generalizability of the results. Specifically, the results of this pilot study will only be relevant to the implementation of a larger intervention at sites comparable to the JCC and will be specific to the unique characteristics of women with BC. As the intervention process and management is more extensive with larger numbers of participants, the researcher team will have to take into consideration additional time and resource needs when implement the larger scale project.

Trial status

Protocol Version Number: 3. Date: April 11, 2017. Approximate recruitment start date: June, 2017. Approximate recruitment end date: August, 2017. Any trial modifications will be updated in a timely manner on ClinicalTrials.gov and sent via email to appropriate parties.

Funding

The Hamilton Division of the Ontario Physiotherapy Association funds this project. This funding body has no role in the design of the study, collection, analysis or interpretation of data, or in writing of this or future manuscripts.

References

  • Shapiro SL, Lopez AM, Schwartz GE, Bootzin R, Figueredo AJ, et al. (2001) Quality of life and breast cancer: relationship to psychosocial variables. J Clin Psychol 57: 501-519. [crossref]
  • Wengström Y, Häggmark C, Strander H, Forsberg C (2000) Perceived symptoms and quality of life in women with breast cancer receiving radiation therapy. Eur J Oncol Nurs 4: 78-88. [crossref]
  • Ewertz M, Jensen AB (2011) Late effects of breast cancer treatment and potentials for rehabilitation. Acta Oncol 50: 187-193. [crossref]
  • Knobf MT, Sun Y (2005) A longitudinal study of symptoms and self-care activities in women treated with primary radiotherapy for breast cancer. Cancer Nurs 28: 210-218. [crossref]
  • Cella D, Fallowfield LJ (2008) Recognition and management of treatment-related side effects for breast cancer patients receiving adjuvant endocrine therapy. Breast Cancer Res Treat 107:167–180.
  • Cormie P, Pumpa K, Galvao D, et al. (2013) Is is safe and efficacious for women with lymphedema secondary to breast cancer to lift heavy weights during exercise: a randomized controlled trial. J Cancer Surviv 7:413-424.
  • Pastakia K,  Kumar S (2011) Exercise parameters in the management of breast cancer: a systematic review of randomized controlled trials. Physiother Res Int 16: 237-244. [crossref]
  • Chan D, Lui L, So W (2010) Effectiveness of exercise programmes on shoulder mobility and lymphedema after axillary lymph node dissection for breast cancer: systematic review. J Adv Nurs 66:1902-1914.
  • Bicego D,  Brown K, Ruddick M, Storey D, Wong C, et al. (2009) Effects of exercise on quality of life in women living with breast cancer: a systematic review. Breast J 15: 45-51. [crossref]
  • McNeely ML,  Campbell KL, Rowe BH, Klassen TP, Mackey JR, et al. (2006) Effects of exercise on breast cancer patients and survivors: a systematic review and meta-analysis. CMAJ 175: 34-41. [crossref]
  • Fernandez S, Franklin J, Amlani N, et al. (2015) Physical activity and cancer: A cross-sectional study on the barriers and facilitators to exercise during cancer treatment. Can Oncol Nurs J 42:37-72.
  • Courneya KS,  Katzmarzyk PT, Bacon E (2008) Physical activity and obesity in Canadian cancer survivors: population-based estimates from the 2005 Canadian Community Health Survey. Cancer 112: 2475-2482. [crossref]
  • Cheifetz O (2013) Clinician’s Commentary on Singh et al.(1.). Physiother Can 65: 192-193. [crossref]
  • Smith-Turchyn J, Richardson J, McNeely M, et al. (2017) Physical activity and breast cancer: A study on the barriers and facilitators to exercise promotion from the perspective of health care professionals. Physiother Can
  • Smith-Turchyn J, Richardson J, Tozer R, et al. (2016) Physical activity and breast cancer: Results of a focus group to devise novel exercise interventions for women with breast cancer. (currently under review in the journal “Rehabiliation Oncology”)
  • Canadian Cancer Society’s Advisory Committee on Cancer Statistics. Canadian Cancer Statistics 2015. Toronto, ON, Canadian Cancer Society, 2015.
  • Boogaard L, Gater L, Mori M, et al. (2016) Efficacy of self-management programs in managing side effects of breast cancer: A systematic review and meta-analysis of randomized control trials. Rehabil Oncol 34:14-26.
  • Everitt B (2006) Medical Statistics from A to Z: A Guide for Clinicians and Medical Students. Cambridge University Press: Cambridge.
  • Thabane L,  Ma J, Chu R, Cheng J, Ismaila A, et al. (2010) A tutorial on pilot studies: the what, why and how. BMC Med Res Methodol 10: 1. [crossref]
  • Ajzen I (1991) The theory of planned behavior. Organ Behav Hum Dec 50:179-211.
  • McEachan RR, Conner M, Taylor NT, Lawton RJ (2011) Prospective prediction of health- related behaviours with the Theory of Planned Behaviour: a meta-analysis. Health Psych Rev 5:97-144.
  • Smith-Turchyn J, Richardson J (2015) Critical Review of the Theory of Planned Behavior to Predict and Explain Exercise Behavior in Women with Breast Cancer. Crit Rev Phys Rehabil Med 27
  • Brady MJ,  Cella DF, Mo F, Bonomi AE, Tulsky DS, et al. (1997) Reliability and validity of the Functional Assessment of Cancer Therapy-Breast quality-of-life instrument. J Clin Oncol 15: 974-986. [crossref]
  • Pickard AS, Wilke CT, Lin HW, Lloyd A (2007) Health utilities using the EQ-5D in studies of cancer. Pharmacoeconomics 25: 365-384. [crossref]
  • Hertzog MA (2008) Considerations in determining sample size for pilot studies. Res Nurs Health 31: 180-191. [crossref]
  • Cocks K, Torgerson DJ (2013) Sample size calculations for pilot randomized trials: a confidence interval approach. J Clin Epidemiol 66: 197-201. [crossref]

Identification Potency of Clinical Isolates in Aspergillus Species Using MALDI-TOF MS

DOI: 10.31038/IMROJ.2017223

Abstract

It is important to make accurate identification of genus Aspergillus including cryptic species, because they could exhibit drug resistance to multiple antifungal agents. Recent advances in molecular diagnosis extended to clinical mycology, and matrix-assisted laser desorption/ionization time-offlight mass spectrometry (MALDI-TOF MS) has been applied as an attractive methodology. Herein we evaluated the ability of MALDI-TOF MS for the identification of genus Aspergillus. A total of 42 strains of Aspergillus were genetically identified by the sequence analysis of PCR amplicons and simultaneously followed by MALDI-TOF MS. The concordance rate for Aspergillus using MALDI-TOF MS was 90.5 % in comparison with sequencing of PCR amplicons. Thirty eight registered strains in the MALDI Biotyper standard library showed the perfect concordance rate (100%). Notablely, azolesresistant Aspergillus lentulus and Aspergillus felis, which were not registered in the MALDI Biotyper standard library, failed to be identified as the correct species. Moreover, these species with low score values in the MALDI-TOF MS analysis potentially resisted to a variety of antifungal agents. These results suggest that additional drug susceptibility testing should be further considered in poor yields with MALDI-TOF MS analysis.

Keywords:

matrix-assisted laser desorption/ionization time-of-flight mass spectrometry; Aspergillus felis; Aspergillus lentulus; Aspergillus tubingensis; cryptic species

Introduction

The genus Aspergillus is one of the ubiquitous fungi that exhibit wide clinical spectrums of diseases in humans. It is a causative pathogen from an allergic response to subacute invasive life-threatening diseases, depending on the host immune conditions. Chronic aspergillosis including aspergilloma is usually found in patients with previously formed lung cavities and/or with mild immunocompromised status. Especially the lives of immunocompromised patients (receiving organ transplantation and anti-cancer chemotherapy) could be threatened by invasive aspergillosis (IA). Additionally, as IA often results in a fatal outcome, the early diagnosis and immediate treatment for IA with optimal chemotherapy lead to improvement of patient’s prognosis [1,2].

Antifungal agents often exhibit variable activities against fungal organisms. For example, a few strains of genus Aspergillus could acquire drug resistance to multiple antifungal drug classes in accordance with failure of the antifugal treatment [3]. In addition, it has also been reported that azole-resistant cases of Aspergillus fumigatus have been increasing in number with several mutations in azole target genes [4]. Furthermore, cryptic species of A. fumigatus tend to resist azole antifungals, leading to the reduced treatment efficacy [5]. Therefore, in an effort to survey aspergillosis appropriately and to treat the patients with optimal antifungals, it is quite important to make accurate identification of genus Aspergillus including cryptic species.

Recently, matrix-assisted laser desorption ionization-time-offlight mass spectrometry (MALDI-TOF MS) (Bruker Daltonics, BD, Bremen, Germany) has also been applied to the identification of fungal pathogens in clinical settings [6]. This methodology is based on applying a laser to the mixed crystals of the clinical specimens and matrix, before implementing acceleration with an electric field [7]. The flight time is then measured to determine the molecular weight of specimens and the pathogens could be identified with the reference of the previously registered molecular patterns in the library. While the use of MALDI-TOF MS has a great potential as one of the reliable methods to detect pathogens, the information on its detection sensitivity and specificity remains to be limited. In this study, we demonstrate the possibility and the current limitation for MALDITOF MS-mediated identification of genus Aspergillus.

Materials and methods

Our current study was conducted with clinical strains of genus Aspergillus that were previously isolated and identified in our hospital between April 2014 and August 2016. The isolated strains, cultured at 37°C on Sabouraud dextrose broth for 2 days, were suspended in Sabouraud dextrose broth with 20% glycerol and then were stored at -80°C until the use.

For genetic identification of genus Aspergillus, stored samples were re-harvested on Potato Dextrose Agar (PDA) for 3 days, and each obtained colony was washed with 3 mL of phosphate buffered saline (PBS). DNA was then extracted from the pellet using the DNeasy plant mini kit (Qiagen, Hilden, Germany) according to the manufacturer’s instructions. The extracted DNA was used for the conventional sequence analysis of the following PCR products for the identification of genus Aspergillus. Segments of the internal transcribed spacer (ITS) and D1/D2 region were amplified using the primers ITS1 and NL4 [8], a segment of the beta-tubulin gene was amplified using the primers bT2a and bT2b [9] and a segment of the calmodulin gene was additionally amplified using the primers cmd5 and cmd6 [10]. The sequencing analysis of these PCR products with blastn (v2.5.0) algorism against database nucleotide collection (nr/nt) confirmed the species of Aspergillus. Additionally, to distinguish Aspergillus oryzae and Aspergillus flavus, a segment of the transcriptional regulator gene of the aflatoxin biosynthesis genes was additionally amplified and performed sequencing analysis using the primers aflR F2 and aflR R2 [11].

Analysis with the MALDI-TOF MS system was applied to above obtained each colony according to the manufacturer’s instructions with a MALDI Biotyper 3.1 RTC software and MALDI Biotyper 4.0 standard library (Bruker Daltonics, Bremen, Germany). Any score value (SV) of less than 1.7 was deemed insufficient for identification.

Drug susceptibilities were confirmed in accordance with the modified M38-A2 method, which is the standard protocol of the Clinical and Laboratory Standards Institute (CLSI) [12], with the lowest concentration of antibiotics without visible growth on the microplate of the Yeast-like Fungus DP Eiken Kit (Eiken Chemical, Tokyo, Japan): micafungin (MCFG), caspofungin (CPFG), amphotericin B (AMPH-B), itraconazole (ITCZ) and voriconazole (VRCZ) [12,13]. The breakpoint of each antifungal agent for Aspergillus was determined using the EUCAST Antifungal Agents Breakpoint tables for interpretation of minimum inhibitory concentrations (MICs) v. 8.0 [14]. For the epidemiological cut-off value (ECV) have been prescribed in this study as follows; 0.5 μg/mL was considered for CPFG [15]. The quality control was ensured by concurrent testing with the strain of A. fumigatus ATCC MYA-3626, which is a recommended strain of CLSI [12].

Results

A total of 42 strains of Aspergillus were genetically identified ( ≥99% identity) based on the sequence analysis of PCR amplicons from clinical specimens (Table 1). They consisted of 27 A. fumigatus, 7 Aspergillus niger, 3 Aspergillus terreus, 2 Aspergillus lentulus, and an each of A. oryzae, Aspergillus tubingensis and Aspergillus felis. To verify whether the results identified by MALDI-TOF MS could match the results by sequencing analysis, all isolates were simultaneously analysed by MALDI-TOF MS. As showin in Table 1, 38 out of 42 isolates (90.5 %) were mached as same spiceses of the genus Aspergillus. However, 2 specimens from cryptic species of A. fumigatus (A. lentulus and A. felis) showed very low score values (below 1.7) in MALDI-TOF MS analysis. Of note, these were not registered in the MALDI Biotyper standard library, and were unable to be correctly identified as its species. The score values for A. tubingensis, one of cryptic species of A. niger, were also below 1.772 and it was identified incorrectly as A. niger.

Table 1. Sequence analysis of Aspergillus isolates and application with MALDI-TOF MS

Section Species No. of isolates confirmed with PCR No. of matched isolates

with TOF MS (%)

Fumigati Aspergillus fumigatus 27 27 (100)
Aspergillus lentulus 2 0 (0)
Aspergillus felis 1 0 (0)
Nigeri Aspergillus niger 7 7 (100)
Aspergillus tubingensis 1 0 (0)
Terrei Aspergillus terreus 3 3 (100)
Flavi Aspergillus oryzae 1 1 (100)
total 42 38 (90.5)

We further addressed those drug susceptibilities in isolates that was incorrectly identified using MALDI-TOF MS. Results of the drug susceptibilities for Aspergillus section Fumigati were indicated in Table 2. For CPFG (ECV: 0.5 μg/mL), the obtained MIC values of cryptic species for A. fumigatus ranged to above 4 μg/mL (A. lentulus) and 2 μg/mL (A. felis), whereas no resistance to CPFG was noted in A. fumigatus. For AMPH-B, 2 specimens of A. lentulus were resistant. For ITCZ, all specimens were ranged lower than breakpoint MIC. However, for VRCZ, the obtained MIC values even in two isolates of A. fumigatus ranged over the breakpoint. Furthermore, in each isolate of A. lentulus and A. felis, the obtained MIC value was 4 or 8 μg/mL [13-17].

Table 2. Antifungal susceptibility for Aspergillus section Fumigati

Aspergillus fumigatus
minimum inhibitory concentration (microgram/mL)
<0.008 0.015 0.03 0.06 0.12 0.25 0.5 1 2 4 8
MCFG 21 6
CPFG 22 5
AMPH-B 15 12
ITCZ 10 16 1
VRCZ 13 10 2 1 1
Aspergillus lentulus
minimum inhibitory concentration (microgram/mL)
<0.008 0.015 0.03 0.06 0.12 0.25 0.5 1 2 4 8
MCFG 1 1
CPFG 2
AMPH-B 2
ITCZ 2
VRCZ 1 1
Aspergillus felis
minimum inhibitory concentration (microgram/mL)
<0.008 0.015 0.03 0.06 0.12 0.25 0.5 1 2 4 8
MCFG 1
CPFG 1
AMPH-B 1
ITCZ 1
VRCZ 1

Abbreviations:
MCFG, micafungin; CPFG, caspofungin; AMPH-B, amphotericin-B; ITCZ, itraconazole; VRCZ, voriconazole.

Discussion

Recently, application of MALDI-TOF MS allowed accurate identification for pathogens at species levels and it is possible to discriminate them at strain levels including relatively genus Aspergillus 6,16,17) as well as common fungi (e.g., Candida spp. and Cryptococcus spp.) [18-20]. In this study, we demonstrated that the identification for Aspergillus with MALDI-TOF MS could obtain a high concordance rate (90.5 %), compared with the genetic identifications using PCR. However, some strains belonging to cryptic species remain not to be discriminated in this protocol. As the reason of this limitation in cryptic Aspergillus species, we raised that taxonomic references of those species were absent in the MALDI Biotyper standard library. Since cryptic Aspergillus species have emerged in clinical settings worldwide and they have high possibility to be resistant to azole and/ or polyene antifungal agents, more Aspergillus spp. including cryptic species should be resistered into the library of MALDI-TOF MS 5).

Aspergillus felis showed the lowest score values in our anlaysis, and others also failed the identification 21). A. lentulus and A. tubingensis were also unable to be identified and A. tubingensis was incorrectly identified as A. niger. Notablely, A. lentulus and A. felis showed the high MIC value for VRCZ (Table 2), and these results appeared to be consistent with the findings of previous studies [21,22]. Thus, we should consider further to perform drug resistance testing as confirmation for its susceptibilities, when the obtained score value (SV) is less than 1.7 or the pathogen identification failed based on the results of MALDI-TOF MS.

In conclusion, reconfiguration of database of MALDI-TOF MS in house is still required. As rare Aspergillus spp. including cryptic species have potencies of various antifungal resistance, additional drug susceptibility testing should be considered in poor yields with MALDI-TOF MS analysis.

Acknowledgements: None

Conflict of Interest: None

References

  • Lin SJ, Schranz J, Teutsch SM (2001) Aspergillosis case-fatality rate: systematic review of the literature. Clin Infect Dis 32: 358-366. [crossref]
  • Herbrecht R, Denning DW, Patterson TF, Bennett JE, Greene RE, Oestmann JW, et al. (2002) Voriconazole versus amphotericin B for primary therapy of invasive aspergillosis. N Engl J Med 347:408-415.
  • Arendrup MC (2014) Update on antifungal resistance in Aspergillus and Candida. Clin Microbiol Infect 20 Suppl 6: 42-48. [crossref]
  • Snelders E, Karawajczyk A, Schaftenaar G, Verweij PE, Melchers WJ (2010) Azole resistance profile of amino acid changes in Aspergillus fumigatus CYP51A based on protein homology modeling. Antimicrob Agents Chemother 54:2425-2430.
  • Alastruey-Izquierdo A, Alcazar-Fuoli L, Cuenca-Estrella M (2014) Antifungal susceptibility profile of cryptic species of Aspergillus. Mycopathologia 178:427-433.
  • Alanio A, Beretti JL, Dauphin B, Mellado E, Quesne G, Lacroix C, et al. (2011) Matrix-assisted laser desorption ionization time-of-flight mass spectrometry for fast and accurate identification of clinically relevant Aspergillus species. Clin Microbiol Infect 17:750-755.
  • Tanaka K, Waki, H, Ido Y, Akita S, Yoshida Y, Yoshida T (1988) Protein and polymer analysis up to m/z 100000 by laser ionization time-of flight mass spectrometry. Rapid Communication in Mass Spectromeroty 2:151-153.
  • O’Donnell K, Sutton DA, Fothergill A, McCarthy D, Rinaldi MG, Brandt ME, et al. (2008) Molecular phylogenetic diversity, multilocus haplotype nomenclature, and in vitro antifungal resistance within the Fusarium solani species complex. J Clin Microbiol 46:2477-2490.
  • Glass NL, Donaldson GC (1995) Development of primer sets designed for use with the PCR to amplify conserved genes from filamentous ascomycetes. Appl Environ Microbiol 61: 1323-1330. [crossref]
  • Hong SB, Go SJ, Shin HD, Frisvad JC, Samson RA (2005) Polyphasic taxonomy of Aspergillus fumigatus and related species. Mycologia 97: 1316-1329. [crossref]
  • Tominaga M, Lee YH, Hayashi R, Suzuki Y, Yamada O, Sakamoto K, et al. (2006) Molecular analysis of an inactive aflatoxin biosynthesis gene cluster in Aspergillus oryzae RIB strains. Appl Environ Microbiol 72:484-490
  • Clinical and Laboratory Standards Institute (2008) Reference method for broth dilution antifungal susceptibility testing for filamentous fungi; approved standard. Document M38-A2. Wayne, PA: Clinical and Laboratory Standards Institute.
  • Toyotome T, Fujiwara T, Kida H, Matsumoto M, Wada T, Komatsu R (2016) Azole susceptibility in clinical and environmental isolates of Aspergillus fumigatus from eastern Hokkaido, Japan. J Infect Chemother 22:648-650.
  • European Committee on Antimicrobial Susceptibility Testing (2015) Breakpoint tables for interpretation of MICs Version.
  • Espinel-Ingroff A, Fothergill A, Fuller J, Johnson E, Pelaez T, Turnidge J (2011) Wild-type MIC distributions and epidemiological cutoff values for caspofungin and Aspergillus spp. for the CLSI broth microdilution method (M38-A2 document). Antimicrob Agents Chemother 55:2855-2859.
  • Cassagne C, Ranque S, Normand AC, Fourquet P, Thiebault S, Planard C, et al. (2011) Mould routine identification in the clinical laboratory by matrix-assisted laser desorption ionization time-of-flight mass spectrometry. PLoS One 6:e28425.
  • Lau AF, Drake SK, Calhoun LB, Henderson CM, Zelazny AM (2013) Development of a clinically comprehensive database and a simple procedure for identification of molds from solid media by matrix-assisted laser desorption ionization-time of flight mass spectrometry. J Clin Microbiol 51:828-834.
  • Marklein G, Josten M, Klanke U, Muller E, Horre R, Maier T, et al. (2009) Matrix-assisted laser desorption ionization-time of flight mass spectrometry for fast and reliable identification of clinical yeast isolates. J Clin Microbiol 47:2912-2917.
  • Rosenvinge FS, Dzajic E, Knudsen E, Malig S, Andersen LB, et al. (2013) Performance of matrix-assisted laser desorption-time of flight mass spectrometry for identification of clinical yeast isolates. Mycoses 56: 229-235. [crossref]
  • Tarumoto N, Sakai J, Kodana M, Kawamura T, Ohno H, Maesaki S (2016) Identification of Disseminated Cryptococcosis Using MALDI-TOF MS and Clinical Evaluation. Med Mycol J 57:E41-46.
  • Barrs VR, van Doorn TM, Houbraken J, Kidd SE, Martin P, et al. (2013) Aspergillus felis sp. nov., an emerging agent of invasive aspergillosis in humans, cats, and dogs. PLoS One 8: e64871. [crossref]
  • Tamiya H, Ochiai E, Kikuchi K, Yahiro M, Toyotome T, Watanabe A, et al. (2015) Secondary metabolite profiles and antifungal drug susceptibility of Aspergillus fumigatus and closely related species, Aspergillus lentulus, Aspergillus udagawae, and Aspergillus viridinutans. J Infect Chemother 21:385-39.

A Pilot Case-Cohort Study of Lung Cancer in Poultry and Control Workers: Non-Occupational Findings

DOI: 10.31038/CST.2017221

Abstract

The objective of this study was to obtain preliminary information on which non-occupational risk factors are responsible for the excess of lung cancer deaths seen in a cohort of workers in poultry slaughtering & processing plants, and to investigate whether established non-occupational risk factors for lung cancer mortality can be replicated. We conducted a pilot case-cohort study within a cohort of 43,904 poultry and non-poultry plant workers alive in 1990 and followed up to the end of 2003. Cases were 125 lung cancer deaths that occurred between 1990-2003 for whom interviews were successfully obtained. Controls (N=152) were derived from a random sample of the cohort in 1990. Statistical analysis was by logistic and Cox proportional hazards regression. The study successfully identified many of the established risk factors for lung cancer, and a few new ones were identified. The study demonstrates that valid case-cohort studies in this occupational group are feasible, and also successfully identified non-occupational risk factors that may need to be adjusted for in future planned large-scale studies of this occupational group.

Keywords

Chickens; meat; lung cancer; diet; non-occupational

Introduction

Workers in poultry slaughtering/processing plants have high exposures to oncogenic viruses that naturally infect and cause cancer in poultry. They also have exposures to chemical carcinogens at work. We initially performed three cohort mortality studies of 30,411 poultry workers and 16,405 non-poultry workers who were members of the United Food and Commercial Workers unions in the United States (N=46,816). An excess of lung cancer was consistently observed in the poultry workers [1-4]. We next conducted a pilot case-cohort study of lung cancer within a subset of 43,904 subjects of the 46,816 subjects that were alive in 1990, and followed them up to the end of 2003. The findings for occupational exposures have been published, [5] and the corresponding literature reviewed [6]. Here we present the results for non-occupational exposures. The study provides a unique opportunity for examining whether established non-occupational risk factors for lung cancer can be replicated in this group of workers who are among the lowest paid workers in industry. Also, if established risk factors for lung cancers are confirmed in this study, this will be strong evidence that future planned large full-scale studies to investigate lung cancer occurrence in this occupational group will give valid results.

Material & Methods

Cases were the first 125 lung cancer deaths out of 552 (23%) that occurred in the cohort between 1990 and 2003, for whom telephone interviews were obtained. Controls were similarly the first 152 subjects (10%) for whom telephone interviews were obtained. They originate from a random sample of 1,516 persons in the cohort that were alive in 1990. A telephone questionnaire was administered to the next-of-kin of study subjects if they were deceased (all cases, and 13% of controls) or to live control subjects themselves. Statistical analyses were conducted using both logistic regression and Cox proportional hazards regression methods as previously described [5].

Ethics: The study was approved by the University of North Texas Health Science Center’s Institutional Review Board

Results

The results are summarized in Tables 1&2.

Table 1. Poultry associated non-occupational exposures: Associations with lung cancer mortality, 1990-2003

Adjusted Logistic Regression ORs Adjusted Cox Proportional HRs
  Cases

(n=125)

Controls

(n=152)

OR (95% CI) HR (95% CI)
LIFESTYLE
Ever smoked tobacco 113 135 7.1 (2.8-18.0) 3.7 (1.8-7.4)
Mostly prepared own food 118 147 0.5 (0.2-1.1) 0.5 (0.3-0.9)
Ever drunk wine 113 146 0.4 (0.2-0.9) 0.6 (0.4-0.9)
Swam at least once a month for more than one year 115 147 0.4 (0.1-0.9) 0.5 (0.3-0.9)
Regularly performed any exercise 117 147 0.3 (0.1-0.5) 0.5 (0.3-0.7)
MEDICAL HISTORY  
Ever treated with radiation therapy 106 141 16.6 (6.8-40.8) 5.3 (3.5-8.1)
Ever treated with radiation therapy for cancer 67 21 1.6 (0.5-5.4) 1.1 (0.6-1.9)
Ever treated with radiation therapy for skin/scalp conditions 68 20 1.0 (0.1-11.9) 1.5 (0.6-3.9)
Ever treated with radiation therapy for arthritis 70 20 0.5 (0.1-1.9) 0.8 (0.4-1.5)
Tuberculosis 102 144 9.0 (0.3-304.9) 2.2 (0.9-5.4)
Cirrhosis 112 147 7.8 (0.7-82.6) 2.0 (0.8-5.0)
Pancreatic inflammation 111 146 6.2 (0.7-55.5) 1.2 (0.5-2.8)
Infectious mononucleosis 109 147 3.6 (0.3-51.5) 1.7 (0.4- 6.9)
Cold sores on lip 114 145 0.6 (0.3-1.2) 0.6 (0.4-0.9)
Diabetes 114 148 0.3 (0.1-0.8) 0.4 (0.2-0.9)
Allergic to pollen 113 145 0.2 (0.1-0.5) 0.3 (0.2-0.7)
Allergy to drug medications 110 144 0.1 (0.0-0.4) 0.2 (0.1-0.5)
FOOD CONSUMPTION
Ate beef once every two weeks for most of life 114 144 14.9 (1.8-123.0) 9.6 (1.3-69.0)
Ate bacon every week for most of life 112 141 12.1 (4.2-35.1) 5.1 (2.4-11.2)
Ate uncooked fish/shellfish every week for most of life 111 142 2.0 (0.4-10.0) 1.4 (0.5-3.8)
Ate spicy foods every week for most of life 110 142 1.7 (0.9-3.4) 1.3 (0.9-1.9)
Ate chicken once every two weeks for most of life 116 144 1.7 (0.4-7.4) 1.5 (0.6-3.6)
Ate pork once every two weeks for most of life 114 144 1.6 (0.7-3.6) 1.4 (0.8-2.4)
Ate lamb once every two weeks for most of life 115 144 1.6 0.5-5.2) 1.1 (0.6-2.2)
Ate turkey once every two weeks for most of life 115 144 1.0 (0.5-1.9) 1.0 (0.7-1.5)
Ate fruits every week for most of life 108 143 0.8 (0.3-2.0) 0.9 (0.5-1.5)
Ate freshwater fish at least once a month 115 142 0.7 (0.4-1.4) 0.8 (0.5-1.2)
Ate cheese every week for most of life 109 142 0.7 (0.3-1.7) 0.8 (0.5-1.4)
Ate raw eggs at least once every two weeks for most of life 114 143 0.6 (0.1-3.9) 0.7 (0.3-2.1)
Ate veggies every week for most of life 111 143 0.5 (0.3-1.1) 0.6 (0.2-1.7)
Ate seafood once every two weeks for most of life 111 144 0.5 (0.2-0.9) 0.7 (0.4-1.0)
Ever ingested herbal leaves, drinks, medications at least once a week for >1yr 111 140 0.3 (0.1-0.9) 0.4 (0.2-1.0)
Ever adhered to a vegetarian diet for more than a year 114 143 0.2 (0.0-3.8) 0.3 (0.0-2.1)
Method of cooking meats  
Ate meat fried at least once every two weeks for most of life 113 144 2.6 (1.0-6.6) 1.9 (1.0-3.8)
Ate meat salted at least once every two weeks for most of life 109 144 2.4 (1.2-4.8) 1.5 (1.0-2.2)
Ate meat raw at least once every two weeks for most of life 111 144 1.6 (0.2-11.3) 1.9 (0.7-5.3)
Ate meat barbequed at least once every two weeks for most of life 112 144 1.5 (0.8-2.9) 1.1 (0.7-1.6)
Ate meat smoked at least once every two weeks for most of life 110 144 1.3 (0.6-2.8) 1.0 (0.6-1.6)
DRUG USE  
Use vitamins at least every week for more than a year 103 140 0.4 (0.2-0.8) 0.6 (0.4-1.0)
Ever had general anesthesia during surgery 108 140 0.4 (0.2-0.7) 0.6 (0.4-0.9)
Ever used hormone replacement therapy continuously for at least a year 24 57 0.2 (0.0-0.8) 0.3 (0.1-0.9)
FAMILY HISTORY OF CONDITIONS  
Reported cancer in children 114 139 1.7 (0.5-6.4) 1.1 (0.6-1.9)
Reported cancer in parents 107 135 0.8 (0.4-1.6) 0.8 (0.5-1.2)
Reported cancer in spouse 113 139 0.8 (0.3-2.0) 1.1 (0.7-1.8)
IMMUNIZATIONS  
Typhoid 46 127 2.1 (0.8-5.5) 1.4 (0.7-2.7)
Pneumococcal infections 48 127 1.7 (0.6-4.3) 1.4 (0.7-2.7)
Yellow fever 41 127 1.7 (0.5-5.6) 0.9 (0.4-2.2)
Ever received gamma globulin 56 131 1.6 (0.3-8.7) 1.8 (0.6-6.0)
Measles 42 124 1.5 (0.6-3.5) 1.0 (0.5-2.0)
Small pox 64 128 1.4 (0.6-3.1) 1.0 (0.6-1.7)
Diphtheria 55 120 1.3 (0.6-3.2) 1.0 (0.5-1.8)
Mumps 43 123 1.3 (0.5-3.0) 0.9 (0.5-1.7)
OTHER  
Ever owned a cell phone 115 141 0.2 (0.1-0.4) 0.3 (0.1-0.6)

† Odds ratios (OR) were adjusted for smoking, gender, and age by the Logistic Regression Method
‡ Hazard ratios (HR) were adjusted for smoking, gender, and”> age by the Cox Proportional Hazard Method
@ For ever smoked tobacco, adjustment was for age and gender.

Table 2. Lung cancer mortality associated with frequent consumption of Beef and Bacon, adjusted for occupational exposures, meat preparation type, tobacco smoking, age, gender, and union site – (1990-2003)

                Ate a lot of Beef               Ate a lot of Bacon
  Case/control HR (95% CI) Case/control HR (95% CI)
OCCUPATIONAL EXPOSURES        
History of working in stockyard 56/99 56/98 2.7 (1.1-6.7)
Ever killed chickens at work 105/143 8.9 (1.2-64.6) 103/140 4.7 (2.1-10.3)
History of working in deli department 66/99 66/98 3.1 (1.3-7.4)
History of working in meat department 66/99 66/98 3.1 (1.3-7.1)
MEAT PREPARATION        
Ate a lot of meat raw 109/144 9.8 (1.3-71.1) 108/141 4.8 (2.2-10.5)
Ate a lot of meat fried 111/144 8.9 (1.2-64.8) 110/141 4.7 (2.1-10.3)
Ate a lot of meat BBQ 111/144 9.7 (1.3-70.4) 109/141 5.0 (2.3-10.9)
Ate a lot of meat smoked 109/144 9.5 (1.3-69.0) 109/141 5.1 (2.3-11.2)
Ate a lot of meat salted 107/144 8.5 (1.2-62.0) 106/141 4.5 (2.0-10.1)

*HR = hazard ratio; CI = confidence interval; NOTE: Questionnaire defined a lot as “once every two weeks for most of life”

Discussion

With regard to lifestyle, established associations in the literature with cigarette smoking, drinking of wine and exercise were confirmed [7-9]. The significant association with radiation exposure may be real and consistent with well-documented reports of this association [7,10]; but it is also likely that it reflects using radiation treatment for the lung cancer, since no significant associations were seen for treating other conditions with radiation. The elevated but not statistically significant risk for tuberculosis seen is consistent with the findings of a comprehensive review [11]. Protective effects were seen for history of cold sores, diabetes, and allergy to pollen and medications. These are consistent with reports of allergies being protective risk factors for the disease [12-14].

Frequent consumption of beef and bacon were significantly associated with increased lung cancer risk, and the risks persisted after adjusting for occupational exposures that were associated with increased risks [5] Table 2. The risks also persisted irrespective of whether the beef or bacon was eaten raw, fried, barbecued, smoked, or salted – Table 2. The method of preparation of any of the different meats (beef, pork, poultry, etc.) was not an independent risk factor for lung cancer (data not shown) except for salted chicken, turkey and lamb for which the hazard ratios were 1.4 (95% CI, 1.0-2.2), 1.5 (95% CI, 1.0-2.2) and 1.5 (95% CI, 1.0-2.2), respectively. These associations with beef and bacon and salted meats are well documented in the literature [7,15-18], and mere consumption of these meats seem to be the most important factor.

Risk estimates for eating of seafood, ingestion of herbal leaves, drinks or medications, adherence to vegetarian diet, vitamin intake, hormone replacement therapy, and history of diabetes and general anesthesia were all below the null. These protective associations have been previously reported [7,19-21], except for history of diabetes and general anesthesia for which we have no explanation. The results for cellphone use are likely due to systematic bias resulting from cases (all deceased) dying during earlier periods when cellphone use was not in existence or infrequent while controls most of whom were alive, lived long enough into the more recent period of popular use; moreover, this reduced risk was also seen for the other cancers (liver, pancreas, brain) investigated [22,23].

Conclusion

The findings in this study are important for three reasons: 1) in spite of its small size, the study remarkably was able to confirm many of the reported non-occupational risk factors in the literature for lung cancer in this low-income population. This indicates that future planned case-cohort studies nested within occupational cohorts of workers in poultry slaughtering and processing plants that are assembled to investigate cancer occurrence in this industry, are feasible and capable of giving valid results. Such studies can provide valuable information on both occupational and non-occupational risk factors for various cancers. Secondly, this study has successfully identified non-occupational exposures that are risk factors for lung cancer in this specific population of poultry workers. These constitute some important potential confounding factors that may need to be adjusted for when investigating the role of occupational carcinogenic exposures (especially oncogenic viruses) in the occurrence of lung cancer in poultry slaughtering & processing plant workers in future full-scale large case-cohort studies. Finally, this small study indicates that established risk factors for lung cancer are equally applicable for this group of minimum-wage workers who belong to the lowest socioeconomic group.

Acknowledgements

Our appreciation and thanks go to the United Food & Commercial Workers International Union for their continuing support and collaboration over the years without which this research would not have been possible.

Funding Source

The study was funded by a grant 1 RO1 OH008071 from the National Institute for Occupational Safety & Health.

Competing interests: None

References

  • Johnson ES, Fischman HR, Matanoski GM, Diamond E (1986) Occurrence of cancer in women in the meat industry. Br J Ind Med 43: 597-604. [crossref]
  • Johnson ES, Shorter C, Rider B, Jiles R (1997) Mortality from cancer and other diseases in poultry slaughtering/processing plants. Int J Epidemiol 26:1142-1149.
  • Netto GF, Johnson ES (2003) Mortality in Workers in Poultry Slaughtering/Processing Plants – The Missouri Poultry Cohort Study. Occup Environ Med 60:784-788.
  • Johnson ES, Ndetan H, Lo K-M (2010) Cancer Mortality in Poultry Slaughtering/Processing Plant Workers Belonging to a Union Pension Fund. Environ Res 110:588–594.
  • Felini M, Preacely N, Shah N, Christopher A, Sarda V, et al. (2012) A case-cohort study of lung cancer in poultry and control workers: occupational findings. Occup Environ Med 69: 191-197. [crossref]
  • Johnson ES, Choi KM (2012) Lung cancer risk in workers in the meat and poultry industries–a review. Zoonoses Public Health 59: 303-313. [crossref]
  • Boffetta P, Trichopoulos D (2002) Cancer of the Lung, Larynx, and Pleura, in: H.O. Adami, D. Hunter, D. Trichopoulos (Eds.), Textbook of Cancer Epidemiology, New York City NY, Oxford University Press :248-280.
  • Benedetti A, Parent ME, Siemiatycki J (2006) Consumption of alcoholic beverages and risk of lung cancer: results from two case-control studies in Montreal, Canada, Cancer Causes Control 17:469-480.
  • Chao C (2007) Associations between beer, wine, and liquor consumption and lung cancer risk: a meta-analysis. Cancer Epidemiol Biomarkers Prev 16: 2436-2447. [crossref]
  • Boice JD, Jr, Land CE, Preston DL (1996) Ionizing radiation, in: D. Schottenfeld, J.F. Fraumeni, Jr., (Eds). Cancer Epidemiology and Prevention, 2nd Edition. New York, Oxford University Press 319-354.
  • Aoki K (1993) Excess incidence of lung cancer among pulmonary tuberculosis patients. Jpn J Clin Oncol 23: 205-220. [crossref]
  • Gorlova OY, Zhang Y, Schabath MB, Lei L, Zhang Q, et al. (2006) Never smokers and lung cancer risk: a case-control study of epidemiological factors. Int J Cancer 118: 1798-1804. [crossref]
  • Schabath MB, Delclos GL, Martynowicz MM, Greisinger AJ, Lu C, et al. (2005) Opposing effects of emphysema, hay fever, and select genetic variants on lung cancer risk. Am J Epidemiol 161: 412-422. [crossref]
  • McDuffie HH, Cockcroft DW, Talebi Z, Klaassen DJ, Dosman JA (1988) Lower prevalence of positive atopic skin tests in lung cancer patients. Chest 93: 241-246. [crossref]
  • Sinha R, Kulldorff M, Curtin J, Brown CC, Alavanja MC, et al. (1998) Fried, well-done red meat and risk of lung cancer in women (United States). Cancer Causes Control 9: 621-630. [crossref]
  • Deneo-Pellegrini H, De Stefani E, Ronco A, Mendilaharsu M, et al. (1996) Meat consumption and risk of lung cancer; a case-control study from Uruguay, Lung Cancer 14:195-205.
  • Lam TK, Cross AJ, Consonni D, Randi G, Bagnardi V, et al. (2009) Intakes of red meat, processed meat, and meat mutagens increase lung cancer risk. Cancer Res 69: 932-939. [crossref]
  • Alavanja MC, Field RW, Sinha R, Brus CP, Shavers VL, et al. (2001) Lung cancer risk and red meat consumption among Iowa women. Lung Cancer 34: 37-46. [crossref]
  • Chen X, Cai L (2009) [Meta-analysis of the effects on hormone replacement therapy and oral contraceptives associated with female lung cancer risk]. Wei Sheng Yan Jiu 38: 672-676. [crossref]
  • Schwartz AG, Wenzlaff AS, Prysak GM, Murphy V, Cote ML, et al. (2007) Reproductive factors, hormone use, estrogen receptor expression and risk of non small-cell lung cancer in women. J Clin Oncol 25: 5785-5792. [crossref]
  • La Vecchia C (2006) Hormone replacement therapy in menopause and lung cancer: an update. Eur J Cancer Prev 15:283-284.
  • Felini M, Johnson E, Preacely N, Sarda V, Ndetan H, et al. (2011) A pilot case-cohort study of liver and pancreatic cancers in poultry workers. Ann Epidemiol 21: 755-766. [crossref]
  • Gandhi S, Felini MJ, Ndetan H, Cardarelli K, Jadhav S, et al. (2014) A pilot case-cohort study of brain cancer in poultry and control workers. Nutr Cancer 66: 343-350. [crossref]

Changes in Cerebral Blood Flow and Prolonged Disturbances in Cerebral Autoregulation in Critically ill Children with Diabetic Ketoacidosis

DOI: 10.31038/EDMJ.2017122

Abstract

Objective: Intracerebral complications are the most common cause of morbidity and mortality in children with diabetic ketoacidosis (DKA). Emerging evidence suggests that ischemic injury may be a factor in the development of cerebral edema. This study was designed to evaluate cerebral hemodynamics and autoregulation during DKA in critically ill children using transcranial Doppler ultrasound (TCD).

Design: Prospective observational study

Setting: Tertiary care pediatric intensive care unit (PICU)

Patients: Patients ≤18 years admitted to the PICU with moderate to severe DKA (serum glucose > 200 mg/dl, pH < 7.15, bicarbonate < 15 mmol/L, and urine ketones).

Measurements and Main Results: Within 4 hours of admission the flow velocities in the middle cerebral arteries (MCA) and basilar artery (BA) were measured using TCD. Cerebral autoregulation was evaluated using the transient hyperemic response ratio (THRR), with values ≥ 1.1 defined as normal. TCD was repeated after resolution of DKA. 26 patients were studied [median age 10 yrs (0.75-18), median initial glucose 558 (289-1018) g/dL, median initial pH 6.98 (6.78-7.13)]. Mean MCA flow velocities were unchanged when compared to previously published normal values. Mean BA flow velocities were significantly lower than these normal values during and after resolution of DKA, p = 0.001. Cerebral autoregulation during DKA was impaired in 92% of patients [median THRR on right 0.97 (0.65-1.14), left 0.98 (0.39-1.26)] and remained abnormal in 64% after resolution of DKA. Patients with clinical and imaging evidence of cerebral edema had lower BA mean flow velocities than patients without cerebral edema (p = 0.06).

Conclusions: Our data shows decreased basilar artery flow velocities and prolonged impairment of cerebral autoregulation in children with DKA. Understanding these disruptions in cerebral blood flow may lead to future therapeutic targets and should be further studied in hopes of improving neurologic outcomes in diabetic children experiencing DKA.

Keywords

diabetic ketoacidosis, blood flow velocity, cerebral blood flow, transcranial Doppler ultrasonography, cerebral edema, diabetes complications

Introduction

Cerebral edema and intracerebral complications are the most common cause of morbidity and mortality in children with diabetic ketoacidosis (DKA) [1-4]. While symptomatic cerebral edema has been reported in approximately 1% of children with DKA, recent literature suggests that subclinical cerebral edema during DKA may be a more common occurrence than previously appreciated and may occur in up to 50% of children [1-8]. In one magnetic resonance imaging (MRI) study of children with DKA, 54% of children had decreased ventricular size, which suggested the presence of subtle cerebral edema despite a lack of neurologic symptoms [7]. Additionally, long term memory deficits in children with type I diabetes mellitus (DM) are strongly associated with a past history of DKA, regardless of their overall glycemic control; this finding suggest that subtle neurological injury occurs during this critical time [9, 10].

The underlying mechanism for cerebral edema in children with DKA is unknown. Emerging evidence suggests that ischemic injury resulting from dehydration and hyperventilation due to acidosis may be an inciting factor [11-15]. Hypoperfusion and reperfusion injury with associated cerebral edema may develop as dehydration is correction and carbon dioxide levels normalize with treatment [6, 16-18]. Additionally, hyperglycemia and ketosis increase the risk of hyperemia during correction of carbon dioxide in animal studies [19]. Impaired cerebral autoregulation in other neurologic conditions such as stroke and traumatic brain injury is known to be associated with an increased risk of secondary injury and reperfusion injury [20, 21]. A transient impairment of cerebral autoregulation in DKA has been reported but overall data about changes in cerebral hemodynamics and autoregulation are limited in children with DKA [16, 22].

Understanding changes in cerebral hemodynamics during DKA and its impact upon neurologic injury may be useful to inform treatment strategies to optimize cerebral blood flow to minimize cerebral edema. Transcranial Doppler ultrasound (TCD) is a noninvasive test that can be used at the bedside to evaluate real time changes in cerebral hemodynamics and autoregulation. TCD is an established clinical tool in neurocritical care with applications that include monitoring for vasospasm after aneurysm subarachnoid hemorrhage, emboli detection during carotid endarterectomy, and screening for evidence of sickle cell vasculolopathy [23]. As a research tool, TCD has provided insight into cerebral blood flow patterns in a variety of neurological conditions such as acute ischemic stroke and traumatic brain injury.

We designed a study using TCD to evaluate blood flow patterns and changes in critically ill children with moderate to severe DKA. We hypothesized that decreased cerebral blood flow velocity and impaired autoregulation occurs early in DKA.

Materials and Methods

We performed a prospective observational study at a pediatric tertiary care center between 2011-2014. This study was approved by our institutional review board. Patients ≤ 18 years old with moderate to severe DKA admitted to our pediatric intensive care unit (ICU) were screened. Patients were eligible for the study if they had a serum glucose > 200 mg/dl, venous or capillary pH < 7.15, bicarbonate level < 15 mmol/L, and ketones in their urine. We excluded patients with previously diagnosed diseases known to alter cerebral hemodynamics (e.g. Sickle cell disease). Informed consent was obtained from the patient’s parent or guardian and assent was obtained from the patient when applicable.

Within 4 hours of admission to the intensive care unit, TCD was performed at the bedside using a 2-MHz pulsed probe and commercially available TCD ultrasonography unit (Sonara Digital TCD, Carefusion, Middleton, WI) to measure the systolic, diastolic and mean flow velocities of the middle cerebral arteries (MCA) and basilar artery (BA). Arteries were insonated at 1millimeter (mm) intervals using previously described methods [24, 25]. Cerebral autoregulation was evaluated using the transient hyperemic response ratio (THRR) bilaterally, as previously described [26-28]. A THRR < 1.1 was considered abnormal. Measurements were repeated after resolution of DKA which was defined as pH > 7.3, blood gas carbon dioxide > 35 mmHg, bicarbonate > 15 mmol/L or normalized anion gap and transition off of the insulin infusion to intermittent insulin with a regular diet.

Baseline characteristics of the patients including age, Glasgow Coma Scale (GCS), blood pH, blood glucose, bicarbonate, carbon dioxide, and neuroimaging results were recorded at the time of each study.

Treatment strategy, including choice and rate of fluids and imaging, was left to the discretion of the clinical team. The general practice within our institution utilizes an initial 10 milliliter per kilogram bolus of 0.9 normal saline followed by a two bag system with 0.9 normal saline based intravenous fluids at 1.5 to 2 times maintenance flow rate and an insulin drip of 0.1 units per kilogram per hour. The fluids are titrated to decrease blood glucose by approximately 100 mg/ dl per hour.

Statistical analysis was performed using GraphPad Prism© (La Jolla, California). Descriptive statistics were calculated for baseline characteristics. Wilcoxon matched pairs test was used for comparisons. Each patient served as their own control and blood flow velocities obtained during DKA were compared with their values after resolution of DKA and also to previously published age and gender matched normal values. Baseline demographics and blood flow velocities for patients with cerebral edema versus those without cerebral edema were compared using non-parametric t-tests.

Results

Baseline Characteristics

26 total patients were enrolled. 15 patients were female (57%). 17 patients (65%) had newly diagnosed diabetes. Baseline characteristics are displayed in Table 1. The median time from presentation to the emergency room to initial TCD study was 4.5 hours (2-6.5). Only the first study was obtained for 2 patients as they were discharged before the second TCD study was performed. Information for the first study for both of these patients was included in the data analysis.

Table 1. Baseline Patient Characteristics

Median Range
Age (Years) 10 0.75-18
Initial glucose (milligram/deciliter) 558 289-1018
Initial pH 6.98 6.78-7.13
Initial carbon dioxide  (milliequivalent/liter) 17 7-28
Initial bicarbonate

(milliequivalent/liter)

< 5 < 5 – 8
Initial serum osmolality (calculated) 313 278-368
Sodium at time of 1st study 144 134-157
Sodium at time of 2nd study 142 136-166
Initial Glasgow Coma Scale (GCS) 14 9-15

Middle cerebral artery flow velocities

No difference was found for systolic, diastolic or mean blood flow velocities for either middle cerebral artery during DKA compared to previously published age matched normal values (Figure 1). Additionally, there was no significant difference between the patients’ systolic, diastolic or mean blood flow velocities for the right or left middle cerebral artery when comparing flow during the acute phase of DKA to flow after resolution of DKA in the same patients.

EDMJ 2017-201 Fig1

Figure 1. Mean flow velocities for intracranial blood vessels during diabetic ketoacidosis: Mean flow velocities are shown here as percentage of the expected value for the patient’s age and gender. Median and interquartile ranges are displayed on the figure. No difference was found in the mean flow velocities of the right and left middle cerebral arteries during diabetic ketoacidosis compared to previously published age and gender matched normal values. Basilar artery mean flow velocity was significantly lower during DKA than expected (p = 0.001).

Basilar artery flow velocities

Basilar artery mean flow velocity was significantly lower during DKA than expected (median 47% of normal, range 33-129%, p = 0.001) and remained significantly lower than normal after resolution of DKA (p = 0.001) (Figure 2).

EDMJ 2017-201 Fig2

Figure 2. Mean flow velocities for intracranial blood vessels after resolution of diabetic ketoacidosis: Mean flow velocities are shown here as percentage of the expected value for the patient’s age and gender. Median and interquartile ranges are displayed on the figure. No difference was found in the mean flow velocities of the right and left middle cerebral arteries during diabetic ketoacidosis compared to previously published age matched normal values. Basilar artery mean flow velocity was significantly lower after resolution of DKA than expected (p = 0.001).

Cerebral autoregulation/THRR

THRR data was obtained in 24 of the 26 patients; 2 patients did not tolerate testing due to agitation. THRR was abnormal, consistent with impaired cerebral autoregulation, in 92% of patients during DKA (Figure 3a and b) and remained abnormal in 64% of patients on the second evaluation after DKA had resolved.

EDMJ 2017-201 Fig3A

EDMJ 2017-201 Fig3B

Figure 3A & 3B. Cerebral autoregulation for the middle cerebral arteries: Cerebral autoregulation was impaired during diabetic ketoacidosis in 92% patients as measured by the transient hyperemic response. A response of ≥ 1.1 is defined as normal. a) The median transient hyperemic response on the right was 0.97 (0.65-1.14) and b) on the left was 0.98 (0.39-1.26). Follow-up testing was done in all but 2 patients after resolution of DKA and cerebral autoregulation remained abnormal in 64% of the patients.

Patients with abnormal imaging

10 patients had head imaging on presentation. 6 patients had evidence of cerebral edema (CE) and 1 of these patients also had a left basal ganglia infarction. The mean basilar artery flow velocities were lower in patients with clinical and radiographic evidence of CE than patients without CE (p = 0.06). No difference was seen in the middle cerebral artery flow velocities in patients with and without CT abnormalities. Initial GCS was significantly lower in patients with CE (median 10) than patients without edema [14], p = 0.01. There was no difference in age, initial pH, glucose, bicarbonate or CO2 between patients with and without CE.

Discussion

DKA resulting in cerebral edema is a leading cause of immediate morbidity and mortality in children with diabetes mellitus. Episodes of DKA may contribute to long-term morbidity and cognitive impairment in these children with diabetes mellitus as well [2-4, 9, 10]. Changes that occur in the brain that lead to cerebral edema and long-term neurological injury after DKA are poorly understood. In order to develop strategies to minimize and prevent the neurologic sequelae of DKA, we must first understand the alterations in cerebral blood flow that occur during DKA and which changes are maladaptive. This study provides further insight into the changes in cerebral blood flow and autoregulation in critically ill children with DKA that may contribute to intracranial complications.

No difference from expected age and gender matched normal values was found in the cerebral blood flow velocities of the left and right middle cerebral artery (MCA) during DKA. This is an interesting finding as these flow velocities were within the normal range for age and gender despite acidosis and hypocapnea, which should presumably result in decreased cerebral blood flow. This may represent an adaptive response of the child to try to maintain an adequate cerebral perfusion pressure. Prior studies including TCD studies by Roberts et al reported hyperemia as early as 2 hours into treatment for DKA [16, 29, 30]. The difference in our study results versus the Roberts et al. study may be related to what was considered a normal cerebral blood flow velocity for the patient. We compared the cerebral blood flow velocities to previously published age and gender matched normal values [24, 25]. The authors of the Roberts et al. study compared the measured blood flow velocities to values that were corrected for the patient’s carbon dioxide level and reported a relative hyperemia for a given carbon dioxide level; patients in this study were assumed to have intact CO2 reactivity, which may not have been true. We also compared each patient’s cerebral flow velocities during DKA to their flow velocities after resolution DKA and found no difference between values during and after DKA. This use of each patient as their own control also suggests that patients were not significantly hyperemic during DKA. The patients with cerebral edema on neuroimaging were not any more likely to have hyperemia on their TCDs than patients without clinical or imaging evidence of cerebral edema.

Unlike the MCAs, the mean flow velocities for the basilar artery were significantly lower than expected both during and after resolution of DKA; this study is the first to report changes in the BA flow velocity in children with DKA. These lower blood flow velocities may represent a relative failure of the posterior circulation to increase cerebral blood flow to maintain a constant cerebral perfusion pressure in a hypocarbic state. These diminished flows may result in ischemia during DKA. Glaser et al. reported that in magnetic resonance imaging of children during DKA, the occipital lobes had lower apparent diffusion coefficient values during DKA than other areas of the brain and those values continued to be lower during treatment [31]. Low apparent diffusion coefficient values suggest cytotoxic edema. Furthermore, children with cerebral edema also had significantly lower basilar flow velocities than patients with DKA but without cerebral edema in this study, which suggests that these abnormalities in cerebral flow may be a key feature in the development of intracranial injury during DKA. Notably, the hippocampus, which is important in cognition and formation of memories, is supplied by the posterior circulation; thus it is possible that hypoperfusion to the hippocampus contributes to the long term cognitive and memory deficits in patients with a history of DKA.

Our findings in combination of those of Glaser et al. suggest that the posterior circulation and occipital lobe may have a unique vulnerability to initial and prolonged cerebral ischemia during DKA in children. It is unclear why only the posterior circulation showed a difference in our study but this result may be due to limited power from the small sample size. Alternatively, glucose dysregulation may preferentially affect the posterior circulation involvement since hypoglycemia is known to predominantly cause parietal-occipital lobe ischemia [32, 33]. A recent study of children with type I diabetes also found that > 50% of them had focal slowing in the bilateral posterior region on electrocephalogram at the time of diagnosis; this finding also suggests sensitivity of the posterior brain to injury with abnormalities in glucose homeostasis [34].

Cerebral autoregulation was impaired in almost all patients in this study and remained abnormal in the majority of patients after correction of lab abnormalities. In other studies, autoregulation has been found to be abnormal in patients with type II diabetes and possibly longstanding type I diabetes presumably due to chronic endothelial injury and inflammation [16]. However, this is not the most likely explanation for impaired autoregulation in this study as the majority of the patients were newly diagnosed with diabetes. Abnormal autoregulation as seen in this study is more likely an acute change related to DKA. The reasons for this are not completely clear but one explanation may be that this prolonged loss of cerebral autoregulation is due to the fact that the cerebrospinal buffering system normalizes slowly in comparison to the faster normalization of the serum bicarbonate and pH. Two prior studies have looked at cerebral autoregulation during DKA in children. The first study reported that autoregulation, based upon the autoregulatory index, was abnormal in 5 of 6 patients during DKA but that cerebral autoregulation normalized by 30 hours from presentation [16]. A follow-up study by this group reported impairment in 40% of the patients with DKA and normalization of cerebral autoregulation in the majority of patients by 36-72 hours of therapy [22]. In contrast, our study found that a prolonged abnormality in cerebral autoregulation in the majority of our patients persisted even after labs had normalized. The difference in our results from those previously published by Ma et. al. may be related to how autoregulation was evaluated. In the Ma et al study, the method used to evaluate autoregulation utilized changes in the position of the head of the bed; however, with this approach, measurements can be confounded by the fact that intracranial pressure also may be influenced by bed position. The technique utilized in our study with transient compression of the internal carotid artery does not directly influence ICP.

Under normal conditions, cerebral autoregulation allows the brain to maintain a steady cerebral blood flow despite changes in blood pressure. With loss of normal autoregulation, patients are at risk for cerebral ischemia or hyperemia with small changes in blood pressure. A recent study by Deeter at al. reported of children with DKA found that 19 of 33 patients had hypertension before treatment and 82% had hypertension within the first 6 hours of admission [35]. About a quarter of the patients had continued hypertension after discharge. This observation of increased blood pressure may represent a physiologic response of the body during DKA to try to maintain cerebral blood flow in opposition to cerebral vasoconstriction due to hypocapnea. However, if patients have vasomotor paralysis as seen in our study, then this adaptive hypertension may cause harm by resulting in hyperemia and cerebral edema. These results suggest that patients may benefit from prolonged neuroprotective strategies such as tight blood pressure control because of persistent impairment in cerebral autoregulation even after lab values normalize.

These prolonged abnormalities in cerebral blood flow in the posterior circulation and cerebral autoregulation may contribute to the subtle cerebral injury and thus the longstanding cognitive and behavioral deficits that have been reported in children with DKA [36-38]. A single episode of DKA has been shown to been associated with cognitive dysfunction in rats [39]. There also is evidence of permanent cerebral injury after DKA in children. Patients with a single episode DKA have evidence of decreased gray matter and decreased N-acetylaspartate/creatine ratios on imaging [38, 40]. Thus, these acute derangements in cerebral hemodynamics even with a single episode of DKA may have long-term implications for the children’s neurologic outcome.

This pilot study is limited primarily by the small sample size and confirmation of our findings in larger studies of children with DKA need to be performed. Future studies should evaluate whether there is a correlation in neuropsychological measures with decreased basilar flow in patients. Also, future studies should evaluate children days and weeks out from presentation of DKA to determine how long alterations in cerebral autoregulation persist after resolution of DKA.

Conclusion

Basilar artery blood flow was decreased during DKA in our study and remained low after resolution of DKA. This may contribute to ischemic injury in these patients. Our data also suggests prolonged impairment of cerebral autoregulation occurs in children during DKA and persists after correction of lab abnormalities. Future larger studies are needed to further characterize the timing and changes to cerebral hemodynamics during DKA and any association with acute and long term neurological consequences for children with type 1 DM. Understanding these disruptions in cerebral blood flow may lead to future therapeutic targets with the goal to improve morbidity and cognitive outcomes of these children.

Financial support for study: none

References

  • Bello FA, Sotos JF (1990) Cerebral oedema in diabetic ketoacidosis in children. Lancet 336: 64. [crossref]
  • Edge JA, Jakes RW, Roy Y, et al. (2006) The UK case-control study of cerebral oedema complicating diabetic ketoacidosis in children. Diabetologia 49:2002-2009
  • Lawrence SE, Cummings EA, Gaboury I, Daneman D (2005) Population-based study of incidence and risk factors for cerebral edema in pediatric diabetic ketoacidosis. J Pediatr 146: 688-692. [crossref]
  • Hanas R, Lindgren F, Lindblad B (2007) Diabetic ketoacidosis and cerebral oedema in Sweden–a 2-year paediatric population study. Diabet Med 24: 1080-1085. [crossref]
  • Edge JA, Hawkins MM, Winter DL, Dunger DB (2001) The risk and outcome of cerebral oedema developing during diabetic ketoacidosis. Arch Dis Child 85: 16-22. [crossref]
  • Figueroa RE, Hoffman WH, Momin Z, et al. (2005) Study of subclinical cerebral edema in diabetic ketoacidosis by magnetic resonance imaging T2 relaxometry and apparent diffusion coefficient maps. Endocr Res 31:345-355
  • Glaser NS, Wootton-Gorges SL, Buonocore MH, Marcin JP, Rewers A, et al. (2006) Frequency of sub-clinical cerebral edema in children with diabetic ketoacidosis. Pediatr Diabetes 7: 75-80. [crossref]
  • Muir AB, Quisling RG, Yang MC, et al. (2004) Cerebral edema in childhood diabetic ketoacidosis: natural history, radiographic findings, and early identification. Diabetes Care 27:1541-1546
  • Krane EJ, Rockoff MA, Wallman JK, Wolfsdorf JI (1985) Subclinical brain swelling in children during treatment of diabetic ketoacidosis. N Engl J Med 312: 1147-1151. [crossref]
  • Ghetti S, Lee JK, Sims CE, Demaster DM, Glaser NS (2010) Diabetic ketoacidosis and memory dysfunction in children with type 1 diabetes. J Pediatr 156: 109-114. [crossref]
  • Yuen N, Anderson SE, Glaser N, Tancredi DJ, O’Donnell ME (2008) Cerebral blood flow and cerebral edema in rats with diabetic ketoacidosis. Diabetes 57: 2588-2594. [crossref]
  • Wootton-Gorges SL, Buonocore MH, Kuppermann N, et al. (2007) Cerebral proton magnetic resonance spectroscopy in children with diabetic ketoacidosis. AJNR Am J Neuroradiol 28:895-899
  • Salem MA, Matta LF, Tantawy AA, et al. (2002) Single photon emission tomography (SPECT) study of regional cerebral blood flow in normoalbuminuric children and adolescents with type 1 diabetes. Pediatr Diabetes 3:155-162
  • Foster JR, Morrison G, Fraser DD (2011) Diabetic ketoacidosis-associated stroke in children and youth. Stroke Res Treat 2011: 219706. [crossref]
  • Duckrow RB (1995) Decreased cerebral blood flow during acute hyperglycemia. Brain Res 703: 145-150. [crossref]
  • Vavilala MS, Souter MJ, Lam AM (2005) Hyperemia and impaired cerebral autoregulation in a surgical patient with diabetic ketoacidosis. Can J Anaesth 52: 323-326. [crossref]
  • Vavilala MS, Richards TL, Roberts JS, et al. (2010) Change in blood-brain barrier permeability during pediatric diabetic ketoacidosis treatment. Pediatr Crit Care Med 11:332-338
  • Vavilala MS, Marro KI, Richards TL, et al. (2011) Change in mean transit time, apparent diffusion coefficient, and cerebral blood volume during pediatric diabetic ketoacidosis treatment. Pediatr Crit Care Med 12: e344-349
  • Glaser N, Bundros A, Anderson S, Tancredi D, Lo W, et al. (2014) Brain cell swelling during hypocapnia increases with hyperglycemia or ketosis. Pediatr Diabetes 15: 484-493. [crossref]
  • Jaeger M, Schuhmann MU, Soehle M, et al. (2006) Continuous assessment of cerebrovascular autoregulation after traumatic brain injury using brain tissue oxygen pressure reactivity. Crit Care Med 34:1783-1788
  • Lang EW, Czosnyka M, Mehdorn HM (2003) Tissue oxygen reactivity and cerebral autoregulation after severe traumatic brain injury. Crit Care Med 31: 267-271. [crossref]
  • Ma L, Roberts JS, Pihoker C, et al. (2014) Transcranial Doppler-based assessment of cerebral autoregulation in critically ill children during diabetic ketoacidosis treatment. Pediatr Crit Care Med 15:742-749
  • Sloan MA, Alexandrov AV, Tegeler CH, et al. (2004) Assessment: transcranial Doppler ultrasonography: report of the Therapeutics and Technology Assessment Subcommittee of the American Academy of Neurology. Neurology 62:1468-1481
  • Bode H, Eden A (1989) Transcranial Doppler sonography in children. J Child Neurol 4 Suppl: S68-76. [crossref]
  • Bode H, Wais U (1988) Age dependence of flow velocities in basal cerebral arteries. Arch Dis Child 63: 606-611. [crossref]
  • Aaslid R, Newell DW, Stooss R, et al. (1991) Assessment of cerebral autoregulation dynamics from simultaneous arterial and venous transcranial Doppler recordings in humans. Stroke 22:1148-1154
  • Smielewski P, Czosnyka M, Kirkpatrick P, McEroy H, Rutkowska H, et al. (1996) Assessment of cerebral autoregulation using carotid artery compression. Stroke 27: 2197-2203. [crossref]
  • Giller CA (1991) A bedside test for cerebral autoregulation using transcranial Doppler ultrasound. Acta Neurochir 108:7-14
  • Glaser NS, Tancredi DJ, Marcin JP, et al. (2013) Cerebral hyperemia measured with near infrared spectroscopy during treatment of diabetic ketoacidosis in children. J Pediatr 163:1111-1116
  • Roberts JS, Vavilala MS, Schenkman KA, et al. (2006) Cerebral hyperemia and impaired cerebral autoregulation associated with diabetic ketoacidosis in critically ill children. Crit Care Med 34:2217-2223
  • Glaser NS, Wootton-Gorges SL, Marcin JP, Buonocore MH, Dicarlo J, et al. (2004) Mechanism of cerebral edema in children with diabetic ketoacidosis. J Pediatr 145: 164-171. [crossref]
  • Tam EW, Widjaja E, Blaser SI, et al. (2008) Occipital lobe injury and cortical visual outcomes after neonatal hypoglycemia. Pediatrics 122:507-512
  • Vijay K, Agarwal A (2010) Neonatal hypoglycemia resulting in occipital cerebral injury. Pediatr Radiol 40 Suppl 1: S178. [crossref]
  • Mackay MT, Molesworth C, Northam EA, et al. (2015) Diabetic ketoacidosis and electroencephalographic changes in newly diagnosed pediatric patients. Pediatr Diabetes 17:244-248
  • Deeter KH, Roberts JS, Bradford H, et al. (2011) Hypertension despite dehydration during severe pediatric diabetic ketoacidosis. Pediatr Diabetes 12:295-301
  • Nadebaum C, Scratch SE, Northam EA, et al. (2012) Clinical utility of mental state screening as a predictor of intellectual outcomes 6 months after diagnosis of type 1 diabetes. Pediatr Diabetes 13:632-637
  • Northam EA, Anderson PJ, Jacobs R, Hughes M, Warne GL, et al. (2001) Neuropsychological profiles of children with type 1 diabetes 6 years after disease onset. Diabetes Care 24: 1541-1546. [crossref]
  • Cameron FJ, Scratch SE, Nadebaum C, et al. (2014) Neurological consequences of diabetic ketoacidosis at initial presentation of type 1 diabetes in a prospective cohort study of children. Diabetes Care 37:1554-1562
  • Glaser N, Anderson S, Leong W, Tancredi D, O’Donnell M (2012) Cognitive dysfunction associated with diabetic ketoacidosis in rats. Neurosci Lett 510: 110-114. [crossref]
  • Wootton-Gorges SL, Buonocore MH, Caltagirone RA, et al. (2010) Progressive decrease in N-acetylaspartate/Creatine ratio in a teenager with type 1 diabetes and repeated episodes of ketoacidosis without clinically apparent cerebral edema: Evidence for permanent brain injury. AJNR 31:780-781

Reaching Beyond Patient-Centered Medical Home Walls: A Mixed-Methods Evaluation of A Community Health Team Intervention

DOI: 10.31038/IMROJ.2017222

Abstract

Purpose: To evaluate the structure, processes, and outcomes of a Community Health Team (CHT) intervention for high-risk/high-cost patients of patient-centered medical homes (PCMHs).

Methods: A mixed-methods evaluation wherein survey, interview, and focus group questions were developed from validated measures, Affordable Care Act (ACA) concepts, a literature review, and intervention goals were used. CHT service documentation data was also reviewed.

Results: 334 PCMH patients were identified as high-risk/high-cost and deemed eligible for CHT services. CHTs were successful in connecting patients with diverse services, enhancing patient health self-management and improving quality of life. The CHT intervention was highly valued by patients and PCMH practice providers. The need for explicit policies and protocols, data use agreements, and centralized data warehouse and case management systems was highlighted as potential facilitators of successful CHT implementation.

Conclusion: Areas of excellence, and areas of improvement, were identified and target the CHTs’ ability to address the complex needs of high-risk/ high-cost patients through collaboration with PCMH practices and the broader medical neighborhood. As states develop CHTs to help manage care for chronically ill patients within primary care practices, PCMHs, and medical neighborhoods, we provide recommendations to guide future implementation efforts.

Introduction

In 2001, the Institute of Medicine (IOM) called for a commitment to improve the organization and delivery of healthcare in the United States (US). [1] The IOM report notes that, due to advances in medical science and technology, Americans are living longer and an increase in the incidence and prevalence of chronic conditions has emerged. Despite these changes in the public’s healthcare needs, much of the healthcare system today focuses on acute needs and rewards quantity of services delivered at the expense of higher quality care. [2] As a result, the US has fallen behind other countries in amenable mortality (being the worst of sixteen industrialized nations), [3] ranks poorly on access and safety, [4] and outspends any other nation on healthcare. [5]

A small group of healthcare utilizers consumes a majority of healthcare resources in the US. In 2013, about 1% of the US population accounted for 21% of all US health expenses, and 5% accounted for almost half of all US health expenses. [6] Often patients in that 1% or 5% bracket have complicated health regimens and multiple healthcare providers. For instance, in 2012, of the top 1% of Medicaid health care utilizers, 83% had at least three chronic conditions, and more than 60% had five or more conditions. [7]

Since its passage in March of 2010, the Patient Protection and Affordable Care Act (ACA) [9] has guided healthcare reform. The Patient-Centered Medical Home (PCMH) model for delivery of primary care and collaboration of medical office staff with a Community Health Team (CHT) are important components of healthcare transformation in the US. The CHT, particularly when in concert with the PCMH, has been discussed as holding great promise in addressing the complex needs of these high utilizing patients. [8] The CHT model was designed to provide seamless coordination of preventive health and primary health care with community services to improve patient health outcomes while reducing healthcare costs. CHTs are typically comprised of an integrated group of multidisciplinary staff to address the spectrum of medical and non-medical psychosocial needs of patients with chronic disease conditions using community-clinical linkages. [8] Despite the increasing adoption of CHTs, there is limited information describing CHTs operations or implementation challenges.

Care Transformation Collaborative-Rhode Island (CTC-RI), the oversight organization for the state’s all-payer PCMH initiative, determined that creating a CHT pilot intervention could add needed resources to PCMHs to help meet the complex, multi-faceted needs of high-risk, high-cost patients. CTC-RI received funding from health plans and Rhode Island Foundation, chose a community-based model, and contracted with two RI health care organizations to each host and manage a regional CHT to serve multiple PCMH practices. The goal of CHT services was to improve patient health and quality of life, enhance appropriate use of health care services, decrease use of inappropriate medical services such as ambulatory sensitive emergency department visits, and, ultimately, decrease costs.

This contractual arrangement and corresponding CHT pilot intervention were implemented in Fall 2014. Under this contractual arrangement, each host organization directly hired or contracted for staff, and was responsible for oversight of all CHT staff and functions. Supervisors from each CHT were responsible for their CHT program development and management. Each regional CHT coordinated with PCMH primary care practices to provide services outside of the medical offices for patients who have been identified by health plans to be high-risk and/or high-cost. CTC-RI monitored CHT performance through bi-monthly meetings that were attended by the CHT program managers, health plan representatives, and other key stakeholders. CHT operational issues were presented to this group for problem solving. CTC-RI received monthly invoices from each entity enumerating their activities.

A mixed-methods evaluation of this CHT pilot intervention commenced in Spring of 2015, covering the first year of implementation. This evaluation consisted of a literature review of CHTs and similar programs in the United States and an analysis of quantitative and qualitative data collected from CHT staff, patients served by the CHTs, and participating PCMH practice providers. A primary purpose of this evaluation was to assess the structure, processes, and outcomes of the CHT intervention to inform the consideration of future CHT expansion and implementation efforts. This paper fills a research to practice gap through the presentation of results from the analysis of quantitative and qualitative data collected for evaluation of this CHT pilot intervention.

Methods

The evaluation design consisted of both quantitative and qualitative methods in order to benefit from data using multiple means of inquiry. The Memorial Hospital of RI Institutional Review Board reviewed and approved this study.

Quantitative methods

Service documentation

Prior to commencement of evaluation efforts, CHT administrators and staff documented team outreach and service provision efforts. These data were provided to the authors to better understand the structure, processes, and outcomes of the CHT intervention.

Survey instruments

Drawing from existing surveys, the literature, and our knowledge of the CHT program goals, we created surveys for CHT patients, CHT administrators and staff, and practice staff. Survey items were adapted from validated [10] [11] [12]. Additional items not previously validated were included to address factors unique to the CHT service, and to reflect ACA recommendations for CHT interventions. Subscale scores were created by averaging responses to survey items in a manner consistent with the validated measures [10].

Data management and analysis

Participant consent and survey data were collected and managed using REDCap (Research Electronic Data Capture) electronic data capture tools hosted in the Department of Biostatistics Center for Statistical Sciences of Brown University. Descriptive statistics were analyzed for patient demographics, CHT outreach and service provision efforts, and survey responses. A repeated-measures Analysis of Variance (ANOVA) was conducted to assess differences in survey subscale scores between patients, CHT staff, and practices, while addressing within-participant variability.

Qualitative methods

Instrument development

Qualitative, open-ended question guides were developed for interviews with patients, CHT staff, and NCMs at the participating practices. Interview guides were informed by a literature review targeting the processes identified in other CHT-like programs, and discussions about goals of this CHT intervention with CTC-RI directors, CHT staff, and CHT planning committee meetings.

Data collection

All participants in qualitative interviews and group discussions provided written informed consent. Interviews and group discussions were digitally audio recorded and transcribed verbatim. The evaluation team (MS, MC, RG) attended and facilitated group discussions with each CHT, and two authors (MC, RG) conducted the interviews. A contact referral form was offered to patients currently being seen by the CHT staff. Patients who were interested in participating in an interview provided their name, telephone number and address which were given to the interviewers who then called the patients to schedule an interview. Patients were offered their location of choice for the interview and most of the interviews occurred in patients’ homes.

Analysis of qualitative data

Qualitative data were analyzed using traditional qualitative analysis processes that have, in recent years, been labeled “immersion/ crystallization.” [13] This process entailed individually listening to the audio recordings, reading the transcripts, and taking analytic notes throughout the process followed by group discussion among the authors to explore divergent interpretations and to arrive at final presentation of the findings.

Comparing best practices

We used emerging best practices described by the 2013 Commonwealth Fund Brief, Care Management for Medicaid Enrollees through Community Health Teams [14] to provide a framework for our qualitative findings and recommendations (Table 4).

Results

Quantitative findings

Of 886 patients initially identified by health plans as high-risk/ high-cost, 334 patients were deemed eligible for, and received, CHT services. Across both CHTs, the majority of patients were female, and between the ages of 45 and 64 years. Across both CHTs, the majority of activities the CHT staff engaged in per patient were case management. At the time of evaluation, 152 patients were actively participating in the CHT intervention. Patient recruitment and characteristics by CHT is presented in Table 1. CHT activity by activity category and team is presented in Table 2.

Table 1. Patient recruitment and characteristics, by team.

North South Total
Patient Recruitment Total Patients 481 405 886
Active 67 85 152
Declined 150 75 225
Discharged 93 89 182
In outreach 13 29 42
Ineligible 43 37 80
Not appropriate 44 25 69
Pre-outreach 5 20 25
Unable to contact 61 45 106
Gender Female 111 101 212
Male 49 73 122
Age < 30 18 16 34
30-44 41 18 59
45-64 81 65 146
65-85 16 33 49
86+ 4 12 16

Table 2. CHT activity by activity category and team.

Activity (Counts) North South Total
Care Coordination:

Communication with external entity regarding patient care.

Total 1047 1195 2242
Mean 6.84 10.89
Std. Dev 12.14 8.26
Minimum 1 3
Maximum 103 70
Case Management:

Work directly with/for the patient.

Total 2067 3600 5667
Mean 6.58 25.17
Std. Dev 13.18 26.07
Minimum 1 2
Maximum 163 153
Case Review:

Review, usually with PCMH Nurse Care Managers or Primary Care Provider, covering multiple patients.

Total 59 566 625
Mean 1.23 3.8
Std. Dev 0.47 2.64
Minimum 1 1
Maximum 3 18
Data reflect total counts across all patients, and descriptive statistics per patient.

A sample of patients served by CHTs (n = 22), and all staff from the two CHTs (n = 8) completed surveys to assess their perceptions of the structure, processes, and outcomes of the CHT intervention. Survey response options ranged from 0-4, with greater scores indicating stronger agreement. Response options were identical between participants. Four subscales were created by averaging responses to survey items to reflect Access, Service, Respect, and Outcomes. These subscales are consistent with the Vermont 2013 Mental Health Consumer Satisfaction Survey [10].

A repeated-measures ANOVA was conducted to assess differences in survey subscale scores between patients and CHT staff, while addressing within-participant variability. Subscale means are presented in the results that follow and are displayed in Figure 1. Results suggest average ratings of agreement were significantly greater on the Access (x = 3.53, F(1, 27) = 48.75, p < .001), Service (x = 3.51, F(1, 27) = 49.63, p < .001), and Respect (x = 3.46, F(1, 27) = 39.50, p < .001) subscales when compared to the Outcomes (x = 2.80) subscale. Ratings did not differ between patients and CHT staff (F(3, 81) = 1.150, p = .334).

Figure 1. Subscale scores for patients and CHT staff

Figure 1. Subscale scores for patients and CHT staff

Twenty-one clinicians from 9 PCMH practices completed the survey to assess their perception of the structure, processes, and outcomes of the CHT intervention. Survey response options ranged from 0-4, with greater scores indicating stronger agreement. Response options were identical to those used on the patient and CHT staff survey. The same Outcomes subscale that was used for patients and CHT staff surveys was included in the practice survey.

Results from a repeated-measures ANOVA indicate significant differences in survey item scores (F(49,539) = 3.487, p < .001). Generally speaking, practice survey participants “agreed” with survey items (x =2.94 on 0-4 scale). However, there were 14 survey items for which the practice survey participants rated significantly greater, and/or significantly less than average. Similar to what was found with patients and CHT staff survey results, the Outcomes subscale score was less than other items, though not a statistically significant difference.

Qualitative findings: Patient interviews

We conducted 27 in-person patient interviews—12 served by one CHT in the north of the state and living in urban areas, and 15 served by the CHT in the south of the state living in suburban or rural areas. The majority (56%) of patients interviewed were male, between 46-55 years old (41%), non-Hispanic white (70%), with less than 12th grade education (37%).

Referral for CHT services. The referral process was not clearly evident to patients. Most did not know how they were referred for CHT services, though some knew the referral came from a provider at the PCMH. As one patient noted, “[The NCM] was trying to get me help that I needed.” However, another asserted, “I don’t know. It certainly wasn’t my doctor. My doctor is too overwhelmed to. . .”

Differentiating among sources of services. Patients who received psychosocial services from the CHT as well as from other entities (e.g. health plan case worker; visiting nurse) were confused about the etiology of the services, and whether these services interconnected. While no patient complained about being contacted by too many social service workers, they noted redundancy in service offerings, and appreciated communication between the service providers.

“So I have to make sure the information they have is right. Especially if they’re going to give me more meds they need to know the current meds I have. So a lot of problems I’ve have, with [the CRS] being in touch with some of the other people who work at the hospital as well as my visiting nurses . . . it really helps if they talk all the time and then advise me the next step.”

Services patients received directly from the CHT or with help from the CHT. Patients described commonly delivered services falling into two categories – services provided directly by the CHT, and services that the CHT helped the patients obtain. See Table 3 for details regarding these services.

Table 3. Services provided directly by the CHTs.

Services provided directly by the CHTs Services that CHTs helped patients to acquire.
Explanations of many types of benefits Whatever was needed, as evidenced by the following:
Completion of paperwork for applications and benefits, including the following: “Pointing me in the right direction for just everything. I mean, supplies and just food and financial and just whatever I would need was amazing to me. Like if they didn’t know somebody, they knew somebody that knew somebody.”

“I pleaded with the electric company. ‘My mom will die without her oxygen. What am I supposed to do?’ And they’re like, ‘Not our problem.’ So I called [CHT staff]. I was basically panicking. And she was like, ‘Nope, just let me handle it.’ And she just called them, and twenty minutes later the guy was right back—turned it right back on.”

Housing

Health insurance

Financial

Social security

‘Welfare’

‘Food stamps’

Long-term disability

Medication assistance

Coaching to deal with medical system and speak to providers, as evidenced by the following:
“Without [CHT], I wouldn’t have been as extroverted in being able to just speak out and say, ‘Hey listen, I’m having a problem with not knowing this information.” Psychological and substance use counseling, as evidenced by the following:
“[CHT staff] just called all kinds of therapists until she could find one that had an opening that would take me because they’re all, ‘Oh we’re not taking new clients.’”
Home contact following emergency department visit or hospitalization
Emergency department avoidance strategies Food
Information from clinicians Clothing
Food Furniture
Clothing Appropriate medical and mobility equipment
Blankets Nutrition information
Individual and marital counseling Adult day care
Encouragement to ask for help, as evidenced by the following: Parenting classes
“You sort of get old, and you don’t realize you’re there already and all these things are available to you. I’ve never in my life asked for help from anybody.”

“An my right knee still buckled up from under me a lot. So she said, ‘I don’t like that; you need a CNA in here. Do you have one?’ I says, ‘No, I don’t. I’m trying to do everything myself.’”

At home CNA services
Legal representation
Affordable medication
Safer and/or cleaner housing
Transportation
Medical information
Medical appointments
Moral support and anxiety reduction through the following: Benefits
Home visits

Phone calls

Preparing patients for medical visits

Accompanying patients at medical and legal appointments.

Resources for family members
Utilities payment assistance

Patients’ attitudes towards interacting with the CHT staff. All patients were pleased with their interactions with the CHT staff. They found staff to be “pleasant”, “friendly”, “helpful”, “motivated”, “energetic”, and to go to great lengths to locate and secure the resources that the patients needed. Many described the CHT staff to be informative, providing guidance without being too “directive” or “pushy”. Along with logistical help with critical problems that patients received from the CHT staff, patients placed high value on the moral support they experienced from interacting with CHT staff. All patients felt they could call upon the staff whenever they felt it to be necessary. In addition to the concrete provision and referral for services, CHT staff filled a gap in many patients’ lives in terms of having someone who will listen to them and who cares about them. This was evident even for patients who described having good relationships with nearby family members who also helped them. Patients stated, “She [CHT staff person] cares about me;” “It helps me feel a little secure and stuff like that because I know [CHT staff person] is right there to help me if I need help.” “They give me some new point of view too. That’s important. I didn’t think of that – my problems are not unique which we all think they are.” “She’ll come out. She’ll sit here. She’ll talk to me. We laugh together and everything.”

“The best thing is to still know that somebody would listen to you, and that you’re not alone, that even though . . . no one cares about what you’re going through, but then all of a sudden [CHT staff] walk in the door asking you how you are, asking you ‘What can we do to help you because you’re not happy?’ And to have them appear at your doorstep is just something to show that there’s somebody out there that still cares, that’s willing to help you. And if they can’t help you they’re going to find somebody that will.”

Qualitative findings: CHT staff and PCMH practice nurse care managers (NCMs)

Each CHT participated in focus groups at the beginning and end of the evaluation. From the two CHTs combined, data were collected from 8 non-manager staff, 1 data analyst, 1 CHT manager, and 1 CHT consultant manager. We also conducted individual qualitative interviews with 4 NCMs working at PCMH practices participating in the CHT pilot intervention. These qualitative findings are outlined using practices described in the 2013 Commonwealth Fund Brief, Care Management for Medicaid Enrollees through Community Health Teams [14] as a structure. Table 4 provides a summary of these findings.

Table 4. CHT pilot intervention features as outlined according to the 2013 Commonwealth Fund Brief, Care Management for Medicaid Enrollees through Community Health Teams.

Feature Description CHTs
Multidisciplinary teams ·         Coordinate services

·         Promote self-management

·         Help manage medications

·         Teams have community resource specialists and behavioral health staff. Many CHTs nationally include a broader range of staff, e.g., health educators, dieticians, pharmacists.

·         CRS promote self-management as indicated by care plan goals.

·         Teams coordinate services to the extent they are able. CHT staff may not know if other care managers or other agencies are working with patients. There are no or ad hoc processes to determine who takes the lead or for sharing responsibilities.

·         CHTs do medication reconciliation, e.g., review medications on hand with medication lists. They help patients obtain prescriptions.

Sustained continuous relationships with patients ·         Team staff establish and cultivate relationships through regular face-to-face contact ·         Both CHTs focus on face-to-face contact. However, if the primary service is getting patients linked to services, contact is more likely to be telephonic.

·         Patients can be unclear as to the frequency of CHT contact (in person or telephonic).

Communication mechanisms ·         Mechanisms are in place to routinely send and receive information about patients ·         Mechanisms are in place (inconsistent access to the patient record, phone, email, in person), but they do not represent best practices. In part, this is due to lack of data sharing agreements, and largely due to lack of a centralized data infrastructure. The CHTs do the best they can with the resources they have.
Whole-person care ·         When patients are identified as high-risk, high-need, or high-cost ·         CHTs focus on high-risk, high-cost patients, but practices may want to refer just high need. Payer algorithms are not consistent.

·         The CHT assessment process identifies patient needs in order to provide whole-person care. Providing whole-person care is a CHT strength and best practice.

Transitions in care ·         Focus on transitions in care, especially between hospital and home ·         CHTs currently do not have an alert system for notification when a patient in the hospital or ED. This limits their ability to focus on transitions.
Connection to community resources ·         Team members routinely connect patients with relevant community-based resources ·         This is an area of strength and high performance
Enhanced reimbursement ·         Enhanced reimbursement for primary care teams that collaborate with teams ·         Not addressed
Team functions and composition ·         Care coordination and management services ·         The CHTs provide care management services. They are less likely to provide care coordination services between health care providers.

·         CHTs help patients make appointments, and attend appointments with patients as needed. However, this is a supportive role rather than a coordination role.

Multidisciplinary teams coordinate services, promote patient self-management and help patients manage medications. CHT staffing totaled 7.5 FTEs and included team managers/coordinators, community resource specialists (CRS), behavioral health staff that included a behavioral health nurse and a licensed clinical social worker, and a data analyst. CHTs stated the primary care physician and nurse care manager (NCM) oversee and coordinate the patient’s healthcare. NCMs reported believing it was their responsibility to provide health education to encourage patient self-management, and indicate such in the patient’s care plan. The CHTs described efforts to support this patient health self-management. CHTs stated they reconciled medication by ensuring medications in the home match the patient’s health record medication list. As needed, CHTs also helped patients to obtain prescriptions. Respondents also noted the CHT behavioral health staff was crucial in helping patients locate and receive appropriate behavioral health services. In turn, the receipt of behavioral health services helped patients become more capable of addressing their health issues.

“Well one thing that might be helpful is now that we’ve done it for a while…the specific roles…to outline those specifically because when we first started it was kind of a generalized concept. But to have the specific role such as the social worker can do this, this and this; the community outreach worker can do this, this and this. These are their resources. These are services that they can offer your patients at no cost to theyou know, those kinds of things. It was generalized for us, but it wasn’t in detail.”

CHTs and NCMs expressed confusion about roles and responsibilities. Some NCMs stated it would be helpful to have roles and responsibilities clearly defined through written materials.

Sustained continuous relationships with patients. CHTs noted the assessment and care planning process formed the basis for developing long-term relationships with patients. CHT CRS and/or the Behavioral Health staff stated having initial face-to-face contact with patients who agreed to participate in the CHT service. Although CHTs developed a care plan and goals with the patient at initial meeting, they described completing follow-up assessments for only a minority of patients. Once care plan goals were met, CHTs reported calling patients periodically for follow-up. CHTs reported most ongoing contact with the patient occurred through encouraging patients to call.

Communication mechanisms are in place to routinely send and receive information about patients. CHTs noted regular communication with NCMs by phone, email, monthly meetings, and notes in the patient record (where permitted) to understand the patient’s needs, to provide updates, and to address crises that arise. Additionally, CHTs regularly held clinical team meetings with the NCMs and other practice staff to discuss patient progress and readiness for discharge. CHTs claimed NCM buy-in was crucial for effectively working with the practice. One NCM described a successful collaborative effort to help a patient avoid an emergency department visit:

“That CHT person was checking in. And [the patient] had multiple clinical issues that she thinks she should go to the ER for. And [the CHT] communicated with us again. They said, ‘Well, this is what’s happening now.’ And so we were able to bring her in [to the clinic]. So kind of like a back and forth we’re working here to advocate for [patients] with the clinic, but they’re out there in the field, and they can see what’s going on in the home. And that communication piece is pretty crucial with keeping [patients] out of the hospital.”

CHTs asserted a barrier to communication was the lack of appropriate authorization allowing the sharing of patient protected health information (PHI). As a result, the CHTs could not receive or discuss patient PHI directly with the health plans. Additionally, CHT staff could not access patients’ electronic health records. CHTs described this as problematic for getting patient contact information, understanding the scope of the patient’s health problems, and in communicating with practices. Business associate agreements were later established in 2016 to authorize the sharing of patient PHI.

CHTs provide whole-person care when patients are identified as high-risk, high-need, or high-cost. All respondents described this is an area of strength for the CHT pilot intervention. One NCM stated, “somebody in healthcare taking the time to listen, to hear and to help that patient set their own agenda as opposed to agenda that the physician or even myself might have.” However, there were varying definitions for what constituted high-risk, high-need, or high-cost. Since practices work with multiple payers, and payers used different patient identification algorithms, there was some confusion about what constituted a high-risk, high-cost patient. NCMs at times referred patients with immediate needs, such as referral for food stamps, rather than patients who met the CHT program guidelines. Some respondents hoped practices could make referrals, rather than using health plan generated high-risk lists. These respondents reported believing doing so could prevent patients from becoming high-risk/high-cost.

There is a focus on transitions in care, especially between hospital and home. CHTs reported relying on NCMs, or the patient, for notification regarding a patient’s pending, current, or recent past hospitalization or emergency department use. Upon receiving notification, CHT staff worked with the patient to ensure s/he understood the discharge care plan, and helped arrange for needed services. CTC-RI implemented a formal alert system in 2016.

Team members routinely connect patients with relevant community-based services. All respondents stated this is an area of strength and high performance. NCMs reported CHTs were skilled at ferreting out resources, though both CHTs described difficulty with referrals due to a lack of affordable housing, reliable transportation systems, and limited detox beds and/or sober housing placements. The CHT behavioral health staff was described as crucial in helping patients locate and receive appropriate mental health or substance use disorder services. Respondents noted as patients’ behavioral health needs stabilized, patients became more capable of addressing their health issues.

“I would say that certainly some of our users [patients] have behavioral health issues. And the direct interaction with the CHT has been the impact. Some of those patients have gotten the behavioral health interventions that they needed—counseling, hospitalization, medications. So without the CHT we were, I personally was, failing at addressing the needs of these patients. I could not do it.”

However, CHTs reported needing more in-home behavioral health resources, particularly for remote portions of the state or for homebound patients.

CHTs provide care coordination and care management services. CHT staff noted it was sometimes difficult to facilitate coordination since state and local agencies often did not know about the CHT service. CHTs reported this difficulty often resulted in service redundancy and confusion for the patient.

Discussion

Survey results suggest that patients and CHTs feel that patients have access to CHT services, the CHT intervention is helpful, and patients are treated with respect. While ratings on the Outcomes subscale were generally strong, patients and CHTs did not feel as strongly that the CHT pilot intervention resulted in improvements in physical/mental health, symptom distress, or functioning. PCMH practice providers similarly rated the Outcomes subscale items less than other items, though this was not a statistically significant difference.

Results from patient interviews indicated patients are universally satisfied with their interactions with the CHTs, and with the services CHTs provide for them. The scope of services that CHTs help patients with is broad, addressing a variety of psychosocial needs. Satisfaction was also often linked to CHT’s presence for listening to patient problems, providing support, and discussing a myriad of issues that directly impact patients’ health, emotional stability and quality of life.

Focus groups and interviews with CHT staff and PCMH practice NCMs highlighted the CHT pilot intervention’s positive impact on patients by helping to stabilize their physical/mental health, psychosocial needs, and access their relevant entitlements such as disability benefits or food stamps. Some also noted a reduction in inappropriate healthcare use. We found many areas of excellence, including the quality of CHT and NCM relationships, CHT’s ability to address patients’ multiple challenges, and the case review process. Structural and procedural targets for improvement include the need for clear policies and protocols, data use agreements, a data warehouse or repository, and a centralized case management system. There also appears to be opportunities to consider leveraging the motivation, skills and enthusiasm of the CHT staff and expand CRS’ responsibilities.

A primary purpose of this evaluation was to assess the structure, processes, and outcomes of the CHT intervention to inform the consideration of future CHT expansion and implementation efforts. As states to develop CHTs to help manage care for chronically ill patients within primary care practices, it is worthwhile to consider lessons learned from this CHT pilot intervention to guide future local and national implementation efforts. See Appendix 1 for lessons learned and recommendations for CHT program design based upon this evaluation of the pilot CHT intervention with regard to CHT structure, patient identification and selection for CHT services, CHT functioning, and collaboration between the CHT, PCMH primary care practices, and health plans.

Conclusion

The CHT pilot intervention has achieved numerous successes and overcome a variety of obstacles since its inception. Considering lessons learned from this pilot will allow the design of an expanded CHT intervention that effectively leverages CHT staff members’ skills, experience, and commitment to achieve improved patient health and experience at reduced cost.

Appendix

Recommendations for Community Health Team
Program Design and Implementation

Below we discuss lessons learned and recommendations for CHT program design based upon this evaluation of the pilot CHT intervention with regard to CHT structure, patient identification and selection for CHT services, CHT functioning, and collaboration between the CHT, PCMH primary care practices, and health plans.

CHT structure

Findings from this evaluation identified confusion experienced by CHTs, PCMH practice providers, and patients regarding the roles and responsibilities of the CHT program. Participants stated it would be helpful to have roles and responsibilities clearly defined through written materials. As a result, we recommend clearly detailed roles and responsibilities be established and disseminated prior to implementation. Specifically, we recommend universal, detailed, transparent policies and procedures for all aspects of the oversight entity’s and CHTs’ workflow and functioning, and that these policies and procedures be communicated to all relevant stakeholders prior to implementation of CHT services. Additionally, we recommend the creation of CHT services and outreach documentation procedures and categories for use across multiple CHTs. This process has been started in this pilot; we suggest building upon previous work to create a systematic approach to be used consistently across CHTs.

Best practices from successful care management programs call for establishment of a central program office to coordinate activities, monitor progress, and help stakeholders reach their goals. While this pilot rolled out with a focus on regional development to meet regional needs, it is recommended that centralized coordination be reinforced, and a staff person dedicated to this role would be identified.

To facilitate consistency across CHTs, centralized coordination, as well as enhanced communication between appropriate stakeholders, we also suggest the establishment of a centralized data warehouse or data repository, a single electronic care management system to be utilized across CHTs, as well as the establishment of business associate agreements to authorize the sharing of patient PHI. The absence of these features was discussed by many evaluation participants as a significant barrier to effectively providing coordinated care for CHT patients. Inconsistent access to the patient record served as a barrier to routinely sending and receiving information about patients, and a barrier to facilitating transitions in case especially between the hospital and home.

With regard to the development of CHTs, this pilot intervention evaluation highlighted the appreciation for behavioral health staff in addressing the many mental health needs of their patients. Many CHTs nationally include a broader range of staff that include health educators, dieticians, pharmacists, etc. The inclusion of staff members on CHTs from a variety of disciplines can enhance the CHTs reach to better address the needs of their patients.

Patient identification and selection for CHT services

For this CHT pilot intervention, CHTs and PCMH practices worked with multiple payers. Each payer used a different algorithm for identifying high-risk, high-cost, patients. At times, PCMH practice providers referred patients to the CHT program with immediate needs, rather than adhering to the payers’ high-risk, high-cost, lists of patients. Evaluation participants hoped PCMH practices could make referrals to the CHT program in prevent patients from becoming high-risk/high-cost. As a result, we recommend a standardized identification of eligible, appropriate, and impactable patients for CHT services, with mechanisms for practice NCMs and other providers to be integral to the referral process.

CHT functioning

To limit confusion patients’ confusion regarding the CHT program’s roles and responsibilities, several recommendations emerged from evaluation participants. These recommendations include enhanced efforts to increase patients’ understanding of the role of the CHT and care planning through repeated conversations about available and appropriate CHT services, and to communicate to patients how contact will be maintained with the CHT at each stage of service. Additionally, enhanced coordination between CHTs and other sources of case management provided to patients by different stakeholder organizations is recommended to reduce redundancy in services, and better define responsibilities of each source of service to the patient.

In this CHT pilot intervention, CHTs reported having developed care plans and goals with patients at an initial meeting, but only completing follow-up assessments for a minority of patients. Typically, once care plan goals were met, minimal communication continued between CHT staff and patients. As a result, we recommend the institution of a protocol for follow-up with patients after initial critical issues are addressed. This can better ensure ongoing recognition of patients’ conditions over time.

Participants in this CHT pilot intervention evaluation also expressed a desire to enhance communication and collaboration between CHT teams. They reported beliefs that CHTs have much to learn from each other, and having a format such as all-staff CHT meetings could facilitate the sharing of best practices, as well as the identification and resolving of issues common to all teams. Additionally, having a forum in place for all CHT staff members across teams to attend can also facilitate the creation, maintenance, and sharing of geographic and language-specific community resource lists.

Collaboration between the CHT, PCMH primary care practices, and health plans

Results from this evaluation highlighted the importance of ongoing collaboration between PCMH practice NCMs and CHTs. Strong relationships were reported to contribute successful coordination and delivery of care. As such, we recommend the establishment of explicit mechanisms to ensure optimal ongoing communication between CHTs and NCMs and other providers in participating practices. Similarly, we recommend the establishment of a forum for CHTs to regularly communicate patient successes back to the practices.

Results from this evaluation also highlighted the importance of ongoing communication between CHTs and the health plans. Insurers need to know which beneficiaries are receiving CHT services, and CHTs need access to patient PHI. Appropriate authorizations allowing the sharing of patient PHI between the CHTs and the health plans were not in place during this evaluation, but established later in 2016. Quarterly reports to health plans on CHT performance have also been planned to enhance communication. We recommend ensuring that these authorizations are established prior to implementation.

References

  • Committee on Quality of Health Care in America, Institute of Medicine (2001) Crossing the quality chasm: A new health system for the 21st century, Washington, DC: National Academy Press.
  • Bitton A, Martin C, Landon B (2010) A nationwide survey of patient centered medical home demonstration projects. Journal of General Internal Medicine 25:584-592.
  • Nolte E, McKee M (2011) Variations in amenable mortality–trends in 16 high-income nations. Health Policy 103: 47-52. [crossref]
  • Barr MS (2008) The need to test the patient-centered medical home. Journal of the American Medical Association 300: 834-835.
  • Findley S, Matos S, Hicks A, et al. (2014) Community health worker integration into the health care team accomplishes the triple aim in a patient-centered medical home: A Bronx tale, Journal of Ambulatory Care Management 37: 82-91.
  • Cohen S (2013) Differentials in the concentration of health expenditures across population subgroups in the U.S., 2013. Statistical Brief #480. September 2015, Agency for Healthcare Quality and Research: Rockville,
  • Cohen S (2014) Differentials in the concentration of health expenditures across population subgroups in the U.S., 2012. Statistical Brief #448, in Rockville, MD. September 2014: Agency for Healthcare Quality and Research.
  • Losby JL, House MJ, Osuji T, et al. (2015). Initiatives to enhance primary care delivery: two examples from the field. Health Services Research and Managerial Epidemiology, 2, Patient Protection and Affordable Care Act, 42 U.S.C. § 18001 et seq.
  • Harrigan E, Leno SM (2014) Consumer evaluation of community rehabilitation and treatment programs in Vermont: FY2013, Technical Report. Vermont Agency of Human Services Department of Mental Health Research and Statistics
  • Lesselroth BL, Holahan PJ, Adams K, et al. (2011) Primary care provider perceptions and use of a novel medication reconciliation technology. Informatics in Primary Care 19: 105-118.
  • Torrence ND, Mueller AE, Ilem AA, et al. (2014) Medical provider attitudes about behavioral health consultants in integrated primary care: A preliminary study. Families, Systems, and Health 32: 426-432.
  • Borkan J (1999) Immersion/Crystallization. In Crabtree B, Miller W (eds). Doing Qualitative Research, 2nd Edition 179-194. Thousand Oaks, CA: SAGE Publications.
  • class=”h3 Orange”>Takach, M and Buxbaum J (2013) Care management for Medicaid enrollees through community health teams. 2013, The Commonwealth Fund: Washington, DC.

Activation of STAT3 and its impacts on Proteasome Inhibitor-Induced Apoptosis in Laryngeal Sqaumous Carcinoma

DOI: 10.31038/CST.2017215

Abstract

Laryngeal squamous carcinoma (LSC) represents one of the refractory malignant tumors of head and neck squamous cell carcinoma (HNSCC), leading to high patient mortality and unsatisfactory overall 5-year survival. New therapeutic targets and modalities for effective chemoprevention and treatment are required to improve the survival of patients with LSC. Evidence from previous studies has suggested that proteasome inhibitors (PIs) possess effective antitumor activity and have been approved by the United States Food and Drug Administration (FDA) to treat myeloma. However, resistance of myeloma to PIs has been reported, which prevents PIs from their clinical uses in cancer treatment. So far, the underlying mechanisms of tumor cells anti-PIs effects remain unclear. In the present study, we found that constitutive activation of signal transducer and activator of transcription 3 (STAT3) was associated with clinicopathlologic factors in LSC patients, and persistent activation of STAT3 was found in Hep-2 laryngeal carcinoma cells. Moreover, we demonstrated that proteasome inhibitor MG-132 induces apoptosis and cell cycle arrest in Hep-2 cells, accompanied by increased activation of STAT3; knockdown of STAT3 expression by shRNA or application of STAT3 inhibitor AG490 potentiates the antitumor effects of MG-132 in vitro, which is attributed to the down-regulation of cyclin D1 and Bcl-2. Taken together, we identified that STAT3 activation plays a great role in therapeutic resistance to PIs in LSC; blocking STAT3 activation could potentiate the tumor killing effects of PIs in LSC or other malignancies involving STAT3 activation. Combined application of PIs and STAT3 inhibitor may implicate a promising strategy for managing LSC or even other HNSCC.

Keywords

Signal transducer and activator of transcription 3, STAT3; proteasome inhibitor; STAT3 inhibitor; laryngeal carcinoma; apoptosis

Introduction

Laryngeal squamous carcinoma (LSC) is a kind of head and neck squamous cell carcinoma (HNSCC), the latter of which ranks the sixth most common malignant cancer, and accounts for 35,00000 newly diagnosed cases annually worldwide [1]. Despite of successive advancement in diagnosis and treatment, the overall survival of HNSCC has just been slightly improved in recent years. In addition to distant metastasis and relapse, resistance to traditional therapeutic modalities has been the dominant cause of treatment failure, especially in advanced cases. For combating the therapeutic resistance of cancers, some novel concepts and strategies for targeted therapies have been introduced, most of which mainly focused on some key modulators of cell proliferation and apoptosis pathways. Although some preliminary results have been achieved, they are not as effective as expected.

Signal transducer and activator of transcription 3 (STAT3), a member of STAT family, is a focus of many oncogenic receptor tyrosine kinase pathways, such as EGFR, IL-6/JAK and Src [2]. It has been demonstrated that STAT3 can induce up-regulation of prosurvival proteins including Bcl-2, Bcl-xL, survivin and Mcl-1, and promote expression of angiogenesis factors, such as VEGF [3]. In fact, STAT3 is constitutively activated in many tumors [4-7] and plays a great role in proliferation, cell cycle progression and apoptosis of tumor cells [8]. In addition, activation of STAT3 is also associated with chemoresistance in many malignancies [9, 10]. Results from our previous study demonstrate that knockdown of STAT3 with specific shRNA can enhance radiosensitivity in LSC Hep-2 cells both in vitro and in vivo [11, 12]. Therefore, targeting STAT3 is a potential therapeutic strategy for LSC.

As is known, due to rapid proliferation and insufficient blood supplies, the microenvironments of most solid cancers are accompanied by hypoxia, glucose starvation and low PH, leading to endoplasmic reticulum (ER) stress due to causal accumulations of incorrect proteins [13]. Sequently, cancer cells must adapt to these unfavorable conditions for their survival via inhibiting synthesis of proteins and degrading unfolded proteins accumulated in ER by proteasome [14]. Therefore, targeting proteasome becomes a promising strategy for cancer therapy.

Early studies demonstrated that tumor-inhibiting effects of proteasome inhibitors (PIs) are attributed to repression of nuclear factor-κB (NF-κB) signaling and regulation of proteins associated with both cell cycle and apoptosis, such as p27Kip1 [15], p21cip/WAF1 [16], p53 [17], Bcl-2 [18, 19], Bax [17], Bim and Bik [20]. It is now believed that PIs induce ER stress-related cell death through unfolded protein response (UPR) [21] and confer preferential cytotoxicity towards hypoxic tumor cells [22]. However, cases of resistance to PIs are emerging, whereas the related mechanisms are not systematically elucidated [23]. Interestingly, a recent study has demonstrated that a proteasome inhibitor Bortezomib promotes STAT3 activation in HNSCC, suggestive of potential roles of STAT3 in the resistance of HNSCC to the proteasome inhibitor [24]. Therefore, it would be of great interest to elucidate whether the STAT3 plays a role in resistance LSC to PIs.

In the present study, we first assessed the associations between constitutive activation of STAT3 and clinicopathlological factors in LSC. We next investigated the role of STAT3 activation by protesome inhibitor and its impacts on proteasome-induced cell apoptosis in LSC.

Materials and Methods

Patients’ data

50 LSC patients (36 males and 14 females) who received surgical resection at Bethune International Peace Hospital were recruited, and their complete detailed clinicopathologic data were collected. Of the 50 cases, there were 17 cases of supraglottic and 34 cases of glottic cancers. The age of the present series ranged from 36 to 86 years, with a mean age of 58 years. All patients had undergone neither chemotherapy nor radiotherapy prior to surgery. According to UICC cancer staging system (2002), there were 7 cases of stage I, 6 cases of stage II, 17 cases of stage III and 20 cases of stage IV tumors. With regard to the histological grading, 6 cases were well differentiated, 13 cases were moderately differentiated and 31 cases were poorly differentiated squamous cell carcinomas (SCC). Twenty-two cases had neck node metastasis as proven by postoperative pathologic examinations.

Tumor tissue collection

With the informed consent of all patients, tissue specimens were collected immediately after surgical removal. Paired tumor-free paracancerous tissues (PCT) were taken at least 0.5 cm beyond the tumor margins. Each sample was cut in halves. One half was promptly frozen at -70 ℃ for subsequent Western blot, while the other was fixed immediately with 10% neutrally buffered formalin for histopathologic evaluation and immunohistochemistry. The acquisition of paraffin tissues and frozen specimens were approved by the Institutional Review Boards at Bethune International Peace Hospital. Neck dissection specimens were evaluated by two pathologists to confirm the status of neck node metastasis in these patients.

Immunohistochemistry and immunocytochemistry

Immunohistochemical and immunohistocytochemical studies were performed as described previously [25] using SP-9002 kit (including 0.3% hydrogen peroxide, 10% goat serum, biotinated secondary antibodies and horseradish peroxidase marked strepto- antibiotin, Zhong Shan Jin Qiao, Beijing) with some modifications. Briefly, for immunohistochemistry, consecutive sections were deparaffinized and hydrated, and subjected to 0.3% hydrogen peroxide for elimination of endogenous peroxidase at room temperature for 10 min. Slides were then heated for the retrieval of antigens in an autoclave sterilizer for 2 min. Goat serum (10%) was added to block nonspecific protein staining for 10 min. The sections were incubated with anti-STAT3 and anti-p-STAT3 (Santa Cruz Biotechnology Inc.) at 4 ℃overnight. Afterwards, they were rinsed by PBS and incubated at room temperature with biotinated secondary antibodies for 15 min under a humid condition followed by 15-min incubation with horseradish peroxidase-marked strepto- antibiotin at room temperature. Finally, they were detected with DAB kit (Zhong Shan Jin Qiao, Beijing). The immunoreactivity of STAT3 or p-STAT3 was evaluated as described previously [31]. Brown coloration was identified as positive staining. The distribution of positive staining cells was classified in 4 categories: weakly positive (+), positive (++), strongly positive (+++), and negative. For immunocytochemical study, Hep-2 cells were seeded in 6-well plates with a small cover slide in each well. When confluence reached 70% to 80%, cells grown on the cover slide were fixed with cold acetone at room temperature for 15 min. Cover slides were then subjected to 0.3% hydrogen peroxide for elimination of endogenous peroxidase at room temperature for 30 min, washed with PBS and permeabilized with 0.1% TritonX-100 on ice for 2min. The immunostaining of Hep-2 cells was performed as in immunohistocehmistry.

Cell line and culture

Hep-2 human LSC cell line (National Cancer Institute, USA) were cultured in RPMI1640 medium supplemented with 10% fetal bovine serum (FBS) under the condition of 37℃, 20% O2, 5%CO2, 95% humidity in a CO2 incubator. Cells were allowed for attachment overnight and those grown in logarithmic phase were used for subsequent experiments. All experimental groups came from the same parental cells. Cells were passaged every 2 to 3 days to maintain exponential growth.

Transfection of plasmids

The construction of STAT3-targeting shRNA expression vector and the transfection of plasmids were performed as our previous publications [12]. Briefly, the double strands of shRNA targeting gene of STAT3 (sense: 5′-CACCGCAGCAGCTGAACAACATGTTCAAGAGACATGTTGTTCAGCTGCTGCTTTTTTG-3′, the corresponding mRNA coding region is underlined) and the double strands of negative control gene (sense: 5′-CACCGTTCTCCGAACGTGTCACGTCAAGAGATTACGTGACACGTTCGGAGAATTTTTTG-3′, underline shows the target sequence) were inserted into pGPU6/GFP/Neo vector (Gene Pharma Co., Ltd), and named pGPU6/GFP/Neo-shSTAT3 and pGPU6/GFP/Neo-shNC, respectively. The procedure of transient transfection was performed according to LipofectamineTM2000 (Invitrogen, Corporation) manufacturer’s instructions in 96-well plates or/and 6-well plates. The thansfection efficiency was monitored by observation under a fluorescent microscope and by flow cytometry. Sequent assays were performed 24 hours after transfection.

MTT assay

The inhibition of hep-2 cells by chemicals was determined by MTT assay as described previously [26]. Transfected and untransfected hep-2 cells were subjected to MTT assay. After treatments with PIs (MG-132) (MERCK Corporation, Germany) and STAT3 inhibitor (AG940) (Sigma, USA) in different combinations and cisplatin (DDP, Shan Dong Qi Lu Pharmaceutics, China), 20μl 3-(4, 5-dimethylthiazol-2-yl)-2, 5-diphenyltetrazolium bromide (MTT, 5mg/ml, Sigma, USA) were added into each well of 96-well plates. After incubation at 37 ℃ for 4h, culture medium was replaced by DMSO to dissolve formazan for coloration. Absorbance was measured at 490 nm using Enzyme-linked Immunosorbent Detector (Model 550, Bio-Rad, USA).

Flow cytometry

The transfection efficiency, apoptosis rate and cell cycle distributions were determined by a FACScan analyzer (Becton Dickinson FAC Sort, USA). Hep-2 cells, with or without treatments, were collected after trypsinization. Fresh cells were used for detection of the efficacy of transfection by flow cytometry. To determine apoptosis rate and cell cycle distribution, cells were washed by PBS for 3 times, and then were fixed with 75% ethanol overnight at 4 ℃. Prior to analysis, ethanol was discarded and 80μl RNase (final concentration: 50mg/L) and 150μl propidium iodide (final concentration: 50mg/L, Sigmar, USA) were used for staining of DNA for 30 min at 4℃. Apoptotic cells appeared as a magnitude of the sub-G1 peak due to nuclear fragmentation and loss of DNA.

Western blot

Western blot was carried out as described previously [25] with minor modifications. For tissue specimens, lysates were obtained from 100mg sample of each frozen tissue by a homogenizer. Subjected Hep-2 cells were harvested following trypsinization and centrifugalization. The cell pellets were resuspended in cell lysis buffer containing 500mM HEPES 25ml (0.1mol/L),100mM NaCl 5ml (1mol/L),2mM EDTA 0.2 ml (0.5mol/ L),sodium deoxycholate 0.25g (0.5%),NP-400 5ml (1%),10%SDS 0.5ml (0.1%),2×10-3 mol/L PMSF and 2×10⁻⁶ g/L Lupeptin to collect lysates. Subsequently, lysates originating from tissues or hep-2 cells were acquired in the same way. After determination of protein concentrations in the lysates, equivalent protein (100mg from tissues or 30mg from cells) were separated by electrophoresis on 4% to 10% SDS-PAGE gels. The subjected gels were then transferred onto nitrocellulose filters, and blocked in confining liquid containing 1% nonfat dry milk, 0.02% Tween-20 (Sigmar, USA), 10mmol/LTris-Cl,0.15mmol/L NaCl at 4℃ overnight. The blocked filters were incubated with primary antibodies (Santa Cruz Biotechnology int and Cell Signaling Technology, USA) at 4℃ overnight followed by rinse in TBST. The filters were incubated with secondary antibodies marked by HRE (Zhong Shan Jin Qiao, BeiJing) at room temperature for 1 hour followed by rinse in TBST two times. Finally, the blots were visualized by ECL kit (Pierce, USA).

Statistical analysis

Results were analyzed for statistical significance with the use of SPSS 13.0. Data were presented as mean values ± SD. The method of statistical analysis included student’s t-test for comparision of two groups, one-way ANOVA for comparison of more than two groups combined with or without least significant difference (LSD) followed for comparison of each two groups, and Pearson correlation analysis for correlation evaluation of different factors. P < 0.05 was considered significant.

Results

Constitutive activation of STAT3 is associated with clinicopathlological factors in LSC, including clinical stage, pathological grading and cervical lymph node metastasis. It has been reported that STAT3 is aberrantly activated in many tumors in comparison with its transient activation in normal tissues [27-30]. To determine activation status and expression distribution pattern of p-STAT3 in LSC, we compared levels of p-STAT3 protein of primary LSC tissues with corresponding tumor-free PCT by immunohistochemistry. As can be seen in Fig 1A-D, p-STAT3 was constitutively expressed in LSC compared with PCT. In positive samples, weakly positive staining dominates PCTs, whereas strong positive coloration occupies most of cancer tissues; it was also noted that the staining of p-STAT3 in poorly differentiated LSC is stronger than that in well differentiated LSC.

CST 2017-204_fig_1

Figure 1. The expression of phosphorylated STAT3 (p-STAT3) in human laryngeal squamous cell carcinoma (SP×400). Tissue specimens were collected and p-STAT3 protein expression levels were assessed by immunohistochemistry and western blot. A. Expression of STAT3 in well-differentiated laryngeal squamous carcinoma. B. The expression of p-STAT3 protein in moderately-defferentiated laryngeal squamous cell carcinoma (SP×400). C. The expression of p-STAT3 protein in poorly differentiated laryngeal squamous cell carcinoma (SP×400). D. The expression of p-STAT3 protein in tumor-free paracancerous laryngeal epithelial tissues (SP×200). Yellow arrow indicates representative staining cells. E. Expression of Stat3, p-STAT3, and cyclin Dl in human laryngeal carcinoma by western blot. Elevated levels of p-STAT3 and cyclin Dl in tumor tissues (T) compared to adjacent normal laryngeal mucosa (N) were further confirmed.

These findings suggest that STAT3 is activated constitutively and persistently in LSC rather than in PCT, and its activated form, p-STAT3, is likely to function in nucleus as in other malignancies. Moreover, expression of p-STAT3 is closely related to the expression of cyclin D1. Results from western blot analysis showed the same expression pattern for each protein (Fig 1E) in that there is a correlation between p-STAT3 and the expression of cyclin D1, suggesting that cyclin D1 is regulated by p-STAT3 in LSC tissues.

It has been reported in many studies that activation of STAT3 is related to poor prognosis of various cancers [31-33]. To test whether STAT3 activation is pertinent to clinicopathologic factors of LSC, we analyzed the relationship between p-STAT3 and critical prognostic factors. Results in Table 1 indicates that there is a significant correlation between p-STAT3 expression and clinical stage, pathologic grade and neck node metastasis rather than age, sex, T stage and even the site of primary tumors.

Table 1. The relationship between the expression of Stat3 and phosphorylated Stat3 protein and clinicophalogical features in laryngeal squamous cell carcinoma

n Stat3 p-Stat3
M number (rate%) P value M number (rate%) P value
Age ≥60 28 23(82.14) 0.0715 17(60.71) 0.6609
<60 22 13(59.09) 12(54.54)
Sex M 36 27(75.00) 0.6841 23(63.89) 0.1761
F 14 9 (64.29) 6 (42.86)
Tumor position Supra-glottis 17 10(58.82) 0.2473 10(58.82) 0.9325
glottis 33 26(78.78) 19(57.58)
 

Patho- grade

Well to moderately differentiated 19 10(52.63) 0.0169 5 (26.32) 0.0004
Poorly differentiated 31 26(83.87) 24(77.42)
T stage T1-T2 17 12(70.58) 0.0685 7 (41.18) 0.0836
T3-T4 33 27(81.81) 22(66.67)
Clinical stage Ⅰ-Ⅱ 13 5 (38.46) 0.0056 4 (30.77) 0.0208
Ⅲ-Ⅳ 37 31(83.78) 25(67.57)
Lymph node metastasis Yes 22 20(90.90) 0.0083 17(77.27) 0.0144
No 28 16(57.14) 12(42.86)

Activation of STAT3 is in constant existence in Hep-2 laryngeal carcinoma cells (Hep-2 cells). To test whether STATA3 is also constitutively activated in Hep-2 cells, we examined the expression of STAT3 and its related proteins by immunocytochemistry and western blot. By immunocytochemistry, STAT3 was distributed in cytoplasm of cancer cells, while p-STAT3 was observed mostly within nucleus of Hep-2 cells, which resembles the expression pattern of STAT3 and p-STAT3 in LSC tissues (Fig 2A, B, C). To examine if these proteins were constantly and pervasively expressed, we detected expression of the two proteins using western blot at different time points after the setting of cell culture. The sequent 24 h, 48 h, and 72 h were chosen as time spots of analysis. The results of western blot showed that STAT3 and p-STAT3 (Fig 2D) can be detected at different time points, suggesting that constitutive activation of STAT3 is also present in Hep-2 cells as in primary LSC.

CST 2017-204_fig_2

Figure 2. TExpression of STAT3 and p-STAT3 in human laryngeal carcinoma Hep-2 cells. Immunocytochemistry was used to demonstrate the intracellular distribution of STAT3 and p-STAT. PBS was used as a negative control. Besides, western blot was used to show the expression patterns of STAT3 and p-STAT3 overtimes (0h, 24h, 48h, 72h). β-actin represents the internal protein control. Constitutive expression and activation of STAT3 in human laryngeal carcinoma Hep-2 cells was noted. A. Cytoplasmic staining of STAT3 in Hep-2 cells (SP × 400). B. Nuclear staining of p-STAT3 in Hep-2 cells (SP × 400). C. Negative control (SP × 400). D. Expression of Stat3 and p-STAT3 in Hep-2 cells as demonstrated by western blot.

Proteasome inhibitor MG-132 induces apoptosis in Hep-2 cells, which is accompanied by additional activation of STAT3 and changes in the expression of several proteins related to cell cycle and apoptosis regulation. PIs have been approved by the United States Food and Drug Administration (FDA) for the treatments of multiple myeloma. In addition, PIs have been investigated for the treatments of many cancers. Herein, we aimed to test the therapeutic effects of PIs on Hep-2 cells. First, we tested the inhibition of proliferation in Hep-2 cells by a PI, MG-132, using MTT assay. Medium containing different concentrations of MG-132 was add into each well of treatment groups and maintained for different times. As seen in Fig 3A, the inhibition of Hep-2 cells by MG-132 displayed a concentration-dependent manner (24h:r=0.925,p<0.01;48h:r=0.944,p<0.01). Second, we attempted to confirm if MG-132 inhibits proliferation of Hep-2 cells in a time-dependent manner. For doing this, we selected the 2.5μM (IC50) of MG-132 to stimulate Hep-2 cells for 48 h. The results of Fig 3B show that the effects of MG-132 in proliferation inhibition is enhanced with prolongation of treatment time (r=0.945,p<0.01). Third, using flow cytometry, we determined apoptosis rate and cycle distribution of Hep-2 cells after treatment with MG-132. Similar with the inhibition of proliferation, MG-132 induces apoptosis in time- (r=0.888,p<0.01) and dose-dependent (r=0.842,p<0.01) manners (Fig 3C, 3D ).

CST 2017-204_fig_3

Figure 3. Effects of a proteasome inhibitor, MG-132, on Hep-2 cells. Hep-2 cells were treated with different concentrations of MG-132 for 24 hours. A concentration of 2.5μM was chosen for stimulation of Hep-2 cells for different times. Alterations in cell apoptosis, cell cycle and protein expression of STAT3 and p-STAT3 were assessed simultaneously. A. The dosage and effect curve of MG-132 (n = 3). B. The time and effect curve of MG-132 (n = 3). C. Apoptosis rate of Hep-2 cells treated with MG-132 for different time (n = 3). D. Apoptosis rate of Hep-2 cells treated with MG-132 at different concentrations (*P < 0.05, versus untreated groups (0μM) (n = 3). E. The correlated expression of cell cycle regulation proteins in Hep-2 cells treated with MG-132 for different time. F. Variation of cell cycle of Hep-2 cells treated with MG-132 for different time (n = 3). G. MG-132-induced STAT3 activation and Bcl-2 expression in Hep-2 cells.

To confirm the mechanisms underlying the cell cycle changes induced by MG-132, we used western blot to check the expression levels of some cell cycle regulators. As seen in Fig 3E, the expression of P21 is elevated significantly compared with the decreased levels of the expression of cyclinD1, suggesting that the changes of cell cycle induced by MG-132 were associated with upregulation of P21 and downregulation of cyclinD1. Simultaneously, cell cycle arrest was noted at G0/G1 phase and/or G2/M phase overtimes after treatment with MG-132 (Fig 3F), the former of which is more prominent than the latter.

From the results of western blot in Fig 3G, we can confirm that STAT3 and its activated form, p-STAT3, are expressed at all times in cultured Hep-2 cells, even in the absence of MG-132 treatment, and the level of its expression was relatively constant and stable. In the presence of MG-132, the expression of p-STAT3 was elevated within short period of time and remained at a stable level; however, the increased expression of p-STAT3 was not related to the duration of MG-132 treatment. Bcl-2 was identified as a downstream of STAT3, and facilitates anti-apoptosis activity in cancer cells [34]. Expression of Bcl-2 protein increased overtime after MG-132 treatment, which may contributed to the MG-132-induced STAT3 activation and resistance of Hep-2 cells to MG-132-induced apoptosis.

Knockdown of STAT3 by shRNA, abrogates the expression and thus activation of STAT3, and potentiates the apoptosis-inducing effects of MG-132. To further confirm the role of the STAT3 activation in inducing resistance of Hep-2 cells to MG-132, we used RNAi to knockout the expression of STAT3, and thus the “constitutive” (inherent) and “PI-induced” (acquired) activation of STAT3. The transfection efficiency was 85.76% by flow cytometry (data not shown). The results of Fig 4A showed that combined group has a similar expression level of p-STAT3 with pshSTAT3 group, with a higher inhibition rate than any other groups (all p<0.01). Results from apoptosis detection Fig 4B showed a more striking apoptosis rate 55.80±3.12% in combined group than in any other group (all p<0.01). In pshSTAT3 group, moderate apoptosis and proliferation inhibition rates were induced. Therefore, blockade of STAT3 by shRNA, abrogates the expression and thus both “inherent” and “acquired” activation of STAT3, and potentiates the MG-132-induced apoptosis in Hep-2 cells.

CST 2017-204_fig_4

Figure 4. Effects of MG-132 combined with STAT3 RNAi on proliferation inhibition and apoptosis in Hep-2 cells, as assessed by MTT assay and flow cytometry. Hep-2 cells were seeded into 96-well plates for MTT assay, or 6-well plates for flow cytometry. Subjected Hep-2 cells were categorized as five groups: normal control group (untreated Hep-2 cells), negative control group (Hep-2 cells transfected with negative plasmid, pshNeg group), MG-132 group (Hep-2 cells treated with 2.5μM MG-132 only), combined group (Hep-2 cells transfected with positive plasmid combined with 2.5μM MG-132 treatment), pshSTAT3 group (Hep-2 cells transfected with positive plasmid without any other treatment). A. The proliferation inhibition rate of Hep-2 cells in different groups (n=3) (versus pshNeg group, all *P<0.01; pshSTAT3 group versus MG-132 group, #P<0.01). B. The apoptosis rate of Hep-2 cells in different groups (n=3) (control group versus pshNeg group, *P<0.01; pshSTAT3 group versus MG-132 group, #P<0.01). C. Expression of p-STAT3, cyclin D1 and Bcl-2 in Hep-2 cells in different groups was analyzed by Western blotting.. Lane 1: control group; lane 2: pshNeg group; lane 3: MG-132 group; lane 4: combined group; lane 5: pshSTAT3 group.

With regard to the activation of STAT3 at different situations, as seen in Fig 4C, p-STAT3 was expressed at the highest level in MG-132 group. By contrast, p-STAT3, cyclin D1, and Bcl-2 were expressed at lower levels in combined group, compared with each of the normal control group, negative control group and MG-132 group. The similar expression and activation patterns of STAT3 noticed in combined group and pshSTAT3 group indicated that p-STAT3 may participate in the formation of resistance of Hep-2 cells to MG-132 at a transcriptional level. Taken together, activation of STAT3 is responsible for the resistance of Hep-2 cells to MG-132 at least in part by regulating the anti-apoptosis factor Bcl-2 expression.

Combined treatment with STAT3 inhibitor AG490 and proteasome inhibitor MG-132 induces apoptosis more effectively in Hep-2 cells. In view of the fact that activation of STAT3 played a role in the therapeutic resistance to MG-132 in Hep-2 cells, which can be sensitized by knockdown of STAT3, we studied the effects of combined using STAT3 inhibitor AG490 and proteasome inhibitor MG-132 on proliferation and apoptosis. As seen in Fig 5 A, B, combination treatment by AG490 and MG-132 can induce significant increase in cell proliferation inhibition and apoptosis, indicative of effective synergism.

CST 2017-204_fig_5

Figure 5. Effects of AG-490 combined with MG-132 on Hep-2 cells. Hep-2 cells were seeded into 96-well or 6-well plates followed by treatment with 1μM of MG-132 for 48h with or without presence of different concentrations (10, 20, 40, 80μM) of AG490. A concentration of 10μmol/L was for analysis of AG490-induced apoptosis. A. The proliferation inhibition rate of Hep-2 cells treated with the different concentrations AG490 alone and in combination with MG-132 for 48h (n=3). B. The apoptosis rate of Hep-2 cells treated with AG490 alone and in combination with MG-132(1μM) for 48h (n=3) (compared with control group,*P<0.01; compared with AG490 group and MG-132 group, all #P<0.01).

Discussion

Like other malignancies in HNSCC, LSC often exhibits resistance to various therapeutic strategies including chemoradiation and targeted therapies, especially in advanced cases. This difficult situation is often attributed to aberrant expression and activation of some specific genes, such as STAT3, which are utilized by cancer cells to maintain their biological behaviors. In this regard, cancer cells may become vulnerable to the assigned treatment modalities secondary to abrogating the functions of major responsible oncogenes, the so-called “Achilles heel”, which constitutes the fundamental rationale for targeted therapy [35].

Previous studies have demonstrated that activation of STAT3 is associated with chemo- and/or radioresistance in Hep-2 cells, and knockdown of STAT3 by siRNA or blockade of STAT3 activation by its inhibitors sensitizes chemo- and/or radiotherapy both in vitro or in vivo [11, 12, 36, 37]. Importantly, we also demonstrated in the present investigation that constitutive activation of STAT3 was associated with clinicopathlologic factors in LSC, which include clinical stage, pathological grading and cervical lymph node metastasis. This is consistent with the findings in the study of Rosen et al, in which they demonstrated that p-STAT3 was associated with poor prognosis of ovarian cancer [38]. Moreover, results of Kusaba’s study [33] also demonstrated that p-STAT3 is correlated with invasion of vein, nodal metastasis and Dukes grades instead of pathological grading in ovarian cancer. In the present study, we found expression of cyclin D1, one of the important factors downstream of STAT3, was also elevated. Taken together, correlations between activation of STAT3 and clinicopathlological factors of different cancers may depend on cell types from which they originate.

In addition to intrinsic elements, cancer cells in solid tumors also depends on extrinsic factors that form surrounding microenvironment (also called “niche”) for their proliferation and survival. The feature of the niche is characterized by low PH, hypoxia and glucose-deprived starvation as a result of rapid proliferation by tumor cells and insufficient delivery by intra-tumor capillary [39]. Under the stressful conditions, a mass of misfolded or unfolded proteins accumulate in endocytoplasmic reticulum (ER). Tumor cells must activate UPR to inhibit synthesis of protein and mRNA and degrade excessive protein by proteasome to accommodate ER-stress, which is rarely experienced by normal tissue cells [40]. It has been demonstrated that severe ER-stress caused by accumulated misfolded proteins can activate programmed death in tumor cells [39]. Therefore, proteasome can serve as a potential target for cancer therapy.

Recently, PIs was introduced into clinical treatment of cancers, either as a single agent or a combined therapy to sensitize traditional chemo- and/or radiotherapy. However, the resistance to PIs remains a problem to solve, of which underlying mechanisms have not been explained pertinently [23]. The prerequisite for us to select PIs as an anti-LSC agent resides on the fact that PIs is effective against cyclin D1 highly-expressed cancers [41]. However, it remains to be elucidated whether other HNSCC cells were dependent or independent on cyclin D1 expression for their proliferation, survival and progression.

Given the fact that activation of STAT3 is associated with clinicopathologic behaviors and chemoradiation resistance in LSC, STAT3 is definitely a potential target for therapeutic purposes. The pro-survival and –proliferation effects of p-STAT3 let us to postulate that the constitutive (inherent) along with PI-induced (acquired) activation of STAT3 may constitute a major cause of resistance to PIs in LSC. Abrogation of both existed and acquired STAT3 activation may sensitize the LSC cells to PI treatment. In present investigation, we found for the first time that activation of STAT3 contributed to resistance of LSC to MG-132 at least in part by upregulating expression of antiapoptotic protein Bcl-2, which is partly consistent with results of a recent study [24]. Our results showed that PIs plus AG490 displayed a more powerful killing effect to LSC cells in a synergetic manner. However, such a combination may not be applied to all cancers, because overexpression of Bcl-2 is associated with a good prognosis in some other malignancies [42].

In the present study, we also demonstrated that MG-132 can induce G0/G1 cell cycle arrest, via downregulation of cyclin D1 in LSC, which is also observed in some other cancers [43-45]. It can be inferred that an ideal local control is to be achieved by PIs through inducing quiescence in LSC cells. However, a fact that cannot be ignored is that G0/G1 cycle arrest also constitutes a cause of therapeutic resistance in some tumors.

Although inhibiting STAT3 is capable of inducing quiescence and potentiating PI-induced apoptosis in LSC cells, there has been no effective STAT3 inhibitor that can be safely used for humans in clinic for treatment of HNSCC. We recently defined dihydroartemisinin as putative STAT3 inhibitor, which might be safely used in clinic for cancer treatment [46]. Much work has to be done for developing new STAT3-inhibiting agents and exploring new treatment strategies and modalities based on the synergized apoptosis-inducing effects of PIs with STAT3 inhibitors.

Acknowledgements: The research work in the present investigation is supported by Key Basic Research Project Fund of Hebei Province, China (Fund No. 14967721D) and in part by Scientific Research Fund of Bethune International Peace Hospital, China.

Conflict of Interest: None

References

  • Parkin DM, Bray F, Ferlay J, Pisani P (2005) Global cancer statistics, 2002. CA Cancer J Clin 55: 74-108. [crossref]
  • Leeman RJ, Lui VW, Grandis JR (2006) STAT3 as a therapeutic target in head and neck cancer. Expert Opin Biol Ther 6: 231-241. [crossref]
  • Chen SH, Murphy DA, Lassoued W, Thurston G, Feldman MD, et al. (2008) Activated STAT3 is a mediator and biomarker of VEGF endothelial activation. Cancer Biol Ther 7: 1994-2003. [crossref]
  • Grandis JR, Drenning SD, Chakraborty A, Zhou MY, Zeng Q, et al. (1998) Requirement of Stat3 but not Stat1 activation for epidermal growth factor receptor- mediated cell growth In vitro. J Clin Invest 102: 1385-1392. [crossref]
  • Guo C, Yang G, Khun K, Kong X, Levy D, et al. (2009) Activation of Stat3 in renal tumors. Am J Transl Res 1: 283-290. [crossref]
  • Kim SM, Kwon OJ, Hong YK, Kim JH, Solca F, et al. (2012) Activation of IL-6R/JAK1/STAT3 signaling induces de novo resistance to irreversible EGFR inhibitors in non-small cell lung cancer with T790M resistance mutation. Mol Cancer Ther 11: 2254-2264. [crossref]
  • Sánchez A, Nagy P, Thorgeirsson SS (2003) STAT-3 activity in chemically-induced hepatocellular carcinoma. Eur J Cancer 39: 2093-2098. [crossref]
  • Turkson J, Jove R (2000) STAT proteins: novel molecular targets for cancer drug discovery. Oncogene 19: 6613-6626. [crossref]
  • Bonner JA, Trummell HQ, Willey CD, Plants BA, Raisch KP (2009) Inhibition of STAT-3 results in radiosensitization of human squamous cell carcinoma. Radiother Oncol 92: 339-344. [crossref]
  • Ara T, Nakata R, Sheard MA, Shimada H, Buettner R, et al. (2013) Critical role of STAT3 in IL-6-mediated drug resistance in human neuroblastoma. Cancer Res 73: 3852-3864. [crossref]
  • Li X, Wang H, Lu X and Di B (2010) Silencing STAT3 with short hairpin RNA enhances radiosensitivity of human laryngeal squamous cell carcinoma xenografts in vivo. Exp Ther Med 1: 947-953.
  • Li X, Wang H, Lu X and Di B (2010) STAT3 blockade with shRNA enhances radiosensitivity in Hep-2 human laryngeal squamous carcinoma cells. Oncol Rep 23: 345-353.
  • Määttänen P, Gehring K, Bergeron JJ, Thomas DY (2010) Protein quality control in the ER: the recognition of misfolded proteins. Semin Cell Dev Biol 21: 500-511. [crossref]
  • Orlowski RZ (2005) The ubiquitin proteasome pathway from bench to bedside. Hematology / the Education Program of the American Society of Hematology. American Society of Hematology. Education Program: 220-225
  • Uddin S, Ahmed M, Bavi P, et al. (2008) Bortezomib (Velcade) induces p27Kip1 expression through S-phase kinase protein 2 degradation in colorectal cancer. Cancer Res 68: 3379-3388.
  • Mitsiades CS, McMillin D, Kotoula V, et al (2006) Antitumor effects of the proteasome inhibitor bortezomib in medullary and anaplastic thyroid carcinoma cells in vitro. The Journal of clinical endocrinology and metabolism 91: 4013-402.
  • Jones RJ, Chen Q, Voorhees PM, Young KH, Bruey-Sedano N, et al. (2008) Inhibition of the p53 E3 ligase HDM-2 induces apoptosis and DNA damage–independent p53 phosphorylation in mantle cell lymphoma. Clin Cancer Res 14: 5416-5425. [crossref]
  • Li B and Dou QP (2000) Bax degradation by the ubiquitin/proteasome-dependent pathway: involvement in tumor survival and progression. Proc Natl Acad Sci U S A 97: 3850-3855.
  • Lara PN, Bold RJ, Mack PC, Davies AM, Gumerlock PH and Gandara DR (2005) Proteasome inhibition in small-cell lung cancer: preclinical rationale and clinical applications. Clinical lung cancer 7 Suppl 2: S67-7
  • Li C, Li R, Grandis JR and Johnson DE (2008) Bortezomib induces apoptosis via Bim and Bik up-regulation and synergizes with cisplatin in the killing of head and neck squamous cell carcinoma cells. Mol Cancer Ther 7: 1647-1655
  • McConkey DJ, Zhu K (2008) Mechanisms of proteasome inhibitor action and resistance in cancer. Drug Resist Updat 11: 164-179. [crossref]
  • Fels DR, Ye J, Segan AT, et al. (2008) Preferential cytotoxicity of bortezomib toward hypoxic tumor cells via overactivation of endoplasmic reticulum stress pathways. Cancer Res 68: 9323-9330.
  • Orlowski RZ, Kuhn DJ (2008) Proteasome inhibitors in cancer therapy: lessons from the first decade. Clin Cancer Res 14: 1649-1657. [crossref]
  • Li C, Zang Y, Sen M, Leeman-Neill RJ, Man DS, et al. (2009) Bortezomib up-regulates activated signal transducer and activator of transcription-3 and synergizes with inhibitors of signal transducer and activator of transcription-3 to promote head and neck squamous cell carcinoma cell death. Mol Cancer Ther 8: 2211-2220. [crossref]
  • Wang Q, He Z, Zhang J, et al. (2005) Overexpression of endoplasmic reticulum molecular chaperone GRP94 and GRP78 in human lung cancer tissues and its significance. Cancer detection and prevention 29: 544-55.
  • Song X, Liu X, Chi W, Liu Y, Wei L, et al. (2006) Hypoxia-induced resistance to cisplatin and doxorubicin in non-small cell lung cancer is inhibited by silencing of HIF-1alpha gene. Cancer Chemother Pharmacol 58: 776-784. [crossref]
  • Zhou Y, Li M, Wei Y, Feng D, Peng C, et al. (2009) Down-regulation of GRIM-19 expression is associated with hyperactivation of STAT3-induced gene expression and tumor growth in human cervical cancers. J Interferon Cytokine Res 29: 695-703. [crossref]
  • Corvinus FM, Orth C, Moriggl R, Tsareva SA, Wagner S, et al. (2005) Persistent STAT3 activation in colon cancer is associated with enhanced cell proliferation and tumor growth. Neoplasia 7: 545-555. [crossref]
  • Yu CL, Jove R and Burakoff SJ (1997): Constitutive activation of the Janus kinase-STAT pathway in T lymphoma overexpressing the Lck protein tyrosine kinase. J Immunol 159: 5206-5210.
  • Rahaman SO, Harbor PC, Chernova O, Barnett GH, Vogelbaum MA, et al. (2002) Inhibition of constitutively active Stat3 s.uppresses proliferation and induces apoptosis in glioblastoma multiforme cells. Oncogene 21: 8404-8413
  • Masuda M, Suzui M, Yasumatu R, et al.(2002) Constitutive activation of signal transducers and activators of transcription 3 correlates with cyclin D1 overexpression and may provide a novel prognostic marker in head and neck squamous cell carcinoma. Cancer Res 62: 3351-3355.
  • Horinaga M, Okita H, Nakashima J, Kanao K, Sakamoto M, et al. (2005) Clinical and pathologic significance of activation of signal transducer and activator of transcription 3 in prostate cancer. Urology 66: 671-675.
  • Kusaba T, Nakayama T, Yamazumi K, et al. (2005) Expression of p-STAT3 in human colorectal adenocarcinoma and adenoma; correlation with clinicopathological factors. J Clin Pathol 58: 833-838
  • Groner B, Lucks P, Borghouts C (2008) The function of Stat3 in tumor cells and their microenvironment. Semin Cell Dev Biol 19: 341-350. [crossref]
  • Christoffersen T, Guren TK, Spindler KL, Dahl O, Lonning PE, et al. (2009) Cancer therapy targeted at cellular signal transduction mechanisms: strategies, clinical results, and unresolved issues. Eur J Pharmacol 625: 6-22.
  • Hsu HW, Gridley DS, Kim PD, Hu S, de Necochea-Campion R, et al. (2013) Linifanib (ABT-869) enhances radiosensitivity of head and neck squamous cell carcinoma cells. Oral Oncol 49: 591-597. [crossref]
  • Sen M, Joyce S, Panahandeh M, Li C, Thomas SM, et al. (2012) Targeting Stat3 abrogates EGFR inhibitor resistance in cancer. Clin Cancer Res 18: 4986-4996. [crossref]
  • Rosen DG, Mercado-Uribe I, Yang G, Bast RC Jr, Amin HM, et al. (2006) The role of constitutively active signal transducer and activator of transcription 3 in ovarian tumorigenesis and prognosis. Cancer 107: 2730-2740. [crossref]
  • Wang G, Yang ZQ and Zhang K (2010) Endoplasmic reticulum stress response in cancer: molecular mechanism and therapeutic potential. Am J Transl Res 2: 65-74.
  • Healy SJ, Gorman AM, Mousavi-Shafaei P, Gupta S and Samali A (2009) Targeting the endoplasmic reticulum-stress response as an anticancer strategy. Eur J Pharmacol 625: 234-246.
  • Ishii Y, Pirkmaier A, Alvarez JV, Frank DA, Keselman I, et al. (2006) Cyclin D1 overexpression and response to bortezomib treatment in a breast cancer model. J Natl Cancer Inst 98: 1238-1247. [crossref]
  • Zhuang L, Lee CS, Scolyer RA, et al. (2007) Mcl-, Bcl-XL and Stat3 expression are associated with progression of melanoma whereas Bcl-2, AP-2 and MITF levels decrease during progression of melanoma. Mod Pathol 20: 416-426.
  • Wang Y, Rishi AK, Puliyappadamba VT, et al. (2010) Targeted proteasome inhibition by Velcade induces apoptosis in human mesothelioma and breast cancer cell lines. Cancer Chemother Pharmacol 66: 455-466.
  • Bazzaro M, Lee MK, Zoso A, et al. (2006) Ubiquitin-proteasome system stress sensitizes ovarian cancer to proteasome inhibitor-induced apoptosis. Cancer Res 66: 3754-3763
  • Liu T, Peng H, Zhang M, Deng Y and Wu Z (2010) Cucurbitacin B, a small molecule inhibitor of the Stat3 signaling pathway, enhances the chemosensitivity of laryngeal squamous cell carcinoma cells to cisplatin. Eur J Pharmacol 641: 15-22.
  • Jia L, Song Q, Zhou C, et al. (2016) Dihydroartemisinin as a Putative STAT3 Inhibitor, Suppresses the Growth of Head and Neck Squamous Cell Carcinoma by Targeting Jak2/STAT3 Signaling. PLoS One 11: e0147157. [crossref]

Overexpression of IFN-γR Increases the Radiotherapy Resistance of Nasopharyngeal Carcinoma

DOI: 10.31038/CST.2017214

Abstract

Purpose: To assess the relationship between IFN-γR expression and clinical radiotherapy outcome in nasopharyngeal carcinoma.

Methods: IFN-γR expression was examined by immunohistochemistry from 70 nasopharyngeal carcinoma patients. Then, statistical analysis was conducted to explore the correlation between IFN-γR expression and tumor clinicopathological charateristics. Finally, CNE-1 cells were employed to detect the effects of IFN-γR expression on radiotherapy outcomes by in vitro assays.

Results: IFN-γR was upregulated dramatically in nasopharyngeal carcinoma tissues. Elevated expression of IFN-γR correlated significantly with tumor stage, positive lymph node metastasis and poor prognosis in patients with nasopharyngeal carcinoma. In vitro assays demonstrated that overexpression of IFN-γR promoted the radio-resistance ability in CNE-1 cells. Knockdown of IFN-γR facilitated CNE-1 cells more sensitive to radiation, and a wobble mutant of IFN-γR could restore this effect.

Conclusions: Overexpression of IFN-γR may correlate positively with radiotherapy resistance of nasopharyngeal carcinoma.

Keywords

IFN-γR; overexpression; prognosis; radiation resistance; NPC

Introduction

Nasopharyngeal carcinoma is one of the most common malignancies and occupies the seventh leading cause of cancer-related deaths in China [1]. Particularly in South China, nasopharyngeal carcinoma is the most prevalent. Locally, advanced nasopharyngeal carcinoma patients are generally treated with radiotherapy, and the prognosis is related with radiotherapy [2]. Both local-regional failure and early systemic dissemination of the disease always contribute to treatment failure, which makes radio-sensitization promising in improving the outcome of therapeutic irradiation [3].

IFN-γ plays a pleiotropic role in modulating immunity and antiviral activity. It stimulates macrophages and NK cells to produce MHC class I and II molecules, while IFN-γR is not required for the development of the immune system [4]. Researches showed that IFN-γR was overexpressed in breast cancer and its amplification was closely related with lymph node metastasis and poor prognosis [5-7]. Until now, there are still no reports about whether IFN-γR has an effect on the radiotherapy for NPC. In the present study, we found for the first time that IFN-γR expression correlated with the prognosis of NPC patients who received radiotherapy. High IFN-γR levels improved the radiation resistance ability of NPC cells.

Patients and methods

Tissue samples

Seventy tissues of nasopharyngeal carcinoma were freshly collected by nasopharyngoscope and procured by the Department of Pathology, Cancer Center of Wuhan Union Hospital, China. The collection of tumor samples was approved by the institutional ethics committee. Informed consent forms had been signed for sample collection before. Tumor regions were technically separated by experienced pathologists and promptly stored at liquid nitrogen until needed. All patients included underwent concurrent chemotherapy (Cisplatin, 40mg/m2, weekly) with radiation therapy for the first time. They received irradiation with daily fraction doses of 2.12Gy for a total dose 70 Gy, which was administered with linear accelerators. The clinicopathologic features of patients were showed in Table 1.

CST 2017-203 Tab1

Immunohistochemical staining

Immunohistochemical staining was conducted as previously described. After rehydration, the paraffin-embedded nasopharyngeal carcinoma tissues were immersed in 3% hydrogen peroxide solution for 10 min, and then heated in EDTA buffer (pH 8.0) for 25 min. The slides were blocked with 10% normal rabbit serum at 37°C for 30 min, and then incubated with rabbit polyclonal antibody against primary antibody (IFN-γR, 1:200, ABCAM) overnight at 37°C. The slides were washed with PBS, and then incubated with biotinylated second antibody (diluted 1:200) for another 30 min at 37°C. Finally, streptavidin-peroxidase reactivity was detected with DAB solution. Cell nucleus was counterstained with hematoxylin. The immunohistochemical slides were graded according to the ratio of tumor cells with nuclear labeling. The level of IFN-γR- positive staining was scored into three grades: 0 for < 10%, positive for 10–30%, strong positive for > 30%.

Plasmid constructs and small interfering RNA synthesis

Double-stranded oligonucleotide with the following sequence was synthesized into the pSilencer 3.1- H1 neo small interfering RNA (siRNA) expression vector, and the scrambled siRNA was applied as control. Mutant DNA-IFN-γR (BOSTER, Wuhan, China) was used to resist the effect of IFN-γR-RNAi.

Cell culture and transfection

The CNE-1 cells (one of the esophageal squamous carcinoma cell lines) were cultured in RPMI 1640 (Invitrogen) with 10% fetal bovine serum. Cell transfection was carried out using Lipofectamine 2000 (Invitrogen) following the manufacturer’s instruction. Cells were harvested after transient transfection for 48 h. For stable transfection, cells were selected with 200 μg/ml G418, and passaged by serial dilution. During the next two weeks, colonies were screened by selective medium. The positive colonies with IFN-γR overexpression and IFN-γR knockdown were chosen for experiments.

Western blot analysis

Total proteins were isolated from patient tissues and cultured cells with lysis buffer [10 mM Tris-HCl (pH 7.5), 150 mM NaCl, 1% NP40] containing protease inhibitors. After centrifugation (15,000 RCF, 30 min, 4°C), supernatants were recovered for immunoblot analysis. The proteins were subjected to SDS-PAGE and then transferred onto polyvinylidenedifluoride (PVDF) membranes (Millipore). Next, the membranes were blocked and then incubated with primary antibody against IFN-γR (1:500, ABCAM) at 4°C overnight, then incubated with horseradish peroxidase-conjugated accordingly secondary antibody for 1 h at room temperature and developed using ECL detection reagent (BOSTER).

Ionizing radiation

CNE-1 cell line was exposed to IR in a JL Shepherd Model 143 137Cesium gamma and irradiated at a rate of 2.4 Gy/min.

Colony formation assay

A total of 400 cells were aliquoted into 6- well plate and exposed to γ rays in a dose of 5 Gy in triplicate. After incubation for 10 days, visible colonies were fixed in methanol and stained with Giemsa. Colonies were counted in each well. Each experiment was performed three times independently.

Results

Overexpression of IFN-γR in esophageal squamous cell carcinoma

IFN-γR expression was examined in 70 NPC samples and adjacent normal tissue by immunohistochemistry. Results showed that IFN-γR was hardly expressed or revealed weak expression in normal epithelial cells. While, in 36 cases of 70 NPC samples, IFN-γR expression exhibited significantly enhanced trend compared to the normal epithelium [Table 1]. Statistical analysis indicated that elevated expression of IFN-γR was significantly related to tumor stage, clinical stage and lymph node metastasis (p < 0.05) [Table 2].

CST 2017-203 Tab2

Next, the effect of IFN-γR expression on patient’s survival was analyzed. IFN-γR expression is positive in some patients and negative positive in others [Figure 1A]. After the included patients underwent chemotherapy combined with radiation therapy (55 out of 70), compared to NPC patients with low IFN-γR expression in cancerous tissue was significantly higher, patients with cancerous tissue of high IFN-γR expression showed significantly lower survival rate (p = 0.001) [Figure 1B].

Figure 1. Representative IFN-γR immunostaining in NPC and effects of IFN-γR expression on patient’s survival. A: IFN-γR expression is positive in some patients and negative positive in others. B: In the patients that received concurrent chemotherapy with radiation therapy (55 out of 70), the survival rate of patients with low IFN-γR expression was significantly higher than that of patients with high IFN-γR expression (p = 0.001).

Figure 1. Representative IFN-γR immunostaining in NPC and effects of IFN-γR expression on patient’s survival. A: IFN-γR expression is positive in some patients and negative positive in others. B: In the patients that received concurrent chemotherapy with radiation therapy (55 out of 70), the survival rate of patients with low IFN-γR expression was significantly higher than that of patients with high IFN-γR expression (p = 0.001).

Effects of IFN-γR on the radio-sensitivity of CNE-1 cells

To confirm the clinical data, CNE-1 cells were radiated with a dose of 5 Gy for 0, 2, 4, 8 and 12 h to know IFN-γR expression change. IFN-γR expression was increased after radiation in a time-dependent manner, which implied that IFN-γR may be associated with the radiation response of CNE-1 cells [Figure 2].

Figure 2. Expression of IFN-γR induced by radiation in CNE-1 cells. Elevated IFN-γR was observed after γ ray radiation with a dose of 5 Gy, and its level was highest at 10 hours.

Figure 2. Expression of IFN-γR induced by radiation in CNE-1 cells. Elevated IFN-γR was observed after γ ray radiation with a dose of 5 Gy, and its level was highest at 10 hours.

Colony formation assay was conducted to detect the effects of IFN-γR on the radio-sensitivity of CNE-1 cells [8]. IFN-γR knock-down cells showed a significantly lower survival fraction than control groups [Figures 3A and B]. Conversely, the survival fraction of cells with forced IFN-γR expression was higher [Figures 3C and D]. Therefore, results indicated a positive relationship between IFN-γR expression and radio-sensitivity of CNE-1 cells.

Figure 3. Effects of IFN-γR expression on the radio-sensitivity of CNE-1 cells. A: Expression of IFN-γR decreased in IFN-γR RNAi cells. B: Knock-down of IFN-γR promoted the radio-sensitivity of CNE-1 cells. C: Expression of IFN-γR increased after positive transfection. D: Forced IFN-γR expression inhibited the radio-sensitivity of CNE-1 cells.

Figure 3. Effects of IFN-γR expression on the radio-sensitivity of CNE-1 cells. A: Expression of IFN-γR decreased in IFN-γR RNAi cells. B: Knock-down of IFN-γR promoted the radio-sensitivity of CNE-1 cells. C: Expression of IFN-γR increased after positive transfection. D: Forced IFN-γR expression inhibited the radio-sensitivity of CNE-1 cells.

Discussion

Overexpression of IFN-γR has been observed in various types of human tumors, and elevated expression of IFN-γR indicated poor prognoses for patients, such as gastric carcinoma, prostate cancer, oral squamous cell carcinoma and non-small cell lung cancer. Particularly, IFN-γR hyperexpression was found to be associated with poor prognosis and reduced p27 expression in gastric carcinoma. Some studies have revealed that IFN-γR was amplified and upregulated in breast cancer. Moreover, its overexpression indicated worse tumor stage and lymphatic metastasis. However, there have been no reports on IFN-γR expression in NPC until now. Our results showed for the first time that IFN-γR expression increased in NPC, which significantly related with tumor stage and positive lymphatic metastasis. Coincidently, other studies have demonstrated that elevated IFN-γR level was correlated with poor prognosis in colorectal carcinoma [9,10]. However, no significance was shown between IFN-γR level and overall survival of NPC patients in the present study. We could not help putting forward the speculation whether IFN-γR expression affects radiotherapy outcome. Survival analysis unveiled that the overall survival rate of patients received radiation therapy was indeed affected by IFN-γR expression. Histological detection also showed a strong association betweeen IFN-γR hyperexpression and T-stage and lymphatic metastasis. Besides, in vitro assay further confirmed this point. This was the first report about the correlation between IFN-γR expression and radiation resistant of carcinoma.

Some studies reported that downregulation of IFN-γR suppressed prostate cancer cells proliferation, anchorage-independent growth and migration 11,12], while knockdown of Cks2 induced apoptosis [13,14]. Decreased IFN-γR promoted G2/M phase arrest and programmed cell death in human lung cancer cells [15]. Some study also found that overexpressin of IFN-γR in breast cancer cells repressed cell apoptosis through the MEK-Erk pathway [16]. However, no reports have described the apoptotic effects of IFN-γR expression in radiation-treated cells. In our next study, we may find out that overexpression of IFN-γR could induce apoptosis in CNE-1 cells after radiation.

To conclude, this study identified that overexpression of IFN-γR correlated with the poor prognosis of NPC patients receiving radiotherapy and elevated IFN-γR expression promoted the radiation resistance ability of NPC cells.

Conflict of interest: None declared.

Source of funding: None.

Consent: Written informed consent was obtained from the patients.

Acknowledgments: The Authors thank all the people involved in the project.

References

  • Chua ML, Wee JT, Hui EP, Chan AT (2016) Nasopharyngeal carcinoma. Lancet 387: 1012-1024. [Crossref]
  • Qu S, Liang ZG, Zhu XD (2015) Advances and challenges in intensity-modulated radiotherapy for nasopharyngeal carcinoma. Asian Pacific journal of cancer prevention: APJCP16:1687-1692.
  • Tang LL, Chen L, Mao YP, Li WF, et al. (2015) Comparison of the treatment outcomes of intensity-modulated radiotherapy and two-dimensional conventional radiotherapy in nasopharyngeal carcinoma patients with parapharyngeal space extension. Radiotherapy and oncology: journal of the European Society for Therapeutic Radiology and Oncology116:167-173.
  • Swisher JF, Feldman GM (2015) The many faces of Fcgamma RI: implications for therapeutic antibody function. Immunological reviews 268:160-174.
  • Nagai Y, Tsuchiya H, Runkle EA, Young PD et al. (2015) Disabling of the erbB Pathway Followed by IFN-gamma Modifies Phenotype and Enhances Genotoxic Eradication of Breast Tumors. Cell reports12:2049-2059.
  • Saad S, Dunn LB, Koetters T, Dhruva A, et al. (2014) Cytokine gene variations associated with subsyndromal depressive symptoms in patients with breast cancer. European journal of oncology nursing: The official journal of European Oncology Nursing Society18:397-404.
  • Chen C, Guo L, Shi M, Hu M et al. (2012) Modulation of IFN-gamma receptor 1 expression by AP-2alpha influences IFN-gamma sensitivity of cancer cells. The American journal of pathology180:661-671.
  • Zhao X, Feng X, Peng D, Liu W et al. (2016) Anticancer activities of alkaloids extracted from the Ba lotus seed in human nasopharyngeal carcinoma CNE-1 cells. Experimental and therapeutic medicine12:3113-3120.
  • Wang L, Wang Y, Song Z, Chu J et al. (2015) Deficiency of interferon-gamma or its receptor promotes colorectal cancer development. Journal of interferon & cytokine research: the official journal of the International Society for Interferon and Cytokine Research35:273-280.
  • Ni C, Wu P, Zhu X, Ye J et al. (2013) IFN-gamma selectively exerts pro-apoptotic effects on tumor-initiating label-retaining colon cancer cells. Cancer letters 336:174-184.
  • Wang X, Breeze A, Kulka M. (2015) N-3 polyunsaturated fatty acids inhibit IFN-gamma-induced IL-18 binding protein production by prostate cancer cells. Cancer Immunol Immunother 64:249-258.
  • Wee ZN, Li Z, Lee PL, Lee ST et al. (2014) EZH2-mediated inactivation of IFN-gamma-JAK-STAT1 signaling is an effective therapeutic target in MYC-driven prostate cancer. Cell reports 8:204-216.
  • Lan Y, Zhang Y, Wang J, Lin C et al. (2008) Aberrant expression of Cks1 and Cks2 contributes to prostate tumorigenesis by promoting proliferation and inhibiting programmed cell death. International journal of cancer 123:543-551.
  • You H, Lin H, Zhang Z (2015) CKS2 in human cancers: Clinical roles and current perspectives (Review). Molecular and clinical oncology 3:459-463.
  • Yang D, Stewart TJ, Smith KK, Georgi D et al. (2008) Downregulation of IFN-gammaR in association with loss of Fas function is linked to tumor progression. International journal of cancer122:350-362.
  • Chatterji U, Riby JE, Taniguchi T, Bjeldanes EL et al. (2004) Indole-3-carbinol stimulates transcription of the interferon gamma receptor 1 gene and augments interferon responsiveness in human breast cancer cells. Carcinogenesis 25:1119-1128.

Long Term Results of High Dose Rate Brachytherapy and External Beam Radiotherapy for Local and Locally Advanced Prostate Cancer

DOI: 10.31038/CST.2017213

Abstract

Purpose: Several studies provided evidence for the efficacy of dose-escalation on biochemical control (BC) of prostate cancer and High-dose-rate brachytherapy (HDR) is one method for it.

Materials and Methods: Patients with histological diagnosis Gleason scored (GS), clinical stage T1 to T3a, no evidence of metastatic disease, prostate volume

Results: From 1997 to 2005 there were 273 patients treated with this treatment combination at AC Camargo Cancer Center, Sao Paulo, Brazil. The median age and FU time were 64.7 and 10.3 years, respectively. Two hundred thirteen (78.0%) patients had FU longer than 5 years. Actuarial 10-year overall survival (OS), Clinical Specific Survival (CSS) and BC were 89.8%, 63.6% and 71.8%, respectively. On univariate analysis GS<7, clinical stage<T2b, low risk group (LR), absence adjuvant androgen deprivation (ADT), age>65, PSAi<10, localized EBRT and 3D-HDR plan were associated with improved CSS and BC, excluding PSAi, age for the last one. Multivariate Cox regression analysis confirmed LR, GS<7, PSAi<10, absence of ADT, age

Conclusion: The present data represents a unique uni-institutional study at long FU for the given technique. A comparison with the current literature confirms the excellent results achieved with this treatment modality. HDR has also the advantage of treatment time reduction and increasing in the capability of work load of the linear accelerators, especially in developing countries, where waiting lists and lack of radiation oncology facilities are a reality.

Keywords

prostate cancer, radiotherapy, high-dose rate brachythrerapy, biochemical control, PSA

Abbreviations and Acronyms

ADT: Adjuvant Androgen Deprivation
AJCC: American Joint Committee on Cancer
BC: Biochemical Control
CSS: Clinical Specific Survival
EBRT: External Beam Radiotherapy
FU: Fallow Up
GS: Gleason Score
HDR: High-Dose-Rate Brachytherapy
LR: Low Risk Group
NAAD: Neoadjuvant Hormonal Therapy
OS: Overall Survival
PSAi: Initial Prostate-Specific Antigen
TRUS: Trans Rectal Ultrasound

Introduction

More than 62% of Prostate Cancers (PCa) are diagnosed in men over 65 years. It has become a public health and socioeconomic problem with increasing incidence, in special due to a rapidly aging population worldwide [1]. In Brazil it was expected the diagnosis of 61,200 new cases of PCa in 2016, and the crude mortality for 2013 was around 14,000 deaths [2].

Management options for localized and locally advanced PCa are controversial and include active surveillance, radical prostatectomy, external beam radiotherapy (EBRT) and brachytherapy with low or high dose rate sources. [3]

Several studies provided evidence for the efficacy of dose-escalation on biochemical control (BC) of PCa. Mature results from randomized trials show a direct relation between increasing the radiation dose given to the prostate and/or seminal vesicles and BC [4-7].

High-dose-rate after loading brachytherapy (HDR) is one method that can deliver a high localized radiation dose to the tumor with excellent BC when combined to EBRT [8]. One prospective randomized trial with up to 10 years follow up has proved that HDR plus EBRT is more efficient than EBRT alone in terms of BC with less acute rectal toxicity and improved quality of life [9].

The aim of this retrospective study is to evaluate the mature results of patients with local and locally advanced PCa treated with combination of HDR and EBRT.

Materials and Methods

Patients with confirmed histological diagnosis Gleason scored (GS) of PCa, AJCC clinical stage T1 to T3a, with no evidence of metastatic disease and initial PSA <60mg/ml, prostate volume

This single-centre institutional protocol of treatment was performed in compliance with the Declaration of Helsinki and approved by the local research Ethics Committee. Written informed consent was mandatory.

External Beam Radiotherapy

The EBRT target volume was defined using diagnostics CT images on conventional two dimensional or 3D planning. The targets were the prostate gland and the proximal seminal vesicles with a 1 to 1.5 cm margin except to the posterior region, which margins were reduced to 0.5 to 1.0cm. The EBRT dose ranged from 45 to 54 Gy prescribed to the intersection point. Further details of the radiotherapy schedules have been published previously [10].

High Dose Rate Brachytherapy

HDR was done under spinal anesthesia. Using TRUS with a perineal template affixed to perineum the exact needles positions were determined intraoperatively. In a first moment treatments were planned based on semi-orthogonal X-rays – two dimensional planning (2D) – and after that we moved to three dimensional (3D) planning, based on CT images. The prostate gland, the rectum, and the urethral trajectory and length were countered and identified in both situations. Implant dosimetry geometric optimization was initially utilized, followed later by use of inverse planning. Treatment parameters and dose constraints changed minimally throughout the years. The patients considered low risk had 16 Gy given in 4 fractions BID, one single implant. Intermediate and high risk patients had 20 Gy given in the same treatment schedule. The dose-volume histogram constraints were as follows: the TRUS or CT-based prostate´s volume receiving 100% of the dose (V100) should be >95%, the uniformity index should be more than 50%, and the V150 less than 30%. The urethra maximum punctual and the maximal dose to 1cc of anterior rectal wall should not exceed 135% and 75% of prescribed doses, respectively.

Definition of end points and statistical analysis

BC was measured using PSA tests and assessed according to the Phoenix definitions [11]. Clinical Specific Survival (CSS) was calculated from the start of treatment to the lost of BC, diagnose of metastatic disease or death from PCa. The BC was evaluated from the date of start the treatment until date of first biochemical failure. The follow up (FU) program also included clinical investigation, digital rectal examination and image studies.

The statistical program SPSS (statistical package for the social sciences) Inc., released 2008, Statistics for Windows, version 20.0 (SPSS Inc., Chicago, IL) was used for all statistical analysis. The analysis of OS, CSS and BC was made using the Kaplan–Meier method. The log-rank test was used to test the significance when comparing different subgroups. Univariate and multivariate Cox regression analysis were also performed. The alpha level considered for statistically significant differences was 0.05.

Results

Between March, 1997 and March, 2005 there were 305 patients treated with combination of HDR and EBRT at the Department of Radiation Oncology, AC Camargo Cancer Center, Sao Paulo, Brazil. Thirty two patients were lost of FU and the data of 273 patients was available for analysis. Sixty four (27.1%) patients had pelvic EBRT and the remaining 209 (76.5%) localized EBRT. Clinical and treatments characteristics are depicted in Tables 1 and 2.

Table 1. Patients Characteristics

Median Range Variable n %
Age (years) 64.7 42-82
Prostate Vol (cc) 36.3 19-72 <35 121 44.3
>35 152 55.7
PSAi (ng/ml) 10.3 1-52 <10 173 16.8
10-20 54 19.8
>20 46 63.4
Gleason Score <7 190 69.6
=7 58 21.2
>7 25 21.2
Yes 47 17.2
No 226 82.8
Clinical Stage <T2b 192 70.3
T2b-c 47 17.2
>T2c 34 12.5
Risk Group Low 133 48.7
Interm 76 27.8
High 64 23.4
ADT NAAD Yes 93 34.1
No 180 65.9
ADJ 91 33.3
Salvage 37 13.6
WO 145 53.2
EBRT Pelvic 64 23.4
Localized 209 76.6
Comorbidities No 146 53.5
SAH 42 15.4
Diabetes 19 7.0
Other 39 14.3
TOTAL 273 100.0

Legend: ADJ (adjuvant hormonal therapy), ADT (Androgen deprivation therapy), BF (Bichemical failure, EBRT (External beam radiotherapy), NAAD (neoadjuvant hormonal therapy), SAH (Systemic arterial hypertension), Salvage (Salvage hormonal therapy)

Table 2. Treatment  Characteristics

Median Range Variable n %
Dose EBRT 50 40-54 < 50 149 54.6
>50 124 45.4
HDR 16 133 48.7
18.3 16-20 20 140 51.3
HDR plan 2D 167 61.2
3D 106 38.8
Interval 18.5 9-61 <18 173 63.4
>18 100 36.6

Legend: EBRT (External beam radiotherapy), HDR (High-dose-rate brachytherapy), HDR plan 2D/3D (two or three dimensional planning)

The median age and FU time were 64.7 (range, 42-82) and 10.3 (range, 1-15) years, respectively. Two hundred thirteen (78.0%) patients had FU longer than 5 years, and of these 153 (56.1%) longer than 10 years.

Androgen deprivation therapy

Androgen deprivation therapy (ADT) in a short course neo-adjuvant ADT, was prescribed for less than 6 months. Neoadjuvant hormonal therapy (NAAD) was administered to 34.1% of the patients. Adjuvant hormonal therapy (ADJ) was observed, mostly, for intermediate and high risk patients (33.4%), generally for no more than 6 months for intermediate risk and up to 3-years in high risk patients. Salvage ADT was observed in 37 (90.2%) of 41 patients dead due PCa. The profile of hormonal therapy is shown in Tables 3 and 4.

Table 3. Neoadjuvant Hormonal therapy according to Risk Group – Risk NAAD Cross tabulation

NAAD
 Risk Group WO % YES  % Total %
Low 74 27.1 8 2.9 82 30.0
Interm 65 23.8 35 12.8 100 36.6
High 41 15.0 50 18.3 91 33.3
             Total 180 65.9 93 34.1 273 100

Legend: ADJ (adjuvant hormonal therapy), Interm (intermediate), NAAD (neoadjuvant hormonal therapy), WO (without hormonal therapy)

Table 4. Adjuvant and Salvage Hormonal therapy according to Risk Group

WO   % ADJ   % Salv    % Total    %
Low 72 26.4 7 2.6 3 1.1 82 30.0
Interm 57 20.9 34 12.5 9 3.3 100 36.6
High 16 5.9 50 18.3 25 9.2 91 33.3
Total 145 53.2 91 33.4 37 13.6 273 100

Legend: ADJ (adjuvant hormonal therapy), Interm (intermediate), NAAD (neoadjuvant hormonal therapy), Salv (Salvage hormonal therapy), WO (without hormonal therapy)

The crude 10-year overall survival (OS) rate at was 52.7%. Actuarial 5- and 10-year OS, CSS and BC were 80.1%, 89.8%, 83.7%, 63.6%, 85.5% and 71.8%, respectively. (Figures 1-3)

Figure 1- Overall Survival

    Figure 1. Overall Survival

Figure 2 - Clinical Specific Survival

Figure 2. Clinical Specific Survival

Figure 3 - Clinical Specific Survival by Risk Group

Figure 3. Clinical Specific Survival by Risk Group

Univariate and multivariate analysis

On univariate analysis GS <7, clinical stage <T2b, low risk group, absence adjuvant ADT, older age (>65-years), PSAi Univariate analysis failed to identify neoadjuvant androgen deprivation therapy (NAAD) as a predictor for BC in all group risks (p=ns). When we pooled the intermediate and high risk group into a unique denominated unfavorable risk group, NAAD also failed to predict improved CSS and BC.

Multivariate Cox regression analysis confirmed low risk group (HR 0.03, 95% CI 0.006-0.116, p<0.001) and intermediate risk (HR 0.09, 95% CI 0.042-0.216, p<0.001) compared to high risk, presence of ADT (HR 0.39, 95% CI 0.179-0.868, p=0.021) as favorable predictors for CSS. GS >7 (HR 3.24, 95% CI 1.279-8.220, p<0.001), PSA >10 (HR 6.19, 95% CI 2.015-19.041, p=0.001), age >65 years (HR 2.87, 95% CI 1.264-6.504, p=0.012) and EBRT dose >50 Gy (HR 14.50, 95% CI 1.874-112.164, p=0.010) were confirmed as adverse predictors for CSS. Tables 6-8, Figures 4-9.

Low risk group compared to intermediate, (HR 0.70, 95% CI 0.023-0.213, p<0.001) and high risk (HR 0.99, 95% CI 0.052-0.190, p<0.001) groups, was a favorable predictive factor for BC. GS >7 (HR 3.09, 95% CI 1.473-6.473, p=0.003) and PSAi >10 (HR 6.18, 95% CI 2.331-16.393, p<0.001) were negative predictive factor for BC.

Low risk group was confirmed as the only predictive factor for OS when compared to intermediate (HR 0.28, 95% CI 0.133-0.608, p=0.001) and high (HR 0.38, 95% CI 0.223-0.665, p=0.001) risk groups.

Figure 4. Clinical Specific Survival by Clinical Stage

Figure 4. Clinical Specific Survival by Clinical Stage

Figure 5. Clinical Specific Survival by Gleason Score

Figure 5. Clinical Specific Survival by Gleason Score

Figure 6. Clinical Specific Survival by Initial PSA

Figure 6. Clinical Specific Survival by Initial PSA

Figure 7. Hazard Plots - Clinical Specific Survival by Risk Group

Figure 7. Hazard Plots – Clinical Specific Survival by Risk Group

Figure 8. Biochemical Control

Figure 8. Biochemical Control

Figure 9. Hazard Plots - Biochemical Control by Risk Group

Figure 9. Hazard Plots – Biochemical Control by Risk Group

Table 6. Cox regression for CSS

B SE Wald df Sig. Exp(B) 95.0% CI for Exp(B)
Lower Upper
LR 44.294 2 .000
IR -3.641 .761 22.910 1 .000 .026 .006 .116
HR -2.351 .418 31.579 1 .000 .095 .042 .216
EBRT

Pelvic x Local

-.110 .312 .124 1 .724 .896 .486 1.651
2D x 3D -1.861 1.134 2.693 1 .101 .156 .017 1.436
ADT -.931 .403 5.336 1 .021 .394 .179 .868
PSAi <10 10.858 2 .004
PSAi (>10<20) 1.925 .661 8.481 1 .004 6.856 1.877 25.048
PSAi (>20) 1.824 .573 10.133 1 .001 6.195 2.015 19.041
GS <7 7.328 2 .026
GS = 7 .335 .709 .223 1 .636 1.398 .349 5.608
GS >7 1.176 .475 6.145 1 .013 3.243 1.279 8.220
CS <T2b 3.350 2 .187
CS T2b/T2c -.662 .551 1.443 1 .230 .516 .175 1.519
CS >T2c .464 .818 .321 1 .571 1.590 .320 7.895
Age <65y 1.053 .418 6.352 1 .012 2.867 1.264 6.504
EBRT <50Gy 2.674 1.044 6.562 1 .010 14.498 1.874 112.164
HDR dose <20Gy 1.763 1.023 2.973 1 .085 5.830 .786 43.261
Interval EBRT to HDR -.187 .303 .381 1 .537 .829 .458 1.502

Legend: 2D (two dimensional plan), 3D (tridimensional plan), ADT (Androgen deprivation therapy), BC (biochemical control), Comorb (Comorbidites), CS (Clinical stage), CSS (Clinical Specific Survival), EBRT (External beam radiotherapy), GS (Gleason score), IR (Intermediate risk group), HDR (High-dose-rate brachytherapy), HR (High risk group), LR (Low risk group), NAAD (neoadjuvant hormonal therapy), OS (overall survival), P vol. (Prostate volume cc)

Table 7. Cox regression for BC

B SE Wald df Sig. Exp(B) 95.0% CI for Exp(B)
Lower Upper
LR 62.053 2 .000
IR -2.660 .568 21.948 1 .000 .070 .023 .213
HR -2.309 .330 48.920 1 .000 .099 .052 .190
2D x 3D -.789 .656 1.448 1 .229 .454 .126 1.642
ADT -.455 .307 2.192 1 .139 .634 .347 1.159
PSAi <10 13.634 2 .001
PSAi (>10<20) 1.822 .498 13.403 1 .000 6.182 2.331 16.393
PSAi >20 1.346 .462 8.494 1 .004 3.843 1.554 9.502
GS <7 8.944 2 .011
GS =7 .957 .465 4.240 1 .039 2.603 1.047 6.469
GS >7 1.127 .378 8.915 1 .003 3.088 1.473 6.473
CS <T2b 2.825 2 .244
CS T2b/T2c -.647 .410 2.493 1 .114 .523 .234 1.169
CS >T2c -.306 .580 .278 1 .598 .737 .236 2.294
EBRT 50Gy 1.411 .550 6.590 1 .010 4.101 1.396 12.044
HDR dose <20Gy -.470 .680 .477 1 .490 .625 .165 2.370
Interval EBRT to HDR -.064 .230 .078 1 .780 .938 .597 1.473

Legend: 2D (two dimensional plan), 3D (tridimensional plan), ADT (Androgen deprivation therapy), BC (biochemical control, Comorb (Comorbidites), CS (Clinical stage), CSS (Clinical Specific Survival), EBRT (External beam radiotherapy), GS (Gleason score), IR (Intermediate risk group), HDR (High-dose-rate brachytherapy), HR (High risk group), LR (Low risk group), NAAD (neoadjuvant hormonal therapy), OS (overall survival), P vol. (Prostate volume)

Table 8. Cox regression for OS

B SE Wald df Sig. Exp(B) 95.0% CI for Exp(B)
  Lower Upper
ADJ .149 0.3 0.3 1 .580 1.161 .684 1.970
Age <65y .223 0.2 1.0 1 .322 1.250 .804 1.942
Comorbidity -.310 0.2 2.1 1 .149 .734 .482 1.117
EBRT

Pelvic x Local

-.089 0.2 0.1 1 .722 .915 .560 1.494
LR 14.3 2 .001
IR -1.259 0.4 10.5 1 .001 .284 .133 .608
HR -.954 0.3 11.7 1 .001 .385 .223 .665

Legend: ADJ (adjuvant hormonal therapy, EBRT (External beam radiotherapy), IR (Intermediate risk group), HDR, HR (High risk group), LR (Low risk group), OS (overall survival)

Discussion

Conventional EBRT to treat PCa is securely limited to doses of 64–70 Gy in 1.8–2.0 Gy fractions. These levels of doses are determined by the risk of long-term toxic effects to the bladder and rectum. The clinical and biochemical relapse rates associated with these dose levels are around 33% within 5 years. Peeters et al 12 published the results of a randomized trial comparing total doses of 68 Gy and 78 Gy using EBRT alone. The 5-year OS in the higher dose arm of that study was 83% using ASTRO definition and the BC was significantly better in the 78-Gy arm compared to the 68-Gy arm, with an adjusted hazard ratio of 0.74 (p=0.02). Other published reports using dose-escalated photon beam EBRT alone also point in the same direction with respect to their long-term BC results [13-14].

HDR can escalate the dose given to the prostate by the combination with EBRT, and further more, in locally advanced disease has also the possibility of including the seminal vesicles when they needed to be encompassed. HDR has also a potential biological advantage through the delivery of high doses per fraction [10]. It is important to note that the comparisons between series published are difficult due differences in the techniques and planning for both, EBRT and HDR.

The combination of values of PSAi, GS and CS to identify a more or less aggressive disease has being extensively discussed in the literature, and was confirmed by this study. The most frequent challenge is to identify, for example the indication of prostate versus pelvic EBRT, varying risk categories, absence or use of NAAD, ADT and their length. Despite this, the combination of HDR and EBRT provides an optimal modulation of dose delivery. Results of this combination, in terms of BC and with more than 5 years of FU, range from 57% to 100% according to the risk group for biochemical failure (Table 9).

Table 9. Results of biochemical control by risk groups in series of HDR plus EBRT with more than 5-year follow up

Reference n Median FU  (months) Biochemical control by risk groups (%)

Low       Intermediate       High

Dose in Gy

(HDR(n.fx)/EBRT)

13 344 61 84 74 19.5(3) / 46
14 121 63 91 10(1)/50
15 313 68 100 88 79 23(2)/46
16 229 61 95 90 57 21(3)/50.4
17 64 105 84 80 18(3)/45
18 90 95 80 16.5(3)/45
19 264 75 97 18(3)/45
20 100 62 84 82 10(1)/60
21 64 61 100 91 21(3)/50
22 196 66 86 18(3)/46
23 131 63 87 71 30(4)/45

The search for factors predicting BC and CSS is important on defining what patients should be treated more aggressively. We, as other authors [26-28] observed that PSAi <10 ng/ml was confirmed as a favorable predictive factor related to BC and CSS.

Age<65 years was found to be an adverse prognostic factor in our analysis for CSS, with a marginally statically significance impact on OS, not confirmed on multivariate analysis. Smolska-Ciszewska et al, conversely to our results, noted that younger age at time of treatment impacted only on OS, not explaining if there was any association between treatment and side effects or worsening of associated comorbidities. As in our analysis, they found that low risk group and association of HDR to EBRT correlated with improved BC [29].

As in our results, Kamrava et al found that T stage, GS, and use of ADT were significantly associated with CSS on univariate analysis, but on multivariate analysis only GS and use of ADT were significantly associated CSS [30]

It is expected that the grouping of the patients in risk groups for biochemical failure based on PSAi, GS and CS, to aggregate patients with adverse features in the intermediate and high risk, leading to worse CSS and BC for the two last one, what was confirmed in our analysis. This was also observed by Morris et al [31].

In our series, as in others, patients who received adjuvant ADT had significantly higher risk features suggesting patient selection bias for CSS in this group of patients, instead of a negative interaction between HDR and EBRT [31-32].

Mature data in the literature evaluated the 10-year outcomes of intermediate- and high-risk patients noting a clear dose response by increasing the dose escalation through HDR doses [27]. More recently the use of Intensity modulated radiation therapy combined to HDR has being investigated. Chen et al. published the results of 148 patients treated with HDR – 22 Gy in 4 fractions followed IMRT up to 50.4Gy. All patients with Gleason score of 8 or higher had ADT for 1 year. They noted a 4-year actuarial CSS of 96.8% and of 100%, 100% and 94% for low, intermediate and high risk, respectively [32].

The results of the first randomized prospective trial, which has addressed dose escalation using an HDR and EBRT is a trial with a relatively slow accrual rate. There are some critics that must be addressed as the changes in EBRT technique during the time of the study, and, by current standards, the control arm is a relatively low-dose treatment. Despite that, the study reported the results of 218 patients treated between 1997 and 2005. There were 108 patients assigned to EBRT alone and 110 patients treated by EBRT followed by HDR. They noted that CSS was significantly higher in patients treated with combined modality (p = 0.04). In multivariate analysis the category treatment modality and ADT were significant covariates for BC, but with no differences in OS, as observed in our study. After a median follow-up time of 10.5 year follow-up, an 18% increase in CSS was obtained relative to EBRT alone, reflecting a 31% reduction in the risk of recurrence (p = 0.01) and no evidence of an increase in long-term severe morbidity [9].

Surgically induced gland deformation is inevitable during brachytherapy procedures. We observed that the use more of advanced methods of images (3D plan based on CT, MR or TRUS) images to identify the target, organs at risk and needles is important and have already been reported to impact on BC and CSS [33]. In our analysis Multivariate Cox regression analysis confirmed EBRT dose >50 Gy as predictor for CSS and BC, but with no impact on OS. This may be explained by the relative low dose per fraction schedule used in both groups. Of importance is to note that the dose given by HDR was relative constant thorough the risk groups, leading to higher biological effective dose to intermediate and high risk patients, and even though, these patients had a worse outcome, showing that there is space for further studies of dose escalation or treatment combination. After 2005 with the introduction of real time TRUS image acquisition and planning we have changed our protocol and moved forward for a more intense dose escalation, increasing dose and reducing the number of fractions.

Other information of this study is that presence of NAAD had no impact on DSS, BC or OS in any risk group, showing that this treatment strategy should be reserved for downsizing the prostate prior to treatment, in special for low risk patients.

In conclusion, this report demonstrates that HDR combined with EBRT is an important and effective method in achieving dose escalation in the radical radiotherapy of PCa. This combination has also the advantage of treatment time reduction and in increasing in the capability of work load of the linear accelerators, especially in developing countries, where waiting lists and lack of radiation oncology facilities are a reality. The present data represents a unique uni-institutional study at long FU for the given technique, and a comparison with the current literature confirms the excellent results achieved with this treatment modality. The satisfactory BC, CSS and OS are probably result of improved LC achieved with dose escalation, showing that HDR is an optimal alternative method of local dose escalation when combined to EBRT.

References

  • Quinn MJ, d’Onofrio A, Møller B, Black R, Martinez-Garcia C, et al. (2003) Cancer mortality trends in the EU and acceding countries up to 2015. Ann Oncol 14: 1148-1152. [crossref]
  • http://www.inca.gov.br/estimativa/2014/sintese-de-resultados- comentarios.asp
  • Novara G, Ficarra V, Mocellin S, et al. (2012) Systematic review and meta-analysis of studies reporting oncologic outcome after robot-assisted radical prostatectomy. Eur Urol 62: 382.
  • Al-Mamgani A, van Putten WL, Heemsbergen WD, van Leenders GJ, Slot A, et al. (2008) Update of Dutch multicenter dose-escalation trial of radiotherapy for localized prostate cancer. Int J Radiat Oncol Biol Phys 72: 980-988. [crossref]
  • Dearnaley DP, Sydes MR, Graham JD, et al. (2007) Escalated-dose versus standard-dose conformal radiotherapy in prostate cancer: first results from the MRC RT01 randomized controlled trial. Lancet Oncol 8: 475.
  • Kuban DA, Tucker SL, Dong L, Starkschall G, Huang EH, et al. (2008) Long-term results of the M. D. Anderson randomized dose-escalation trial for prostate cancer. Int J Radiat Oncol Biol Phys 70: 67-74. [crossref]
  • Zietman AL, DeSilvio ML, Slater JD, et al. (2005) Comparison of conventional-dose vs high-dose conformal radiation therapy in clinically localized adenocarcinoma of the prostate: a randomized controlled trial. JAMA 294: 1233.
  • Pellizzon AC, Salvajoli JV, Maia MA, et al. (2004) Late urinary morbidity with high dose prostate brachytherapy as a boost to conventional external beam radiation therapy for local and locally advanced prostate cancer. J Urol 171: 1105.
  • Hoskin PJ, Rojas AM, Bownes PJ, et al. (2012) Randomized trial of external beam radiotherapy alone or combined with high-dose-rate brachytherapy boost for localized prostate cancer. Radiother Oncol 103: 217.
  • Pellizzon AC, Nadalin W, Salvajoli JV, Fogaroli RC, et al. (2003) Results of high dose rate afterloading brachytherapy boost to conventional external beam radiation therapy for initial and locally advanced prostate cancer. Radiother Oncol 66: 167.
  • Roach M 3rd, Hanks G, Thames H Jr, et al. (2006) Defining biochemical failure following radiotherapy with or without hormonal therapy in men with clinically localized prostate cancer: recommendations of the RTOG-ASTRO Phoenix Consensus Conference. Int J Radiat Oncol Biol Phys 65: 965.
  • Peeters ST, Heemsbergen WD, Koper PC, et al. (2006) Dose-response in radiotherapy for localized prostate cancer: results of the Dutch multicenter randomized phase III trial comparing 68 Gy of radiotherapy with 78 Gy. J Clin Oncol
  • Pollack A, Zagars GK, Starkschall G, Antolak JA, Lee JJ, et al. (2002) Prostate cancer radiation dose response: results of the M. D. Anderson phase III randomized trial. Int J Radiat Oncol Biol Phys 53: 1097-1105. [crossref]
  • Dearnaley DP, Sydes MR, Graham JD, et al. (2007) Escalated dose versus standard-dose conformal radiotherapy in prostate cancer: first results from the MRC RT01 randomized controlled trial. Lancet Oncol 8: 475.
  • Khor R, Duchesne G, Tai KH, et al. (2013) Direct 2-arm comparison shows benefit of high-dose-rate brachytherapy boost vs external beam radiation therapy alone for prostate cancer. Int J Radiat Oncol Biol Phys 85: 679.
  • Cury FL, Duclos M, Aprikian A, et al. (2012) Single-fraction high-dose-rate brachytherapy and hypofractionated external beam radiation therapy in the treatment of intermediate-risk prostate cancer – long term results. Int J Radiat Oncol Biol Phys 82: 1417.
  • Prada PJ, González H, Fernández J, Jiménez I, Iglesias A, et al. (2012) Biochemical outcome after high-dose-rate intensity modulated brachytherapy with external beam radiotherapy: 12 years of experience. BJU Int 109: 1787-1793. [crossref]
  • Kotecha R, Yamada Y, Pei X, Kollmeier MA, Cox B, et al. (2013) Clinical outcomes of high-dose-rate brachytherapy and external beam radiotherapy in the management of clinically localized prostate cancer. Brachytherapy 12: 44-49. [crossref]
  • Kaprealian T, Weinberg V, Speight JL, et al. (2012) High-dose-rate brachytherapy boost for prostate cancer: comparison of two different fractionation schemes. Int J Radiat Oncol Biol Phys 82: 222.
  • Savdie R, Symons J, Spernat D, Yuen C, Pe Benito RA, et al. (2012) High-dose rate brachytherapy compared with open radical prostatectomy for the treatment of high-risk prostate cancer: 10 year biochemical freedom from relapse. BJU Int 110 Suppl 4: 71-76. [crossref]
  • Aluwini S, van Rooij PH, Kirkels WJ, Jansen PP, Praag JO, et al. (2012) High-dose-rate brachytherapy and external-beam radiotherapy for hormone-naïve low- and intermediate-risk prostate cancer: a 7-year experience. Int J Radiat Oncol Biol Phys 83: 1480-1485. [crossref]
  • Agoston P, Major T, Fröhlich G, et al. (2011) Moderate dose escalation with single-fraction high-dose-rate brachytherapy boost for clinically localized intermediate- and high-risk prostate cancer: 5-year outcome of the first 100 consecutively treated patients. Brachytherapy 10: 376.
  • Ghadjar P, Keller T, Rentsch CA, Isaak B, Behrensmeier F, et al. (2009) Toxicity and early treatment outcomes in low- and intermediate-risk prostate cancer managed by high-dose-rate brachytherapy as a monotherapy. Brachytherapy 8: 45-51. [crossref]
  • Zwahlen DR, Andrianopoulos N, Matheson B, Duchesne GM, Millar JL (2010) High-dose-rate brachytherapy in combination with conformal external beam radiotherapy in the treatment of prostate cancer. Brachytherapy 9: 27-35. [crossref]
  • Viani GA, Pellizzon AC, Guimarães FS, Jacinto AA, dos Santos Novaes PE, et al. (2009) High dose rate and external beam radiotherapy in locally advanced prostate cancer. Am J Clin Oncol 32: 187-190. [crossref]
  • Aoki M, Miki K, Kido M, et al. (2014) Analysis of prognostic factors in localized high-risk prostate cancer patients treated with HDR brachytherapy, hypofractionated 3D-CRT and neoadjuvant/adjuvant androgen deprivation therapy (trimodality therapy). J Radiat Res 55: 527.
  • Martinez AA, Gonzalez J, Ye H, et al. (2011) Dose escalation improves cancer-related events at 10 years for intermediate- and high-risk prostate cancer patients treated with hypofractionated high-dose-rate boost and external beam radiotherapy. Int J Radiat Oncol Biol Phys 79: 363.
  • Shigehara K, Mizokami A, Komatsu K, Koshida K, Namiki M (2006) Four year clinical statistics of iridium-192 high dose rate brachytherapy. Int J Urol 13: 116-121. [crossref]
  • Smolska-Ciszewska B, Miszczyk L, Bialas B, et al. (2015) The effectiveness and side effects of conformal external beam radiotherapy combined with high-dose-rate brachytherapy boost compared to conformal external beam radiotherapy alone in patients with prostate cancer. Radiat Oncol 10: 366.
  • Kamrava M, Rwigema JC, Chung M, Banerjee R, Wang J, et al. (2013) Predictors of distant metastasis after combined HDR brachytherapy and external beam radiation for prostate cancer. J Contemp Brachytherapy 5: 127-133. [crossref]
  • Morris LM, Izard MA, Wan WY (2015) Does prostate-specific antigen nadir predict longer-term outcome es of prostate cancer after neoadjuvant and adjuvant androgen deprivation therapy in conjunction with brachytherapy? Brachytherapy 14: 322.outcome
  • Chen WC, Tokita KM, Ravera J, Fu P, Jiang Y, et al. (2013) Four-year outcomes of hypofractionated high-dose-rate prostate brachytherapy and external beam radiotherapy. Brachytherapy 12: 422-427. [crossref]
  • Pellizzon AC, Salvajoli J, Novaes P, et al. (2008) The relationship between the biochemical control outcomes and the quality of planning of high-dose rate brachytherapy as a boost to external beam radiotherapy for locally and locally advanced prostate cancer using the RTOG-ASTRO Phoenix definition. Int J Med Sci 5: 113.

Is Intravenous Iron Treatment a Risk for Infection?

DOI: 10.31038/IMROJ.2017214

Abstract

Background: Iron is a pro-oxidant and an essential nutrient for different bacteria. Experimental animal studies have demonstrated exacerbating sepsis episodes. Intravenous iron treatment has been implicated, at least theoretically in increasing infection episodes. However, these studies did not obtain any conclusion in this respect. Therefore, the aim of our study was to evaluate whether there is a risk between intravenous iron treatment and infection episodes following iron treatment.

Methods: In our study, 186 patients who received intravenous iron treatment were included. The biochemical parameters included “pre and post iron treatment” (e.g., ferritin, serum iron, transferring saturation, and hemoglobin) and the later emergence of infections. Moreover, we evaluated all possible risk factors that could interfere with the subsequence appearance of infection.

Results: Infectious complications were reported in 24 patients (12.8%) after the iron treatments began, and no infection was reported in 87.15% (n=162) of the patients. The most common infections were urinary (33%) and respiratory infections (25%). The most common infectious agents were enterobacteriae (e.g., E coli, E faecalis, and E faecium). Notably, we did not observe any intracellular pathogens. In our statistical survey, we did not find a relationship between infection onset and intravenous iron treatment. To analyze the baseline disease, comorbidities, such as diabetes and other treatment (e.g., corticosteroids or anti-TNF) were evaluated, and, no association was found.

Conclusion: In our study, intravenous iron was an effective treatment to correct anemia, and it did not appear to correlate with the development of secondary infections.

Key words

iron therapy; intravenous iron; iron infection

Abbreviations

IV – intravenous; HD – hemodialysis infection

Introduction

Iron is an important nutrient for many bacteria, and in laboratory animals, it was shown to exacerbate sepsis. [1] It has been postulated that increased plasma iron is responsible for the association of hemochromatosis with infections by Vibrio vulnificus, Yersinia enterocolitica, and Escherichia coli. [2] Accordingly, there are host defense mechanisms that tend to restrict the available iron from invading pathogens. [3] For example, the transferrin receptor is the major pathway for delivery of iron to peripheral tissues through endocytosis of its ligand, transferrin, which binds to iron and circulates in the plasma. Down regulation of the transferrin receptor limits the cell’s ability to acquire transferrin-bound iron and concomitantly reduces the endosomal pool of iron that can be accessed by intracellular pathogens, such as L. pneumophila, Mycobacterium tuberculosis, and Mycobacterium avium, and thus restricts their growth. [4, 5] Iron repletion with oral iron has been associated with adverse outcomes for certain infections. In a study of 137 iron-deficient Somali nomads, who were treated with placebo or oral iron (71 subjects), Murray et al. noted seven infection episodes in the placebo group and 36 in the oral iron group (including reactivation of preexisting malaria, brucellosis, and tuberculosis). [6] A large iron supplementation trial of young children on Pemba Island, was prematurely terminated as a result of an excess of serious adverse events (including deaths) in those receiving iron. [7] Ferric iron (Fe)–carbohydrate complexes are widely used for treating Fe deficiency in patients who are unable to meet their Fe requirements with oral supplements. [8] Intravenous (IV) Fe is generally well tolerated and effective in correcting Fe-deficient states. However, complexing Fe to carbohydrate polymers does not block its potent pro-oxidant effects; therefore, systemic free radical generation and, possibly, tissue damage may result. [9] On the other hand, excessive iron administration may lead to oversaturation of transferrin and the release of free, catalytically active iron into circulation (NTBI) [10] which could be readily utilized by bacteria, leading to their multiplication and the possibility of an overwhelming infection. [11, 12] The aim of the present work was to determine the short-term infection rate associated with IV iron treatment and the possible risk factors that can predict these infections in a contemporary patient cohort.

Material and methods

Patient enrollment A retrospective, longitudinal study was carried out at Marqués de Valdecilla University Hospital (Santander, Spain). The hospital records of patients who underwent ambulatory treatment with IV iron at the hospital day center between January 2011 and December 2012 were reviewed.

Patient parameter evaluation The medical records of these patients were searched after institutional review board approval was obtained for the following data fields: a) demographic features; b) principal diagnosis; c) comorbid factors, such as diabetes mellitus, arterial hypertension, and dislipemia; d) concomitant treatment as potential infection causes, such as corticosteroids, immunosuppresive therapy, and anti-TNF treatment; e) previous infection, and; f) laboratory data prior to and after IV iron treatment, such as hemoglobin concentration, mean cell hemoglobin (MCH), mean cell hemoglobin concentration (MCHC), red cell volume distribution width (RDW), serum iron, transferrin saturation, and serum ferritin.

Intravenous iron treatment One thusand mg (50 mg/ml) of ferric carboxymaltose was administered in an ambulatory regimen to the subjects at the hospital day center. The doses of this treatment were adapted subsequently according to the Ganzoni equation and their efficacy.

Case definitions We used a retrospective cohort design with a 1-month baseline period. After IV iron treatment was started, all of the patients were followed for 3 months. We looked for any infectious diseases, and we differentiated the subjects by bacterial, viral and fungal infections, as well as by gastrointestinal, genitourinary, respiratory and other diseases. If a single blood culture was positive for coagulase-negative staphylococci, Corynebacteria, or Bacillus sp., the culture was considered contaminated or representative of a transient bacteremia but not of a bacteremic episode. All other situations in patients in whom at least one blood culture was positive were defined as bacteremic episodes.

Statistical Analysis The results were analyzed with the SPSS 15.0 computer software package (Statistical Package for Social Sciences, Inc., Chicago. IL). Continuous variables were summarized as the means or as the medians and ranges. Categorical variables were compared with the chi-square and Fisher´s exact tests. Correlations between the data sets were examined using the Pearson (r) or Spearman rank (rs) correlation coefficients. Any differences were considered significant for all statistical tests at p values of less than 0.05.

Results

A total of 186 adult patients (70 men and 116 women; mean age, 63 yrs; range, 18 to 80 yrs) were enrolled. The principal diagnosis of the patients included in the study were cardiac diseases (n=41, 22%), neoplasm diseases (n=32, 17.2%), renal diseases (n=31, 16.7%), malnutrition due to bariatric surgery (n=19, 10.2%), hepatic diseases (n=15, 8.1%), and lung diseases (n=15, 8.1%) (Table 1). A comorbid condition known to increase the infection risk was found in 88 patients (47.3%), which included diabetes mellitus (n = 53), current malignancy (n = 32) (under treatment and/or not cured), being a transplant recipient (n= 3), and having both a malignancy and diabetes mellitus (n= 5). Twelve patients were treated with corticosteroids and six were treated with anti-TNF therapy. The pretreatment median hemoglobin level was 9.5 gr/dL (5.6- 12.6 gr/ dL) and after the treatment it was 11.8 gr/dL (7.4-14.1 gr/dL) (Table 2). Additionally, we found a statistically significant difference between the baseline biochemical iron metabolism parameters pre-and post IV iron treatment (Table 2). Thus, we corroborated that IV iron was an effective therapy in our patients.

Table 1. The principal diagnosis of the patients included in the study

Disease n (%)
Cardiac diseases 41 (22%)
Neoplasms diseases 32 (17.2%)
Kidney disease 31 (16.7%)
Bariatric surgery 19 (10.2%)
Liver diseases 15 (8.1%)
Lung diseases 15 (8.1%)
Others 33 (17.7%)

Table 2. The baseline laboratory iron metabolism parameters pre-and post-intravenous iron treatment

  Pre-treatment Post-treatment P
Hemoglobin (gr/dL) 9.5 (5.6-14.5) 11.8 (7.4- 14.10) <0.01
MCH (pg/RBC) 26.4 (8.6-37.5) 29.9 (21.8-37.4) <0.01
MCHC (gr/dL) 32.4 (28.6-35.3) 33.1 (25.5-35.3) <0.01
RDW (%) 18.9 (12.2-37.4) 21.4 (9-43.6) <0,01
Serum iron (mcg/dL) 25 (10-96) 69 (16-177) <0.541
Transferrin saturation (Fe/TIBC)% 7 (2-37) 23,5 (5-62) <0.01
Serum ferritin 54 (2-753) 408 (10-1492) <0.01

MCH – mean cell hemoglobin;
MCHC – mean cell hemoglobin concentration;
RDW – red cell volume distribution width.

No patients had more than one bacteremic episode within the month prior to treatment. Twenty-four patients (12.9%) suffered from one infection episode after the IV iron treatment, and 162 patients (87.1%) did not have any infection episodes. The majority of these infections were from bacterial microorganisms (75%, n=18) followed by unknown etiologies (16.7% n=4) and viral episodes (8.3%, n=2). There were no fungal infections. The urinary tract was involved in 33.3% of the cases (n=8); 25% of the cases involved therespiratory system (n=6), which was similar to the unknown focus case percentage; and 16.7% of the cases involved the gastrointestinal system (n=4). The infectious agent was unknown in 63.5% of the cases (n=15). The pathogens responsible for these episodes were E coli (16.7%, n=4) followed by E faecalis, E faecium, Lysteria and Proteus mirabilis, which all occurred in 4.2% of the cases (n=1). No intracellular microorganisms or non-capsulated bacteria were found in our series. Additionally, no serious diseases and no mortality cases were reported three months after the treatments began.

The main characteristics of the patients with and without infection episodes are shown in Table 3. More patients with an infection episode had a comorbidity (diabetes or malignancy) and ongoing immunosuppressive therapy than the patients without infections. However, this was not statistically significant. Furthermore, when we analyzed the relationship between infections with other comorbidities, such as diabetes, cancer, transplantation or treatments such as steroids or anti-TNF we did not find any association.

Table 3. Comorbidity incidences in the infection or no infection groups

  Infection No Infection p
Diabetes mellitus 8 (33.3%) 45 (28.3%) NS
Arterial hypertension 14 (58.3%) 65 (40.1%) NS
Dislipemia 5 (20.8%) 23 (14.2%) NS
Cardiac diseases 7 (29.2%) 34 (21%) NS
Renal diseases 7 (29.2%) 24 (14.8%) NS
Lung diseases 1 (4.2%) 14 (8.6%) NS
Liver diseases 1 (4.2%) 14 (8.5%) NS
Bariatric surgery 3 (12.5%) 16 (9.9%) NS
Neoplasm 7 (29.2%) 25 (15.4%) NS
Organ transplantation 0 (0%) 3 (1.9%) NS
Corticosteoids 3 (12.5%) 9 (5.6%) NS
Biologic therapy 1 (4.2%) 5 (3.1%) NS

NS – Non-Significant

Discussion

Almost all life forms require iron because of its involvement in basic cellular processes. Free iron was shown to potentiate bacterial growth in vitro. [13] In fact, during infections, pathogens use various means to acquire iron from their hosts, whereas hosts attempt to withhold it from pathogens. [14, 15] Iron therefore represents a point of conflict between the host and the pathogen, and an altered iron balance associated with poor outcomes in several infectious diseases, including malaria, [7] tuberculosis, [16] and HIV-1 infection. [17] Furthermore, certain bacterial species, including E. Coli, Klebsiella spp., and Salmonella spp., use unbound iron in the blood to enhance their growth. These organisms release siderophores, which are iron chelators, into the blood. Once these siderophores are released, bacteria can compete with proteins, such as transferrin for unbound iron in the serum. [18, 19] Staphylococcus aureus and Haemophilus influenzae do not possess siderophore; however, they do have transferrin receptors, which allow these bacteria to use iron for growth. [18] Vibrio vulnificus cannot grow if there is no iron available, and their virulence depends on the ability to obtain iron combined with transferrin. Hepcidin, which is produced during innate immune responses to infections, reduces the iron availability in the serum by inhibiting ferroportin function in macrophages and enterocytes and potentially limits extracellular pathogen growth therein. [20] Intravenous iron may also impair immune function and increase infection susceptibility. [21] Gupta et al. [22] found that exposure of mononuclear cells to IV iron agents induced significant intracellular oxidative stress and shortened CD4+ T lymphocyte survival. High doses of IV iron agents impaired the phagocytic activity and microbial killing capability of polymorphonuclear leukocytes [23-25]. Furthermore, in a recent in vitro study, iron sucrose led to impaired phagocytic function and increased polymorphonuclear leukocyte apoptosis. [26] However, the current evidence in clinical practice cannot determine whether iron supplementation increases the risk of infection or worsens outcomes due to infection. [27, 28] There is increasing data to suggest that infective and adverse-event risks may be related to the intensity and frequency of IV iron dosing. [29-31] Brookhart et al. [32] studied iron dosing patterns in a retrospective cohort of 117.050 prevalent hemodialysis (HD) patients and found that administration of large boluses of IV iron for repleting iron deficiency was associated with increased infection-related hospitalization or death compared with smaller doses of IV iron maintenance therapy. The risk of infection-related hospitalization was increased further in patients who experienced infections within the past month. Similarly, the DOPPS study showed a trend towards an increase infection.related mortality in prevalent HD patients treated with > 300 mg of IV iron. [33] A recent meta-analysis of randomized controlled trials evaluating IV iron use (often administered as frequent boluses) in patients with varying infective risk profiles found IV iron to be associated with a 30% greater risk of infection compared with oral or no iron therapy. [34] Conversely, a prospective observational study of 985 patients failed to demonstrate a relationship between infection and serum ferritin or IV iron dosing. [35] In our study, large IV iron boluses were an effective treatment for anemia that was caused by different etiologies, because hemoglobin increased at 2 or 3 points at the end of the treatment and we found any relationship between IV iron administration and infection, which was similar to the previously published data. Furthermore, in our study, transferrin saturation increased to 23.5%, thereby leaving little to no unbound iron available for bacterial utilization, as shown in previous in vitro studies. [10] For example, in the K. pneumonia case, bacterial suppression occurred throughout its incubation until the transferrin saturation exceeded 60%, at which time bacterial growth occurred. [19] Another in vitro study showed that the inhibition of Staphylococcus epidermidis growth was lost once the transferrin saturation exceeded 80%. [18] Subsequent studies had ambiguous results that left the relationship somewhat unclear. [36, 37] In a retrospective observational cohort study of 23.000 adult patients on HD hospitalized for bacterial infection, Ishida et al. found no association between iron treatment and readmission for infection. [38] Feldman’s group, in a re-analysis of their HD cohort using multivariable analysis, showed no statistically significant association between any level of iron administration and mortality. [39] Moreover, a French multicenter prospective study regarding bacteremia risk factors in HD patients (EPIBACDIAL) did not find any correlation between parenteral iron or ferritin and bacteremia. [40] Furthermore, in the Anker study, quality of life and functional status improved in heart failure (a relatively high-risk group) without an increase in infections [41].

Our study had limitations due to its retrospective nature. However, of the patients who were analyzed, we found a 12.8% infections after the beginning of iron therapy. Notably, an important difference in our study compared with the previously published studies was that we did not find any association between IV iron treatment and intracellular pathogens.

In conclusion, based on our study, iron treatment is safe and it does not associate with the development of new infections. However, the infection relationship is not clear and many studies are treating to investigate the different mechanisms regarding this issue. It is important to verify this result with other studies to improve the care and future treatment of patients because iron treatment is frequently used worldside. This knowledge can improve anemia management and avoid side effects. Thus, large multi-centered randomized controlled trials designed to evaluate both the short- and long-term safety of different IV iron dosing regimens are still required to determine the optimal iron therapy.

Conflict of interests

No conflict of interest exists and all authors had full access to all the data used in the study and take full responsibility for the decision to submit the manuscript for publication.

References

  • Guerinot ML (1994) Microbial iron transport. Annu Rev Microbiol 48: 743-772. [crossref]
  • Khan FA, Fisher MA, Khakoo RA (2007) Association of hemochromatosis with infectious diseases: expanding spectrum. Int J Infect Dis 11: 482-487. [crossref]
  • Wander K, Shell-Duncan B, McDade TW (2009) Evaluation of iron deficiency as a nutritional adaptation to infectious disease: an evolutionary medicine perspective. Am J Hum Biol 21:172-179.
  • Byrd TF, Horwitz MA (1989) Interferon gamma-activated human monocytes downregulate transferrin receptors and inhibit the intracellular multiplication of Legionella pneumophila by limiting the availability of iron. J Clin Invest 83:1457-1465.
  • Clemens DL, Horwitz MA (1996) The Mycobacterium tuberculosis phagosome interacts with early endosomes and is accessible to exogenously administered transferrin. J Exp Med 184:1349-1355.
  • Murray MJ, Murray AB, Murray MB, Murray CJ (1978) The adverse effect of iron repletion on the course of certain infections. Br Med J 2: 1113-1115. [crossref]
  • Sazawal S, Black RE, Ramsan M, Chwaya HM, Stoltzfus RJ, Dutta A, et al. (2006) Effects of routine prophylactic supplementation with iron and folic acid on admission to hospital and mortality in preschool children in a high malaria transmission setting: community-based, randomised, placebo-controlled trial. Lancet 367:133-1343.
  • Clinical practice guidelines and clinical practice recommendations for anemia in chronic kidney Disease in adults (2006) Am J Kid Dis 47 (5 suppl3): S16-S85.
  • Zager RA (2006) Parenteral iron compounds: potent oxidants but mainstays of anemia management in chronic renal disease. Clin J Am Soc Nephrol 1 Suppl 1: S24-31. [crossref]
  • Parkkinen J, von Bonsdorff L, Peltonen S, Grönhagen-Riska C, Rosenlöf K. (2000) Catalytically active iron and bacterial growth in serum of haemodialysis patients after i.v. iron-saccharate administration. Nephrol Dial Transplant 15: 1827-1834.
  • Slotki I (2005) Intravenous iron supplementation in the anaemia of renal and cardiac failure–a double-edged sword? Nephrol Dial Transplant 20 Suppl 7: vii16-23. [crossref]
  • Bullen JJ, Rogers HJ, Spalding PB, Ward CG (2005) Iron and infection: the heart of the matter. FEMS Immunol Med Microbiol 43: 325-330. [crossref]
  • Fishbane S (1999) Review of issues relating to iron and infection. Am J Kidney Dis 34: S47-52. [crossref]
  • Weinberg ED (1984) Iron withholding: a defense against infection and neoplasia. Physiol Rev 64: 65-102. [crossref]
  • Armitage AE, Eddowes LA, Gileadi U, Cole S, Spottiswoode N, et al. (2011) Hepcidin regulation by innate immune and infectious stimuli. Blood 118: 4129-4139. [crossref]
  • Boelaert JR, Vandecasteele SJ, Appelberg R, Gordeuk VR (2007) The effect of the host’s iron status on tuberculosis. J Infect Dis 195: 1745-1753. [crossref]
  • McDermid JM, Jaye A, Schim van der Loeff MF, Todd J, Bates C, Austin S, et al. (2007) Elevated iron status strongly predicts mortality in West African adults with HIV infection. J Acquir Immune Defic Syndr 46:498-507.
  • Brewster UC, Perazella MA (2004) Intravenous iron and the risk of infection in end-stage renal disease patients. Semin Dial 17: 57-60. [crossref]
  • Cieri E (1999) Does iron cause bacterial infections in patients with end stage renal disease? ANNA J 26: 591-596. [crossref]
  • Rivera S, Nemeth E, Gabayan V, Lopez MA, Farshidi D, Ganz T (2005) Synthetic hepcidin causes rapid dose-dependent hypoferremia and is concentratedin ferroportin-containing organs. Blood 106:2196-2199.
  • Ishida JH, Johansen KL (2014) Iron and infection in hemodialysis patients. Semin Dial 27: 26-36. [crossref]
  • Gupta A, Zhuo J, Zha J, Reddy S, Olp J, Pai A (2010) Effect of different intravenous iron preparations on lymphocyte intracellular reactive oxygen species generation and subpopulation survival. BMC Nephrol 11:16.
  • Brewster UC (2006) Intravenous iron therapy in end-stage renal disease. Semin Dial 19: 285-290. [crossref]
  • Deicher R, Ziai F, Cohen G, Müllner M, Hörl WH (2003) High dose parenteral iron sucrose depresses neutrophil intracellular killing capacity. Kidney Int 64:728-736.
  • van Asbeck BS, Marx JJ, Struyvenberg A, Verhoef J (1984) Functional defects in phagocytic cells from patients with iron overload. J Infect 8: 232-240. [crossref]
  • Ichii H, Masuda Y, Hassanzadeh T, Saffarian M, Gollapudi S, Vaziri ND (2012) Iron sucrose impairs phagocytic function and promotes apoptosis in polymorphonuclear leukocytes. Am J Nephrol 36: 50-57.
  • Kliger AS, Foley RN, Goldfarb DS, Goldstein SL, Johansen K, et al. (2013) KDOQI US commentary on the 2012 KDIGO Clinical Practice Guideline for Anemia in CKD. Am J Kidney Dis 62: 849-859. [crossref]
  • Shah A, Roy NB2, McKechnie S3, Doree C4, Fisher SA4, et al. (2016) Iron supplementation to treat anaemia in adult critical care patients: a systematic review and meta-analysis. Crit Care 20: 306. [crossref]
  • Feldman HI, Santanna J, Guo W, Furst H, Franklin E, et al. (2002) Iron administration and clinical outcomes in hemodialysis patients. J Am Soc Nephrol 13: 734-744. [crossref]
  • Freburger JK, Ellis AR, Kshirsagar AV, Wang L, Brookhart MA (2014) Comparative short-term safety of bolus versus maintenance iron dosing in hemodialysis patients: a replication study. BMC Nephrol 15:154.
  • Agarwal R, Kusek JW, Pappas MK (2015) A randomized trial of intravenous and oral iron in chronic kidney disease. Kidney Int 88: 905-914. [crossref]
  • Brookhart MA, Freburger JK, Ellis AR, Wang L, Winkelmayer WC, et al. (2013) Infection risk with bolus versus maintenance iron supplementation in hemodialysis patients. J Am Soc Nephrol 24: 1151-1158. [crossref]
  • Bailie GR, Larkina M, Goodkin DA, Li Y, Pisoni RL, Bieber B, et al. (2015) Data from the Dialysis Outcomes and Practice Patterns Study validate an association between high intravenous iron doses and mortality. Kidney Int 87: 162-168.
  • Litton E, Xiao J, Ho KM (2013) Safety and efficacy of intravenous iron therapy in reducing requirement for allogeneic blood transfusion: systematic review and meta-analysis of randomized clinical trials. BMJ 347: f4822.
  • Hoen B, Paul-Dauphin A, Hestin D, Kessler M (2002) Intravenous iron administration does not significantly increase the risk of bacteriemia in chronic hemodialysis patients. Clin Nephrol 57:457-461.
  • Bansal A, Sandhu G, Gupta I, Kalahalli S, Nayak R, Zouain E, et al. (2014) Effect of aggressively driven intravenous iron therapy on infectious complications in end-stage renal disease patients on maintenance hemodialysis. Am J Ther 21:250-253.
  • Miskulin DC, Tangri N, Bandeen-Roche K, Zhou J, McDermott A, et al. (2014) Intravenous iron exposure and mortality in patients on hemodialysis. Clin J Am Soc Nephrol 9: 1930-1939. [crossref]
  • Ishida JH, Marafino BJ, McCulloch CE, Dalrymple LS, Dudley RA, et al. (2015) Receipt of Intravenous Iron and Clinical Outcomes among Hemodialysis Patients Hospitalized for Infection. Clin J Am Soc Nephrol 10: 1799-1805. [crossref]
  • Feldman HI, Joffe M, Robinson B, Knauss J, Cizman B, et al. (2004) Administration of parenteral iron and mortality among hemodialysis patients. J Am Soc Nephrol 15: 1623-1632. [crossref]
  • Hoen B, Paul-Dauphin A, Hestin D, Kessler M (1998) EPIBACDIAL: a multicenter prospective study of risk factors for bacteremia in chronic hemodialysis patients. J Am Soc Nephrol 9: 869-876. [crossref]
  • Anker SD, Comin Colet J, Filippatos G, Willenheimer R, Dickstein K, et al. (2009) Ferric carboxymaltose in patients with heart failure and iron deficiency. N Engl J Med 361: 2436-2448. [crossref]